Article

Viscoelectric and Steric Effects on Electroosmotic Flow in a Soft Channel

1
Departamento de Termofluidos, SEPI-ESIME Unidad Azcapotzalco, Instituto Politécnico Nacional, Ciudad de México 02250, Mexico
2
Programa Educativo de Química, Universidad Tecnológica de Tula-Tepeji, Tula de Allende, Hidalgo 42830, Mexico
3
Department of Chemical and Food Engineering, Universidad de los Andes, Bogotá 111711, Colombia
*
Author to whom correspondence should be addressed.
Mathematics 2025, 13(16), 2546; https://doi.org/10.3390/math13162546
Submission received: 31 May 2025 / Revised: 7 August 2025 / Accepted: 7 August 2025 / Published: 8 August 2025
(This article belongs to the Special Issue Advances and Applications in Computational Fluid Dynamics)

Abstract

The present work analyzes the combined viscoelectric and steric effects on electroosmotic flow in a soft channel with polyelectrolyte coating. The structured channel surface, which controls the electric potential, creates two different flow regions: the electrolyte flow within the permeable polyelectrolyte layer (PEL) and the bulk electrolyte. Thus, this study discusses the interaction of various electrostatic effects to predict the electroosmotic flow field. The nonlinear governing equations describing the fluid flow are the modified Poisson–Boltzmann equation for the electric potential distribution, the mass conservation equation, and the modified Navier–Stokes equations for the flow field, which are solved numerically using a one-dimensional (1D) scheme. The results indicate that the flow enhances when increasing the electric potential magnitude across the channel cross-section via the rise in different dimensionless parameters, such as the PEL thickness, the steric factor, and the ratio of the electrokinetic parameter of the PEL to that of the electrolyte layer. This research demonstrates that the PEL significantly enhances control over electroosmotic flow. However, it is crucial to consider that viscoelectric effects at high electric fields and the friction generated by the grafted polymer brushes of the PEL can reduce these benefits.

1. Introduction

Electroosmotic flow, which involves applying an electric field to an electrolytic solution in a tangential direction to a charged surface, is an electrokinetic transport method to pump liquids at the micro/nanoscale [1]. The scientific community studies this pumping mechanism widely due to its adaptability to small-scale devices that do not require mechanical or moving parts, such as lab-on-a-chip devices and micro electro-mechanical systems (MEMSs) [2,3]. This electrokinetic phenomenon depends on the formation of an electric double layer (EDL) near a charged solid–liquid interface to control the flow [4]. Currently, electroosmotic pumping applications involve chemical analysis [5], biological sample-based diagnosis [6], drug delivery [7], cell analysis [8], cooling [9], and characterization of materials [10], among others.
The electroosmotic phenomenon is studied considering different aspects such as external electric field strength [11], surface potential [12], external time-dependent electric field [13], temperature-dependent properties [14], self-assembled monolayers [15], ionic concentration gradients [16], ionic size [17], traveling-wave field-effect [18], slip boundary conditions [19], and others. In fluid transport tasks through electroosmotic effects, the flow velocity depends on the applied electric field; however, increasing the electric field can lead to Joule heating effects that impair the physicochemical properties of the samples, induce dispersive effects, and generate gas bubbles, among other adverse effects [20]. Another practical way to increase the flow rate is to impose high wall zeta potentials, although, in many cases, the properties of the channel material do not meet the device design objectives [21]. In other cases, ionic concentration gradients [16] and traveling-wave field effects [18] are more effective in controlling electroosmotic flow in simultaneous pumping and mixing tasks. With this in mind, the scientific community conducts studies that report the benefits small-scale devices bring to science in various tasks and applications, as well as their advantages and disadvantages.
To extend research on controlling electroosmotic flow, it is possible to consider the alteration of the channel surface using polyelectrolyte coatings to achieve the desired flow characteristics [21,22]. A polyelectrolyte layer (PEL) is formed by grafting polymer brushes containing fixed charge groups to the channel wall, thus altering fluid flow; here, the brushes, also known as polyelectrolyte (PE) brushes, are formed when polymer chains are densely grafted to the channel surface [23]. Matin and Ohshima [24] have studied the thermal transport characteristics of an electrolyte solution flowing through a slit nanochannel with polyelectrolyte walls, considering that the PEL–electrolyte interface acts as a semi-penetrable membrane because the electrolyte ions can be present inside and outside the PEL. Chen and Das [25] have developed a theory to study the electroosmotic transport in a polyelectrolyte-grafted (or soft) nanochannel with pH-dependent charge density. Kaushik et al. [26] have investigated the electroosmotic flow in a polyelectrolyte-grafted rotating narrow fluidic channel, showing that the transverse electrostatic potential increases with the increase in the PEL thickness, altering the flow dynamics. Talebi et al. [27] have studied the hydrodynamic dispersion by fully developed electroosmotic flow in soft microchannels of dense PEL, obtaining analytical and numerical solutions for the electric potential and velocity distributions. Furthermore, Gaikwad et al. [28] have analyzed the electroosmotic flow of a power-law fluid in a square channel grafted with a PEL, highlighting the interaction between the non-Newtonian rheology and the interfacial electrochemistry affected by the PEL on the walls to describe the flow behavior.
The electroosmotic flow control method must also consider steric and viscoelectric electrostatic effects by imposing high surface potentials [29,30,31,32]. Ions become crowded near the surface (even if the bulk solution is dilute) in response to the application of high voltages at the channel walls and do not follow the classical Poisson–Boltzmann distribution in the EDL [33]. Furthermore, if the bulk solution contains high ionic concentrations, significant errors can occur in predicting the electric potential distribution within the EDL [29]. Therefore, it is essential to consider the effects of excluded volume due to the ion sizes, which is also known as the steric factor [34,35]. Thus, the scientific community utilizes the modified Poisson–Boltzmann equation to determine the influence of the steric effect on electroosmotic flows [29,36,37,38]. Regarding studies of the steric effect in soft channels coated with polyelectrolyte layers, Liu and Jian [30] have numerically investigated the combined effects of finite ionic size and slip condition on the entropy generation in a mixed electroosmotic-pressure-driven flow in a soft nanochannel. Zheng et al. [39] have analyzed the steric effects on electroosmotic thrusters in soft nanochannels covered with polyelectrolyte materials, determining that the size effect of the ionic species has a vital influence on the electrostatic potential and electroosmotic velocity. Another electrostatic effect caused by high electric potentials in the electric double layers (EDLs) is the viscoelectric effect, which alters the viscosity near the channel walls by the polarization of water molecules near a charged surface [40,41]. These alterations are described by the viscoelectric model proposed by Overbeek and Lyklema [35,42], which makes viscosity a function of the electric field. This model is used in several investigations on electroosmotic flows to predict flow behavior [31,32,37,41,43,44], revealing a decrease in velocity and flow rate due to the increase in viscosity resulting from this field effect. However, there is currently a lack of studies on electroosmotic flows in soft channels coated with a PEL that involves the viscoelectric effect. Thus, with this research gap, electrokinetic transport applications of small-scale devices in emerging areas of biochemical processes [45], ionic sensors [46], biosensors [47], and drug delivery devices [48] can benefit from this type of study by incorporating combined steric and viscoelectric effects and coated channel theory into the prediction of electroosmotic flow by considering high electric potentials and high ionic strengths.
Therefore, the present study aims to theoretically investigate the combined viscoelectric and steric effects on electroosmotic flow in a polyelectrolyte-coated channel, which requires considering the influence of the PEL thickness and the drag parameter generated by the porous matrix of the PEL on the flow characteristics. To the best of our knowledge, such a combination of electrostatic and physical phenomena in soft channels has not been reported at the time of publication. The mathematical model, based mainly on the modified Poisson–Boltzmann and Navier–Stokes nonlinear equations, is solved numerically by the commercial software COMSOL Multiphysics 6.1. This work seeks to enhance the understanding of controlling electroosmotic flow from the high surface potentials produced by the presence of the PEL, elucidating some of its advantages and disadvantages on the flow.

2. Problem Formulation

2.1. Physical Model

The present study investigates the electroosmotic flow of an incompressible Newtonian fluid in a soft parallel plate channel whose walls are coated 7 with a PEL. Figure 1 shows the Cartesian coordinate system ( x , y ) and the channel geometry, where the distance between the top and bottom plates is 2 H , and the thickness of the permeable PEL is d. Moreover, the study analysis focuses on a central region sufficiently distant from the inlet and outlet boundaries, assuming the channel is very long. The channel contains a symmetric ( z + : z ) electrolyte, and the ionization of polyelectrolyte molecules results in the fixed positive ionic charge of the PEL. The electrolyte ions are located both inside and outside the permeable PEL. On the other hand, a pair of electrodes at the lateral ends of the channel generates an electric field E x that affects the free charges in the EDLs (formed by the interaction of the electrolyte ions and the PEL), inducing fluid motion. In this sense, the EDL thickness of the electrolyte in contact with the PEL is κ 1 , while the equivalent EDL thickness of the PEL is κ P E L 1 ; both lengths, also known as Debye lengths, determine the electric potential distribution in both regions. Because the control of the surface potential by the presence of the PEL exceeds 25 mV, the fluid viscosity will be affected by the electric field induced within the EDL when the so-called viscoelectric effect arises. Likewise, the velocity field must also consider the ionic size of the electrolyte charges through the steric effect resulting from the high surface potentials and the high electrolyte concentrations.

2.2. Governing Equations

Because the electrolyte solution invades the entire channel, both inside and outside the PEL, the mass conservation equation for both regions is
· v = 0 ,
where v is the velocity vector. However, the hydrodynamics of the present flow phenomenon must consider the effect of the PEL. Therefore, the governing equations for the PEL are somewhat different from the classical problems of electroosmotic flows in rigid channels (uncoated). Under the assumption of ionic equilibrium conditions, the Poisson equations to determine the electric potential distribution within the EDL [23,49] and the modified Navier–Stokes momentum equations for a steady flow [50] for both fluid regions are as follows. For the electrolyte layer,
2 ψ = ρ e ε
and
ρ v · v = p + · η v + F ,
while for the PEL,
2 ψ = ρ e + ρ P E L ε
and
ρ v · v = p + · η v + F k v ,
where in Equations (2)–(5), ψ is the electric potential within the EDL, ρ e = e z n + n is the volumetric free charge density, e is the elementary charge, z is the absolute value of the valency of a symmetric ( z + : z ) electrolyte, n + and n are the number concentrations of positive and negative ions, ε is the dielectric permittivity, ρ is the fluid density, p is the pressure, η is the dynamic viscosity, F = ρ e E is the electroosmotic body force, E is the electric field vector, ρ P E L = Z e N is the volumetric charge density of the PEL fixed ions, Z is a positive valence, N is the ionic number concentration, and k is the friction coefficient. In Equation (4), the Poisson equation incorporates the polyelectrolyte ions, modifying the distribution and magnitude of the electric potential. In Equation (5), the presence of the porous matrix within the PEL generates an additional friction force, also known as the Darcy drag force. Furthermore, the ions within the PEL do not contribute to flow motion since they are immobile on the brushes of the polyelectrolyte coating; therefore, the body force in Equation (5) only includes the free charge density of the electrolyte ions. Complementary, in the mean-field description of steric effects in equilibrium, for a symmetric electrolyte, the modified Boltzmann distribution can be considered as [33,51]:
n ± = n 0 1 + 2 ν cosh z e ψ k B T 1 exp z e ψ k B T ,
where n 0 is the ionic number concentration in the bulk solution, ν = 2 a 3 n 0 is the steric factor, a is the effective ionic size, k B is the Boltzmann constant, and T is the temperature. Also, variations in fluid viscosity near the channel walls occur because the electric field within the EDL increases the degree of polarization of the water molecules [35,40]. These variations are taken into account by the viscoelectric effect, which describes the solvent viscosity as a function of the electric field [31,40,41]:
η = η 0 1 + f E EDL 2 ,
where η 0 is the viscosity in the absence of an electric field, f is the viscoelectric coefficient, and E EDL is the local electric field within the EDL.
The flow field results in a unidirectional flow on the x axis by assuming the following: (i) the flow is creeping and fully developed [27,30,51,52,53], (ii) the model neglects the effects of a pressure gradient, (iii) the channel length is much greater than the separation between the top and bottom plates of the channel [28], (iv) the physical properties are constant, except viscosity, and (vi) the EDLs do not overlap towards the center of the channel [28,52]. Therefore, by substituting Equations (6) and (7) into Equations (2)–(5), also by considering the assumptions mentioned above and that the flow phenomenon is symmetrical about y = 0 , the simplified Poisson–Boltzmann and momentum equations are formulated for both fluid regions in the upper half of the channel as follows. For the electrolyte layer at 0 < y < ( H d ) ,
2 ψ y 2 = 2 z e n 0 ε sinh z e ψ k B T 1 + 2 ν cosh z e ψ k B T 1
and
y η 0 1 + f ψ y 2 u y 2 z e n 0 sinh z e ψ k B T 1 + 2 ν cosh z e ψ k B T 1 E x = 0 ,
while for the PEL at ( H d ) < y < H ,
2 ψ y 2 = 2 z e n 0 ε sinh z e ψ k B T 1 + 2 ν cosh z e ψ k B T 1 Z e N ε
and
y η 0 1 + f ψ y 2 u y 2 z e n 0 sinh z e ψ k B T 1 + 2 ν cosh z e ψ k B T 1 E x k u = 0 ,
where in Equations (9) and (11), u represents the axial velocity at the channel cross-section. To solve Equations (8)–(11), the following boundary conditions are required. First, the boundary conditions on the top wall channel at y = H are the zero surface charge density (or electroneutrality) and no-slip, respectively, as:
d ψ d y y = H = 0 , u y = H = 0 .
Second, the boundary conditions matching between the electrolyte (EL) layer and the PEL at y = ( H d ) are:
ψ y = H d E L = ψ y = H d P E L , ε d ψ d y y = H d E L = ε d ψ d y y = H d P E L , u y = H d E L = u y = H d P E L , η d u d y y = H d E L = η d u d y y = H d P E L .
In Equation (13), the boundary conditions correspond to the continuity of the electric potential, the electric displacement, the velocity continuity, and the balance of stresses, respectively. And third, the symmetry conditions of the electric potential and the velocity at the center of the channel at y = 0 are established as:
d ψ d y y = 0 = 0 , d u d y y = 0 = 0 .

2.3. Dimensionless Mathematical Model

By taking into account the following dimensionless variables listed below,
y ¯ = y H , ψ ¯ = z e ψ k B T , u ¯ = u u c ,
where u c = ε k B T E x / z e η 0 [23,27,30], Equations (8)–(11) are rewritten as follows. First, for the electrolyte layer at 0 < y ¯ < ( 1 d ¯ ) , the simplified Poisson–Boltzmann and momentum equations in dimensionless form are:
2 ψ ¯ y ¯ 2 = κ ¯ 2 sinh ψ ¯ 1 + 2 ν cosh ψ ¯ 1
and
y ¯ u ¯ y ¯ + f ¯ κ ¯ 2 ψ ¯ y ¯ 2 u ¯ y ¯ + κ ¯ 2 sinh ψ ¯ 1 + 2 ν cosh ψ ¯ 1 = 0 ,
second, for the PEL at ( 1 d ¯ ) < y ¯ < 1 , respectively, yields:
2 ψ ¯ y ¯ 2 = κ ¯ 2 sinh ψ ¯ 1 + 2 ν cosh ψ ¯ 1 κ ¯ P E L 2 sgn ( Z )
and
y ¯ u ¯ y ¯ + f ¯ κ ¯ 2 ψ ¯ y ¯ 2 u ¯ y ¯ + κ ¯ 2 sinh ψ ¯ 1 + 2 ν cosh ψ ¯ 1 α 2 u ¯ = 0 ,
where to explore the influence of the change in polarity of the fixed ionic charges of the PELs on the flow hydrodynamics, Equation (18) considers the function sgn ( Z ) = 1 for Z > 0 and sgn ( Z ) = 1 for Z < 0 [54,55]. Furthermore, in Equations (16)–(19), the following dimensionless parameters arise:
κ ¯ = H κ 1 , f ¯ = f k B T z e κ 1 2 , κ ¯ P E L = H κ P E L 1 , α = H k η 0 , d ¯ = d H ,
where κ ¯ is the ratio between half the channel height and the Debye length of the EDL of the electrolyte, also known as the electrokinetic parameter of the electrolyte; f ¯ is the dimensionless viscoelectric coefficient; κ ¯ P E L is the ratio between half the channel height and the equivalent Debye length of the PEL, also known as the electrokinetic parameter of the PEL; α is the drag parameter; and d ¯ is the dimensionless thickness of the PEL. Also, κ 1 = ( ε k B T ) / ( 2 e 2 z 2 n 0 ) 1 / 2 represents the Debye length in the electrolyte layer, and κ P E L 1 = ( ε k B T ) / ( z e 2 | Z | N ) 1 / 2 represents the equivalent Debye length in the PEL [28,49,54,55].
On the other hand, by replacing Equation (15) into Equations (12)–(14), the corresponding boundary conditions for solving Equations (16)–(19) are obtained in dimensionless form as follows. For the top channel wall at y ¯ = 1 :
d ψ ¯ d y ¯ y ¯ = 1 = 0 , u ¯ y ¯ = 1 = 0 .
For the matching boundary conditions between the electrolyte and the PEL at y ¯ = ( 1 d ¯ ) :
ψ ¯ y ¯ = 1 d ¯ E L = ψ ¯ y ¯ = 1 d ¯ P E L , d ψ ¯ d y ¯ y ¯ = 1 d ¯ E L = d ψ ¯ d y ¯ y ¯ = 1 d ¯ P E L , u ¯ y ¯ = 1 d ¯ E L = u ¯ y ¯ = 1 d ¯ P E L , d u ¯ d y ¯ y ¯ = 1 d ¯ E L = d u ¯ d y ¯ y ¯ = 1 d ¯ P E L .
And for the symmetry boundary conditions at the center of the channel at y ¯ = 0 ,
d ψ ¯ d y ¯ y ¯ = 0 = 0 , d u ¯ d y ¯ y ¯ = 0 = 0 .

3. Solution Methodology

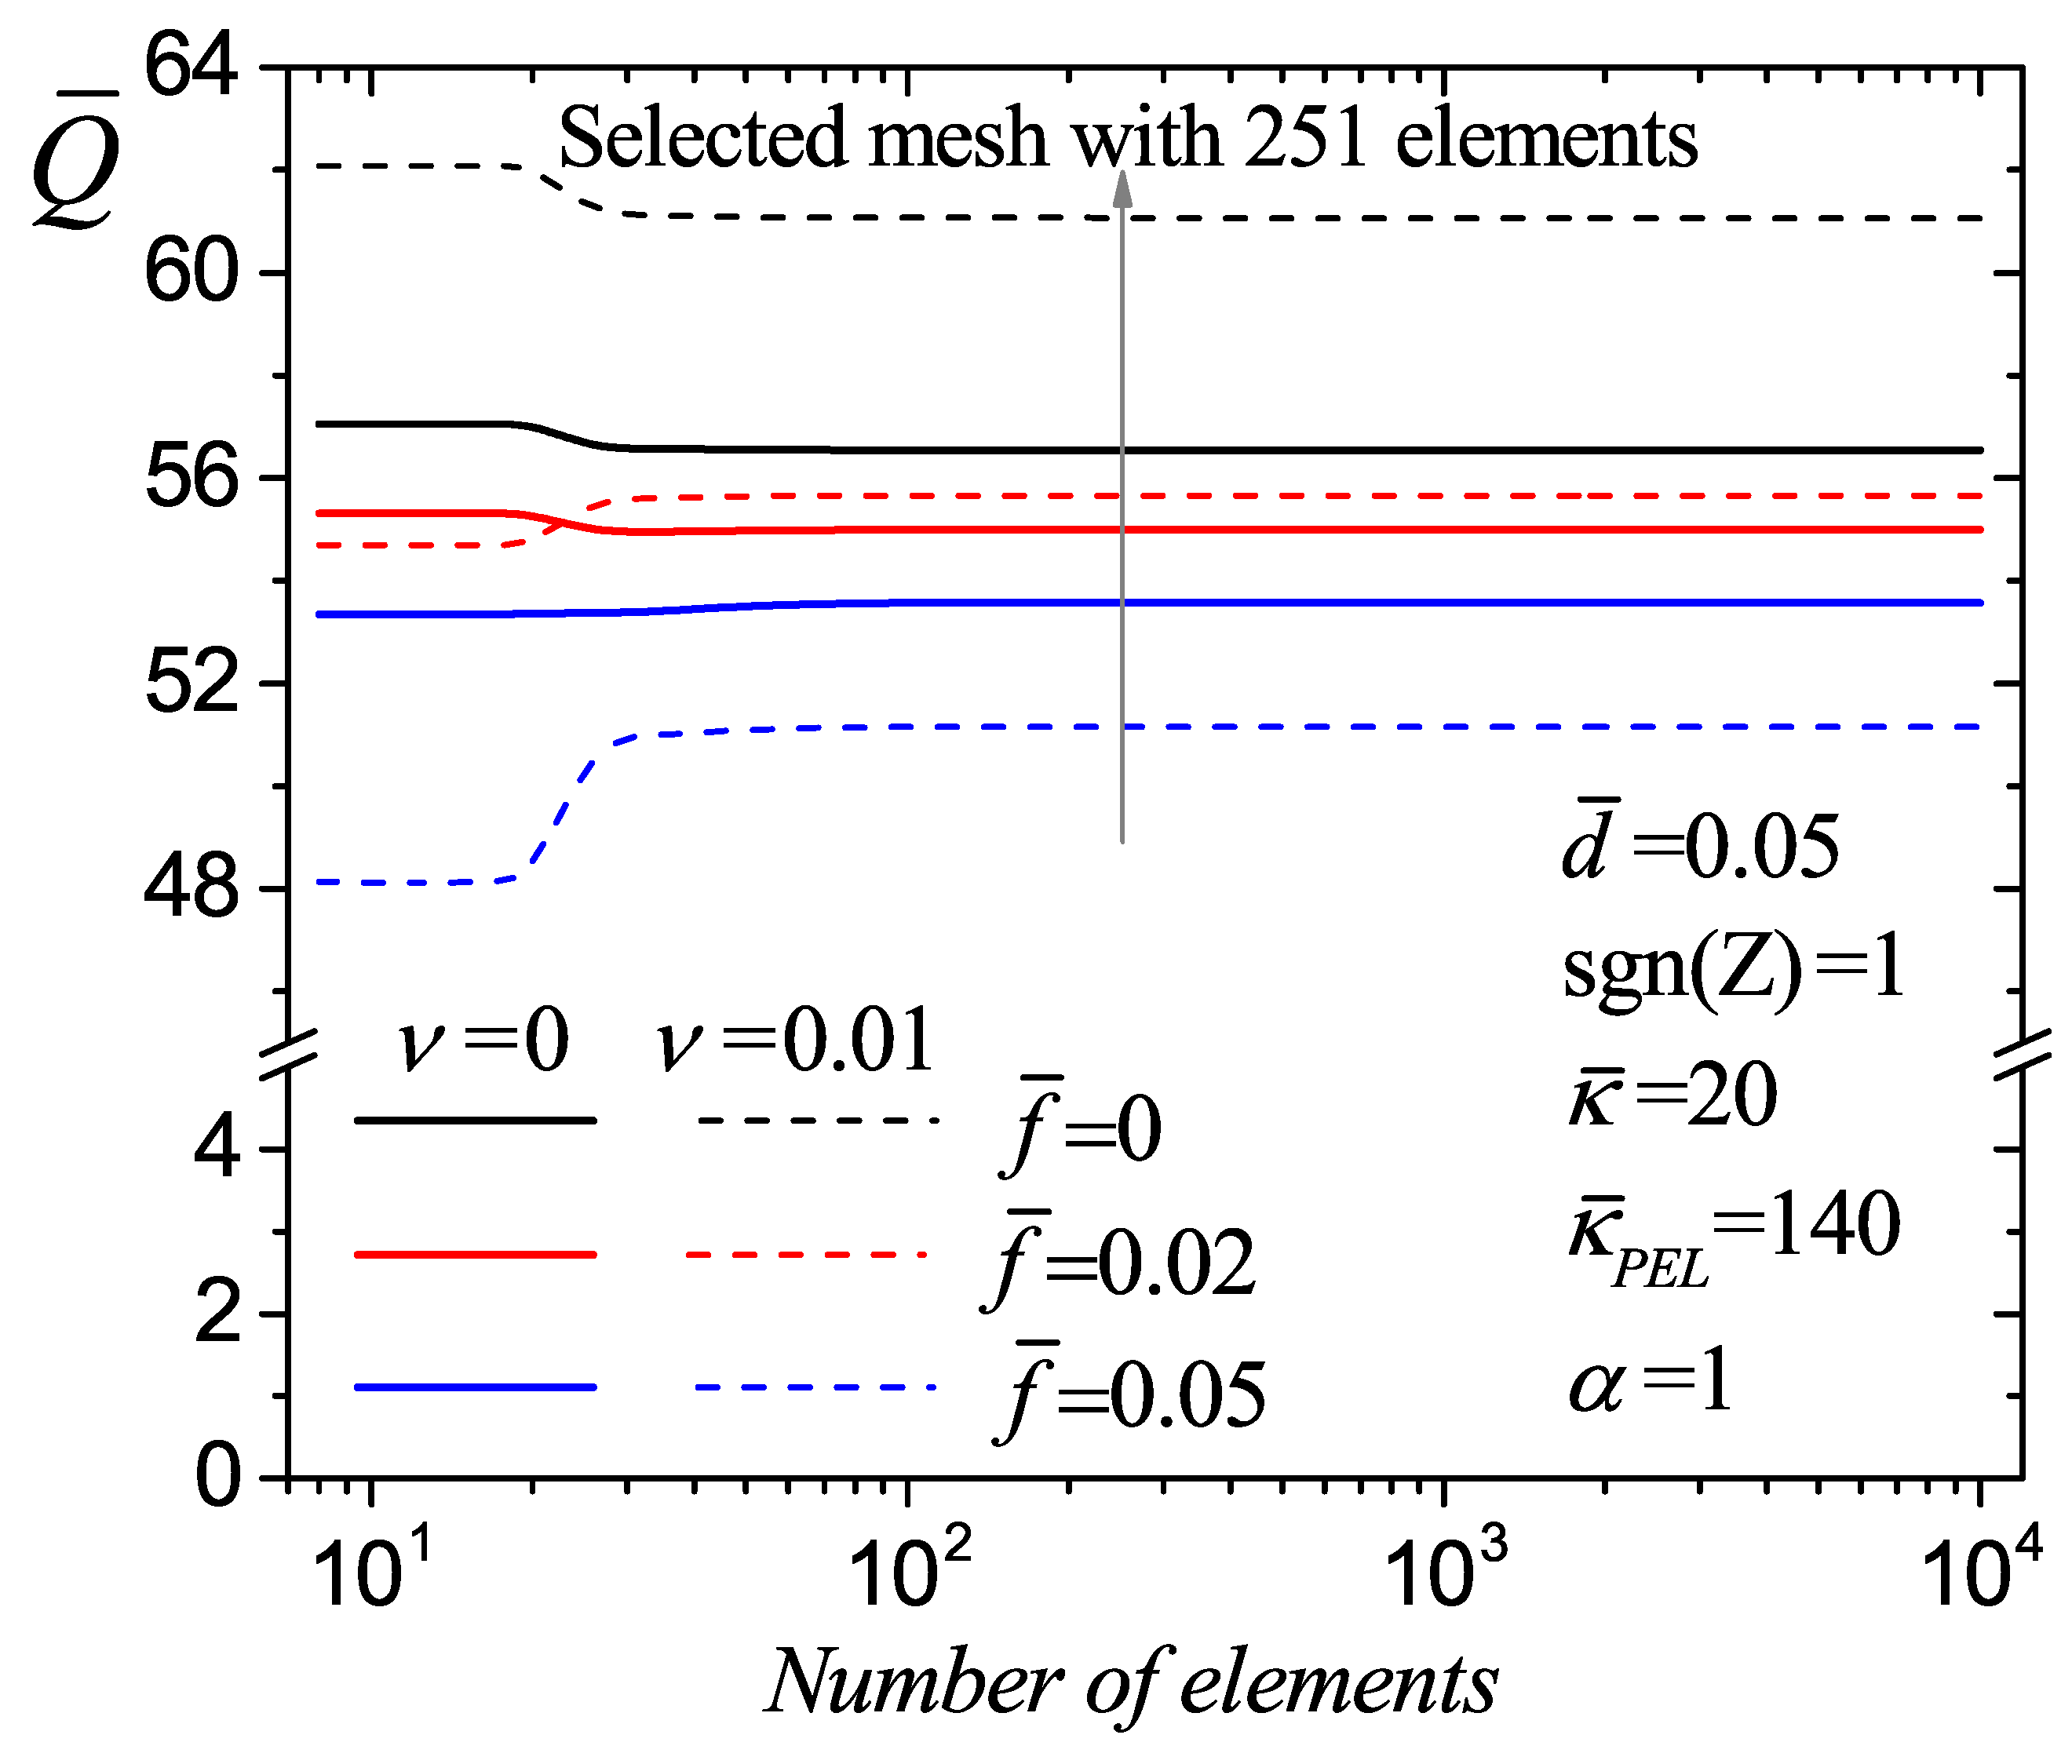
The governing Equations (16)–(19), are nonlinear and do not have an analytical solution; therefore, they are solved numerically in 1D, along with the boundary conditions (21)–(23), using the finite element method through the commercial software COMSOL Multiphysics 6.1, specifically in the Mathematics module, employing the Coefficient Form PDE Interfaces. A fully coupled stationary solver is employed, using the PARDISO direct solver with automatic damping settings to ensure robust convergence. The evaluation employs a uniform element size across the domain, as numerical tests confirm that this configuration accurately captures the main physical effects, including those near the boundaries. In addition, the simulations use quadratic Lagrange finite element discretizations for all dependent variables. Based on the results of this study, excessively steep gradients do not occur near the wall; therefore, numerical stabilization methods are unnecessary. Furthermore, the present work develops a mesh-independence study to ensure the reliability of numerical results, modeling an electroosmotic flow with the parameters presented in Figure 2. Here, the dimensionless flow rate per unit width of the channel results from integrating the velocity across the entire cross-section of the channel Q ¯ = 2 y ¯ = 0 y ¯ = 1 u ¯ d y ¯ , considering different values of the steric factor and the viscoelectric coefficient. Where Q ¯ = Q / Q c , Q is the flow rate per unit width of the channel, and the characteristic flow rate is Q c = u c H . The results are obtained by refining the channel study domain from 8 to 10,000 elements. For element sizes smaller than or equal to 0.004 , corresponding to 251 elements, the computed flow rate remains effectively unchanged since the approximate relative error ε a , i = | ( Q ¯ i Q ¯ j ) / Q ¯ i | · 100 % ε s , indicating a mesh convergence, where Q ¯ i and Q ¯ j are the current and previous values of the flow rate Q ¯ in a mesh with a specific number of elements, and ε s = 0.001 % is the convergence rate. Therefore, this number of elements is selected as the optimal mesh size, as it provides a good balance between numerical precision and computational efficiency. Table 1 presents a summary of the flow rate values Q ¯ and approximate relative errors ε a , i , for different numbers of elements, considering two representative cases from Figure 2, which supports the selection of the mesh based on the adopted convergence criterion. Finally, this study establishes a relative tolerance criterion of 10 9 for the convergence of software iterations, ensuring high computational accuracy.

4. Results and Discussion

This section reports the numerical solution results of the electroosmotic flow derived from steady-state conditions and driven by a constant direct current (DC) electric field. As such, transient phenomena, including start-up dynamics and pulsed electric fields, are not considered within the scope of the present model. The following practical ranges of the physical parameters are taken into consideration: 0.05 H 10 μ m [27,50,53,56]; 0 < d 198 nm [21,27,55]; η 0 = 10 3 Pa s; 10 17 f 10 15 m2 V−2 [31,35,41]; 0 a 7 nm [33]; 10 22 n 0 10 24 m−3; z + = z = z = 1 ; 1 κ 1 300 nm [4,27,53,55,56], approximately for 6.022 × 10 20 n 0 6.022 × 10 25 m−2 (or 10 6 M 10 1 mol L−1), respectively; 2.4 × 10 23 N 1.20 × 10 26 m−3 [21,55,57]; Z = ± 1 [54,55]; 3.30 × 10 11 k 2.87 × 10 17 Pa s m−2 (based in the square root of ratio of viscosity and friction coefficient 0.059 ( η 0 / k ) 1 / 2 55 nm [21,27] and by considering equal viscosities for the PEL and the electrolyte layer); T = 298.15 K; k B = 1.381 × 10 23 K J−1, e = 1.602 × 10 19 C; E x 300 V m−1 [27,53,56]; and ε = 6.95 × 10 10 C V−1 m−1. Here, for a symmetric electrolyte, n 0 = ( 3.04 × 10 10 ) / ( z M ) [4]. Thus, by appropriately combining the physical parameters, the ranges of the dimensionless parameters derived from the mathematical model that governs the flow can be estimated for this work as follows: 0 < d ¯ 0.2 , 5 κ ¯ 500 , 5 κ ¯ P E L 450 , 0 α 500 , 0 ν 0.01 , and 0 f ¯ 0.05 .

4.1. Validation

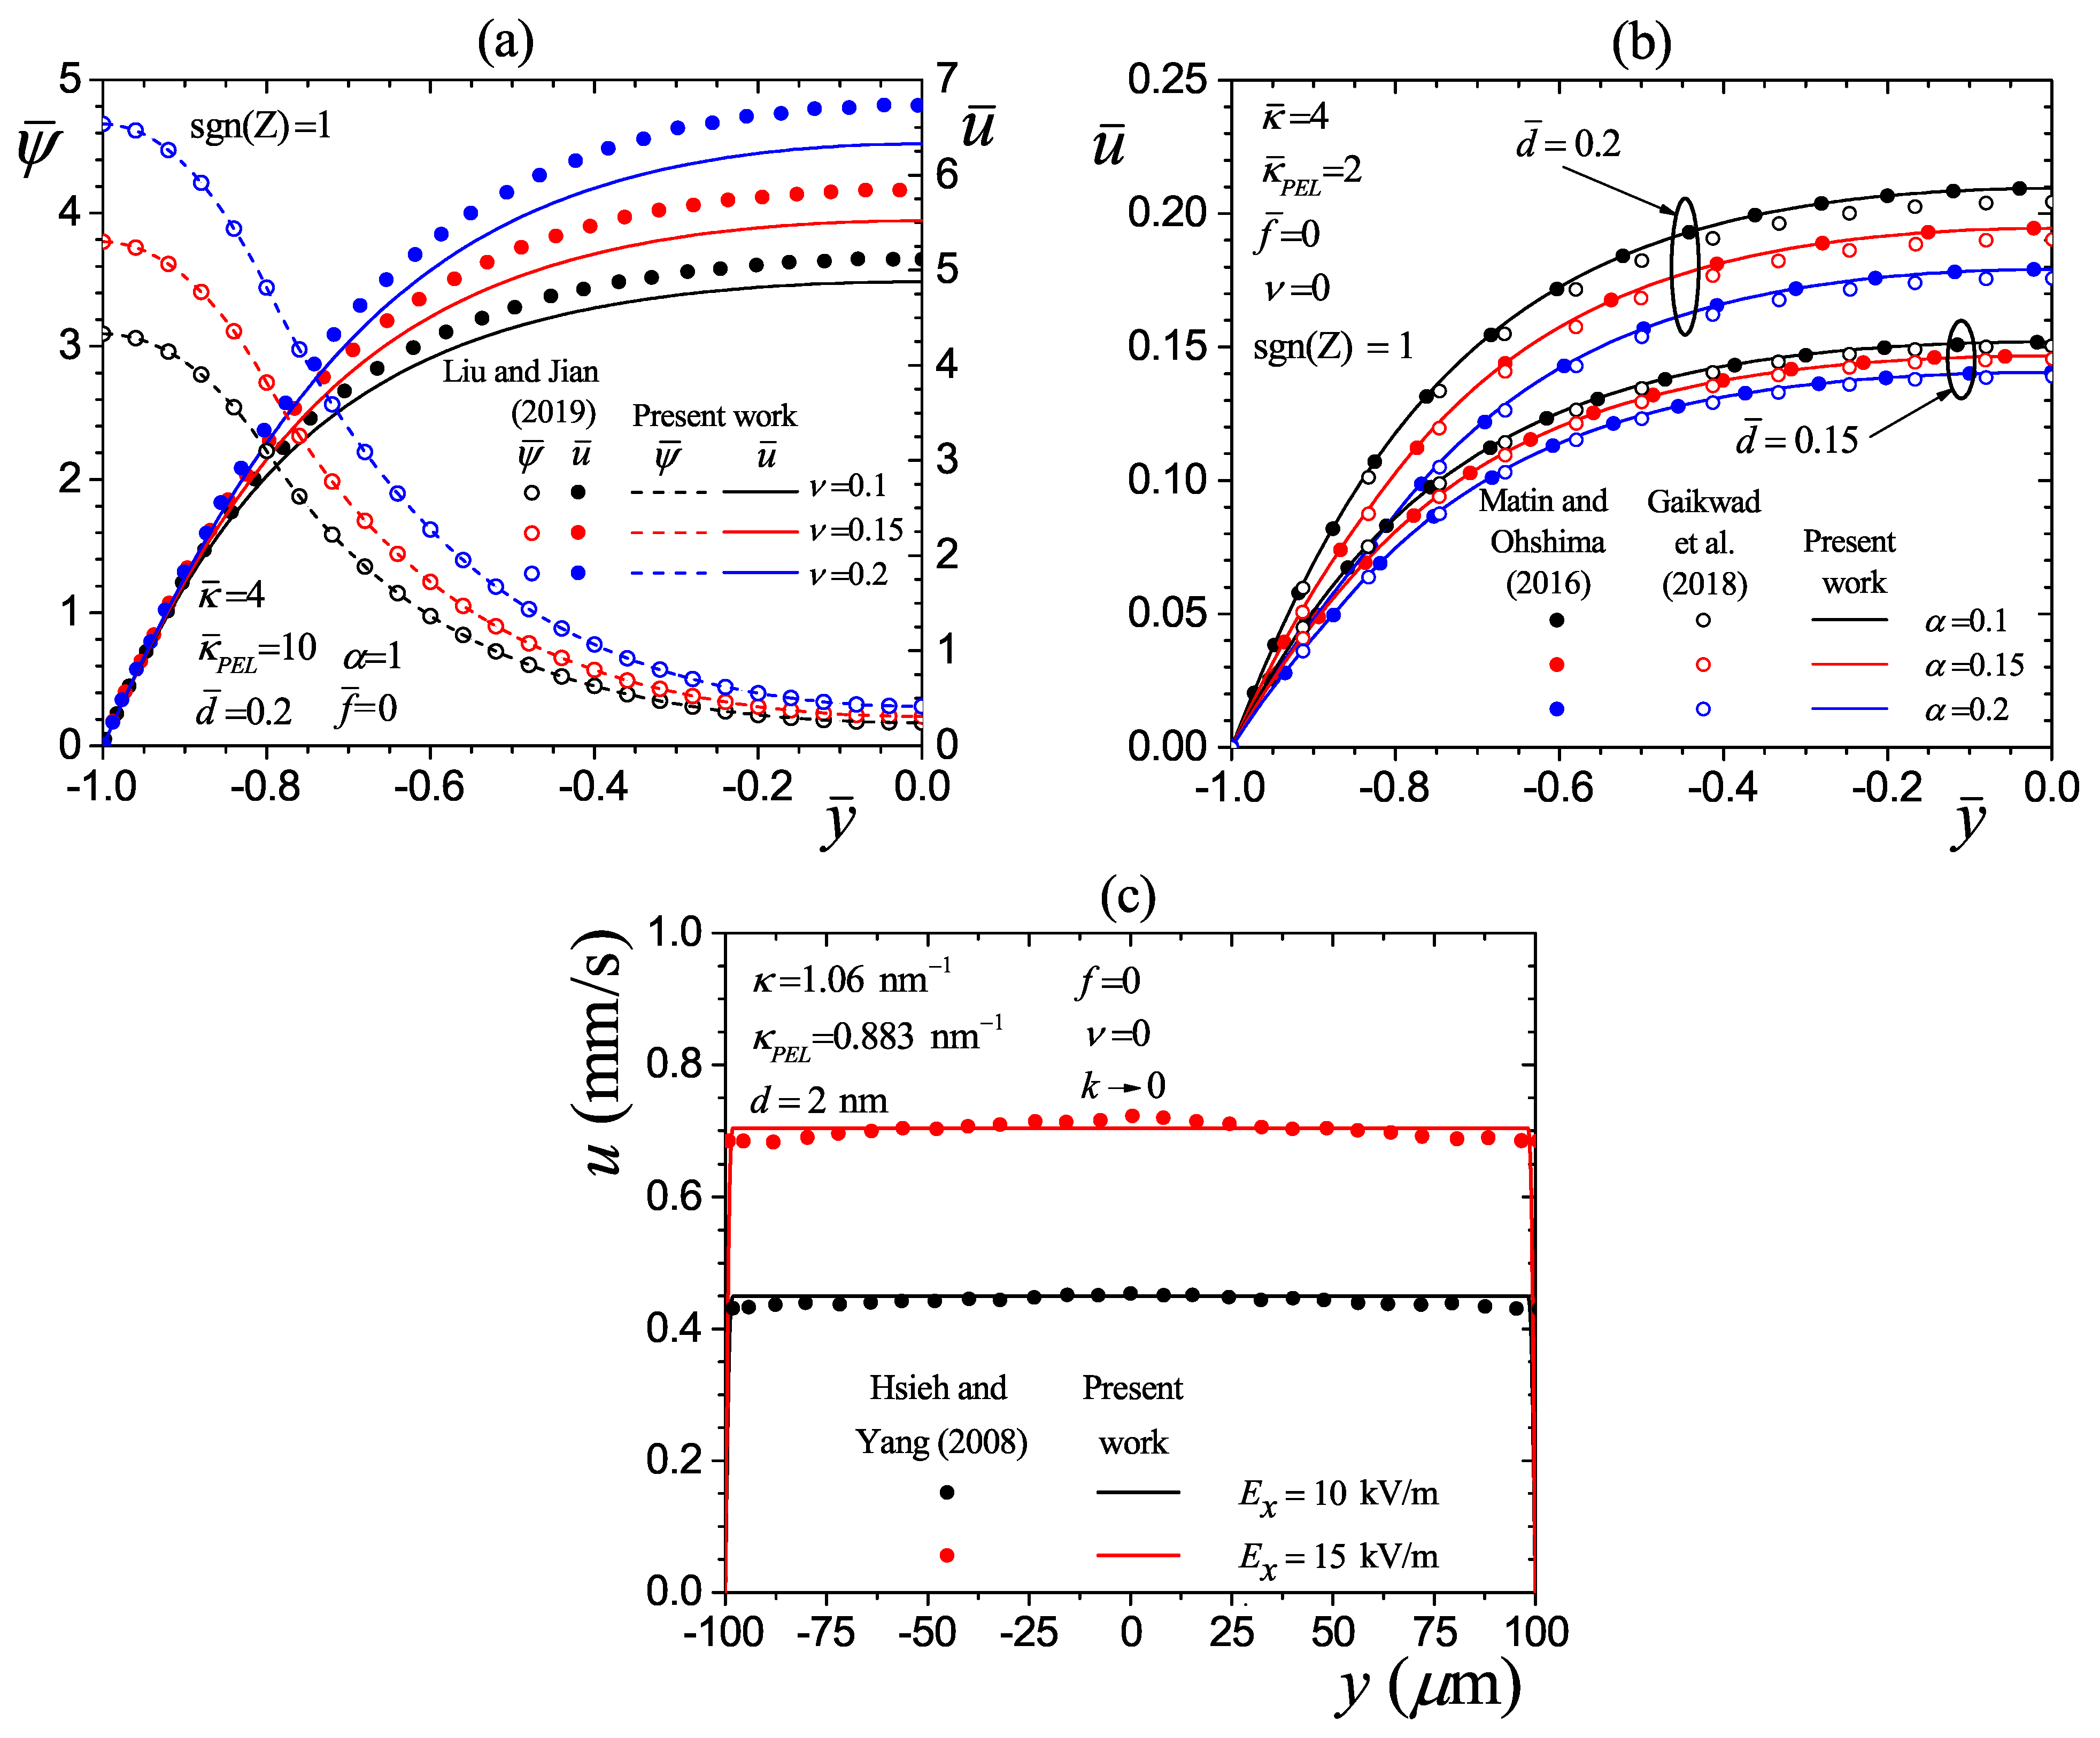
This work validates the numerical solution with studies reported by the scientific community. Figure 3a compares the electric potential distribution and the velocity profiles of the electroosmotic flow in a polyelectrolyte-coated flat-plate channel from the research reported by Liu and Jian [30] and the present work. The graph presents the dimensionless parameters that influence the flow behavior, where the equivalence of the electrokinetic parameters between the two works is as follows: κ ¯ = λ 1 = 4 for the electrolyte region and κ ¯ P E L = λ F C L 1 = 10 for the PEL. The distributions with symbols represent the research by Liu and Jian [30], and the lines indicate the present work. Regarding the electric potential distribution, the overlap between solutions reflects an excellent convergence. However, the finite difference numerical solution used by Liu and Jian [30] for the velocity profiles presents a slight discrepancy with the one obtained in the present work using COMSOL. Nevertheless, the comparison of the velocity profiles shows an adequate qualitative and quantitative agreement. In another comparison, Figure 3b shows the velocity profiles of the investigations reported by Matin and Ohshima [24], Gaikwad et al. [28], and the present work. The velocity profiles obtained in the present work and those obtained by Matin and Ohshima [24] are very close for parallel flat plates in both works; however, the results of Gaikwad et al. [28] deviate slightly from the previous ones due to wall effects or the numerical procedure used, since these authors solve the electroosmotic flow in a rectangular channel with a width much larger than the height. Therefore, according to the results in Figure 3b, the numerical solution developed in this work also exhibits excellent performance. Furthermore, Figure 3c validates the numerical results of this study in dimensional form with the experimental work conducted by Hsieh and Yang [58], considering a very thin PEL with a thickness of d = 2 nm. For this evaluation, the drag parameter, the viscoelectric coefficient, the steric factor, the valency of the electrolyte, and the sign function are k 0 Pa s m−2, f = 0 m2 V−2, ν = 0 , z = 1 , and sgn ( Z ) = 1 , respectively, while the inverse Debye lengths in the electrolyte and polyelectrolyte layers are κ = 1.06 nm 1 and κ P E L = 0.883 nm 1 , respectively. The above parameters are consistent with the assumptions of the work developed by Hsieh and Yang [58], which considers rigid channels and the absence of steric and viscoelectric effects. The remaining parameters are selected based on correlations reported in the same work, where the fluid properties vary with temperature. Accordingly, for an applied electric field of E x = 10 kV m−1, this work assumes that T = 302.35 K, ε = 6.79 × 10 10 C V−1 m−1, and η 0 = 8.44 × 10 4 Pa s, whereas for E x = 15 kV m−1, this work assumes that T = 304.85 K, ε = 6.71 × 10 10 C V−1 m−1, and η 0 = 8.06 × 10 4 Pa s. In this comparison, the Root Mean Squared Error (RMSE) estimates the accuracy of the results with the following formula:
RMSE = q = 1 m u a , q u b , q 2 / q = 1 m u a , q 2 1 / 2 × 100 ,
where u a , q and u b , q are the velocity values of the present numerical results and the experimental data at each node q, and m = 26 is the number of data considered. The RMSE values, of approximately 2.2 % for E x = 10 kV / m and 1.6 % for E x = 15 kV / m , are obtained without considering the boundary values since the present model imposes a no-slip condition. At the same time, the experimental study does not explicitly capture the velocity behavior next to the wall, where the most significant source of error occurs, as pointed out in that study. On the other hand, this figure is selected for the statistical RMSE analysis because it is the only case in the manuscript that includes experimental data, allowing a direct comparison with the simulated velocity profiles. Therefore, in Figure 3c, the numerical results agree with the experimental data from Hsieh and Yang [58], indicating that the present numerical solution by COMSOL adequately describes the physics of the electroosmotic flow studied here.

4.2. Electric Potential Distribution and Velocity Profiles

4.2.1. Effect of the Electrokinetic Parameter of the PEL

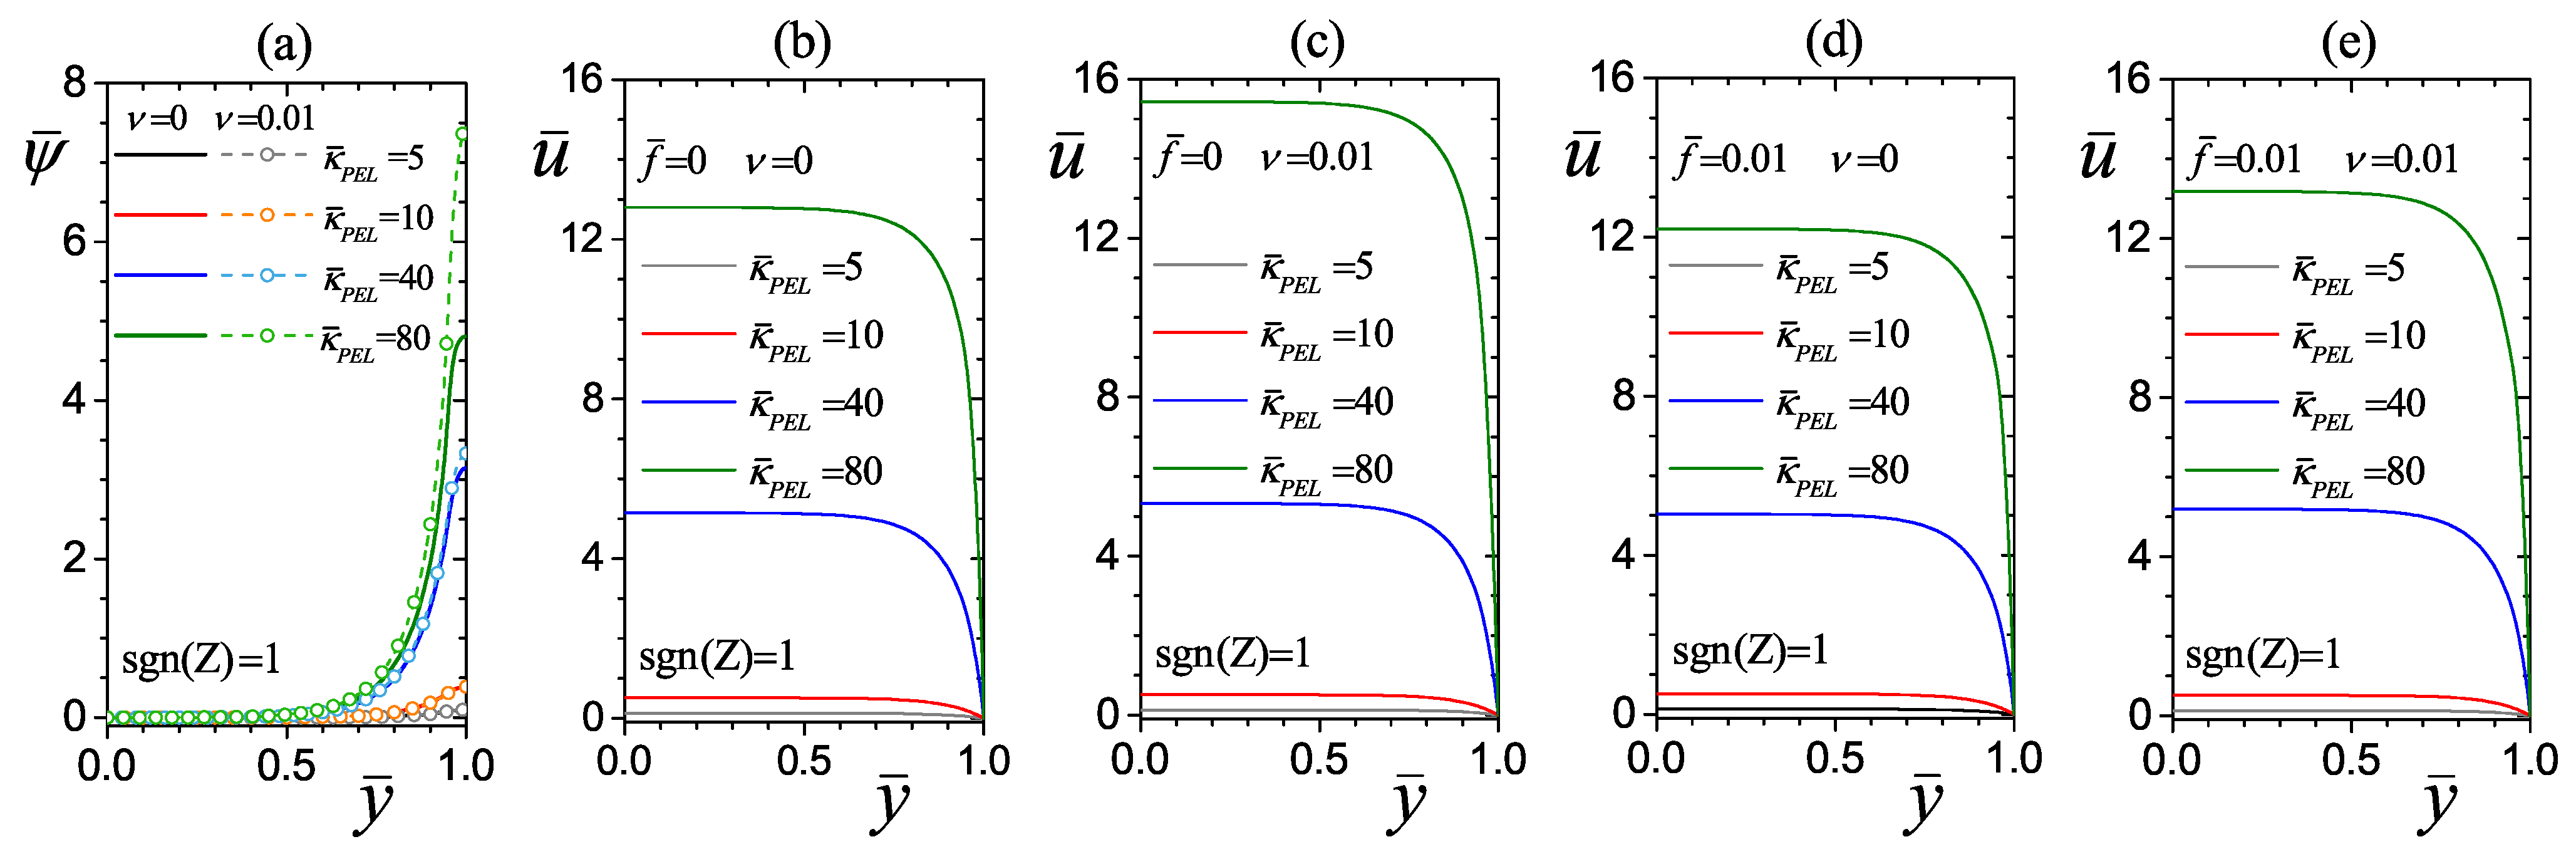
Figure 4 shows the behavior of an electroosmotic flow as a function of the electrokinetic parameter of the PEL κ ¯ P E L , considering that the polarity of the fixed charges within the PEL is sgn ( Z ) = 1 . Moreover, the parameters κ ¯ = 10 , d ¯ = 0.05 , and α = 1 are constant in this analysis. Also, Figure 4 examines the combined effects of the steric factor ( ν ), the viscoelectric coefficient ( f ¯ ), and different values of the electrokinetic parameter of the PEL ( κ ¯ P E L ) on the flow. Therefore, Figure 4a illustrates the electric potential distribution as a function of the dimensionless transverse coordinate and the electrokinetic parameter of the PEL. The values of κ ¯ P E L = 5 and κ ¯ P E L = 10 correspond to the ratios of κ ¯ P E L / κ ¯ = 0.5 and 1, respectively. In this case, both ratios result in κ ¯ P E L / κ ¯ 1 , which generates low surface potentials at the wall (at y ¯ = 1 ) with or without steric factor of ψ ¯ = 0.09 and 0.38 for κ ¯ P E L = 5 and 10, respectively. In the opposite scenario, when κ ¯ P E L = 40 and 80 (equivalent to κ ¯ P E L / κ ¯ = 4 and 8) due to the increase in the fixed ionic charges within the PEL, the electric potentials at the wall (at y ¯ = 1 ) are as follows: ψ ¯ = 3.15 and 4.8 for κ ¯ P E L = 40 and 80 without steric factor; as well as ψ ¯ = 3.33 and 7.44 for κ ¯ P E L = 40 and 80 with steric factor. Thus, high values of the equivalent electrokinetic parameter, κ ¯ P E L = 40 and 80, significantly magnify the electric potential across the channel cross-section (specifically within the EDL of the electrolyte and the PEL), and also generate high surface potentials at the walls greater than one. Therefore, increasing the parameter κ ¯ P E L increases the electric potential (see Figure 4a), thereby enhancing the velocity profiles (see Figure 4b–e) and the electroosmotic flow. Likewise, increasing the electrokinetic parameter in the PEL leads to a thinner equivalent dimensionless Debye length ( κ ¯ P E L 1 = 0.2 , 0.1 , 0.025 , 0.0125 for κ ¯ P E L = 5 , 10 , 40 , 80 ), causing the velocity and potential gradients within the PEL to become steeper over a shorter distance of the κ ¯ P E L 1 as κ ¯ P E L increases. As a reference, the electrokinetic parameter κ ¯ = 10 corresponds to a dimensionless Debye length in the electrolyte of κ ¯ 1 = 0.1 . Based on this analysis, it is possible to conclude that significant velocity changes occur in a narrow region near the channel wall, specifically across the Debye lengths ( κ ¯ P E L 1 and κ ¯ 1 ). Outside these layers, the velocity and electric potential gradients vanish as they approach the center of the channel, tending to become flat.
Regarding the influence of the steric effect on the electroosmotic flow, Figure 4a presents the electric potential distribution for two values of ν = 0 (solid lines without steric factor) and ν = 0.01 (dashed lines with symbols, considering the steric effect due to the finite ionic size and high concentrations of free charges in the electrolyte). When ν = 0.01 , the electric potential distribution increases only when the ratio κ ¯ P E L / κ ¯ > 1 , increasing the surface potential (at y ¯ = 1 ) by 5 % and 55 % for κ ¯ P E L = 40 and 80 (compared to the case of ν = 0 ), whereas when κ ¯ P E L / κ ¯ 1 (low surface potentials), the parameter ν does not modify the electric potential distribution. The above behavior is due to the steric effect, which increases the potential due to a reduction in the net charge of the electrolyte. However, despite this decrease induced by the steric effect, and to ensure that the net charge of the electrolyte is equal to the fixed charge of the Stern layer in the EDL of the electrolyte, the magnitude of the corresponding potential must increase [30,49,59]. In conclusion, the steric factor increases the electric potential, resulting in enhanced electroosmotic forces and velocity profiles, when comparing the cases of ν = 0 and ν = 0.01 in Figure 4b,c, as follows. When the steric factor increases from 0 to 0.01 with low electric potentials, the fluid velocity remains constant ( u ¯ = 0.12 and 0.51 for κ ¯ P E L = 5 and 10, at y ¯ = 0 with and without steric factor). Meanwhile, the velocities at y ¯ = 0 for high electric potentials are as follows: u ¯ = 5.14 and 12.8 for κ ¯ P E L = 40 and 80 without steric factor; as well as u ¯ = 5.32 and 15.43 for κ ¯ P E L = 40 and 80 with steric factor. Thus, increasing the steric factor from 0 to 0.01 in Figure 4b,c increases the maximum velocity by 3.5 % for κ ¯ P E L = 40 and 20.5 % for κ ¯ P E L = 80 , respectively.
On the other hand, Figure 4b,d show the influence of the viscoelectric coefficient on the fluid viscosity associated with flow resistance, where the velocity profiles decrease when f ¯ increases from 0 to 0.01 . As an example, the velocities at y ¯ = 0 for high electric potentials are as follows: u ¯ = 5.14 and 12.8 for κ ¯ P E L = 40 and 80 without viscoelectric coefficient; as well as u ¯ = 5.03 and 12.2 for κ ¯ P E L = 40 and 80 with viscoelectric coefficient. Therefore, analyzing the viscoelectric coefficient, the maximum velocity at the center of the channel in Figure 4b,d decreases 2.1 % for κ ¯ P E L = 40 and 4.6 % for κ ¯ P E L = 80 . Meanwhile, for low surface potentials such as κ ¯ P E L = 5 and 10 (equivalent to κ ¯ P E L / κ ¯ 1 ) in the same Figure 4b,d, the viscoelectric effect is practically negligible on the electroosmotic flow, keeping a constant velocity at y ¯ = 0 of u ¯ = 0.12 and 0.51 for κ ¯ P E L = 5 and 10 with and without viscoelectric coefficient. Also, it is worth noting that the viscoelectric parameter does not affect the electric potential in Figure 4a, as f ¯ only influences the hydrodynamic behavior of the fluid through viscosity.
Figure 4b,e illustrate the combined steric and viscoelectric effects, where the viscoelectric effect ( f ¯ ) counteracts the steric effect ( ν ). The velocities at y ¯ = 0 in Figure 4e are u ¯ = 0.12 , 0.51 , 5.19 , and 13.18 for κ ¯ P E L = 5 , 10, 40, and 80, respectively. Then, comparing these results with Figure 4b, the velocity increases are 0 % for κ ¯ P E L = 5 and 10, as well as 1 % and 3 % for κ ¯ P E L = 40 and 80. As a result of this combination of parameters, there is no significant change in the magnitude of the velocity profiles between Figure 4b with ν = 0 and f ¯ = 0 , and Figure 4e with ν = 0.01 and f ¯ = 0.01 .
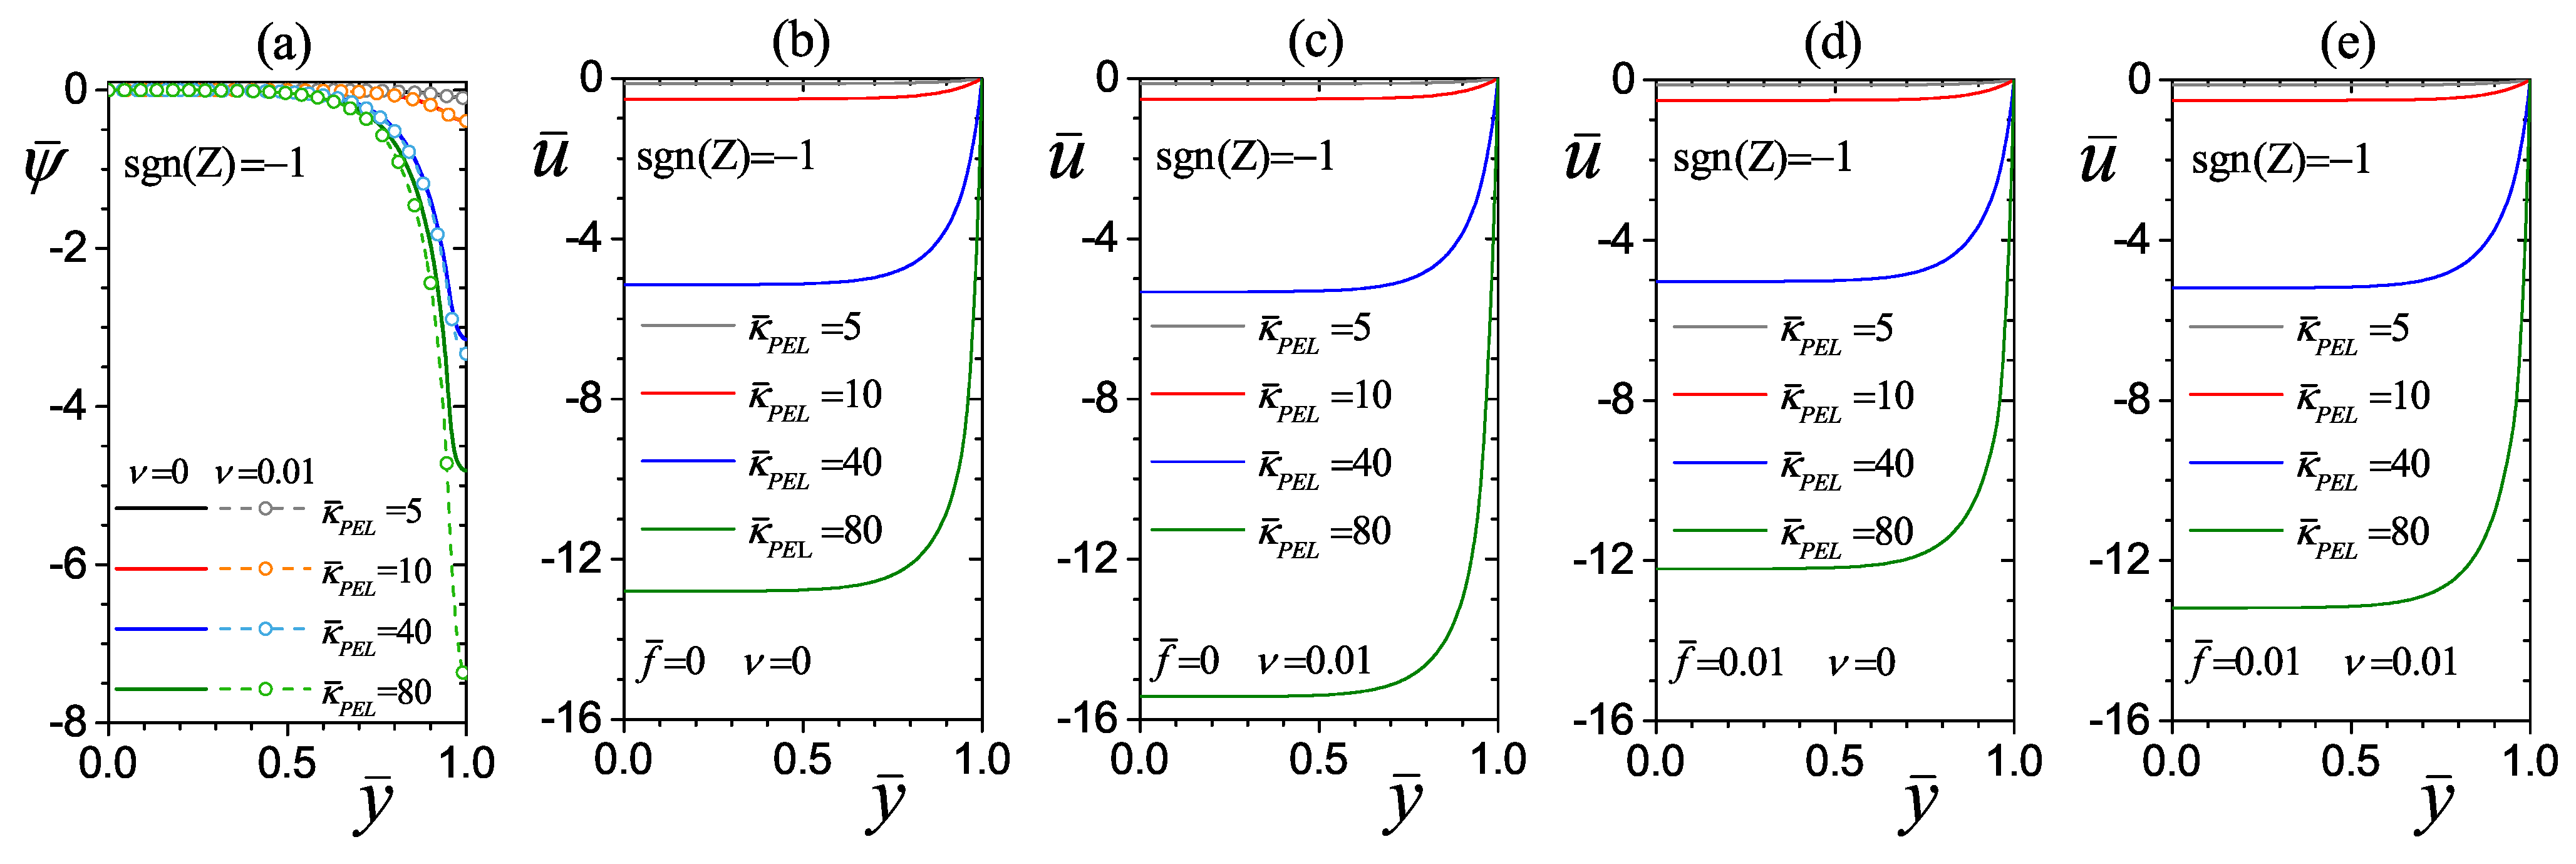
Figure 5 also shows the electroosmotic flow as a function of the electrokinetic parameter κ ¯ P E L , using the same dimensionless parameters as in Figure 4, but with a different polarity of the fixed charges in the PEL. By comparing Figure 4 and Figure 5, with sgn ( Z ) = 1 and sgn ( Z ) = 1 , respectively, the dimensionless results for the electric potential distribution and velocity profiles in these two scenarios exhibit the same magnitudes, but with opposite signs. Therefore, the descriptions of Figure 4a–e mentioned above also correspond to Figure 5a–e.

4.2.2. Effect of the PEL Thickness

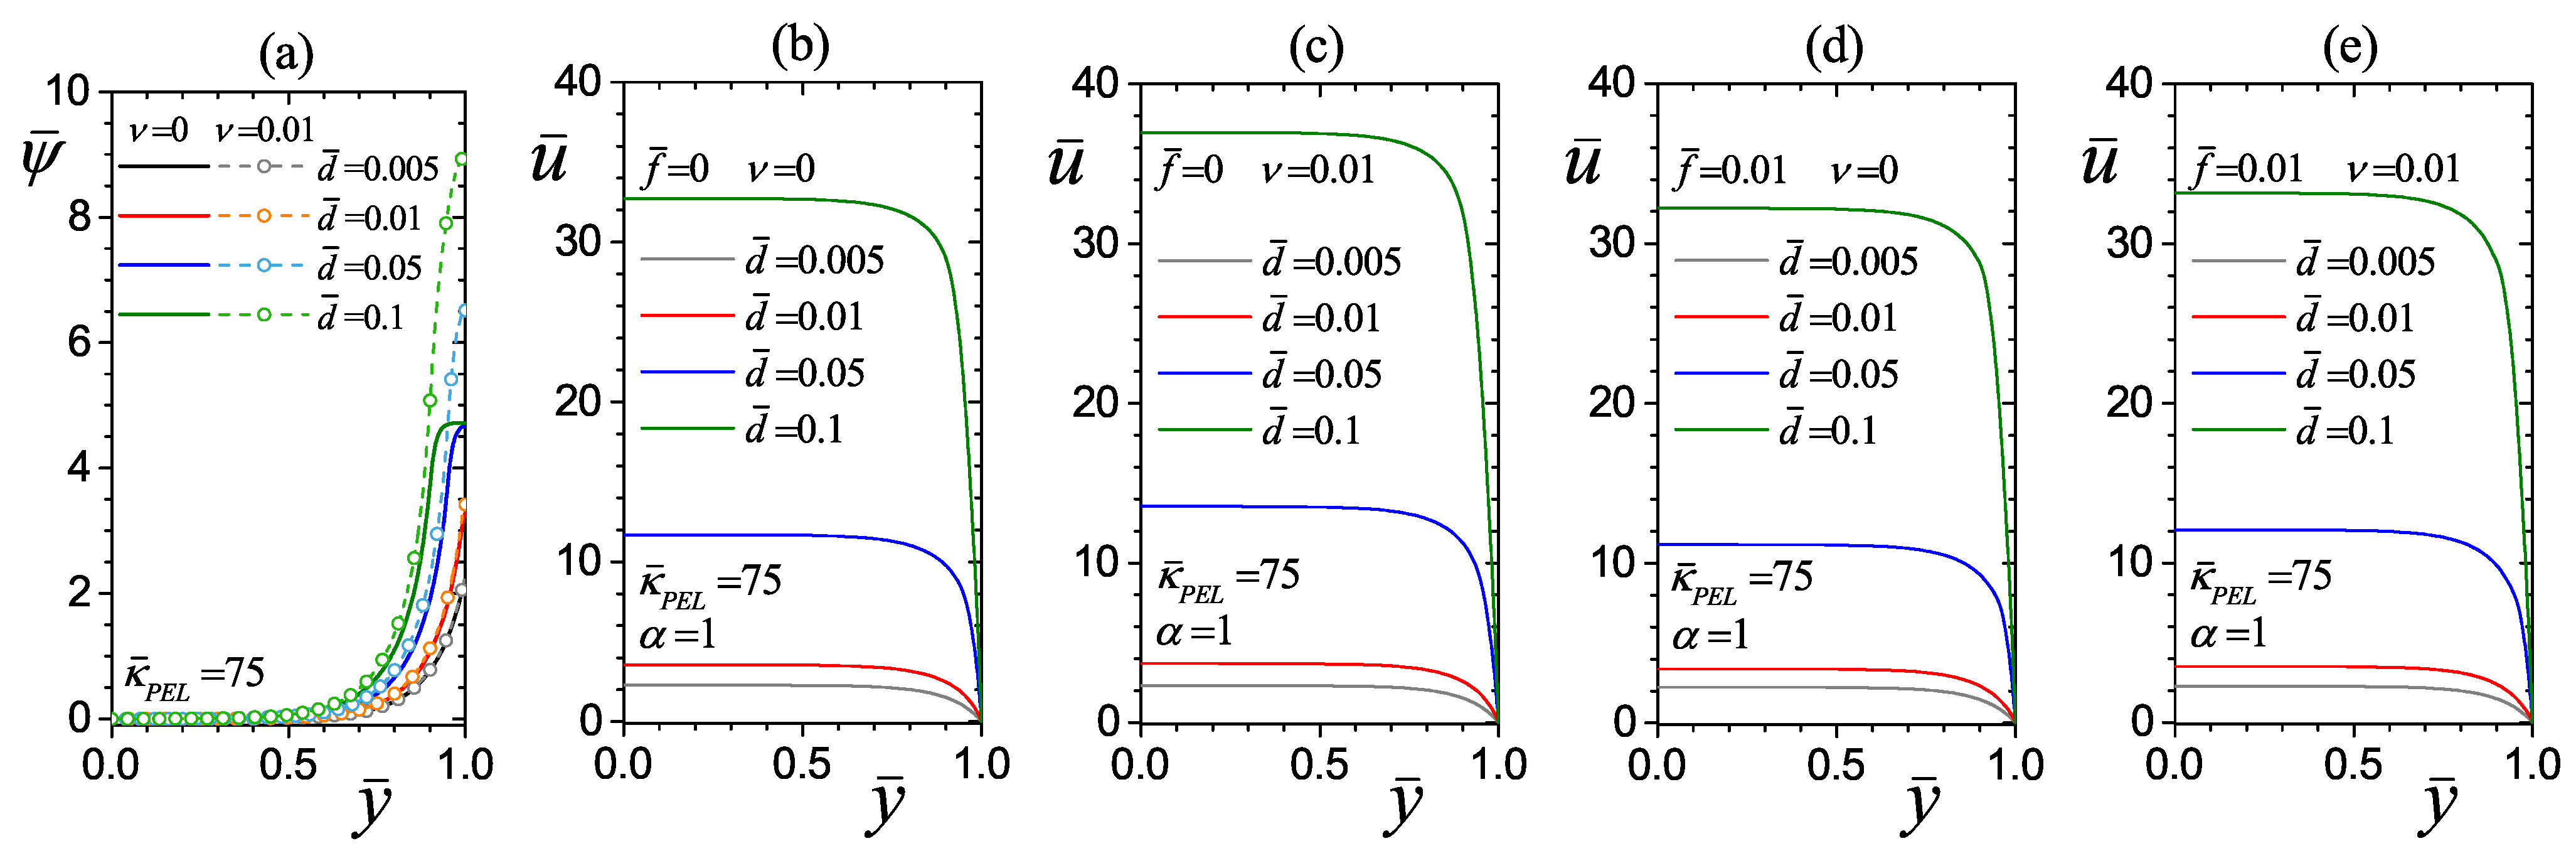
Figure 6 presents the electroosmotic flow as a function of the dimensionless thickness of the PEL d ¯ for two combined values of the steric factor ν ( = 0 , 0.01 ) and the viscoelectric coefficient f ¯ ( = 0 , 0.01 ) . In Figure 6a, increasing the PEL thickness also leads to higher surface potentials (at y ¯ = 1 ); for d ¯ = 0.005 , 0.01 , 0.05 , and 0.1 , the surface potentials without steric factor are ψ ¯ = 2.21 , 3.27 , 4.66 , 4.72 and with steric factor are ψ ¯ = 2.24 , 3.41 , 6.51 , 8.96 . This phenomenon occurs because the channel is grafted with a polyelectrolyte composed of polymer brushes containing both fixed charges and free ions from the electrolyte. Consequently, a thicker PEL with more fixed charges alters the charge distribution within the electrolyte, allowing greater accumulation of free counterions within the PEL, thereby increasing the surface potential at the wall and the potential along the channel cross-section [21,23,26,60]. For the electric potential distribution without steric factor in Figure 6a, both the potential across the channel cross-section and the surface potential at the wall increase gradually as d ¯ increases from 0.005 to 0.1 . When d ¯ = 0.1 , although the electric potential across the channel cross-section increases towards the center of the channel, the potential at the wall is almost the same as in the case of d ¯ = 0.05 . This tendency indicates a limit where the surface potential at the channel wall no longer varies with the PEL thickness because the PEL achieves a homogeneous and constant accumulation of electrolyte ions near the wall. The above ensures compliance with the Gauss boundary condition (Equation (12)), from a position far from the channel wall, as the PEL thickness increases. In Figure 6a, the steric effect ( ν = 0.01 ) also modifies the electric potential distribution, magnifying both the electric potential towards the center of the channel and the surface potential at the wall. The increase in the electric potential is because, when considering the ionic size of the charges, the PEL thickness does not reach its limit value for a homogeneous and constant accumulation of ions (as in the previous case with ν = 0 ), which allows ensuring the Gauss boundary condition from a position further from the wall. Concerning Figure 6b–e, the velocity profiles increase consistently with the thickening of the PEL, which induces a higher electric potential. Here, the thickest PEL ( d ¯ = 0.1 ) produces the highest velocity of u ¯ = 32.72 at y ¯ = 0 without steric and viscoelectric effects (see Figure 6b). Then, that velocity increases to u ¯ = 36.96 with the steric factor (see Figure 6c), and decreases to u ¯ = 32.2 with the viscoelectric coefficient (see Figure 6d).
Finally, the fluid velocity at y ¯ = 0 under the combined steric and viscoelectric effects with d ¯ = 0.1 results in u ¯ = 33.17 (see Figure 6e). For this last parameter combination, the steric factor ( ν ) counteracts the viscoelectric coefficient ( f ¯ ) and generates a slight increase in velocity as shown in Figure 6b.

4.2.3. Effect of the Drag Parameter

Figure 7a–e show the electroosmotic flow as a function of the drag parameter α (=1, 10, 50, 100) for two combined values of the steric factor ν (=0, 0.01) and the viscoelectric coefficient f ¯ (=0, 0.01). In Figure 7a, the parameter α does not affect the electric potential distribution, as it only influences the flow hydrodynamics. The presence of polyelectrolyte brushes in the channel coating creates friction as the fluid flows through the porous matrix in the PEL, which counteracts the fluid flow. As a result, the fluid velocity in all cases of Figure 7b–e decreases as the drag parameter increases. It is also important to note that for the smallest values of α = 1 and 10, the velocity profiles of the electroosmotic flow tend to develop the classic form of a plug-like flow. However, for the higher values of α = 50 and 100, the flow resistance is so high that the fluid within the PEL significantly reduces its movement, deforming the velocity profile in Figure 7b–e. Precisely at the limit of the PEL thickness at y ¯ = 0.93 (when d ¯ = 0.07 ), there is an inflection point in the velocity profile due to the friction effect in the PEL, while another inflection point in the velocity profile is located near the wall to meet the no-slip condition. The steric and viscoelectric effects on the potential distribution and velocity profiles in Figure 6 and Figure 7 follow the same behavior as in Figure 4. Here, taking as a reference the maximum velocity at the center of the channel (at y ¯ = 0 ) with α = 1 , the velocity distribution under steric and viscoelectric effects is as follows: u ¯ = 20.49 without steric and viscoelectric effects (see Figure 7b), u ¯ = 24.96 with steric effect (see Figure 7c), and u ¯ = 19.89 with viscoelectric coefficient (see Figure 7d). Then, the combination of steric and viscoelectric effects leads to a velocity of u ¯ = 20.66 (see Figure 7e), indicating a slight superiority in the hydrodynamic contribution of the steric effect ( ν ) over the viscoelectric coefficient ( f ¯ ). Meanwhile, by increasing the drag parameter from α = 1 to α = 100 , the velocities at y ¯ = 0 are u ¯ = 4.91 (in Figure 7b), u ¯ = 7.21 (in Figure 7c), u ¯ = 4.52 (in Figure 7d), and u ¯ = 5.82 (in Figure 7e). Therefore, in this comparison, the peak velocity at y ¯ = 0 is significantly affected by the drag parameter, exhibiting a velocity reduction of 76 % (in Figure 7b), 67 % (in Figure 7c), 77 % (in Figure 7d), and 72 % (in Figure 7e) when α = 1 increases to α = 100 .

4.3. Effect of Average Dimensionless Viscosity on Flow Hydrodynamics

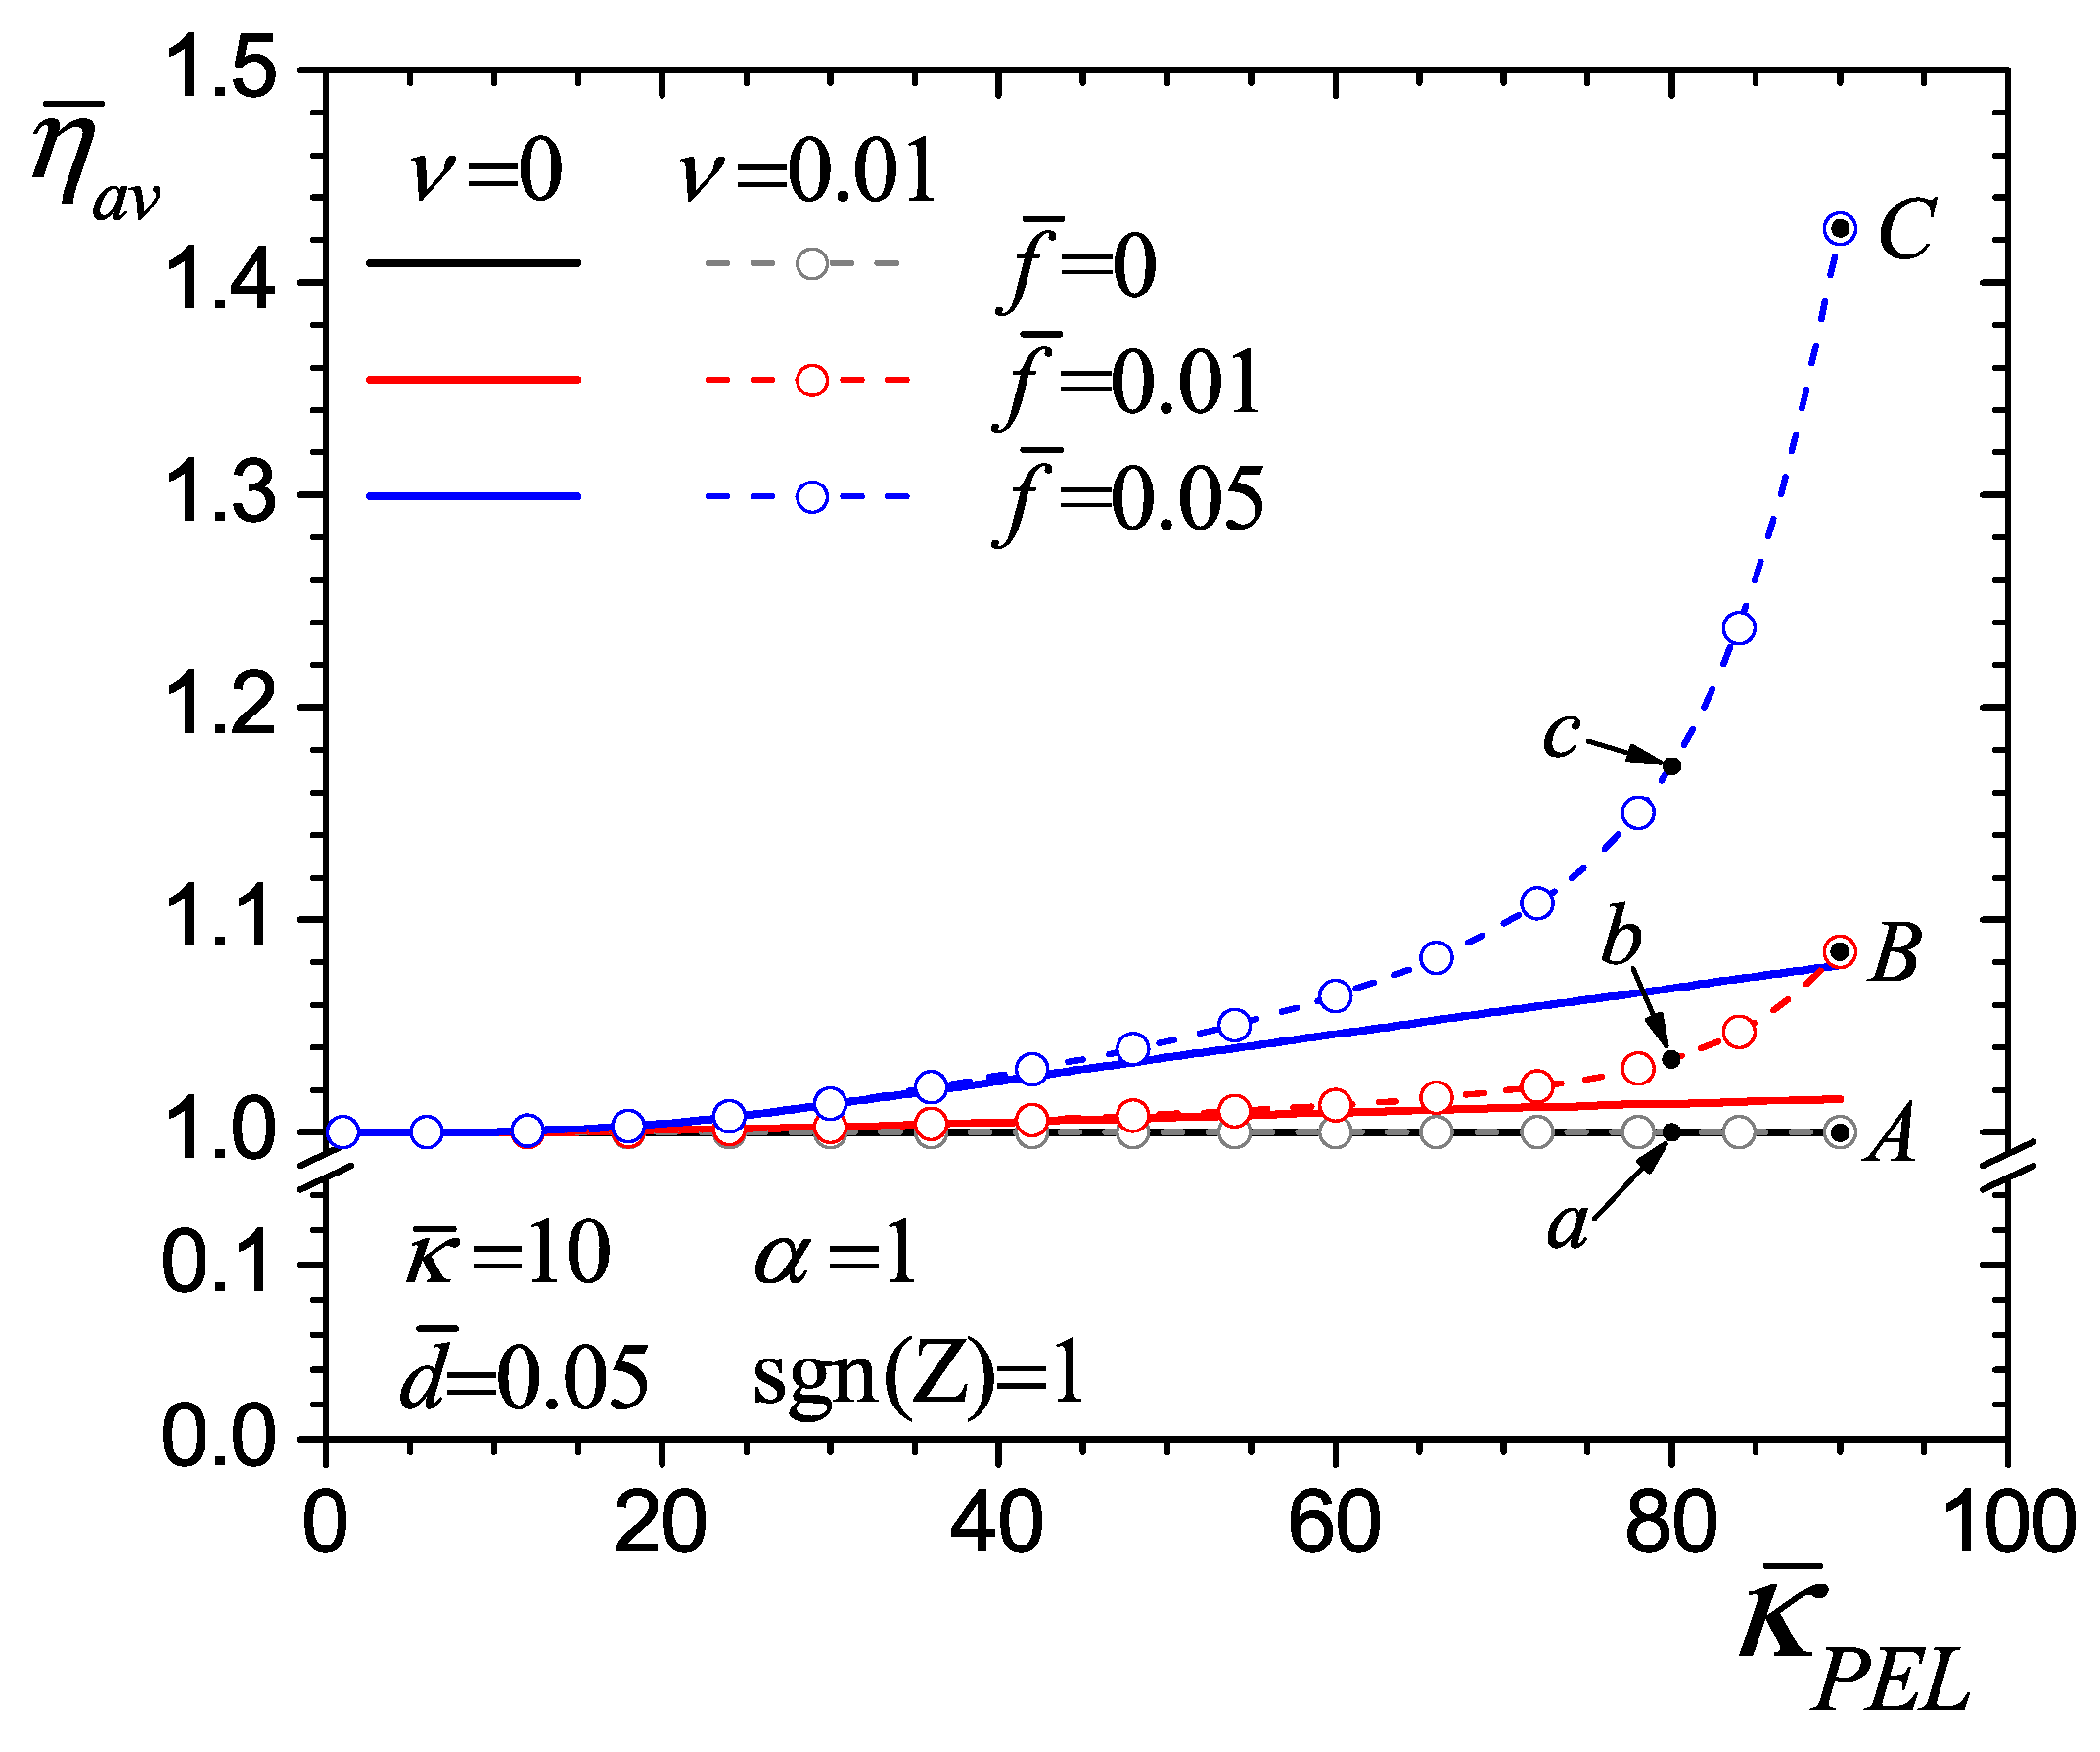
Figure 8 presents the dimensionless average viscosity, which depends on the local electric field within the EDLs, as a function of the electrokinetic parameter of the PEL κ ¯ P E L and combined values of the steric factor ν (=0, 0.01) and the viscoelectric coefficient f ¯ (=0, 0.01, 0.05). Taking Equation (7) for unidirectional flow as a reference, the behavior of η ¯ a v results from integrating the dimensionless viscosity across the entire cross-section of the channel, as:
η ¯ a v = 1 2 y ¯ = 1 y ¯ = 1 η η 0 d y ¯ = 1 2 y ¯ = 1 y ¯ = 1 1 + f ¯ κ ¯ 2 d ψ ¯ d y ¯ 2 d y ¯ .
Figure 8 shows that the fluid viscosity without viscoelectric effect ( f ¯ = 0 ) remains constant with η ¯ a v = 1 regardless of the steric factor. However, the fluid viscosity with viscoelectric effect ( f ¯ = 0.01 , 0.05 ) increases as the electrokinetic parameter increases, exhibiting notable growths from κ ¯ P E L = 15 (equivalent to κ ¯ P E L / κ ¯ > 1.5 ), which leads to a significantly higher electric potential. For example, for the case of κ ¯ P E L = 80 and f ¯ = 0.01 , the average viscosity with steric factor of ν (=0, 0.01) is η ¯ a v (=1.014, 1.035), which corresponds to an increase of 1.4 % and 3.5 % compared to the case without viscoelectric effect. Meanwhile, for the same case of κ ¯ P E L = 80 with ν (=0, 0.01) but with f ¯ = 0.05 , the average viscosity increases more significantly to η ¯ a v (=1.068, 1.172), which represents increases of 6.8 % and 17.2 % concerning the average viscosity without viscoelectric effect. The results in this figure exhibit the increase in fluid viscosity due to the increase in electric potential, considering both finite ionic sizes via the steric factor ν and the increase in the concentration of fixed ions in the polyelectrolyte brushes via the electrokinetic parameter of the PEL κ ¯ P E L (see Figure 4a). This phenomenon is because the electric potential gradients quadratically impact the fluid viscosity, as can be seen in Equation (25). Therefore, in Figure 8, the combined effect of the steric factor ( ν > 0 ) and the viscoelectric coefficient ( f ¯ > 0 ) always favors the nonlinear increase in viscosity. Points a, b, c indicate η ¯ a v at κ ¯ P E L = 80 and A, B, C indicate η ¯ a v at κ ¯ P E L = 90 , and are selected for further analysis in Figure 9.
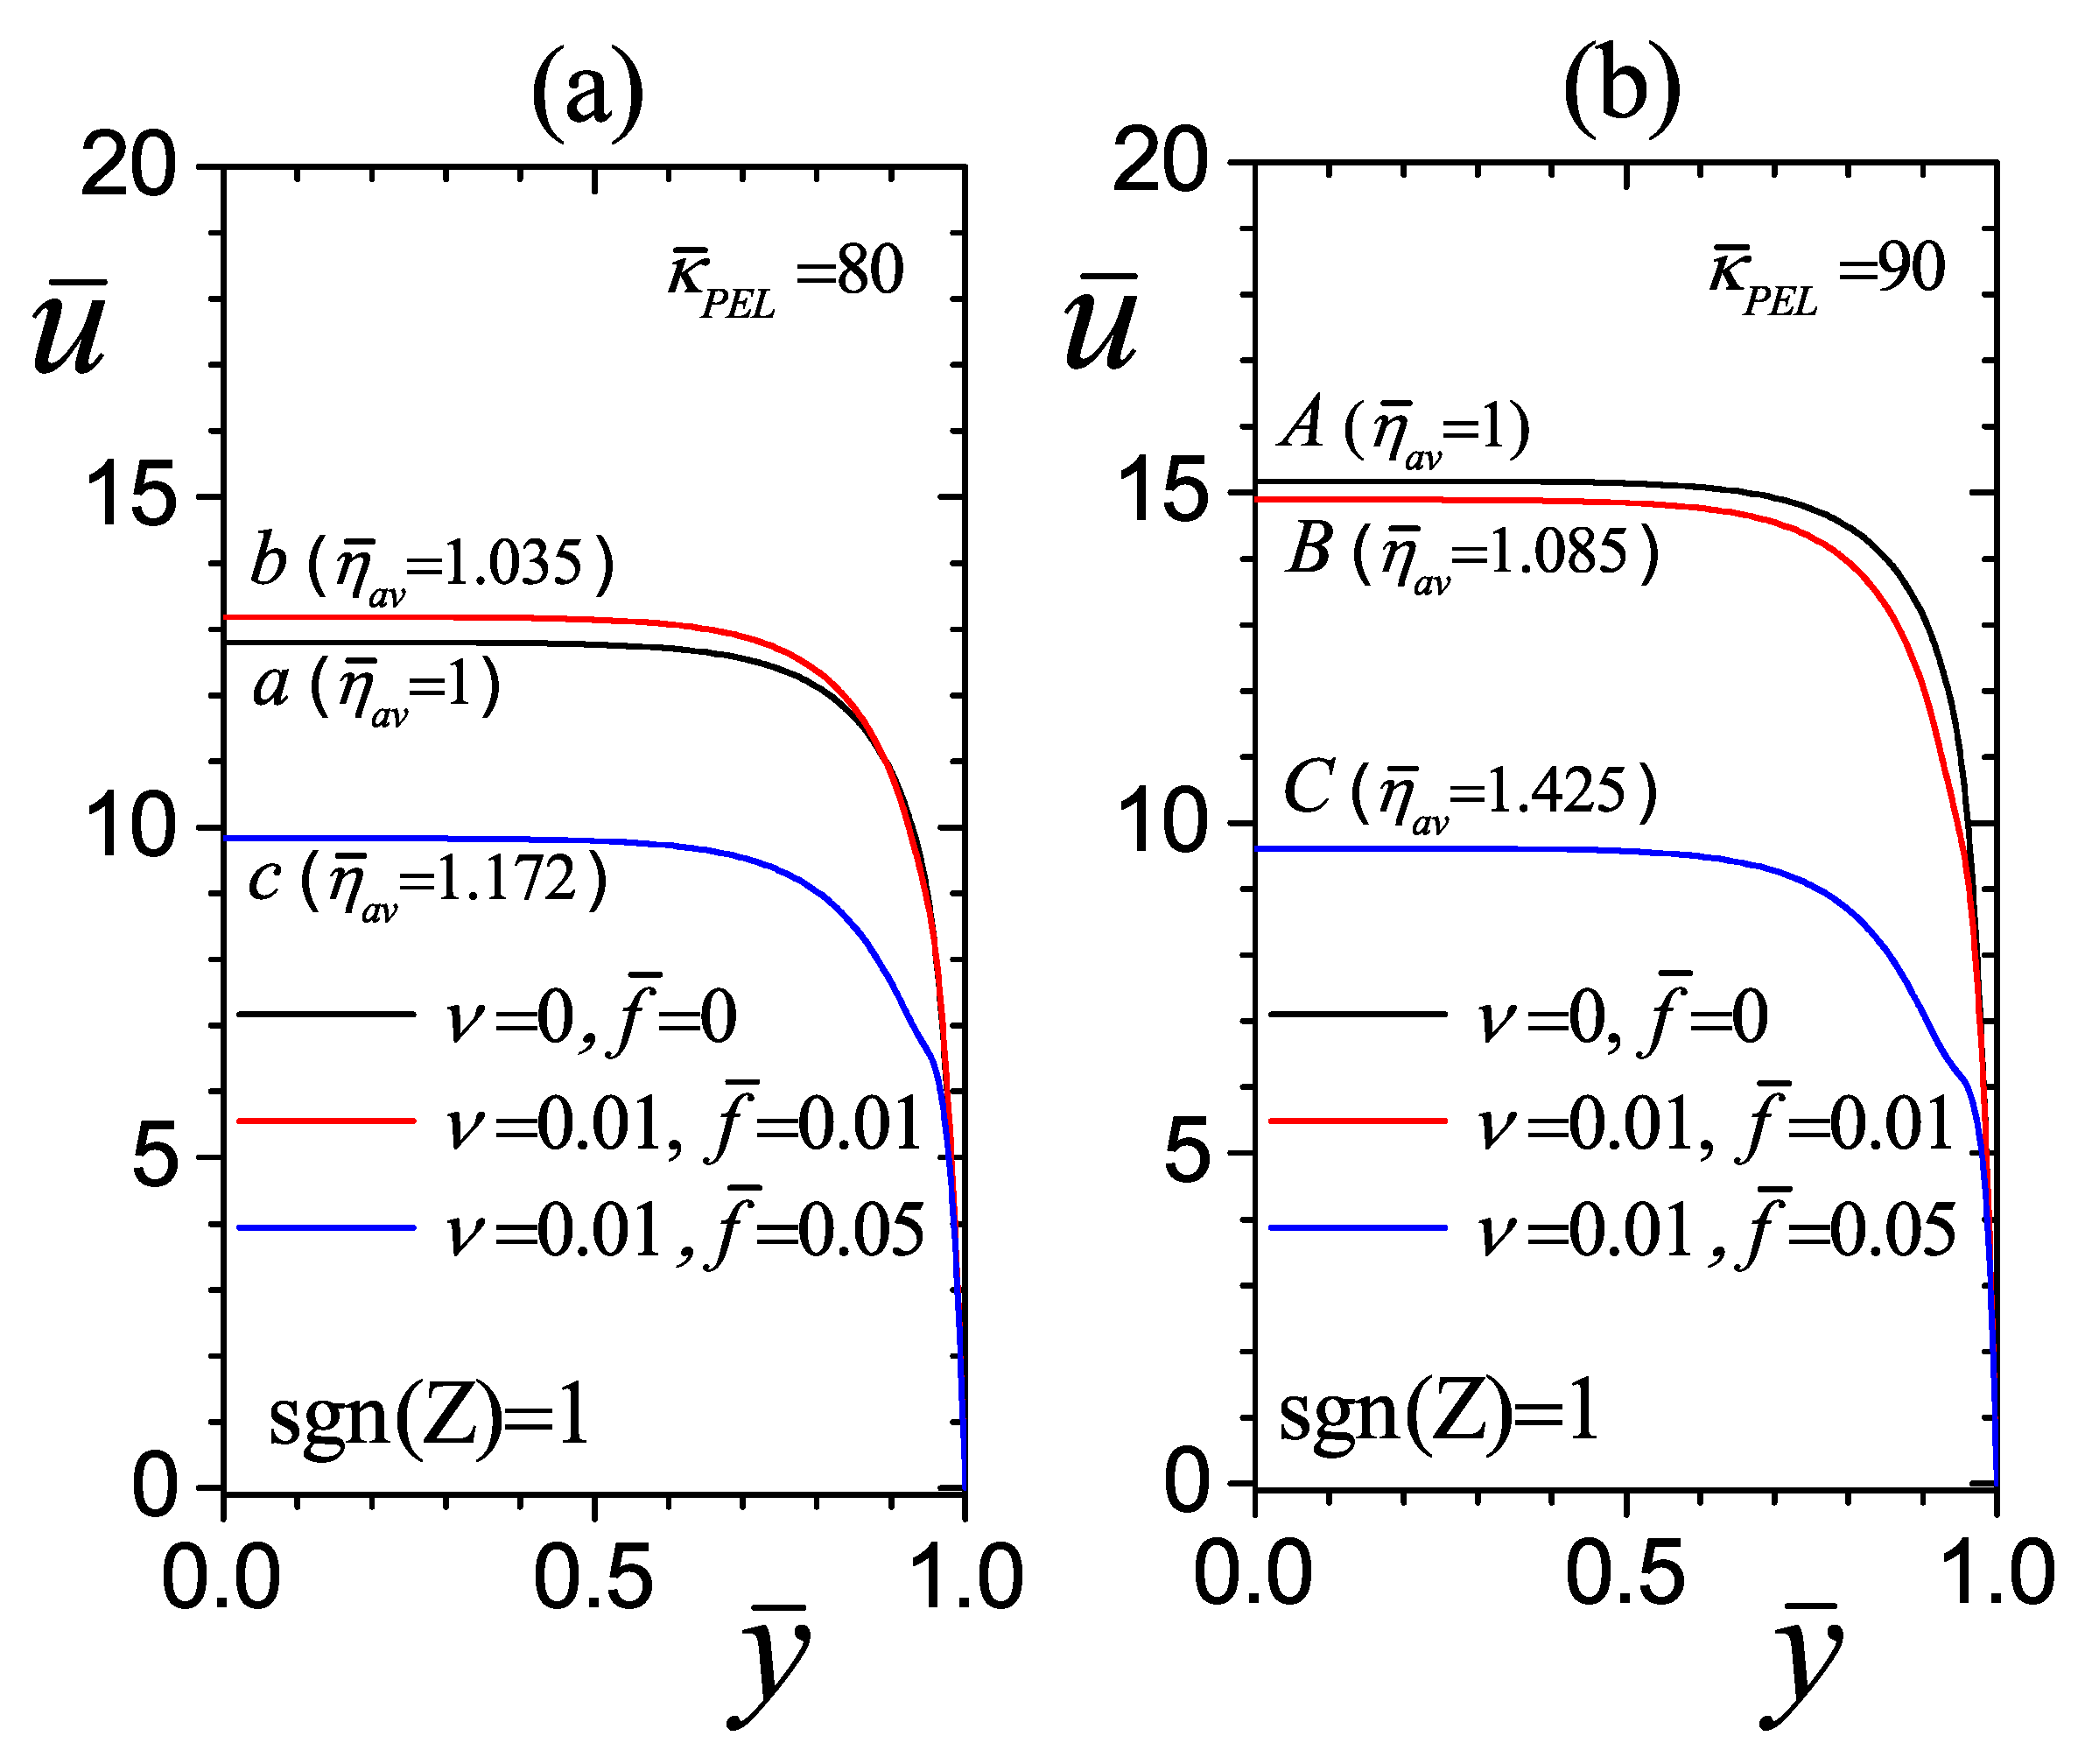
Figure 9 shows the hydrodynamic response of the fluid under different combinations of the steric effect and the viscoelectric coefficient. The results in this figure present the velocity profiles for points a, b, c (for κ ¯ P E L = 80 ) and A, B, C (for κ ¯ P E L = 90 ) from Figure 8. In Figure 9a, the velocities at y ¯ = 0 are u ¯ = 12.8 , 13.18 , and 9.83 for curves a, b, and c, respectively. These velocities result from the electric potential induced by the parameters κ ¯ P E L (=80) and ν (=0, 0.01), considering the viscosity change due to the viscoelectric coefficient f ¯ (=0, 0.01, 0.05). Analyzing curves a ( ν ¯ = 0 , f ¯ = 0 ) and b ( ν = 0.01 , f ¯ = 0.01 ), the slight increase in steric and viscoelectric effects in curve b improves the fluid velocity by 3 % compared to curve a. In this case, the steric effect predominates over the viscoelectric effect, generating a favorable flow despite the viscosity increase of 3.5 % (since η ¯ a v = 1 and 1.035 in curves a and b). This comparative analysis between curves a and b also confirms the results in Figure 4, since curves a and b (in this figure) and the velocity profiles with κ ¯ P E L = 80 in Figure 4b,e are the same. Meanwhile, comparing curves a ( ν = 0 , f ¯ = 0 ) and c ( ν = 0.01 , f ¯ = 0.05 ), the velocity in curve c decreases by 23 % compared to curve a. Here, the viscoelectric coefficient (considered high with f ¯ = 0.05 ) predominates over the steric effect ( ν = 0.01 ), significantly increasing the viscosity by 17.2 % (since η ¯ a v = 1 and 1.172 in curves a and c), thereby reducing the flow velocity. On the other hand, Figure 9b shows the velocity profiles for points A, B, and C, assuming a higher electric potential by varying κ ¯ P E L from 80 (in Figure 9a) to 90 (in this Figure 9b). The flow without steric and viscoelectric effects reflects the highest velocity at y ¯ = 0 with u ¯ = 15.18 in curve A. Then, as the steric effect increases slightly (from 0 to 0.01 ) and the viscoelectric coefficient increases significantly (from 0 to 0.01 and 0.05 ), and considering a high electric potential for κ ¯ P E L = 90 , the velocity in curve A decreases to u ¯ = 14.90 in curve B and u ¯ = 9.62 in curve C. This trend indicates that the viscoelectric coefficient ( f ¯ ) predominates over the steric effect ( ν ), resulting in a velocity decrease of 2 % and 39.11 % for curves B and C compared to curve A. The velocity decrease mentioned above is because the viscoelectric coefficient f ¯ (=0.01, 0.05) produces a viscosity increase of 8.5 % and 42.5 % for curves B and C (since η ¯ a v = 1.085 and 1.425 for curves B and C, while η ¯ a v = 1 in curve A), thereby decreasing the flow velocity compared to curve A. The analyzed results establish that controlled values of the ionic concentration of fixed charges within the PEL ( κ ¯ P E L ) favor the electroosmotic flow by amplifying the electric potential, even with combined steric ( ν ) and viscoelectric ( f ¯ ) effects.

4.4. Flow Rate

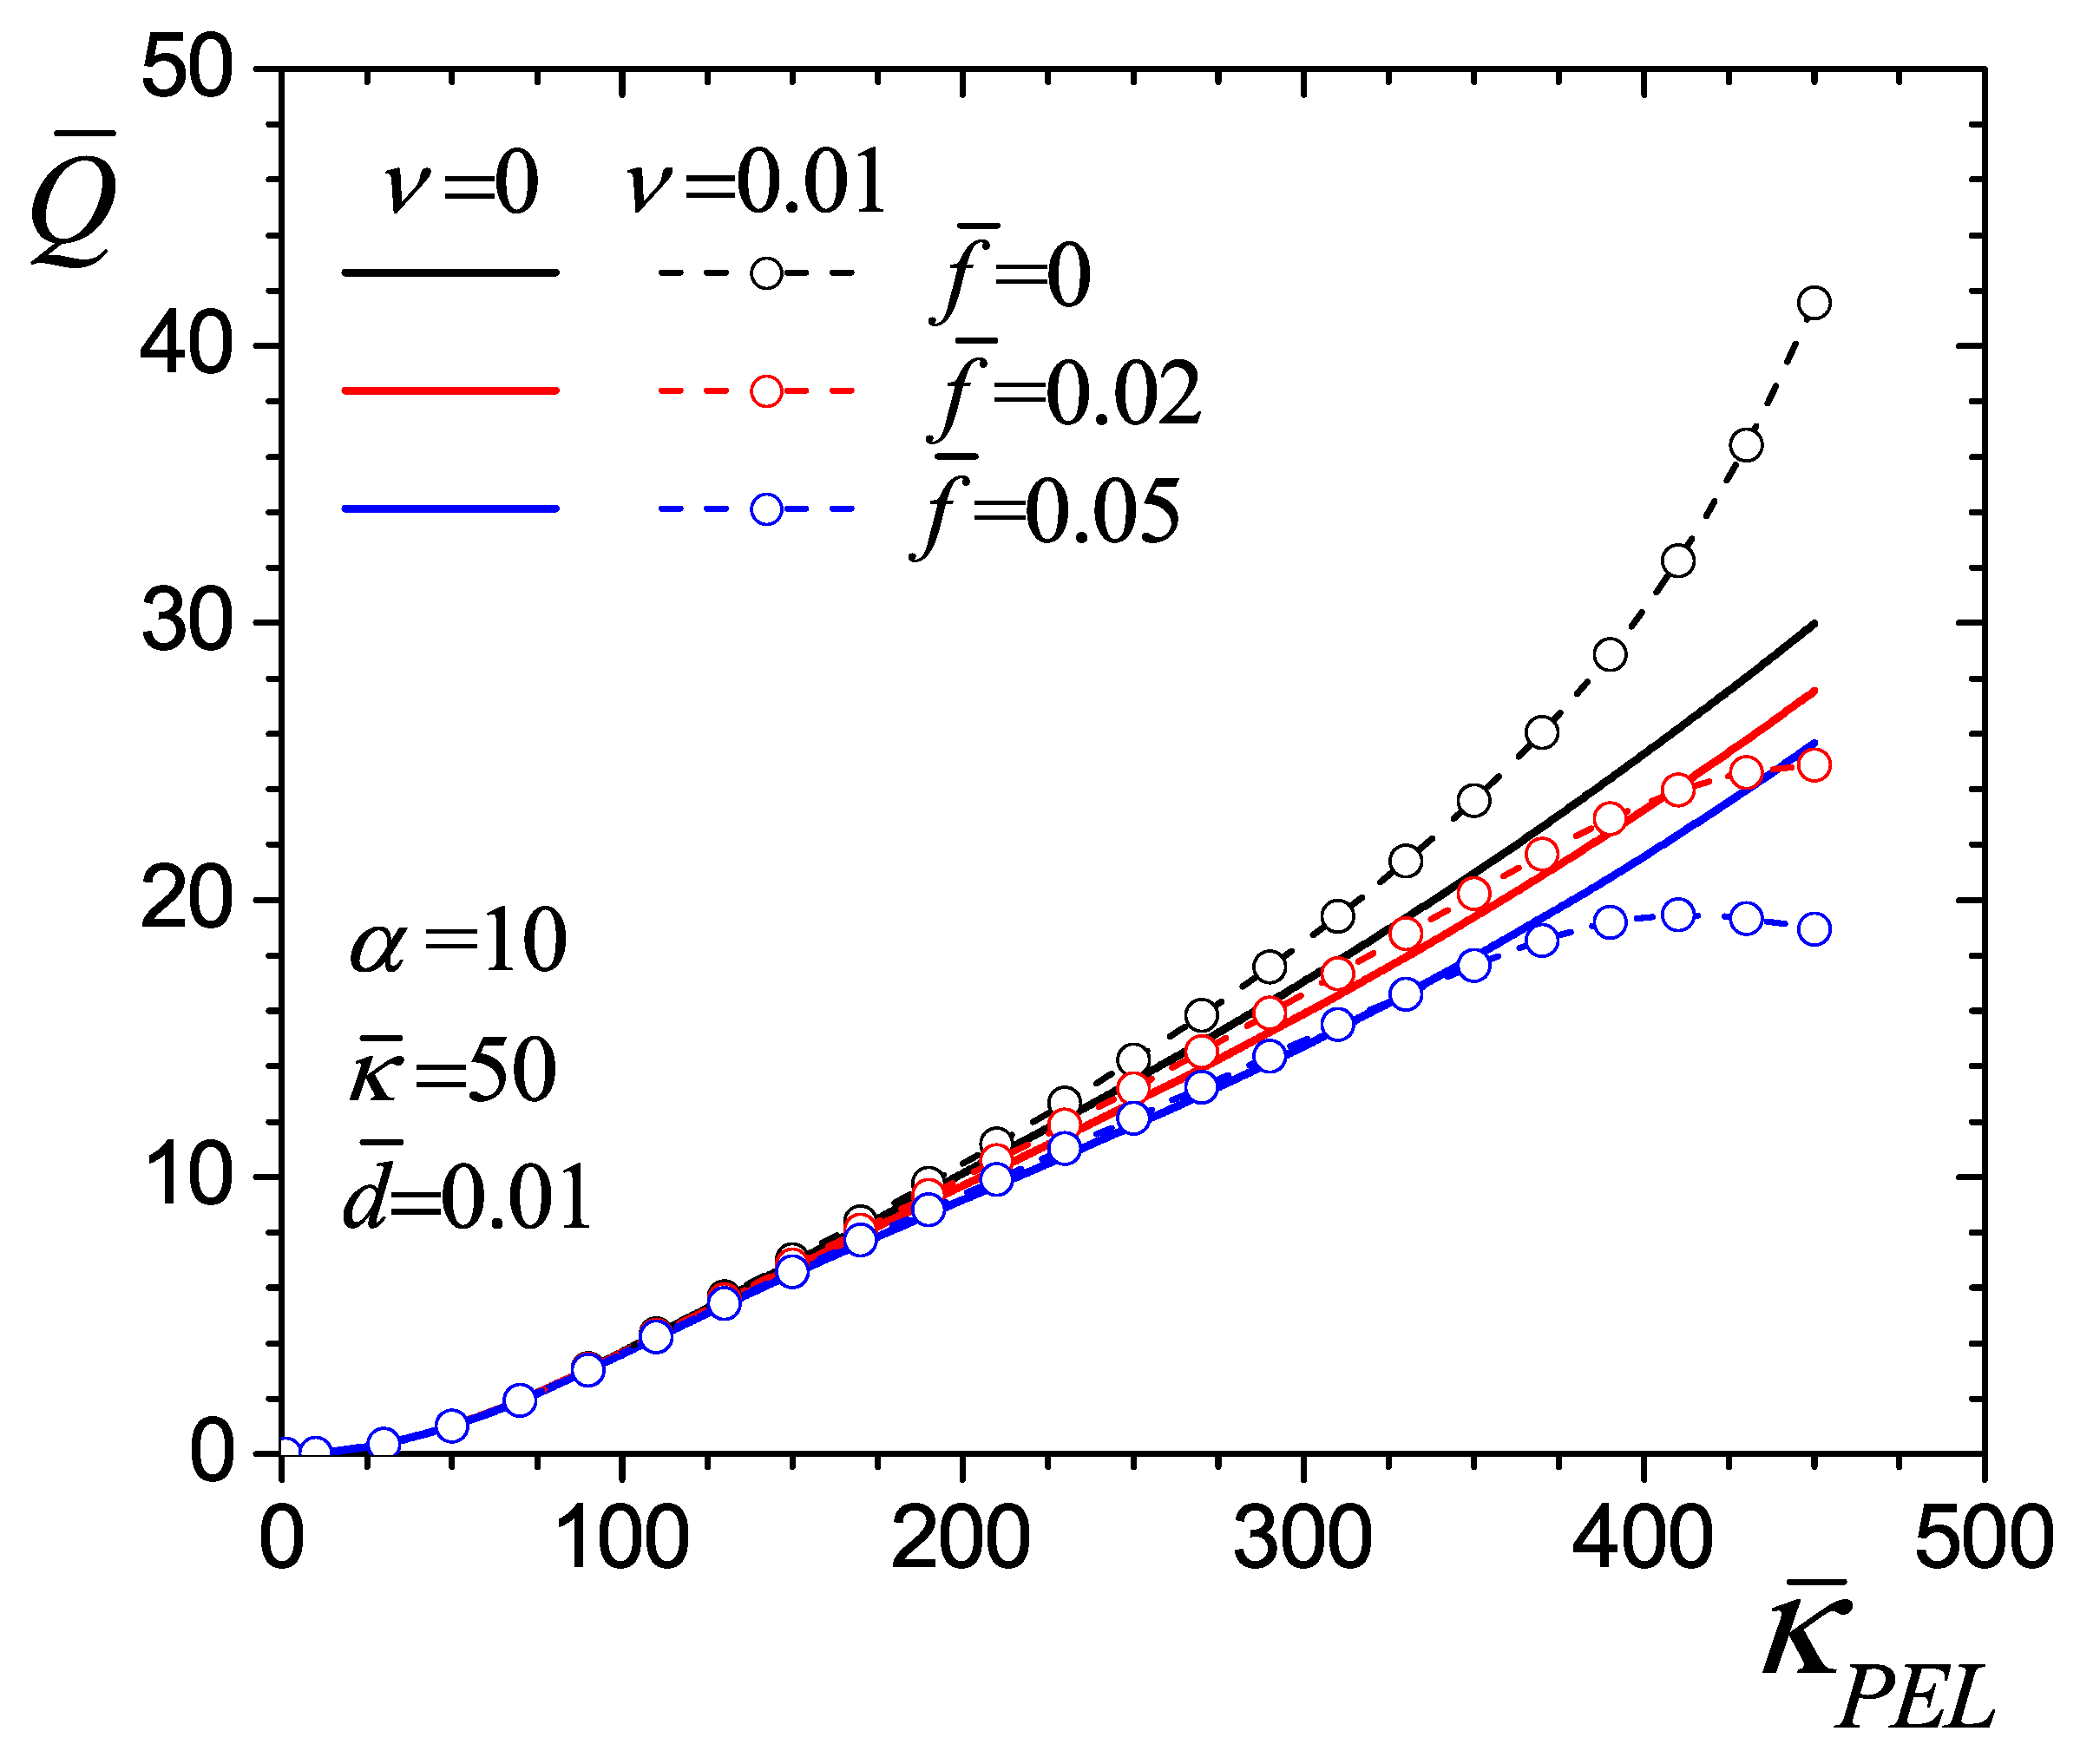
In Figure 10, Figure 11, Figure 12 and Figure 13, the flow rate takes into account that sgn ( Z ) = 1 . Therefore, Figure 10 presents the electroosmotic flow rate as a function of the electrokinetic parameter κ ¯ P E L with fixed values of α = 10 , κ ¯ = 50 , d ¯ = 0.01 , and combined values of the steric factor ν (=0, 0.01) and the viscoelectric coefficient f ¯ (=0, 0.02, 0.05). In this figure, the flow rate is independent of the steric factor and the viscoelectric coefficient up to an approximate value of κ ¯ P E L 112.5 (with a ratio of κ ¯ P E L / κ ¯ 2.25 ). For values greater than the κ ¯ P E L mentioned above (i.e., by increasing significantly the ionic concentration of fixed charges in the PEL), the lines begin to separate to show the electrostatic effects within the EDLs on the flow. This behavior is because the ratios κ ¯ P E L / κ ¯ > 1 guarantee higher electric potentials, thereby magnifying the influence of steric and viscoelectric effects (see Figure 4). The flow rate with κ ¯ P E L = 450 reaches the following values: Q ¯ = 29.98 , 27.54 , 25.65 for f ¯ = 0 , 0.02 , 0.05 without steric effect, and Q ¯ = 41.55 , 24.86 , 18.95 for f ¯ = 0 , 0.02 , 0.05 with steric effect. For all solid lines without steric effect ( ν = 0 ), the flow rate increases as the parameter κ ¯ P E L increases. Additionally, for these same lines, the velocity decreases due to the increase in viscosity attributed to the viscoelectric effect. These variations in flow are evident when comparing the flow rate delivered by the electroosmotic flow of the solid black line ( f ¯ = 0 ) to the solid red and blue lines ( f ¯ = 0.02 and 0.05 ). On the other hand, the dashed lines with symbols examine the influence of the steric factor ( ν = 0.01 ) on the flow rate. In the first subcase represented by the dashed black line with symbols, and with a value of f ¯ = 0 , the flow rate exhibits an exponential trend as the electrokinetic parameter of the PEL ( κ ¯ P E L ) increases. This trend occurs because the steric effect, in the absence of the viscoelectric effect, significantly increases the flow velocity as the ratio of κ ¯ P E L / κ ¯ rises (see Figure 4). In the other two subcases of the dashed red line with symbols ( ν = 0.01 and f ¯ = 0.02 ) and the dashed blue line with symbols ( ν = 0.01 and f ¯ = 0.05 ), the combined steric and viscoelectric effects are balanced, increasing the flow rate up to an approximate value of κ ¯ P E L 350 and κ ¯ P E L 275 , respectively. After these values of κ ¯ P E L , the viscoelectric effect ( f ¯ ) predominates over the steric effect ( ν ), reducing the flow rate in both cases. This result is because as the parameter κ ¯ P E L increases, the ratio of κ ¯ P E L / κ ¯ also increases.
At the same time, the electric potential within the EDL of the electrolyte increases, significantly magnifying the viscosity and the resistance to flow. This analysis establishes that the increase in the parameter κ ¯ P E L and the inclusion of the steric factor ν > 0 generate higher electric potentials that enhance the electroosmotic flow up to a threshold value. However, further increases induce viscoelectric effects when f ¯ > 0 , which significantly raises the local viscosity, resulting in a net reduction in the flow rate.
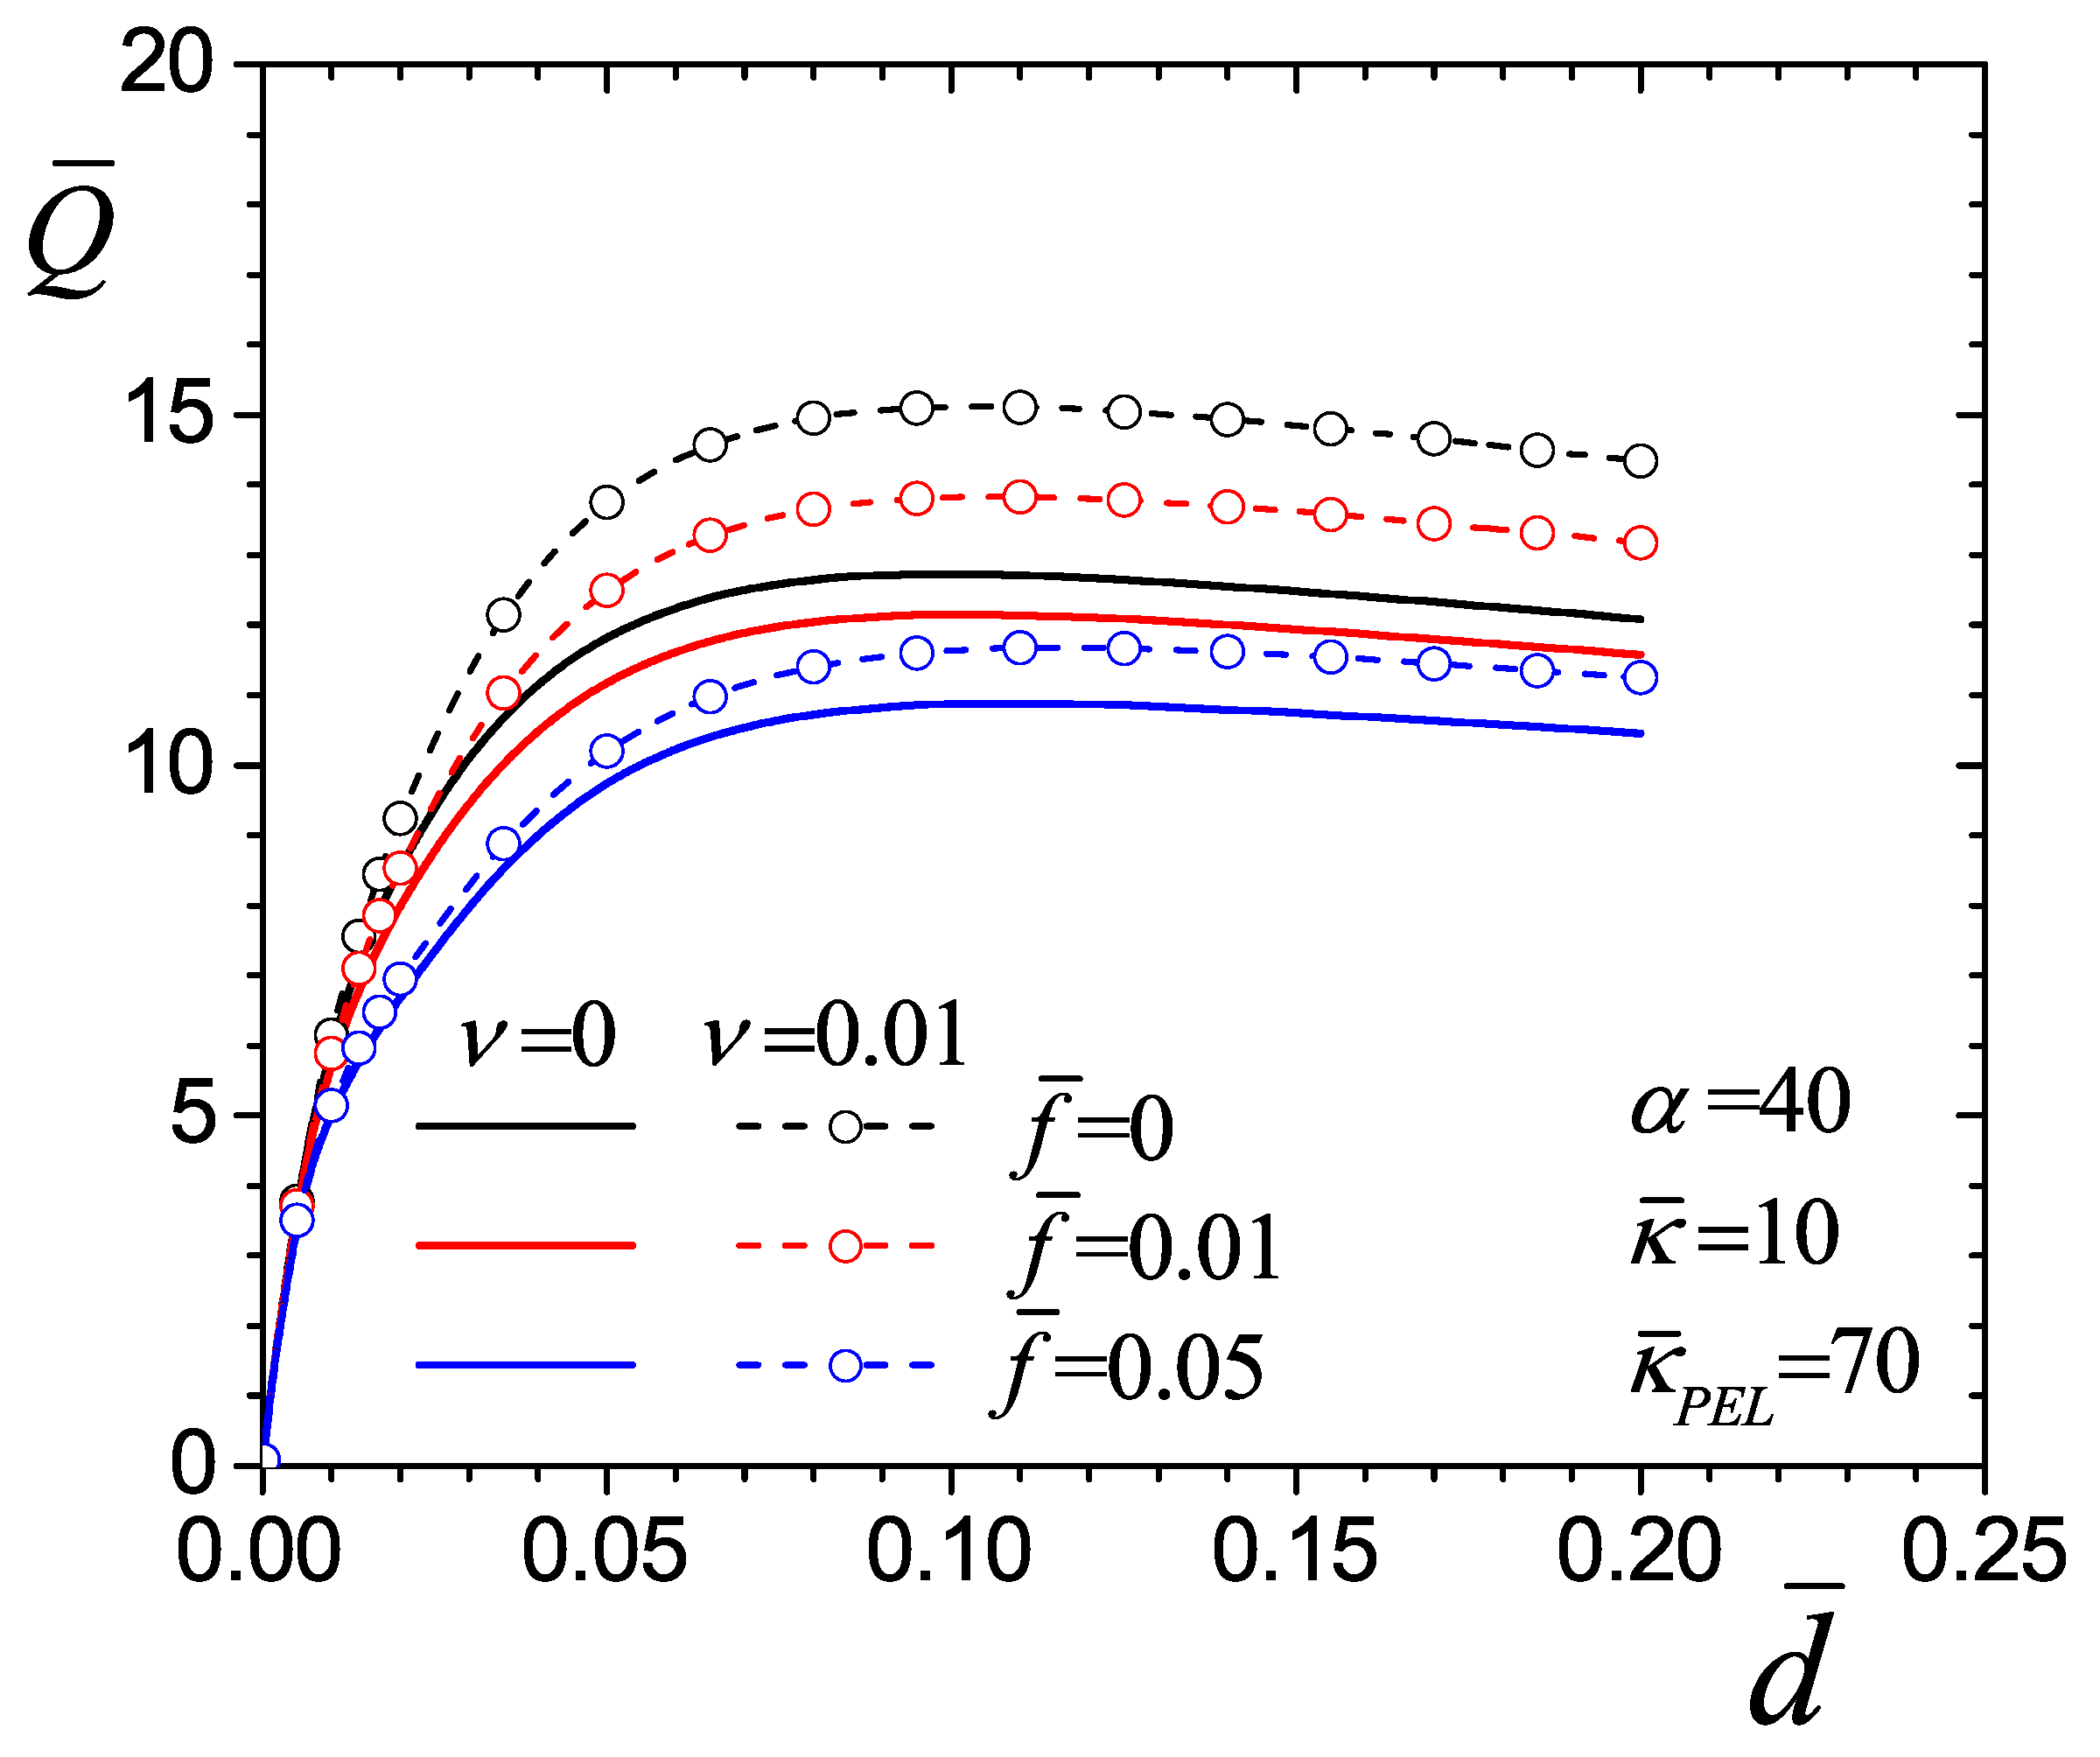
Figure 11 shows the electroosmotic flow rate as a function of the dimensionless thickness of the PEL d ¯ for combined values of the steric factor ν (=0, 0.01) and the viscoelectric coefficient f ¯ (=0, 0.01, 0.05), and with fixed values of α = 40 , κ ¯ = 10 , and κ ¯ P E L = 70 . In general, the flow rates result from the competition between electroosmotic and frictional forces. For this parameter combination, increases in the steric effect ν (=0, 0.01) and the PEL thickness d ¯ ( from 0 to 0.25 ) contribute to the electroosmotic forces, assuming that both parameters increase the electric potential. Meanwhile, the viscoelectric coefficient f ¯ (=0.01, 0.05) associated with the fluid viscosity increases the frictional forces. To explain the phenomena mentioned above, the flow rate increases monotonically with the PEL thickness, reaching a maximum value at d ¯ 0.1 of Q ¯ = 12.73 , 12.14 , 10.88 for f ¯ = 0 , 0.01 , 0.05 without steric effect, and Q ¯ = 15.11 , 13.83 , 11.67 for f ¯ = 0 , 0.01 , 0.05 with steric effect. Subsequently, the flow rate decreases linearly as the PEL thickness continues to grow. The increase in flow rate with the PEL thickness is due to the increasing accumulation of fixed charges on the polyelectrolyte brushes, as well as the corresponding accumulation of free charges inside and outside the PEL, which increases the electric potential across the channel cross-section. However, frictional forces due to the porous matrix of the PEL (via the drag parameter α ) affect electroosmotic forces. Once the flow rate reaches its maximum value at d ¯ 0.1 , its magnitude decreases linearly because the friction forces contrary to the flow increase with the PEL thickness (as reported through velocity profile analysis in Refs. [26,60]). In Figure 11, by increasing the electric potential through the steric factor ν from 0 to 0.01 , the flow rate at d ¯ 0.1 increases 18.69 % for f ¯ = 0 , 13.92 % for f ¯ = 0.01 , and 7.26 % for f ¯ = 0.05 . On the contrary, for the same flow rate at d ¯ 0.1 , the friction forces, due to the viscosity increase by the viscoelectric coefficient, decrease the flow rate with ν = 0 and f ¯ = 0 (solid black line) by 4.63 % with f ¯ = 0.01 and 14.53 % with f ¯ = 0.05 . Likewise, the flow rate at d ¯ 0.1 with ν = 0.01 and f ¯ = 0 (dashed black line) decreases by 8.47 % with f ¯ = 0.01 and 22.76 % with f ¯ = 0.05 . On the other hand, Figure 11 also shows that for the selected value of κ ¯ P E L / κ ¯ = 7 (high electric potentials), the steric and viscoelectric effects become evident as the PEL thickness increases, especially from d ¯ 0.005 . The previous analysis concludes that increasing both the PEL thickness ( d ¯ ) and the steric effect ( ν ) favors electroosmotic pumping, considering that both parameters magnify the electric potential. Meanwhile, increasing the viscoelectric coefficient ( f ¯ ) leads to an increase in viscosity, reinforcing the frictional forces that oppose the flow.
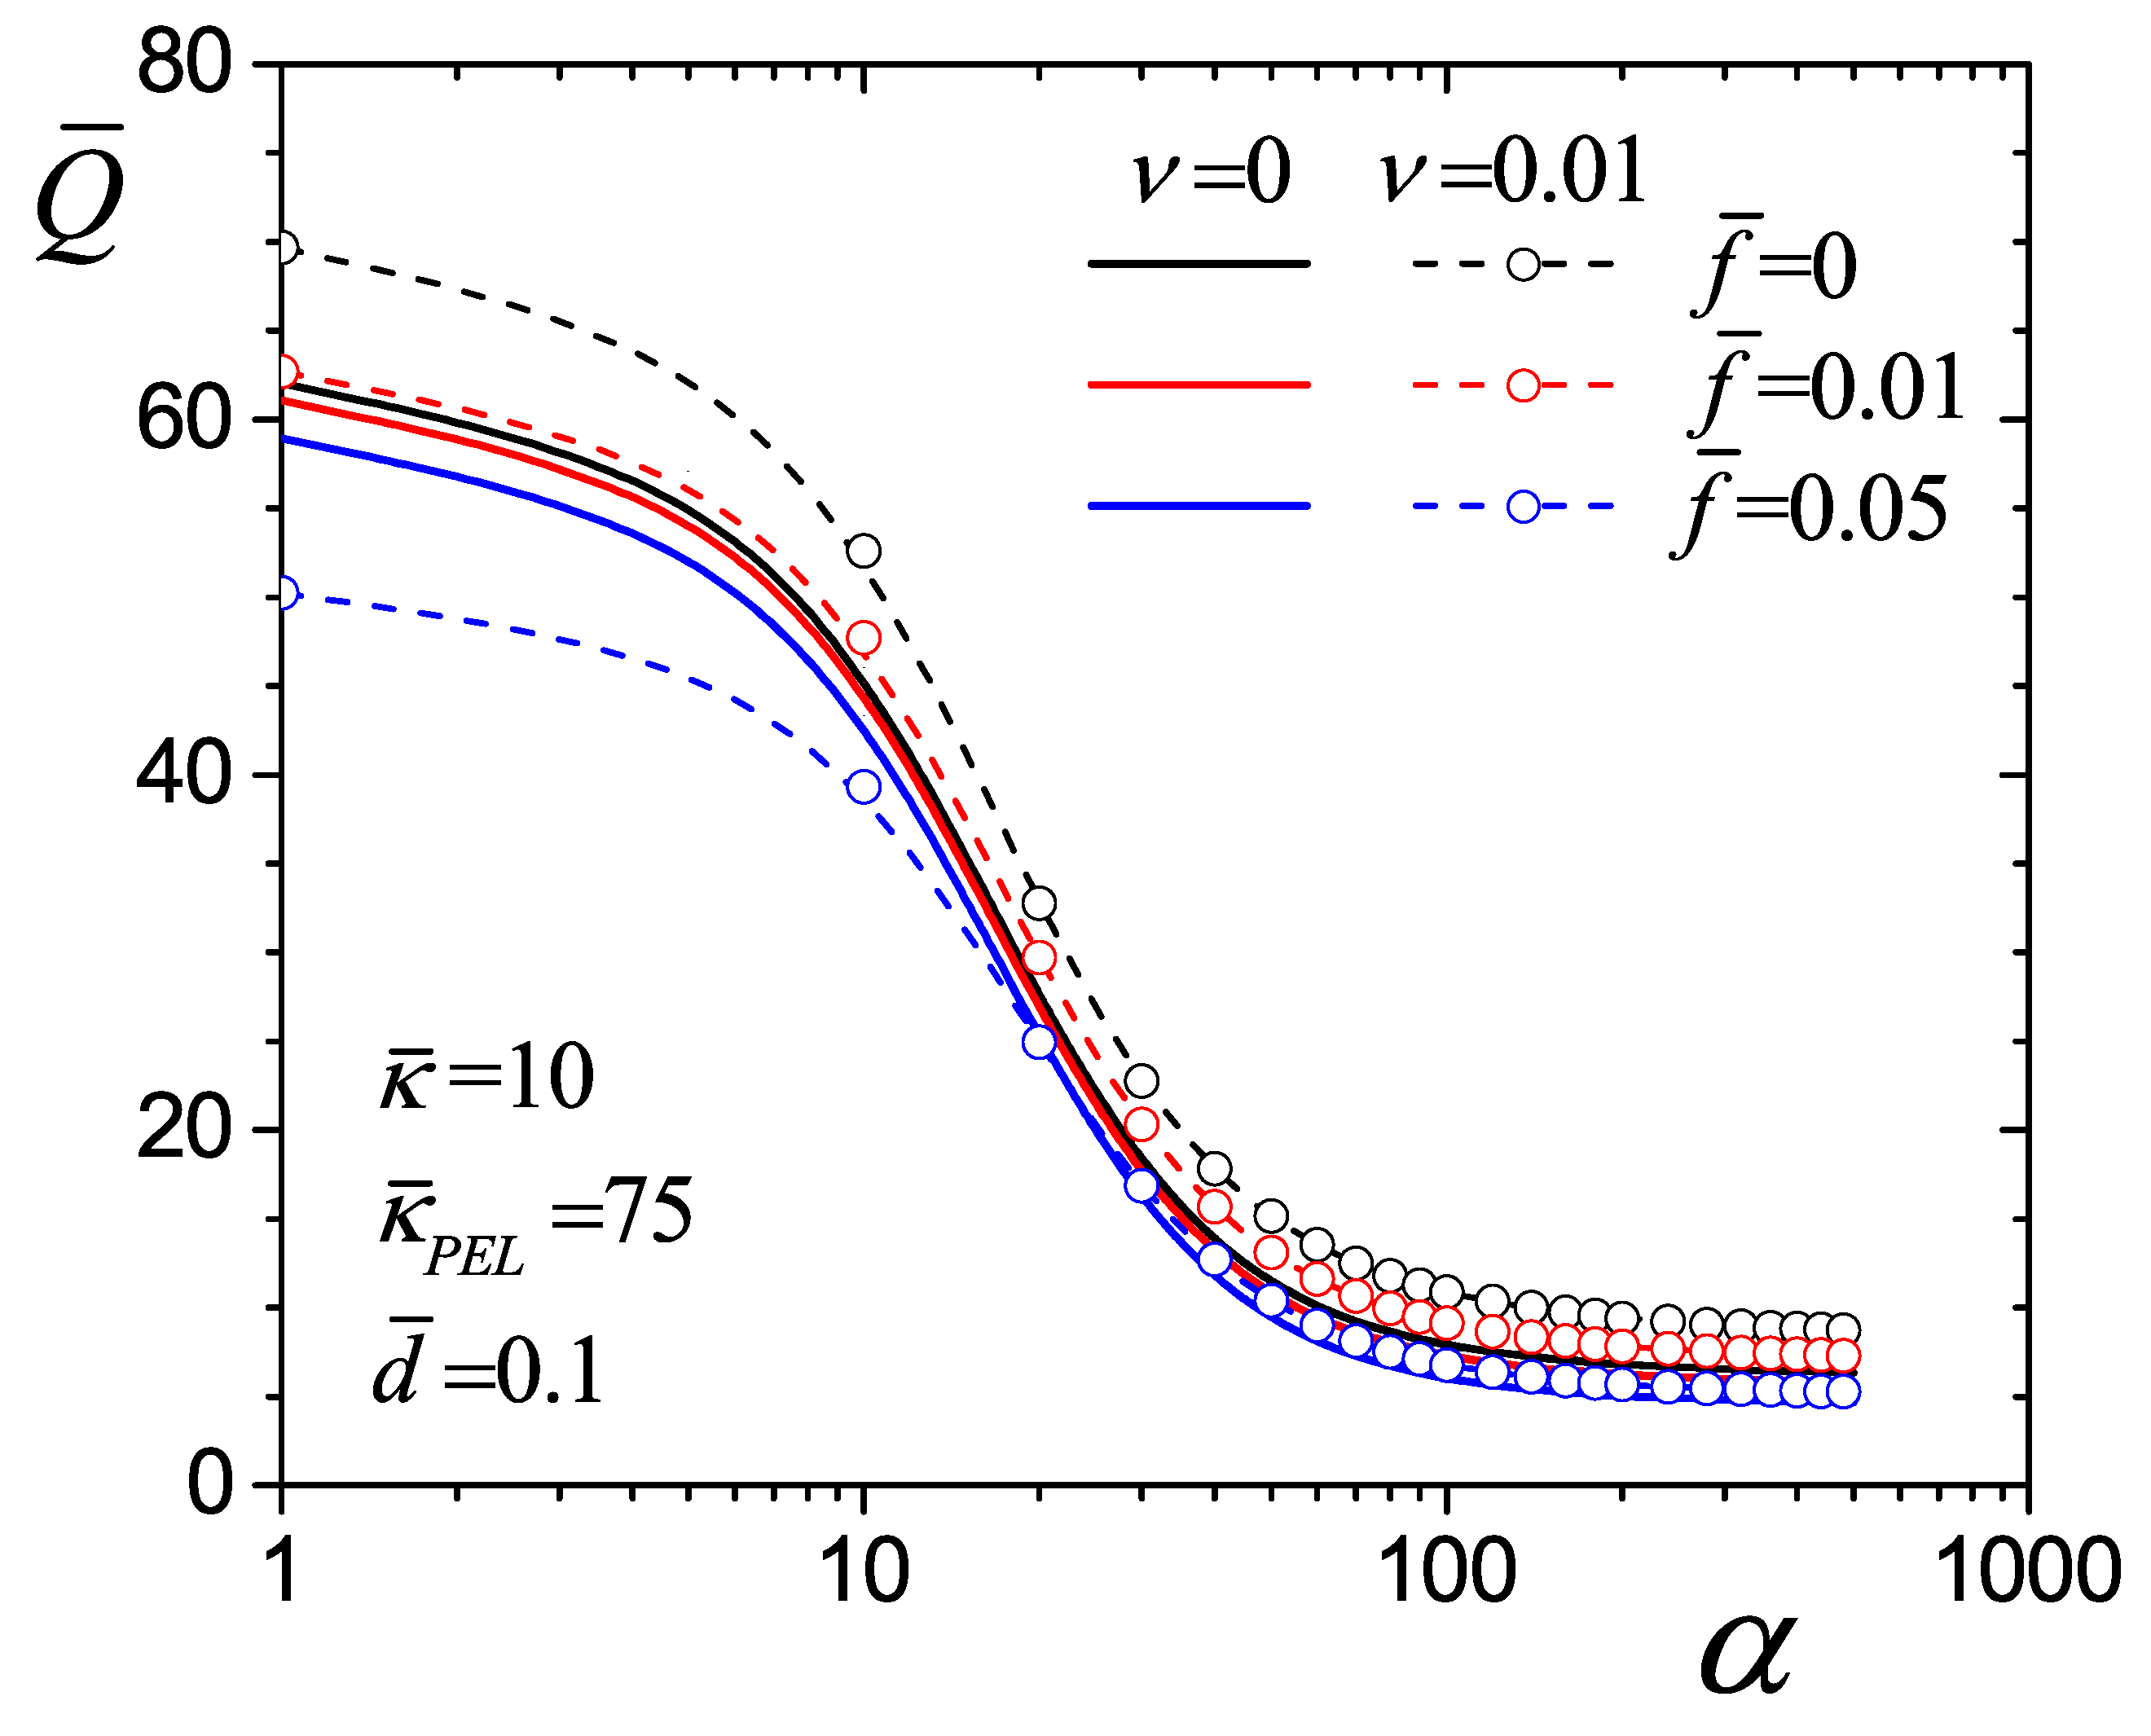
Figure 12 shows the electroosmotic flow rate as a function of the drag parameter α for combined values of the steric factor ν ( = 0 , 0.01 ) and the viscoelectric coefficient f ¯ (=0, 0.01, 0.05). The graph shows the other dimensionless parameters. In this figure, the increase in the drag coefficient produces a reduction in the flow rate. For example, the flow rates at α = 1 are Q ¯ (=62.04, 61.1, 58.95) for f ¯ (=0, 0.01, 0.05) with ν (=0), and Q ¯ (=69.71, 62.71, 50.22) for f ¯ (=0, 0.01, 0.05) with ν (=0.01). Then, these values at α = 20 decrease to Q ¯ (=27.54, 26.8, 25.24) for f ¯ (=0, 0.01, 0.05) with ν (=0), and Q ¯ (=32.78, 29.7, 24.93) for f ¯ (=0, 0.01, 0.05) with ν (=0.01). These reductions in flow are understandable because an increased density and complexity of the porous matrix formed by the polyelectrolyte brushes within the PEL increase the resistance that the flow offers. This resistance is transmitted from the PEL to the rest of the fluid at the interface that divides them. The values of α correspond to a completely dense porous matrix with a maximum friction effect that no longer influences the flow rate. Under these conditions, a highly dense and intricate structure of the porous matrix in the PEL counteracts the electroosmotic flow improvements achieved by the increased electrical potential via the fixed ions in the PEL itself. Also, in all cases, the increase in viscosity due to the electric field via the viscoelectric coefficient ( f ¯ ) decreases the flow rate. At α = 1 , the flow rate with ν = 0 and f ¯ = 0 (solid black line) decreases by 1.5 % and 4.9 % when f ¯ increases to 0.01 and 0.05 , as well as the flow rate with ν = 0.01 and f ¯ = 0 (dashed black line) decreases by 10 % and 27.9 % when f ¯ increases to 0.01 and 0.05 . Furthermore, by comparing the flow rate with ν = 0.01 and f ¯ = 0 (dashed black line) at α = 1 and 20, the flow rate decreases by 52.97 % due to the drag effect. Thus, the increase in the viscosity of the pumped fluid provides an additional resistance to flow along with the drag parameter α . On the other hand, in Figure 4, Figure 6 and Figure 7 (with f ¯ = 0 ), increasing the steric factor from ν = 0 to ν = 0.01 increases the electric potential and the flow velocity. As a result, the flow rate in Figure 12 increases when comparing the dashed black line with symbols to the solid black line. However, for the cases with f ¯ = 0.01 (dashed red line with symbols) and f ¯ = 0.05 (dashed blue line with symbols), the increase in potential and electric field within the EDLs with ν = 0.01 magnifies the viscosity by the viscoelectric effect, significantly reducing the flow rate at moderate values of α (<20). According to the previous analysis, increasing the drag parameter α favors friction forces through the porous matrix of the PEL, which reduces flow. Moreover, the steric and viscoelectric effects diminish as α , where the friction offered by the PEL predominates.
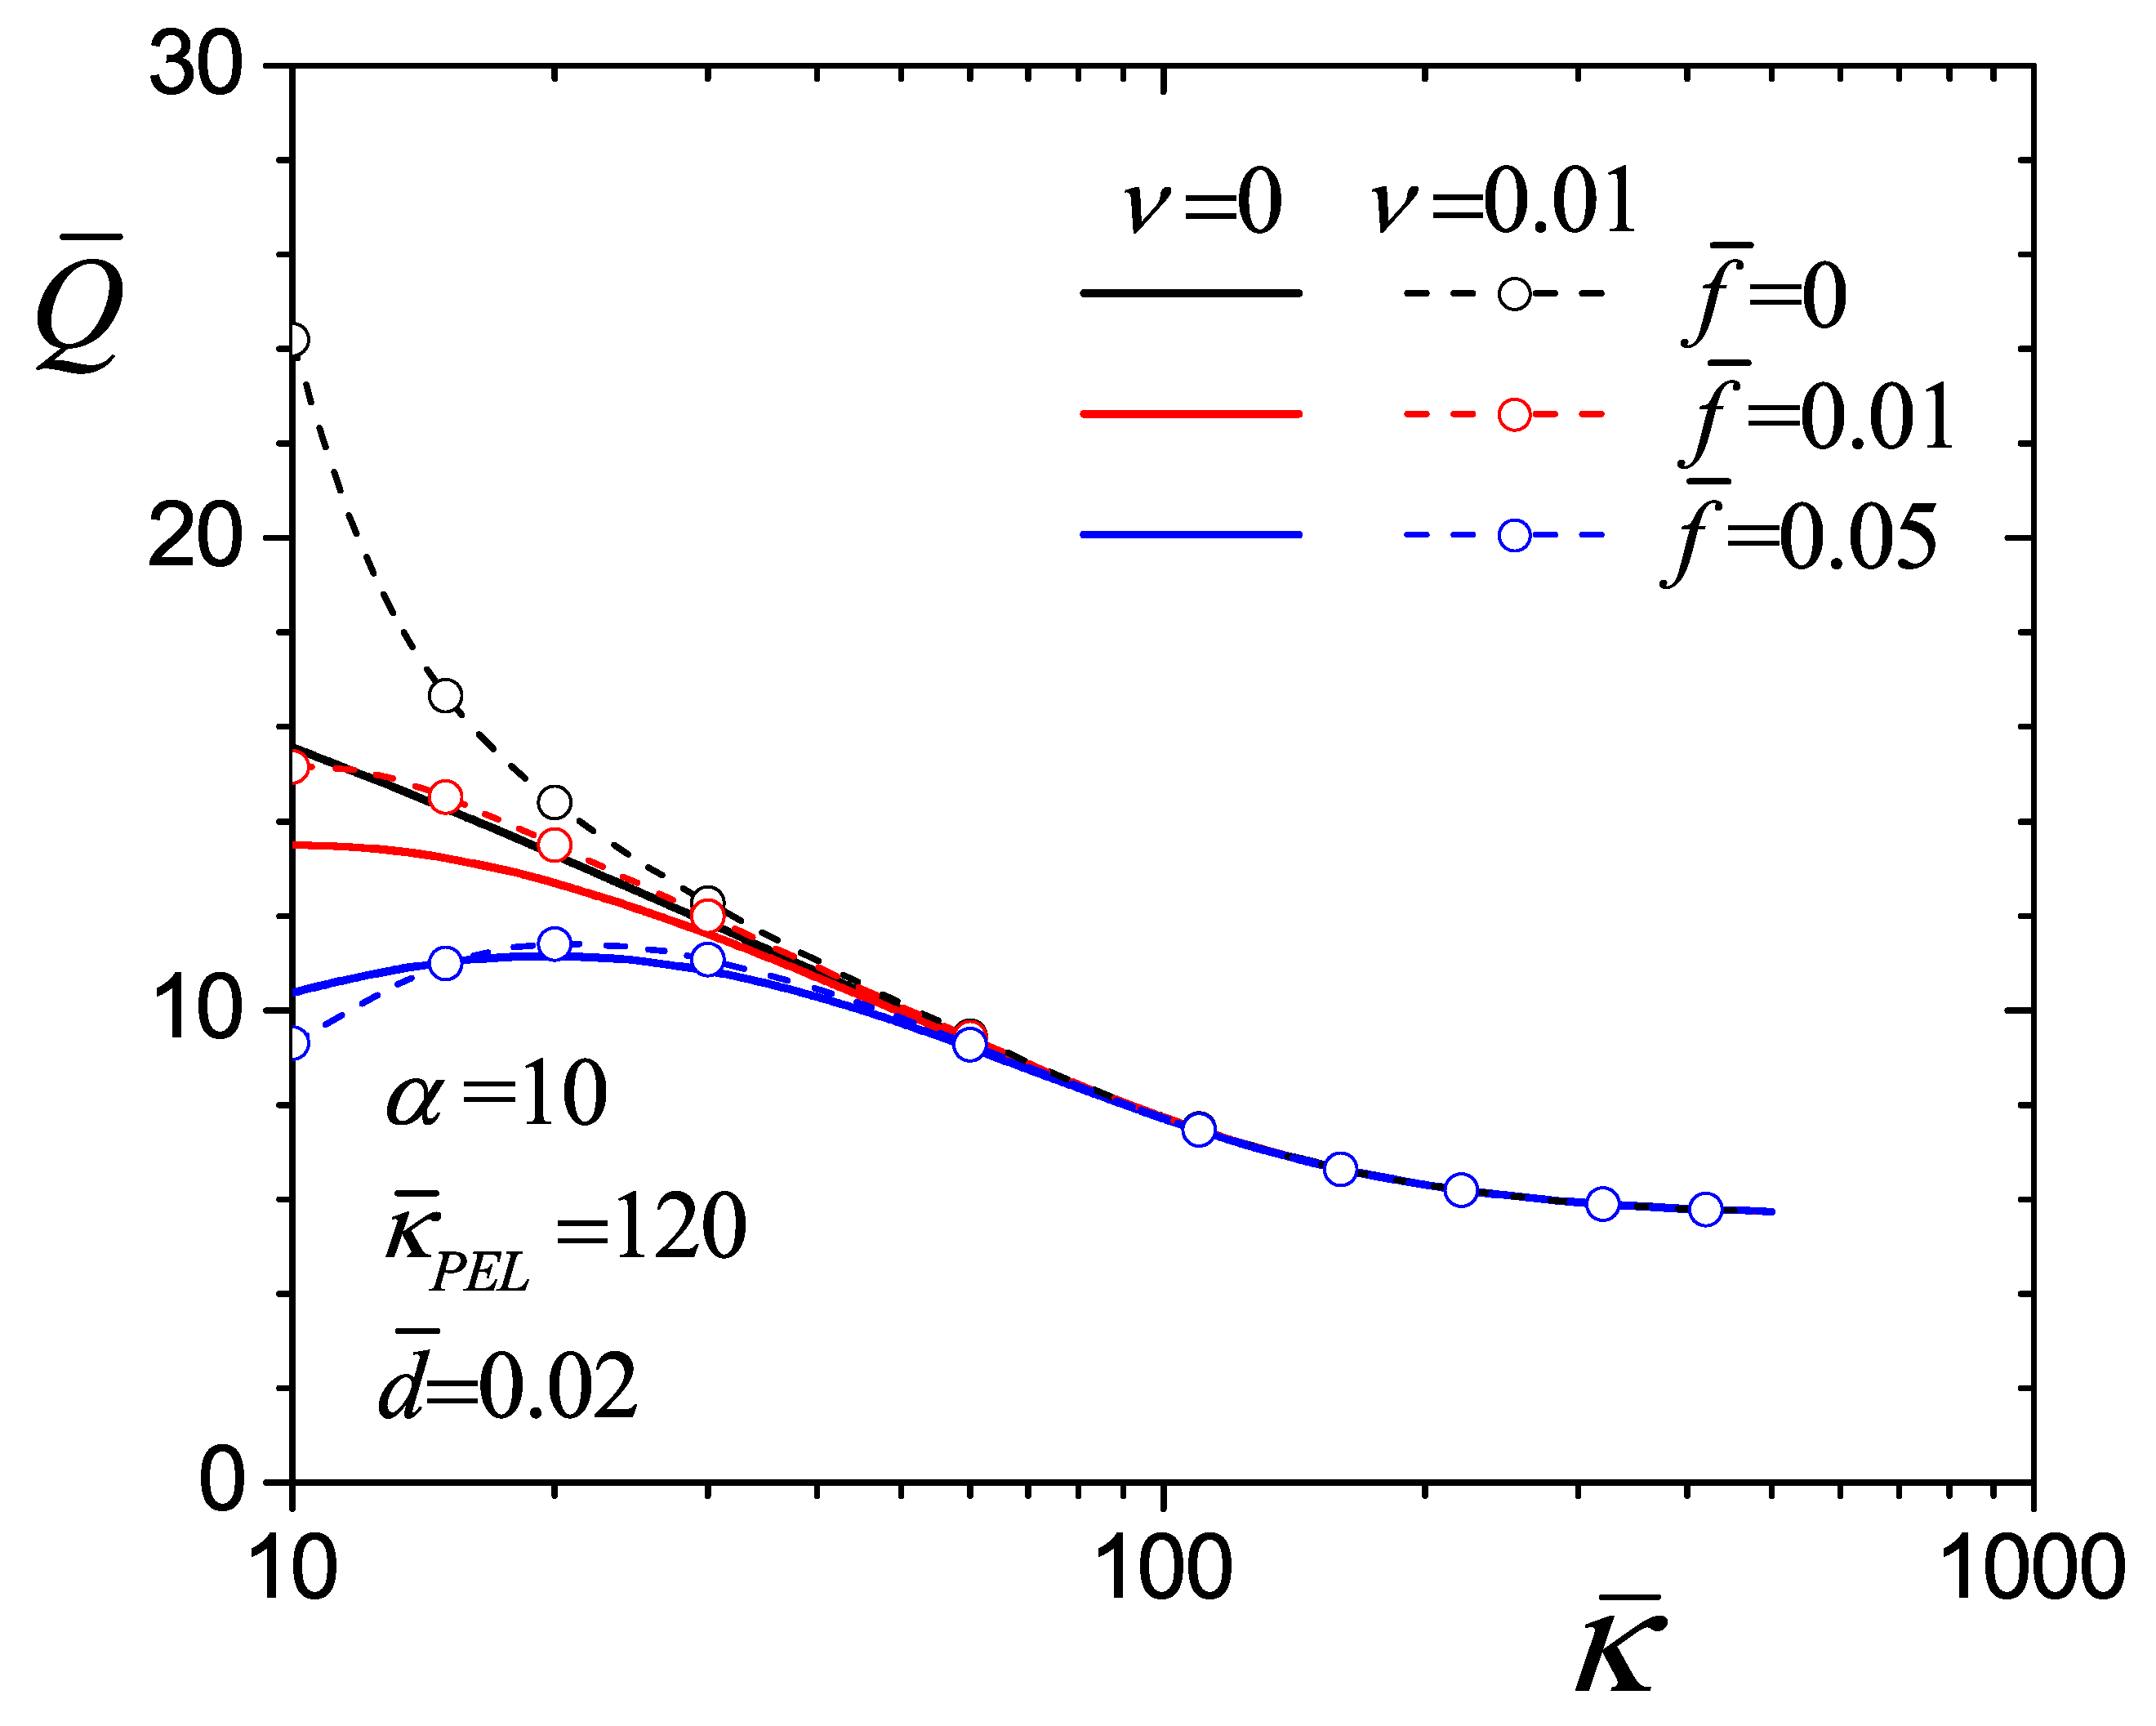
Finally, Figure 13 presents the dimensionless electroosmotic flow rate as a function of the electrokinetic parameter κ ¯ with fixed values of α = 10 , κ ¯ P E L = 120 , d ¯ = 0.02 , and combined values of the steric factor ν (=0, 0.01) and the viscoelectric coefficient f ¯ (=0, 0.01, 0.05). In this graph, the range from κ ¯ = 10 (equivalent to κ ¯ P E L / κ ¯ = 12 ) to κ ¯ = 80 (equivalent to κ ¯ P E L / κ ¯ = 1.5 ) leads to high electric potential distributions (see Figure 4), where the steric and viscoelectric effects manifest variations in flow rate. Also, in this range, the debye length is thinner in the PEL than in the electrolyte ( κ ¯ P E L 1 < κ ¯ 1 ) due to a higher concentration of fixed ions than free ions, which increases the flow rate. For κ ¯ P E L / κ ¯ < 1.5 (equivalent to κ ¯ > 80 or κ ¯ ), the dimensionless Debye length in the electrolyte tends to be thinner than in the PEL ( κ ¯ 1 < κ ¯ P E L 1 ), resulting in low electrical potentials that reduce flow rates. In this condition, the steric and viscoelectric effects are practically negligible. From the above, it is possible to deduce that the effectiveness of the polyelectrolyte layer (PEL) to increase the flow rate (or flow velocity, see Figure 4) depends on the ratio κ ¯ P E L / κ ¯ > 1 .
On the other hand, in Figure 13, the flow rate Q ¯ = 15.56 at κ ¯ = 10 with ν = 0 and f ¯ = 0 (solid black line) decreases to 13.49 and 10.37 when the viscoelectric coefficient increases to f ¯ = 0.01 and f ¯ = 0.05 . For the case of ν = 0 and f ¯ = 0 (represented by the solid black line), the flow rate decreases linearly in the range of 10 κ ¯ 80 . However, when ν = 0 and f ¯ = 0.05 (illustrated by the solid blue line), the flow rate exhibits a nonlinear parabolic behavior, reaching a maximum flow rate of Q ¯ = 11.15 at κ ¯ = 20 . This behavior is due to the increase in electric potential as κ ¯ approaches 10 (see Figure 4), which causes an increase in the EDL thickness relative to the channel height. Consequently, the viscoelectric effects influence a larger channel cross-section, resulting in a reduction in flow rate. By exceeding the maximum flow rate Q ¯ = 11.15 (for the solid blue line) at κ ¯ = 20 , any further increase in κ ¯ decreases the flow rate, mainly due to the reduction in the electric potential. Therefore, this nonlinear behavior of the flow rate appears for relatively small values of the parameter κ ¯ (when κ ¯ P E L / κ ¯ > 1 to ensure high potentials) and high values of the viscoelectric coefficient f ¯ . Additionally, the individual influence of the steric factor with ν = 0.01 (considering f ¯ = 0 ) in the range 10 κ ¯ 80 produces an exponential increase in the flow rate as the electric potential grows as κ ¯ approaches 10 (see the dashed black line with symbols in Figure 13, and Figure 4 for the results of the electric potential and the flow velocity as a function of the ratio of κ ¯ P E L / κ ¯ and the steric factor). However, the combined effect of ν and f ¯ 0 modifies the flow rate produced by the electroosmotic flow when high potentials and high values of the viscoelectric coefficient coexist (see the dashed red and blue lines with symbols). For the highest value of f ¯ = 0.05 , the viscoelectric effect ( f ¯ ) predominates over the steric effect ( ν ), significantly reducing the flow rate (compare the dashed black and blue lines with symbols). The previous analysis establishes that the ratio κ ¯ P E L / κ ¯ > 1 is crucial to enhance the electroosmotic flow, assuming that this ratio ensures high electric potentials near the walls. In the low electric potential regime, which occurs when κ ¯ increases, the steric and viscoelectric effects are practically negligible.

5. Conclusions

This study analyzed electroosmotic flow under the combined influence of viscoelectric and steric effects in a soft channel with a polyelectrolyte coating. The results indicate that the thickness of the polyelectrolyte layer (PEL) and the ionic concentration of fixed charges on polyelectrolyte brushes provide an excellent method to control both the electric potential across the channel cross-section and the behavior of the electroosmotic flow. In addition, to achieve a significant increase in flow rate, the ionic concentration of fixed charges in the PEL must be greater than that of the charges in the transported electrolyte; otherwise, the effectiveness of the PEL is low. Furthermore, the performance of the PEL improves by considering the ionic size of the electrolyte charges through the steric effect, which increases the potential, velocity, and flow rate. However, to improve flow prediction, it is important to consider that although the PEL can provide high electric potentials, the increase in potential can also lead to an increase in viscosity due to the viscoelectric effect, which offers additional flow resistance. On the other hand, drag effects can significantly reduce the flow rate when the PEL is overly thick or densely packed with polyelectrolyte brushes or contains a complex porous matrix.
The findings of this work not only clarify the theoretical behavior of electroosmotic flow under coupled electrostatic effects but also provide helpful information for its practical implementation. Thus, the present theoretical investigation is experimentally feasible, as current nano-microfabrication techniques, such as lithography and layer-by-layer deposition, enable the development of soft channels with controlled polyelectrolyte coatings. Additionally, the use of appropriate physical parameters, such as PEL thickness, ionic concentrations, and applied fields, ensures that the model predictions apply to real nano-microfluidic systems. Finally, the results provide valuable insights for the engineering design of electroosmotic micropumps and enhanced fluid transport in lab-on-a-chip platforms used in biosensing or drug delivery devices, where precise flow control is crucial.
For future work, this study recommends extending the analysis of electroosmotic flow to the following: the analysis of transient phenomena; the inclusion of complex rheological effects; the exploration of conditions under which non-Newtonian behavior could arise within the PEL, particularly under high electric field and high ionic strength, as these could significantly alter the electroosmotic flow characteristics; and the analysis of optimization strategies that may help maximize the favorable effects and minimize the adverse effects identified in this study.

Author Contributions

Conceptualization, E.M.J., C.G.H. and J.P.E.; methodology, E.M.J., C.G.H. and D.A.T.; software, E.M.J., C.G.H. and D.A.T.; validation, E.M.J., C.G.H., J.R.G. and N.R.; formal analysis, C.G.H. and J.R.G.; investigation, E.M.J., C.G.H. and J.R.G.; resources, J.P.E., R.O.V., D.A.T. and N.R.; data curation, E.M.J., C.G.H. and D.A.T.; writing—original draft preparation, E.M.J., C.G.H., J.P.E. and J.R.G.; writing—review and editing, J.P.E., D.A.T. and N.R.; visualization, J.P.E. and J.R.G.; supervision, J.P.E. and R.O.V.; project administration, J.P.E. and R.O.V.; funding acquisition, J.P.E. and R.O.V. All authors have read and agreed to the published version of the manuscript.

Funding

This research was funded by the Instituto Politécnico Nacional in Mexico, grant numbers SIP-20253830 to J.P.E. and SIP-20253835 to R.O.V.

Data Availability Statement

Data are contained within this article. However, further data are available upon reasonable request from the corresponding author.

Acknowledgments

Edson M. Jimenez thanks the postdoctoral fellowship sponsored by the Secretaría de Ciencia, Humanidades, Tecnología e Innovación (SECIHTI) to conduct a research stay at the ESIME Unidad Azcapotzalco (IPN) in Mexico (2023–2025). Juan P. Escandón thanks the sabbatical research program sponsored by the Instituto Politécnico Nacional of Mexico.

Conflicts of Interest

The authors declare no conflicts of interest. The funders had no role in the design of the study; in the collection, analyses, or interpretation of data; in the writing of the manuscript; or in the decision to publish the results.

Nomenclature

aEffective ionic sizem
dPEL thicknessm
d ¯ Dimensionless thickness of the PEL-
eElementary chargeC
E x Axial electric fieldV m−1
E Electric field vectorV m−1
E EDL Local electric field vector within the EDLV m−1
fViscoelectric coefficientm2 V−2
f ¯ Dimensionless viscoelectric coefficient-
F Body forceN m−3
HHalf the height of the channelm
k B Boltzmann constantJ K−1
kFriction coefficientPa s m−2
MMolar concentration of an electrolyte solutionmol L−1
mTotal number of data-
n 0 Ionic number concentration in the bulk solutionm−3
n + number concentration of positive ionsm−3
n number concentration of negative ionsm−3
NIonic number concentration of fixed charges within the PELm−3
pPressurePa
QFlow rate per unit width of the channelm2 s−1
Q c Characteristic flow rate per unit width of the channelm2 s−1
Q ¯ Dimensionless flow rate per unit width of the channel-
Q ¯ i Current dimensionless flow rate with mesh i-
Q ¯ j Previous dimensionless flow rate with mesh j-
qNodal counter-
TTemperatureK
uAxial velocitym s−1
u a , q Numerical velocity at node qm s−1
u b , q Experimental velocity at node qm s−1
u c Characteristic velocitym s−1
u ¯ Dimensionless axial velocity-
v Velocity vectorm s−1
x , y Cartesian coordinatesm
x ¯ , y ¯ Dimensionless Cartesian coordinates-
zAbsolute value of valency of a (z: z) electrolyte-
ZAbsolute value of valency of the fixed ions within the PEL-
Greek symbols
α Drag parameter-
ε Dielectric permittivity of mediumC V−1 m−1
ε a , i Approximate relative error%
ε s Convergence rate%
η Dynamic viscosityPa s
η 0 Dynamic viscosity in the absence of an electric fieldPa s
η ¯ a v Average dimensionless viscosity-
κ 1 Debye length in the electrolyte layerm
κ ¯ Electrokinetic parameter of the electrolyte layer-
κ P E L 1 Equivalent Debye length within the PELm
κ ¯ P E L Electrokinetic parameter of the PEL-
ρ Fluid densitykg m−3
ρ e Volumetric free charge densityC m−3
ρ P E L Volumetric fixed charge density in the PELC m−3
ν Steric factor-
ψ Electric potential within the EDLV
ψ ¯ Dimensionless electric potential within the EDL-

References

  1. Alizadeh, A.; Hsu, W.-L.; Wang, M.; Daiguji, H. Electroosmotic flow: From microfluidics to nanofluidics. Electrophoresis 2021, 42, 834–868. [Google Scholar] [CrossRef]
  2. Kang, Y.; Yang, C.; Huang, X. Analysis of the electroosmotic flow in a microchannel packed with homogeneous microspheres under electrokinetic wall effect. Int. J. Eng. Sci. 2004, 42, 2011–2027. [Google Scholar] [CrossRef]
  3. Li, L.; Wang, X.; Pu, Q.; Liu, S. Advancement of electroosmotic pump in microflow analysis: A review. Anal. Chim. Acta 2019, 1060, 1–16. [Google Scholar] [CrossRef] [PubMed]
  4. Masliyah, J.H.; Bhattacharjee, S. Electrokinetic and Colloid Transport Phenomena; Wiley-Interscience: Hoboken, NJ, USA, 2006. [Google Scholar]
  5. Haywood, D.G.; Harms, Z.D.; Jacobson, S.C. Electroosmotic flow in nanofluidic channels. Anal. Chem. 2014, 86, 11174–11180. [Google Scholar] [CrossRef] [PubMed]
  6. Deraney, R.N.; Schneider, L.; Tripathi, A. Synergistic use of electroosmotic flow and magnetic forces for nucleic acid extraction. Analyst 2020, 145, 2412–2419. [Google Scholar] [CrossRef]
  7. Silverio, V.; Canane, P.A.G.; Martins, T.A.; Afonso, R.; Cardoso, S.; Batista, E. Development of a microfluidic electroosmosis pump on a chip for steady and continuous fluid delivery. Biomed. Eng.-Biomed. Tech. 2023, 68, 79–90. [Google Scholar] [CrossRef]
  8. Jen, C.-P.; Amstislavskaya, T.G.; Liu, Y.-H.; Hsiao, J.-H.; Chen, Y.-H. Single-cell electric lysis on an electroosmotic-driven microfluidic chip with arrays of microwells. Sensors 2012, 12, 6967–6977. [Google Scholar] [CrossRef]
  9. Pramod, K.; Sen, A.K. Flow and heat transfer analysis of an electro-osmotic flow micropump for chip cooling. J. Electron. Packag. 2014, 136, 031012. [Google Scholar] [CrossRef]
  10. Plohl, O.; Zemljič, L.F.; Potrč, S.; Luxbacher, T. Applicability of electro-osmotic flow for the analysis of the surface zeta potential. RSC Adv. 2020, 10, 6777–6789. [Google Scholar] [CrossRef]
  11. Hsieh, S.-S.; Lin, H.-C.; Lin, C.-Y. Electroosmotic flow velocity measurements in a square microchannel. Colloid Polym. Sci. 2006, 284, 1275–1286. [Google Scholar] [CrossRef]
  12. Jiménez, E.; Escandón, J.; Bautista, O.; Méndez, F. Start-up electroosmotic flow of Maxwell fluids in a rectangular microchannel with high zeta potentials. J. Non–Newton. Fluid Mech. 2016, 227, 17–29. [Google Scholar] [CrossRef]
  13. Yang, X.; Wang, S.; Zhao, M.; Xiao, Y. Electroosmotic flow of Maxwell fluid in a microchannel of isosceles right triangular cross section. Phys. Fluids 2021, 33, 123113. [Google Scholar] [CrossRef]
  14. Kwak, H.S.; Kim, H.; Hyun, J.M.; Song, T.-H. Thermal control of electroosmotic flow in a microchannel through temperature-dependent properties. J. Colloid Interface Sci. 2009, 335, 123–129. [Google Scholar] [CrossRef]
  15. Chen, L.-C.; Wu, C.-C.; Wu, R.-G.; Chang, H.-C. Electroosmotic flow control in microfluidic chips using a self-asssembled monolayer as the insulator of a flow field-effect transistor. Langmuir 2012, 28, 11281–11285. [Google Scholar] [CrossRef] [PubMed]
  16. Peng, R.; Li, D. Effects of ionic concentration gradient on electroosmotic flow mixing in a microchannel. J. Colloid Interface Sci. 2015, 440, 126–132. [Google Scholar] [CrossRef] [PubMed]
  17. Seifollahi, Z.; Ashrafizadeh, S.N. Ionic-size dependent electroosmotic flow in ion-selective biomimetic nanochannels. Colloids Surf. B Biointerfaces 2022, 216, 112545. [Google Scholar] [CrossRef] [PubMed]
  18. Liu, W.; Ren, Y.; Tao, Y.; Li, Y.; Wu, Q. On traveling-wave field-effect flow control for simultaneous induced-charge electroosmotic pumping and mixing in microfluidics: Physical perspectives and theoretical analysis. J. Micromech. Microeng. 2018, 28, 055004. [Google Scholar] [CrossRef]
  19. Liu, Y.-B. Effect of boundary slip on electroosmotic flow in a curved rectangular microchannel. Chin. Phys. B 2024, 33, 074101. [Google Scholar] [CrossRef]
  20. Tang, G.Y.; Yang, C.; Chai, J.C.; Gong, H.Q. Joule heating effect on electroosmotic flow and mass species transport in a microcapillary. Int. J. Heat Mass Transf. 2004, 47, 215–227. [Google Scholar] [CrossRef]
  21. Sadeghi, A.; Azari, M.; Hardt, S. Electroosmotic flow in soft microchannels at high grafting densities. Phys. Rev. Fluids 2019, 4, 063701. [Google Scholar] [CrossRef]
  22. Zhang, Z.; Zuo, C.; Cao, Q.; Ma, Y.; Chen, S. Modulation of electroosmotic flow using polyelectrolyte brushes: A molecular dynamics study. Macromol. Theory Simul. 2012, 21, 145–152. [Google Scholar] [CrossRef]
  23. Sadeghi, A. Theoretical modeling of electroosmotic flow in soft microchannels: A variational approach applied to the rectangular geometry. Phys. Fluids 2018, 30, 032004. [Google Scholar] [CrossRef]
  24. Matin, M.H.; Ohshima, H. Thermal transport characteristics of combined electroosmotic and pressure driven flow in soft nanofluidics. J. Colloid Interface Sci. 2016, 476, 167–176. [Google Scholar] [CrossRef]
  25. Chen, G.; Das, S. Electroosmotic transport in polyelectrolyte-grafted nanochannels with pH-dependent charge density. J. Appl. Phys. 2015, 117, 185304. [Google Scholar] [CrossRef]
  26. Kaushik, P.; Mondal, P.K.; Kundu, P.K.; Wongwises, S. Rotating electroosmotic flow through a polyelectrolyte-grafted microchannel: An analytical solution. Phys. Fluids 2019, 31, 022009. [Google Scholar] [CrossRef]
  27. Talebi, R.; Ashrafizadeh, S.N.; Sadeghi, A. Hydrodynamic dispersion by electroosmotic flow in soft microchannels: Consideration of different properties for electrolyte and polyelectrolyte layer. Chem. Eng. Sci. 2021, 229, 116058. [Google Scholar] [CrossRef]
  28. Gaikwad, H.S.; Mondal, P.K.; Wongwises, S. Softness induced enhancement in net throughput of non-linear biofluids in nanofuidic channel under EDL phenomenon. Sci. Rep. 2018, 8, 7893. [Google Scholar] [CrossRef]
  29. Yazdi, A.A.; Sadeghi, A.; Saidi, M.H. Steric effects on electrokinetic flow of non-linear biofluids. Colloids Surf. A Physicochem. Eng. Asp. 2015, 484, 394–401. [Google Scholar] [CrossRef]
  30. Liu, Y.; Jian, Y. The effects of finite ionic sizes and wall slip on entropy generation in electroosmotic flows in a soft nanochannel. J. Heat Transfer. 2019, 141, 102401. [Google Scholar] [CrossRef]
  31. Jimenez, E.; Escandón, J.; Méndez, F.; Bautista, O. Combined viscoelectric and steric effects on the electroosmotic flow in nano/microchannels with heterogeneous zeta potentials. Colloids Surf. A Physicochem. Eng. Asp. 2019, 577, 347–359. [Google Scholar] [CrossRef]
  32. Pabi, S.; Mehta, S.K.; Pati, S. Analysis of thermal transport and entropy generation characteristics for electroosmotic flow through a hydrophobic microchannel considering viscoelectric effect. Int. Commun. Heat Mass Transf. 2021, 127, 105519. [Google Scholar] [CrossRef]
  33. Kilic, M.S.; Bazant, M.Z.; Ajdari, A. Steric effects in the dynamics of electrolytes at large applied voltages. I. Double-layer charging. Phys. Rev. E 2007, 75, 021502. [Google Scholar] [CrossRef] [PubMed]
  34. Bandopadhyay, A.; Chakraborty, S. Ionic size dependent electroosmosis in ion-selective microchannels and nanochannels. Electrophoresis 2013, 34, 2193–2198. [Google Scholar] [CrossRef] [PubMed]
  35. Bazant, M.Z.; Kilic, M.S.; Storey, B.D.; Ajdari, A. Towards an understanding of induced-charge electrokinetics at large applied voltages in concentrated solutions. Adv. Colloid Interface Sci. 2009, 152, 48–88. [Google Scholar] [CrossRef]
  36. Dey, R.; Ghonge, T.; Chakraborty, S. Steric-effect-induced alteration of thermal transport phenomenon for mixed electroosmotic and pressure driven flows through narrow confinements. Int. J. Heat Mass Transf. 2013, 56, 251–262. [Google Scholar] [CrossRef]
  37. Jimenez, E.; Escandón, J.; Méndez, F.; Bautista, O. Combined viscoelectric and steric effects on the electroosmotic flow in a microchannel under induced high zeta potentials. Colloids Surf. A Physicochem. Eng. Asp. 2017, 531, 221–233. [Google Scholar] [CrossRef]
  38. Mehta, S.K.; Pati, S.; Baranyi, L. Steric effect induced heat transfer for electroosmotic flow of Carreau fluid through a wavy microchannel. Tech. Mech. 2023, 43, 2–12. [Google Scholar]
  39. Zheng, J.; Jia, B.; Jian, Y. Steric effects on space electroosmotic thrusters in soft nanochannels. Mathematics 2021, 9, 1916. [Google Scholar] [CrossRef]
  40. Hsu, W.-L.; Daiguji, H.; Dunstan, D.E.; Davidson, M.R.; Harvie, D.J.E. Electrokinetics of the silica and aqueous electrolyte solution interface: Viscoelectric effects. Adv. Colloid Interface Sci. 2016, 234, 108–131. [Google Scholar] [CrossRef]
  41. Hsu, W.-L.; Harvie, D.J.E.; Davidson, M.R.; Dunstan, D.E.; Hwang, J.; Daiguji, H. Viscoelectric effects in nanochannel electrokinetics. J. Phys. Chem. C 2017, 121, 20517–20523. [Google Scholar] [CrossRef]
  42. Lyklema, J.; Overbeek, J.T.G. On the interpretation of electrokinetic potentials. J. Colloid Sci. 1961, 16, 501–512. [Google Scholar] [CrossRef]
  43. Ramos, E.A.; Monsivais, I.G.; Méndez, F.; Lizardi, J.J. Viscoelectric effect analysis in an electroosmotic flow with microchannel wall slip. Phys. Scr. 2023, 98, 065022. [Google Scholar] [CrossRef]
  44. Marroquin-Desentis, J.; Méndez, F.; Bautista, O. Viscoelectric effect on electroosmotic flow in a cylindrical microcapillary. Fluid Dyn. Res. 2016, 48, 035503. [Google Scholar] [CrossRef]
  45. Huo, X.; Chen, X. A review on modeling, simulation and experiment of electrokinetic micromixers. J. Disper. Sci. Technol. 2020, 42, 1469–1481. [Google Scholar] [CrossRef]
  46. Höltzel, A.; Tallarek, U. Ionic conductance of nanopores in microscale analysis systems: Where microfluidics meets nanofluidics. J. Sep. Sci. 2007, 30, 1398–1419. [Google Scholar] [CrossRef]
  47. Cheng, L.J. Electrokinetic ion transport in nanofluidics and membranes with applications in bioanalysis and beyond. Biomicrofluidics 2018, 12, 021502. [Google Scholar] [CrossRef] [PubMed]
  48. Nguyen, N.V.T.; Smadja, C.; Taverna, M.; Mousli, S.E.; Secret, E.; Siaugue, J.-M.; Nguyen, L.T.H.; Mai, T.D. Electroosmotic flow modulation for improved electrokinetic preconcentration: Application to capillary electrophoresis of fluorescent magnetic nanoparticles. Anal. Chim. Acta 2021, 1161, 338466. [Google Scholar] [CrossRef]
  49. Chanda, S.; Das, S. Effect of finite ion sizes in an electrostatic potential distribution for a charged soft surface in contact with an electrolyte solution. Phys. Rev. E 2014, 89, 012307. [Google Scholar] [CrossRef]
  50. Gaikwad, H.S.; Kumar, G.; Mondal, P.K. Efficient electroosmotic mixing in a narrow-fluidic channel: The role of a patterned soft layer. Soft Matter 2020, 16, 6304–6316. [Google Scholar] [CrossRef]
  51. Xing, J.; Jian, Y. Steric effects on electroosmotic flow in soft nanochannels. Meccanica 2018, 53, 135–144. [Google Scholar] [CrossRef]
  52. Zhao, G.; Jian, Y. Thermal transport of combined electroosmotically and pressure driven nanofluid flow in soft nanochannels. J. Therm. Anal. Calorim. 2019, 135, 379–391. [Google Scholar] [CrossRef]
  53. Sadeghi, A.; Amini, Y.; Saidi, M.H.; Chakraborty, S. Numerical modeling of surface reaction kinetics in electrokinetically actuated microfluidic devices. Anal. Chim. Acta 2014, 838, 64–75. [Google Scholar] [CrossRef] [PubMed]
  54. Matin, M.H.; Ohshima, H. Combined electroosmotically and pressure driven flow in soft nanofluidics. J. Colloid. Interface Sci. 2015, 460, 361–369. [Google Scholar] [CrossRef] [PubMed]
  55. Zheng, J.; Jian, Y. Electroosmotic thrusters in soft nanochannels for space propulsion. Phys. Fluids 2020, 32, 122005. [Google Scholar] [CrossRef]
  56. Karniadakis, G.; Beskok, A.; Aluru, N. Microflows and Nanoflows. Fundamentals and Simulation; Springer: New York, NY, USA, 2005. [Google Scholar]
  57. Chun, B.; Chun, M.-S. Electrostatic potential analysis in polyelectrolyte brush-grafted microchannels filled with polyelectrolyte dispersion. Micromachines 2021, 12, 1475. [Google Scholar] [CrossRef]
  58. Hsieh, S.-S.; Yang, T.-K. Electroosmotic flow in rectangular microchannels with Joule heating effects. J. Micromech. Microeng. 2008, 18, 025025. [Google Scholar] [CrossRef]
  59. Andrews, J.; Das, S. Effect of finite ion sizes in electric double layer mediated interaction force between two soft charged plates. RSC Adv. 2015, 5, 46873–46880. [Google Scholar] [CrossRef]
  60. Patel, M.; Kruthiventi, S.S.H.; Kaushik, P. Polyelectrolyte layer grafting effect on the rotational electroosmotic flow of viscoplastic material. Microfluid. Nanofluidics 2021, 25, 11. [Google Scholar] [CrossRef]
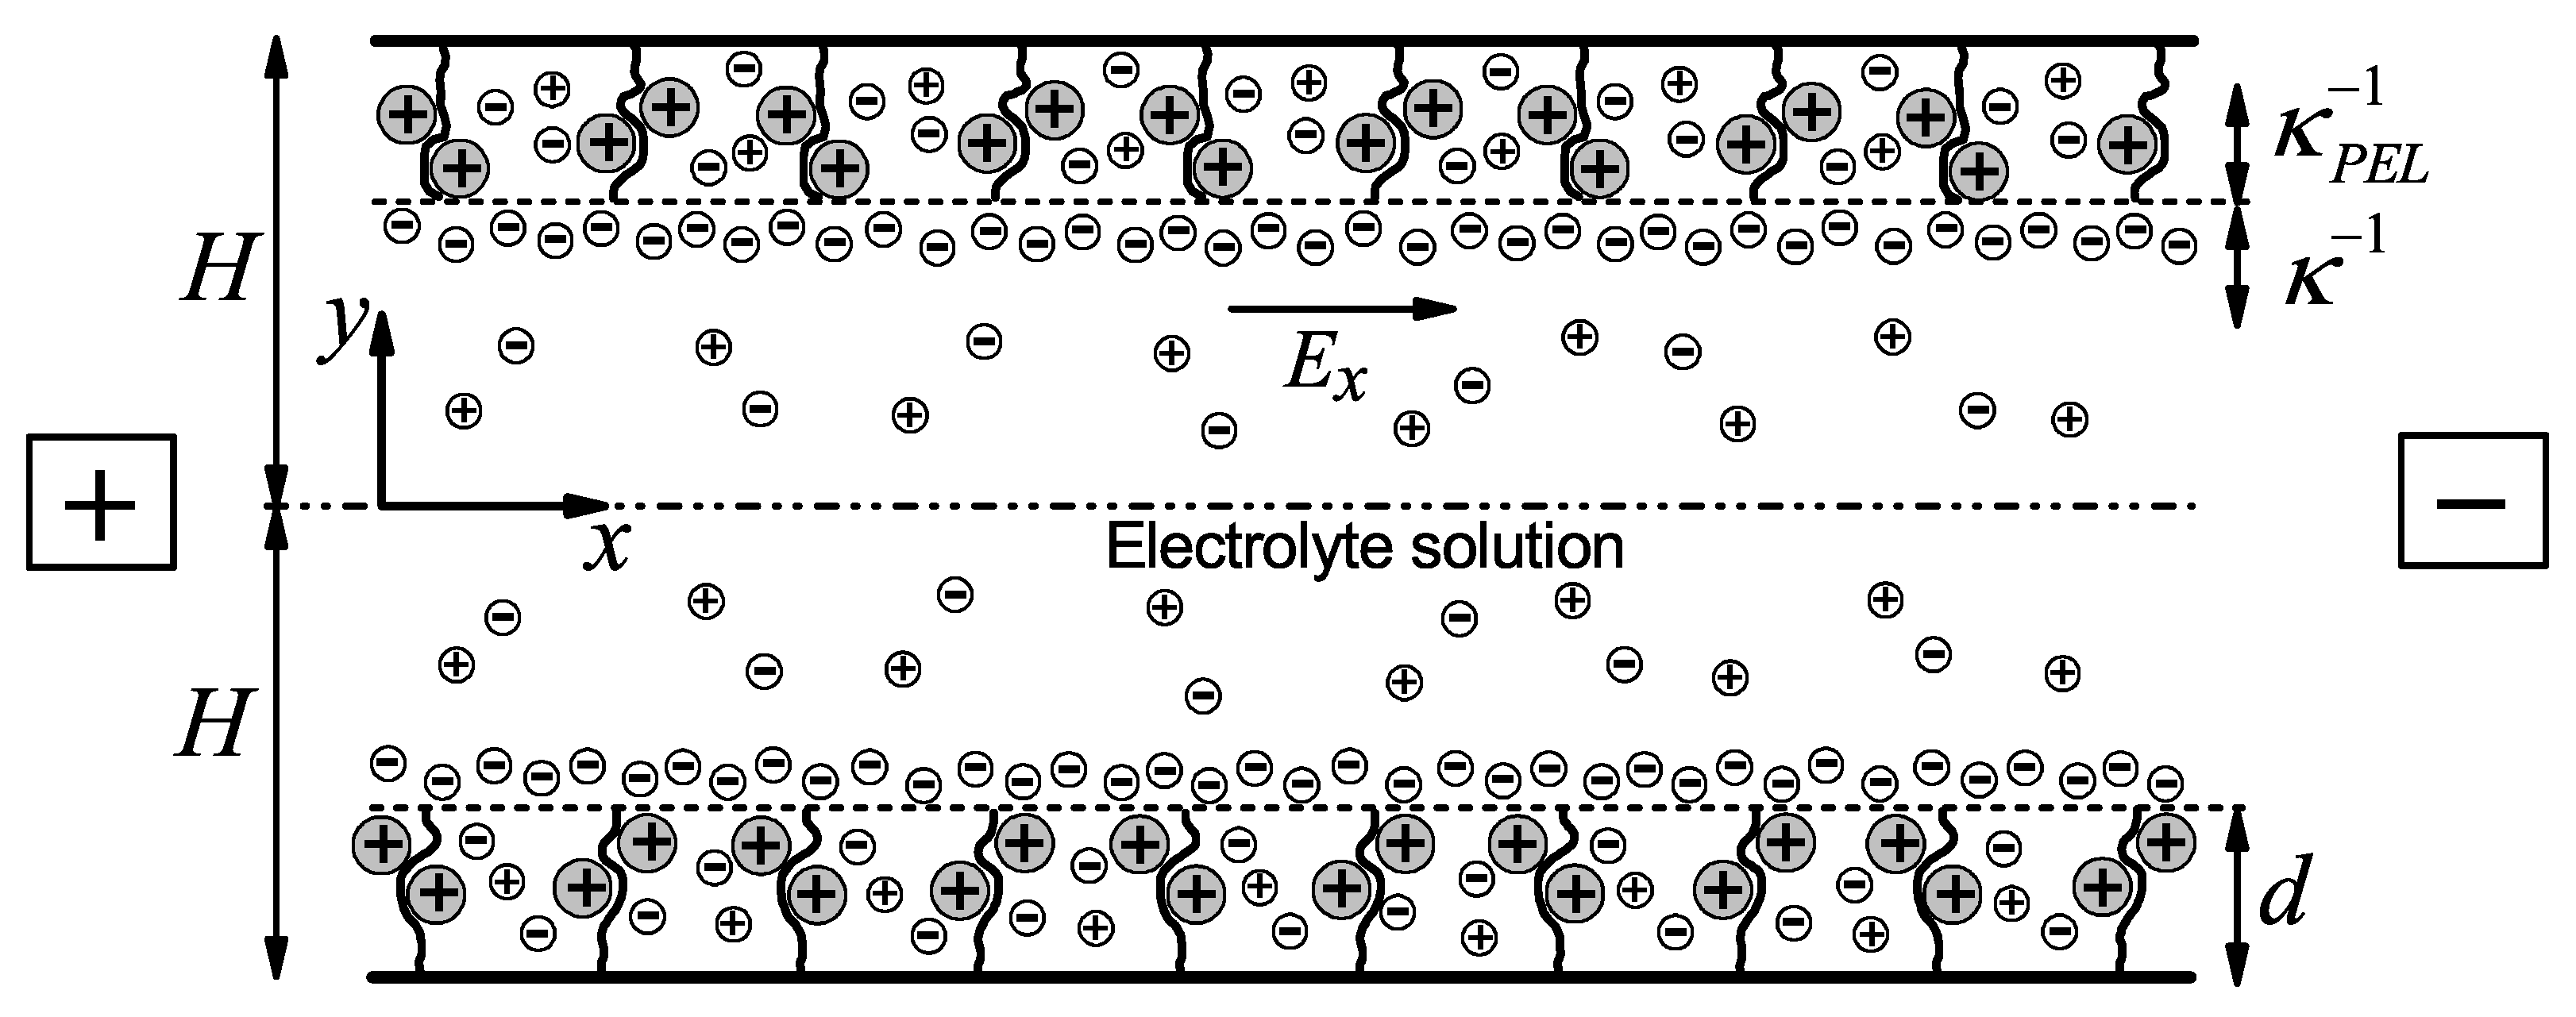
Figure 1. Sketch of the electroosmotic flow in a soft channel.
Mathematics 13 02546 g001
Figure 2. Mesh-independence study.
Mathematics 13 02546 g002
Figure 3. Validation of the electroosmotic flow solution of the present work with the research reported by (a) Liu and Jian [30], (b) Matin and Ohshima [24], and Gaikwad et al. [28] in dimensionless form, and by (c) Hsieh and Yang [58] in dimensional form.
Mathematics 13 02546 g003
Figure 4. Dimensionless (a) electric potential distribution and (be) velocity profiles for the electroosmotic flow as a function of the dimensionless transverse coordinate with κ ¯ = 10 , d ¯ = 0.05 , α = 1 , sgn ( Z ) = 1 , two combined values of the steric factor ν (=0, 0.01) and the viscoelectric coefficient f ¯ (=0, 0.01), for different values of κ ¯ P E L (=5, 10, 40, 80).
Mathematics 13 02546 g004
Figure 5. Dimensionless (a) electric potential distribution and (be) velocity profiles for the electroosmotic flow as a function of the dimensionless transverse coordinate with κ ¯ = 10 , d ¯ = 0.05 , α = 1 , sgn ( Z ) = 1 , two combined values of the steric factor ν (=0, 0.01) and the viscoelectric coefficient f ¯ (=0, 0.01), for different values of κ ¯ P E L (=5, 10, 40, 80).
Mathematics 13 02546 g005
Figure 6. Dimensionless (a) electric potential distribution and (be) velocity profiles for the electroosmotic flow as a function of the dimensionless transverse coordinate with κ ¯ = 10 , α = 1 , κ ¯ P E L = 75 , sgn ( Z ) = 1 , two combined values of the steric factor ν (=0, 0.01) and the viscoelectric coefficient f ¯ (=0, 0.01), for different values of d ¯ (=0.005, 0.01, 0.05, 0.1).
Mathematics 13 02546 g006
Figure 7. Dimensionless (a) electric potential distribution and (be) velocity profiles for the electroosmotic flow as a function of the dimensionless transverse coordinate with κ ¯ = 10 , d ¯ = 0.07 , κ ¯ P E L = 80 , sgn ( Z ) = 1 , two combined values of the steric factor ν (=0, 0.01) and the viscoelectric coefficient f ¯ (=0, 0.01), for different values of α (=1, 10, 50, 100).
Mathematics 13 02546 g007
Figure 8. Dimensionless average viscosity as a function of the electrokinetic parameter of the PEL with κ ¯ = 10 , d ¯ = 0.05 , α = 1 , sgn ( Z ) = 1 , and combined values of the steric factor ν (=0, 0.01) and the viscoelectric coefficient f ¯ (=0, 0.01, 0.05).
Mathematics 13 02546 g008
Figure 9. Dimensionless velocity profiles for the electroosmotic flow as a function of the dimensionless transverse coordinate with κ ¯ = 10 , d ¯ = 0.05 , α = 1 , sgn ( Z ) = 1 , and combined values of the steric factor ν (=0, 0.01) and the viscoelectric coefficient f ¯ (=0, 0.01, 0.05). (a) κ ¯ P E L = 80 and (b) κ ¯ P E L = 90 .
Mathematics 13 02546 g009
Figure 10. Dimensionless flow rate as a function of the electrokinetic parameter κ ¯ P E L with α = 10 , κ ¯ = 50 , d ¯ = 0.01 , sgn ( Z ) = 1 , and combined values of the steric factor ν (=0, 0.01) and the viscoelectric coefficient f ¯ (=0, 0.02, 0.05).
Mathematics 13 02546 g010
Figure 11. Dimensionless flow rate as a function of the dimensionless thickness of the PEL d ¯ with α = 40 , κ ¯ = 10 , κ ¯ P E L = 70 , sgn ( Z ) = 1 , and combined values of the steric factor ν (=0, 0.01) and the viscoelectric coefficient f ¯ (=0, 0.01, 0.05).
Mathematics 13 02546 g011
Figure 12. Dimensionless flow rate as a function of the drag parameter α with κ ¯ = 10 , κ ¯ P E L = 75 , d ¯ = 0.1 , sgn ( Z ) = 1 , and combined values of the steric factor ν ( = 0 , 0.01 ) and the viscoelectric coefficient f ¯ ( = 0 , 0.01 , 0.05 ) .
Mathematics 13 02546 g012
Figure 13. Dimensionless flow rate as a function of the electrokinetic parameter κ ¯ with α = 10 , κ ¯ P E L = 120 , d ¯ = 0.02 , sgn ( Z ) = 1 , and combined values of the steric factor ν (=0, 0.01) and the viscoelectric coefficient f ¯ (=0, 0.01, 0.05).
Mathematics 13 02546 g013
Table 1. Convergence summary of the mesh-independence study based on two representative cases from Figure 2: (a) ν = 0 , f ¯ = 0 and (b) ν = 0.01 , f ¯ = 0.05 .
Element SizeNumber of Elements(a) Q ¯ ε a , i ( % ) (b) Q ¯ ε a , i ( % )
0.2857.052004 48.130216
0.0110056.5482550.8908351.1510995.90580
0.00520056.5478870.0006551.1567730.01109
0.00425156.5478610.0000551.1571410.00072
0.000110,00056.5478410.0000451.1574260.00056
Disclaimer/Publisher’s Note: The statements, opinions and data contained in all publications are solely those of the individual author(s) and contributor(s) and not of MDPI and/or the editor(s). MDPI and/or the editor(s) disclaim responsibility for any injury to people or property resulting from any ideas, methods, instructions or products referred to in the content.