1. Introduction
The complexity of today’s major problems concerning sustainability requires a networked perspective on knowledge [
1]. School teaching plays an important role in facilitating students’ development of this perspective. To create learning environments that convey complexity and networking, teachers require an assessment that enables them to provide targeted support. In this article, the application of such an assessment tool, which is an expertise-based reference to the mystery method, or
mystery for short [
2,
3], in a complex sustainability context [
4], is presented. The reference will be used as a basis to evaluate learners’ influence diagrams qualitatively. In this way, systems thinking, one of the central competences within Education for Sustainable Development (ESD), is assessed [
5,
6,
7].
Many approaches to developing a system-related competence exist, including, among others, networked thinking [
8], geographical system competence [
9], and systems thinking [
6,
10], each with a conceptual overlap. In principle, such a competence is understood as the ability to describe, reconstruct, and model a complex realm of reality as a system and, on the basis of the model, provide explanations, make forecasts, and design, assess, and implement possible courses of action [
11]. As noted previously, this is a central competence within ESD, along with
socio-scientific reasoning and decision-making [
12] and
Gestaltungskompetenz [
13] ( approx. ‘taking action’). The three competences are interrelated [
5] because one first has to gain systems thinking, which serves as a prerequisite for decision-making, finally leading to taking action. Therefore, acquiring systems thinking (and the other system-related competences) is a dominant goal for ESD and its implementation.
An essential pre-condition for teaching systems thinking is knowledge of its diagnostics. Competence models have been developed and tested accordingly. Concept mapping has been proven highly feasible as a valid assessment of systems thinking. Due to structural similarities between concept maps and the influence diagrams from the mystery method, the influence diagrams are presumed to be suitable for a diagnosis, which can take place in daily teaching practice [
4]. Generally, as with concept maps, various methods can be used for evaluation [
14,
15].
Sustainability-relevant human-environment systems are associated with uncertainty and risk considerations due to their complexity [
16]. This makes evaluating learning tasks’ outputs difficult, as no clear solution can be defined. However, especially with the mapping techniques used frequently with systemic content, references are often used in assessment. But can there be a mapped reference if there is no clear solution for such maps? Benninghaus, Mühling, Kremer and Sprenger [
4] were able to provide several references that can be used for assessment. To create the references, the authors constructed a mystery within a (non-)sustainable consumption pattern (water-intensive, export-oriented tomato cultivation in Almería, Spain). The layout of the mystery comprised 18 information cards. In class, the students constructed influence diagrams by connecting those cards with meaningful arrows. In this way, the students discovered interconnections between the information on each card. They analyzed the system of tomato consumption and externalized their systemic knowledge into influence diagrams, which, therefore, are valid for assessment.
This mystery, respectively its cards, were then used to create the references via data mining [
17]. For this, the authors used experts, who determined if a connection between two particular cards existed. This was continued for every possible pairing of cards and thus followed the methodology of relatedness judgments [
18]. The data gathering was conducted online, and the digital data were then processed into different references. They differed in the degree of experts’ consent, since the experts did not decide for every pairing of cards equally. The consent ranged from complete unison (all experts agreed on/declined a connection) to connections drawn by only one expert. Based on this, the connections were weighted: connections agreed upon by many experts were given a high weight and could be viewed as ‘certain.’ The weighting allowed the production of different references with varying aspects for use in assessment. The references are described in more detail in the methodology section.
The objective of the present study is to analyze actual learners’ influence diagrams using the references and adapting the method with a view toward meaningful use in teaching practice. The key question, therefore, is as follows: Which way of evaluation can provide the best results? There will be multiple variants of evaluation approaches based on the references (and other variables), which will be compared. For this, they will be correlated with the diameters of the students’ influence diagrams. (The diameter is a point of measure on the diagram, which is explained in more detail in the methodology section.) The diameter allows conclusions about a map’s/influence diagram’s structural quality and is seen as a valid benchmark for evaluating our results.
The precise procedure for gathering and compiling data, using the assessment variants, and integrating the diameter is described in the methodology section, after the necessary theoretical backgrounds are presented, where the construct of systems thinking is in focus, as it is the main construct underlying the capability to deal with systems. This is followed by the theoretical consideration of mapping techniques, including a more detailed description of the mystery method, as well as an overview of possible evaluation methods for influence diagrams/cognitive maps. The concrete procedure of this study is described in the methodology section, followed by the evaluation of the data obtained and their interpretation.
2. Theoretical Background: Systems Thinking, Mapping Techniques, and the Mystery Method
As already described, conceptualizations of system competences are broadly diversified. They all originate from the field of research dedicated to dealing with systems but are based on different scientific approaches. In the context of ESD, the model of systems thinking represents an important contribution [
6,
7,
19] and forms the theoretical framework for the work presented here.
2.1. Systems Thinking
Rieß and Mischo [
7] summarized systems thinking as the ability “to identify important elements of the system and the varied interdependency between these elements. Other key aspects are the ability to recognize dimensions of time dynamics, to construct an internal model of reality, and to make prognoses on the basis of that model” [
7].
These different areas of cognitive and action abilities indicate the need for a competence model. The model for systems thinking, according to Schuler, Fanta, Rosenkraenzer and Rieß [
6], is divided into four sub-capabilities, with four dimensions formulated as hierarchical competence levels.
Table 1 shows the dimensions and the corresponding abilities from sub-capability no. 3, which is crucial for structural mapping assessments, as the created structures from such an assessment may be understood as system models.
Above all, the construction of system models and influence diagrams is important for externalizing students’ systems thinking. The connections we can find in the models or diagrams provide visuals for the students’ capabilities for systems thinking. They are of high value for researching systems thinking, and comparable approaches are found in most studies on systems thinking or similar constructs (e.g., in Kunz, Frischknecht-Tobler, Bollmann-Zuberbuehler and Groesser [
11]; Fanta, Braeutigam and Riess [
19]; Assaraf and Orion [
20]; and Mehren, Rempfler, Buchholz, Hartig and Ulrich-Riedhammer [
9]). Since the mystery method also represents a kind of mapping technique, a more explicit treatment of such techniques is necessary to develop the mystery method’s role in assessing systems thinking.
2.2. The Mystery Method as a Mapping Assessment
When investigating systems thinking, cognitive structures must be displayed visually. Operationalization is bound to suitable forms of representation that apply to all comparable concepts (see previous explanation). In many studies, concept mapping has proven to be a systemic form of representation [
20,
21,
22,
23,
24]. Structural similarities between concept maps and influence diagrams, which emerge from applying the mystery method as the learning output, suggest that these influence diagrams also can be used for diagnostic purposes [
4], because both concept maps and influence diagrams emerge as models of thought from the same process of modeling [
25].
Influence diagrams from the mystery method are usually constructed during classroom teaching. The mystery method takes place in cooperative, small-group settings. The students answer to a mysterious (and motivating) key question by sorting, weighting, and networking information cards. The goal is to create an influence diagram with the information cards to become aware of and visualize the interconnections within the content (e.g., tomato consumption, see above). As a result, the students will be able to provide a comprehensive answer to the key question from the lesson. The process of constructing influence diagrams involves internal modeling, in which reality (tomato consumption) is reduced to its essential elements and relations by the mystery’s information cards and their interconnections, just like in concept mapping. This process symbolizes the ability of systems thinking. It produces a model of thinking that is externalized in the form of an influence diagram, which represents thought models and, therefore, is suitable for investigating systems thinking. Thus, it is reasonable to use the influence diagrams to assess systems thinking, which is presented later in this article.
We would like to refer to the influence diagrams, emerging from the mystery method, as
mystery maps, as the basic principle of connecting the cards is similar to linking concepts in concept mapping. However, in the mystery used here, connections are limited to the cause-and-effect principle (by the test persons, as they were by the experts during the reference study), while the amount of information on the mystery cards represents more than a single concept in a concept map’s node [
4]. Therefore, concept maps and mystery maps are quite different, but at the same time related, and allow the use of equal assessment techniques, as will be shown next.
2.3. Structural Analysis of Cognitive Maps
Diagnostic work with cognitive maps is widespread and has become highly differentiated over time. For this reason, a concentrated overview is provided here against the background of reference maps and approaches largely from ESD and environmental education, as this gives a proper context for our study.
Diagnosis by reference generally is widespread in mapping [
26]. For example, Rebich and Gautier [
27] produced an expert map in the field of climate change and compared it with the maps of their test participants. According to the authors, the objective was not to evaluate the maps, but to determine in which areas of the construct (climate change) concepts and propositions actually were present. Thus, the reference was used as an orientation to locate the concepts and propositions expressed by the test persons and, thus, to derive focal points. Rice, et al. [
28] worked similarly using an expert map to identify a set of concepts from the field of zoology that served as a kind of expectation horizon for the test persons’ maps.
Sellmann, et al. [
29] created and used a reference map in a different way; its purpose was to determine which individual propositions of the test persons were valid and which were not. The reference was created on the basis of a literature search and contained not only correct concepts, but also alternative ideas that were listed as such in the literature. Selection of the concepts themselves was carried out on the basis of expert maps from extant literature. It is noteworthy that the authors had group maps created with reference to Nesbit and Adesope [
30], as this exerted a positive effect on the maps, also see [
31].
The regulation of reference creation, including the number of experts involved, was not explained in the presented studies. In contrast, the references prepared for the study presented here were constructed using as many experts as possible to achieve a high degree of consent saturation in the connections, necessitated by the uncertainty inherent in the content (tomato consumption). Accordingly, this approach is necessary for all mapping procedures contextualized with uncertainty, which is not noted in the listed studies. The references used there are not to be regarded as incorrect, but they represent only a portion of the respective constructs. Therefore, cross-personal references are necessary to increase security [
4].
3. Methods
For clarity, throughout this article and especially within the methodological explanations, the connections between the information cards from the mystery method are referred to as edges, and the cards themselves are referred to as nodes if an empirical background is involved. Otherwise, the teaching-method level maintains the terms connection and information cards so that the context is made clear.
3.1. Survey Participants
The test persons used for this study were grades 9 and 10 high school students (ages 15 to 17). For data collection, some students worked on the mystery alone, while others worked in groups of three. For practical purposes, selection and group composition were done on a voluntary basis under the teachers’ supervision. Data collection elicited 10 mystery maps from individual work and 21 from group work.
Data collection was embedded within a closed geographical teaching concept. The teachers used materials that were provided (content information, method explanation, introductory caricature, information cards) and were able to lead the entire lesson autonomously, as it would be done in a regular lesson. The learning units were scheduled for the usual 90 min, of which about 60 were spent working only on the mystery. This rather long period of time was necessary to enable participants to create a clear structure with the information cards and trace the connecting arrows in a clearly visible way. The participants were not trained in working with mysteries, but as it is a famous method, they may have recognized it from previous lessons. The influence diagrams were used only for the study and the class discussion at the lesson’s conclusion. No grading occurred; therefore, no performance pressure was exerted by this means.
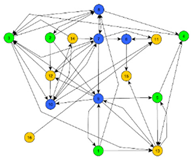
All mystery maps were photographed and then digitized with the tool yEd Graph Editor into a text-based format (TGF) for further analysis.
Figure 1 shows an influence diagram and its digitized graph. This resulted in a body of data that could then be explored using data mining approaches [
17].
3.2. Basics for the Derivation of Evaluation Technology
No structural analysis techniques for mystery maps exist in the extant literature. A self-imposed requirement for the evaluation technique, which was an objective of the present study, was that it must not be too complex so as to ensure that it can be applied in practice without difficulty in the context of diagnostics of systems thinking. To guarantee our evaluation technique’s validity, we correlated it with established methods of structural graph analyses. For this purpose, the measurement of the diameter (mentioned previously), for example, can be used: The diameter is defined as the longest shortest connection in the graph, i.e., the two points farthest apart, if the number of edges is taken as the distance measure and paths are not artificially extended. Graphs that comprise long chains, rather than many branches, tend to have a larger diameter. Maps that are ‘well’ constructed are expected to be more densely interconnected [
32,
33] and, therefore, will have small diameters. Finding a single value that carries valid information about the specific structure of a graph is difficult, as a single value necessarily loses a lot of information that is present in the complete graph. The diameter is an example of such a value: its magnitude varies depending on the structure of the graph, and for a given number of nodes and edges, many different graphs with distinct diameters can be constructed. This property makes the value useful in analyses that refer to general structural properties of a network.
What constitutes a large or small diameter generally cannot be answered absolutely, but for strongly cross-linked graphs, the value remains constant, even with an increasing number of nodes, while for only weakly cross-linked graphs, it grows linearly with the number of nodes. Transferred to mystery maps, a mystery map that is considered well-constructed is more likely to have a small diameter, i.e., a solution with a small diameter is preferable to one with a larger diameter.
Although the process for measuring the diameter can be easily automated, it is relatively time-consuming to determine the diameter manually, as all the shortest paths in the network must be determined first. Since we were particularly interested in evaluation variants that can easily be carried out manually by teachers, we examined possible alternatives in this study. As a reference for the quality of such an alternative, we used the correlation with the diameter. For example, counting a map’s edges or comparing edges with a reference can be done easily, and if an uncomplicated technique correlates with the complicated diameter, the goal of our research is reached, as our aim is to recommend a practical evaluation at the end. For this, we constructed a number of variants, each of which was then compared with one another and correlated with the diameter. Three different elements were available for the variants, which were combined to determine the technique that best meets our criteria. The following elements were varied: type of reference, type of connection, and type of scoring.
3.2.1. Type of Reference
Reference refers to the information obtained from expert data on the connections between the 18 mystery information cards, as described previously. Actually, only 16 cards were used for creating the reference, as two cards only contained information about the persona appearing and environmental setting prevailing in the mystery (see Benninghaus, Mühling, Kremer and Sprenger [
4] for details).
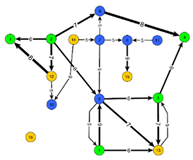
The obtained expert data can be used in three different forms that differ in their degree of complexity. First, there is the complete reference (
Figure 2a), containing all connections for which any number of experts indicated that a direct causal link exists. This was a comprehensive data set and, thus, was correspondingly complex. To reduce complexity, the second—and most reduced—variant only contained edges drawn by most of the experts (see
Figure 2b, majority reference). Third, a slightly more complex network than the second one (the pathfinder network, or Pf-Net) was obtained using the Pathfinder algorithm [
34] (see
Figure 2c, Pf-Net) on the complete data set, as described in Benninghaus, Mühling, Kremer and Sprenger [
4]. This process systematically removed certain edges for which better/weightier indirect paths existed. Both of the latter alternative diagrams had a reduced complexity and, therefore, would be easier to handle, should they yield comparable results.
An evaluation scheme based on these three references can fall back on two structural characteristics: (a) the existence of a connection in the reference and (b) the weight of this connection. In the case of (a), one would like to make a specific yes-or-no decision for an edge and, thus, use either a majority decision by the experts or the existence of the corresponding edge in the Pf-Net as a criterion. However, the two variants are not equivalent, as the Pf-Net considers not only the weight of this edge when removing edges, but also the network’s overall structure. For (b), in a concrete solution from the test participants, a drawn connection can be checked to see to what extent it is likely that experts would have drawn this certain edge. This information corresponds to the edge’s weight in the reference.
3.2.2. Connection Types: Direct and Indirect
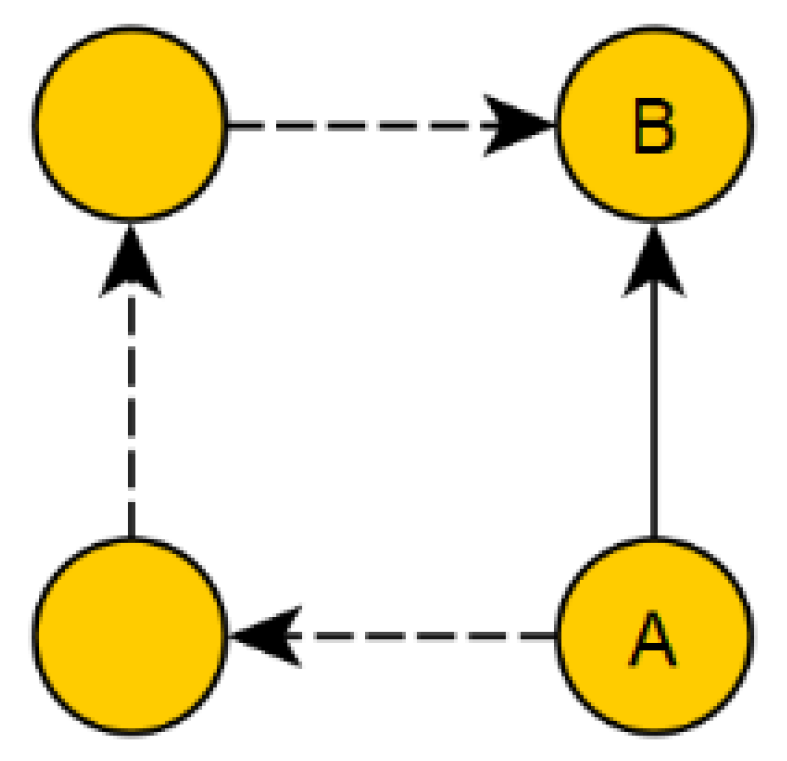
The edges between the information cards from mystery maps can be distinguished in comparison to a reference:
Direct connections in the mystery map comprised two cards, which were also directly connected in a reference. In this case, the experts saw a direct causal link that was also used by the learner creating the mystery map.
Indirect connections, on the other hand, are a link in the mystery map of a learner that existed in the reference not as a direct connection, but as an indirect path. In this case, the experts, in contrast to the learner, did not see a direct causal relation between the two facts, but at least agreed that the two facts were in some way related (
Figure 3).
Direct connections are undoubtedly more valuable than indirect connections, and the scoring schemes in the next section reflect this idea.
3.3. Variants of Scoring and Evaluation Schemes
Based on the considerations outlined in the previous section, seven different evaluation schemes exist that were concretized by determining actual numerical values for the valuation, resulting in additional valuation variants (see
Table 2). In the following section, the didactic-pedagogical considerations behind the variants tested are explained. In principle, the point system differed in various aspects: there were variants that contained negative points (a-variants) or avoided this sanctioning and assessed only positively (b-variants), the scores could be fixed (variants 1–6), or they could be based on the expert weights (variant 7), and the scheme could either consider only direct connections in the reference (variants 1, 3, 5, and 7) or also (positively) indirect connections (variants 2, 4, and 6). Consideration of indirect connections combined with expert weights again requires complicated manual evaluations, as one must determine the weight of a path from the weight of its edges. Therefore, this variant was excluded in line with the aim of our study (easy manual evaluation).
Table 2 shows the resulting 14 variants.
3.4. Evaluation Schemes Based on Pf-Net
3.4.1. No. 1a (Pf-Net, Direct, Negative)
The Pf-Net (
Figure 2c) is a reference that teachers can handle well in practice, as it has relatively few connections. A simple evaluation gave one point for an edge that also appeared in the reference, while an edge that appeared in the mystery map and not in the reference was given one minus point.
3.4.2. No. 1b (Pf-Net, Direct, Positive)
With variant 1a, total scores could fall below zero, if the performance was not adequate. In terms of pedagogical feedback to students, we prefer a score that should always remain positive. Therefore, all b-variants used different score values to avoid punishing wrong connections and only rewarded correct ones. In this case, each correct edge was counted with one point and all incorrect edges were disregarded.
3.4.3. No. 2a (Pf-Net, Indirect, Negative)
A somewhat more lenient evaluation resulted from the fact that an edge was no longer evaluated as wrong per se if it did not appear in the reference. Instead, a distinction was made as to whether the connected information cards were connected at least via an indirect path in the reference (cf.
Figure 3). If this was the case, this edge was evaluated neutrally. Since thinking in causal interdependencies must develop first, and it needs a broad knowledge base from which to draw conclusions, it made sense from a pedagogical perspective to make a distinction here. Connections on the mystery map that neither directly nor indirectly occurred in the Pf-Net were still given a minus point in this variant.
3.4.4. No. 2b (Pf-Net, Indirect, Positive)
Here, too, a counterpart exists without negative scoring. In this case, the ‘only indirectly correct’ connection was evaluated slightly positively to distinguish it from the ‘clearly wrong’ edge.
3.5. Evaluation Schemes Based on Majority Reference
The next four evaluation schemes are defined in the same way as the previous four. However, the reference used was not the Pf-Net, but the experts’ majority reference (
Figure 2b), in which a majority decision was made for each edge, and therefore, only edges with a weight greater than four remained.
3.5.1. No. 3a (Majority Reference, Direct, Negative)
Points were awarded according to the same rules applied for variant 1a. Thus, one point was awarded for an edge that appeared in the mystery map and also in the majority reference, while one point was deducted for an edge that appeared only in the mystery map, but not in the majority reference.
3.5.2. No. 3b (Majority Reference, Direct, Positive)
As with 1b, the evaluation is less strict here, in which no minus points were awarded based on the comparison with the majority reference.
3.5.3. No. 4a (Majority Reference, Indirect, Negative)
As with 2a, this variant included indirect connections if a connection existed in a mystery map that was present in the majority reference as an indirect path. The allocation of points here corresponded to the negative orientation.
3.5.4. No. 4b (Majority Reference, Indirect, Positive)
In this variant, an evaluation without negative points was carried out in the same way as the procedure followed for 2b.
3.6. Evaluation Schemes Based on Complete Reference
The following variants were based on the very complex complete reference (
Figure 2a). The practical use of this evaluation scheme is very demanding, as numerous edges exist. However, the check based on the complete data set seems desirable. We also used these variants to evaluate if using the complete data set would yield additional benefits regarding validity.
3.6.1. No. 5a (Complete Reference, Direct, Negative)
This variant worked congruently with 1a and 3a and awarded negative points accordingly. However, it used the complete reference as a basis.
3.6.2. No. 5b (Complete Reference, Direct, Positive)
In contrast to 5a, no negative points were awarded for this variant.
3.6.3. No. 6a (Complete Reference, Indirect, Negative)
As with 2a and 4a, indirect paths also counted in this variant. However, a negative evaluation was also carried out in individual cases.
3.6.4. No. 6b (Complete Reference, Indirect, Positive)
In contrast to 6a, a variant without a negative rating also was used here.
3.7. Evaluation Schemes Based on Complete Reference with Weighting as Score
By using the complete reference, it was possible for the first time to use the determined weight/certainty of an edge directly as a score. Instead of a fixed value per edge (as in 1–6), the edge’s weights were added together. Therefore, a very unambiguous edge was considered to be more important than an edge for which uncertainty existed, even among the experts. To ensure that the scoring was independent of the absolute number of experts for the reference, the percentage value of the weight related to this number was used. Thus, a value of 1 meant that all experts had seen a certain compound as present; at 0.5, it would be half of the experts.
3.7.1. No. 7a (Complete Reference, Weight as Score, Negative)
To ensure symmetry with the previous schemes, a negative evaluation of wrong edges was carried out here. Since not all experts regarded an edge missing in this reference as a given, a value of -1 made sense here.
3.7.2. No. 7b (Complete Reference, Weight as Score, Positive)
Since a very strong tendency to the negative was to be expected for 7a, a neutral evaluation of wrong edges seemed most logical here. A zero was assigned if an edge was missing in the reference.
An evaluation based on indirect paths did not make immediate sense in scheme 7, as one would need to define a path’s weight. This is usually defined as the sum of all respective edges’ individual weights, whereby a longer path would be rated better than a shorter path. Appropriate definitions are possible (e.g., based on the minimum along the path), but as these are not very useful for practical work with an evaluation scheme, they were not considered in this study.
The evaluation variants can be seen as hypotheses. The next step was to clarify which correlated highest with the diameter and, therefore, would be accepted and which would be declined.
3.8. Statistical Evaluation of the Measured Values
Based on the analyses, each mystery map received 14 values for the evaluation variants from
Table 2. To achieve this, the digitized graphs in the form of TGF-files were computed, based on the scoring rules from
Table 2. The emerging data set allowed comparison of the schemes and variants. Also, the diameter was calculated, as it was the benchmark for the 14 variants.
On this basis, an analysis of the evaluation schemes’ reliability was carried out first by different approaches, before presenting the correlation with the diameter as an argument for validity.
4. Results
This study’s objective was to identify an evaluation technique that is as easy to use as possible. To this end, analytical steps were carried out to compare the various variants (see
Table 2).
The 14 evaluation variants yielded the average results shown in
Table 3 for all mystery maps as an overview. Listed are the mean values (µ) of all mystery maps per variant and the corresponding standard deviations (σ).
First, the wide range of mean values, extending from −8.8 (1a) to 26.9 points (6b), is noticeable. In addition, the standard deviations also show relatively large differences, from 1.4 (1b) to 6.0 (6b). Overall, the b-variants (1b, 2b, etc.) of each scheme received higher mean values than the a-variants, as the negative scoring was absent from the b-variants. Particularly noticeable is the negative mean value of variant 1a, which can be explained by the (thin) reference (see
Figure 2c, Pf-Net) with few edges and very strict scoring (see
Table 2). The scattering of the values is particularly striking in variants 3a and 4a. Due to the rather low mean values and high standard deviations, many mystery maps with negative total scores were to be expected here as well.
4.1. Correlation of a- and b-Variants per Scheme
Although the variants from one scheme (e.g., 1a and 1b, 2a and 2b, etc.) functioned similarly, differences in the structural evaluations were to be expected. In particular, the use of negative points in the a-variants can lead to this. If the reference had only a few edges, then mystery map connections were marked wrong more frequently, as fewer ‘hits’ on the references’ edges could exist. This is then reflected in a more pronounced difference between the corresponding a- and b-variants of a schema. Thus, if the two variants were correlated for each scheme (1a with 1b, 2a with 2b, etc.), the correlation for the Pf-Net with few edges as a reference (schemata 1 and 2) could be seen as significantly lower than the correlation for the rather dense complete reference (Schemata 5, 6, and 7) (
Table 4).
4.2. Correlation of a- and b-Variants with Each Other
The correlation of the seven different schemata with each other made the most sense in terms of content if one considers only either the a-variant or b-variant, as their scoring systems are similar. The results, together with the correlation of each variant with the diameter, can be found in
Table 5 and
Table 6.
Checking the internal consistency with Cronbach’s alpha resulted in a value of 0.94 (standardized alpha) for all 14 variants, which clearly shows that all variants measured a similar aspect of the mystery structure. Divided between the a- and b-variants, a value of 0.86 was obtained for a, and 0.94 for b. This is further indication that the negative pointing of the a-variants leads to greater structural differences in the evaluation.
Numerous variants achieved medium-strong correlations with the diameter. Strong outliers were found with schemes 1 and 2. On the other hand, schemes 3, 4, and 7 appeared promising.
5. Discussion
The rank correlation of diameter and number of points for all variants have low to medium strength. Since all the variants achieve this level, it can be assumed that the evaluation schemes measure similar, but not necessarily identical, aspects of the mystery maps.
Since the diameter is an already-proven measure of the quality of graphs, the objective was to identify (highly) correlating evaluation variants (see
Table 5 and
Table 6, last column). Based on the results, variants 3b, 4a, 4b, and 7b are the most promising, if −0.5 is defined as the minimum value of the correlation. Due to high internal consistency and consistently high correlations, a recommendation can be made on the basis of the variant that is easiest to handle in practice: 3b. Here, neither of the indirect connections must be considered, nor must negative points be awarded. Thus, the evaluation is purely a summation of the edges that correctly coincide with those identified on the reference with relatively low complexity (see
Figure 2b, only edges with g > 4, a total of 23 edges).
In practice, the study presented here demonstrates that it is possible to approach the diagnosis of systems thinking in a complex context containing ESD using the mystery method. Although the ranking correlation of diameter and score seems to be medium strong, it is still clear which students are capable system thinkers and which are not. In the middle quartiles, the evaluation methods’ selectivity still seems to be expandable. However, it should be noted that individual support is important in teaching and it must benefit weaker pupils. They can be identified with the method presented here.
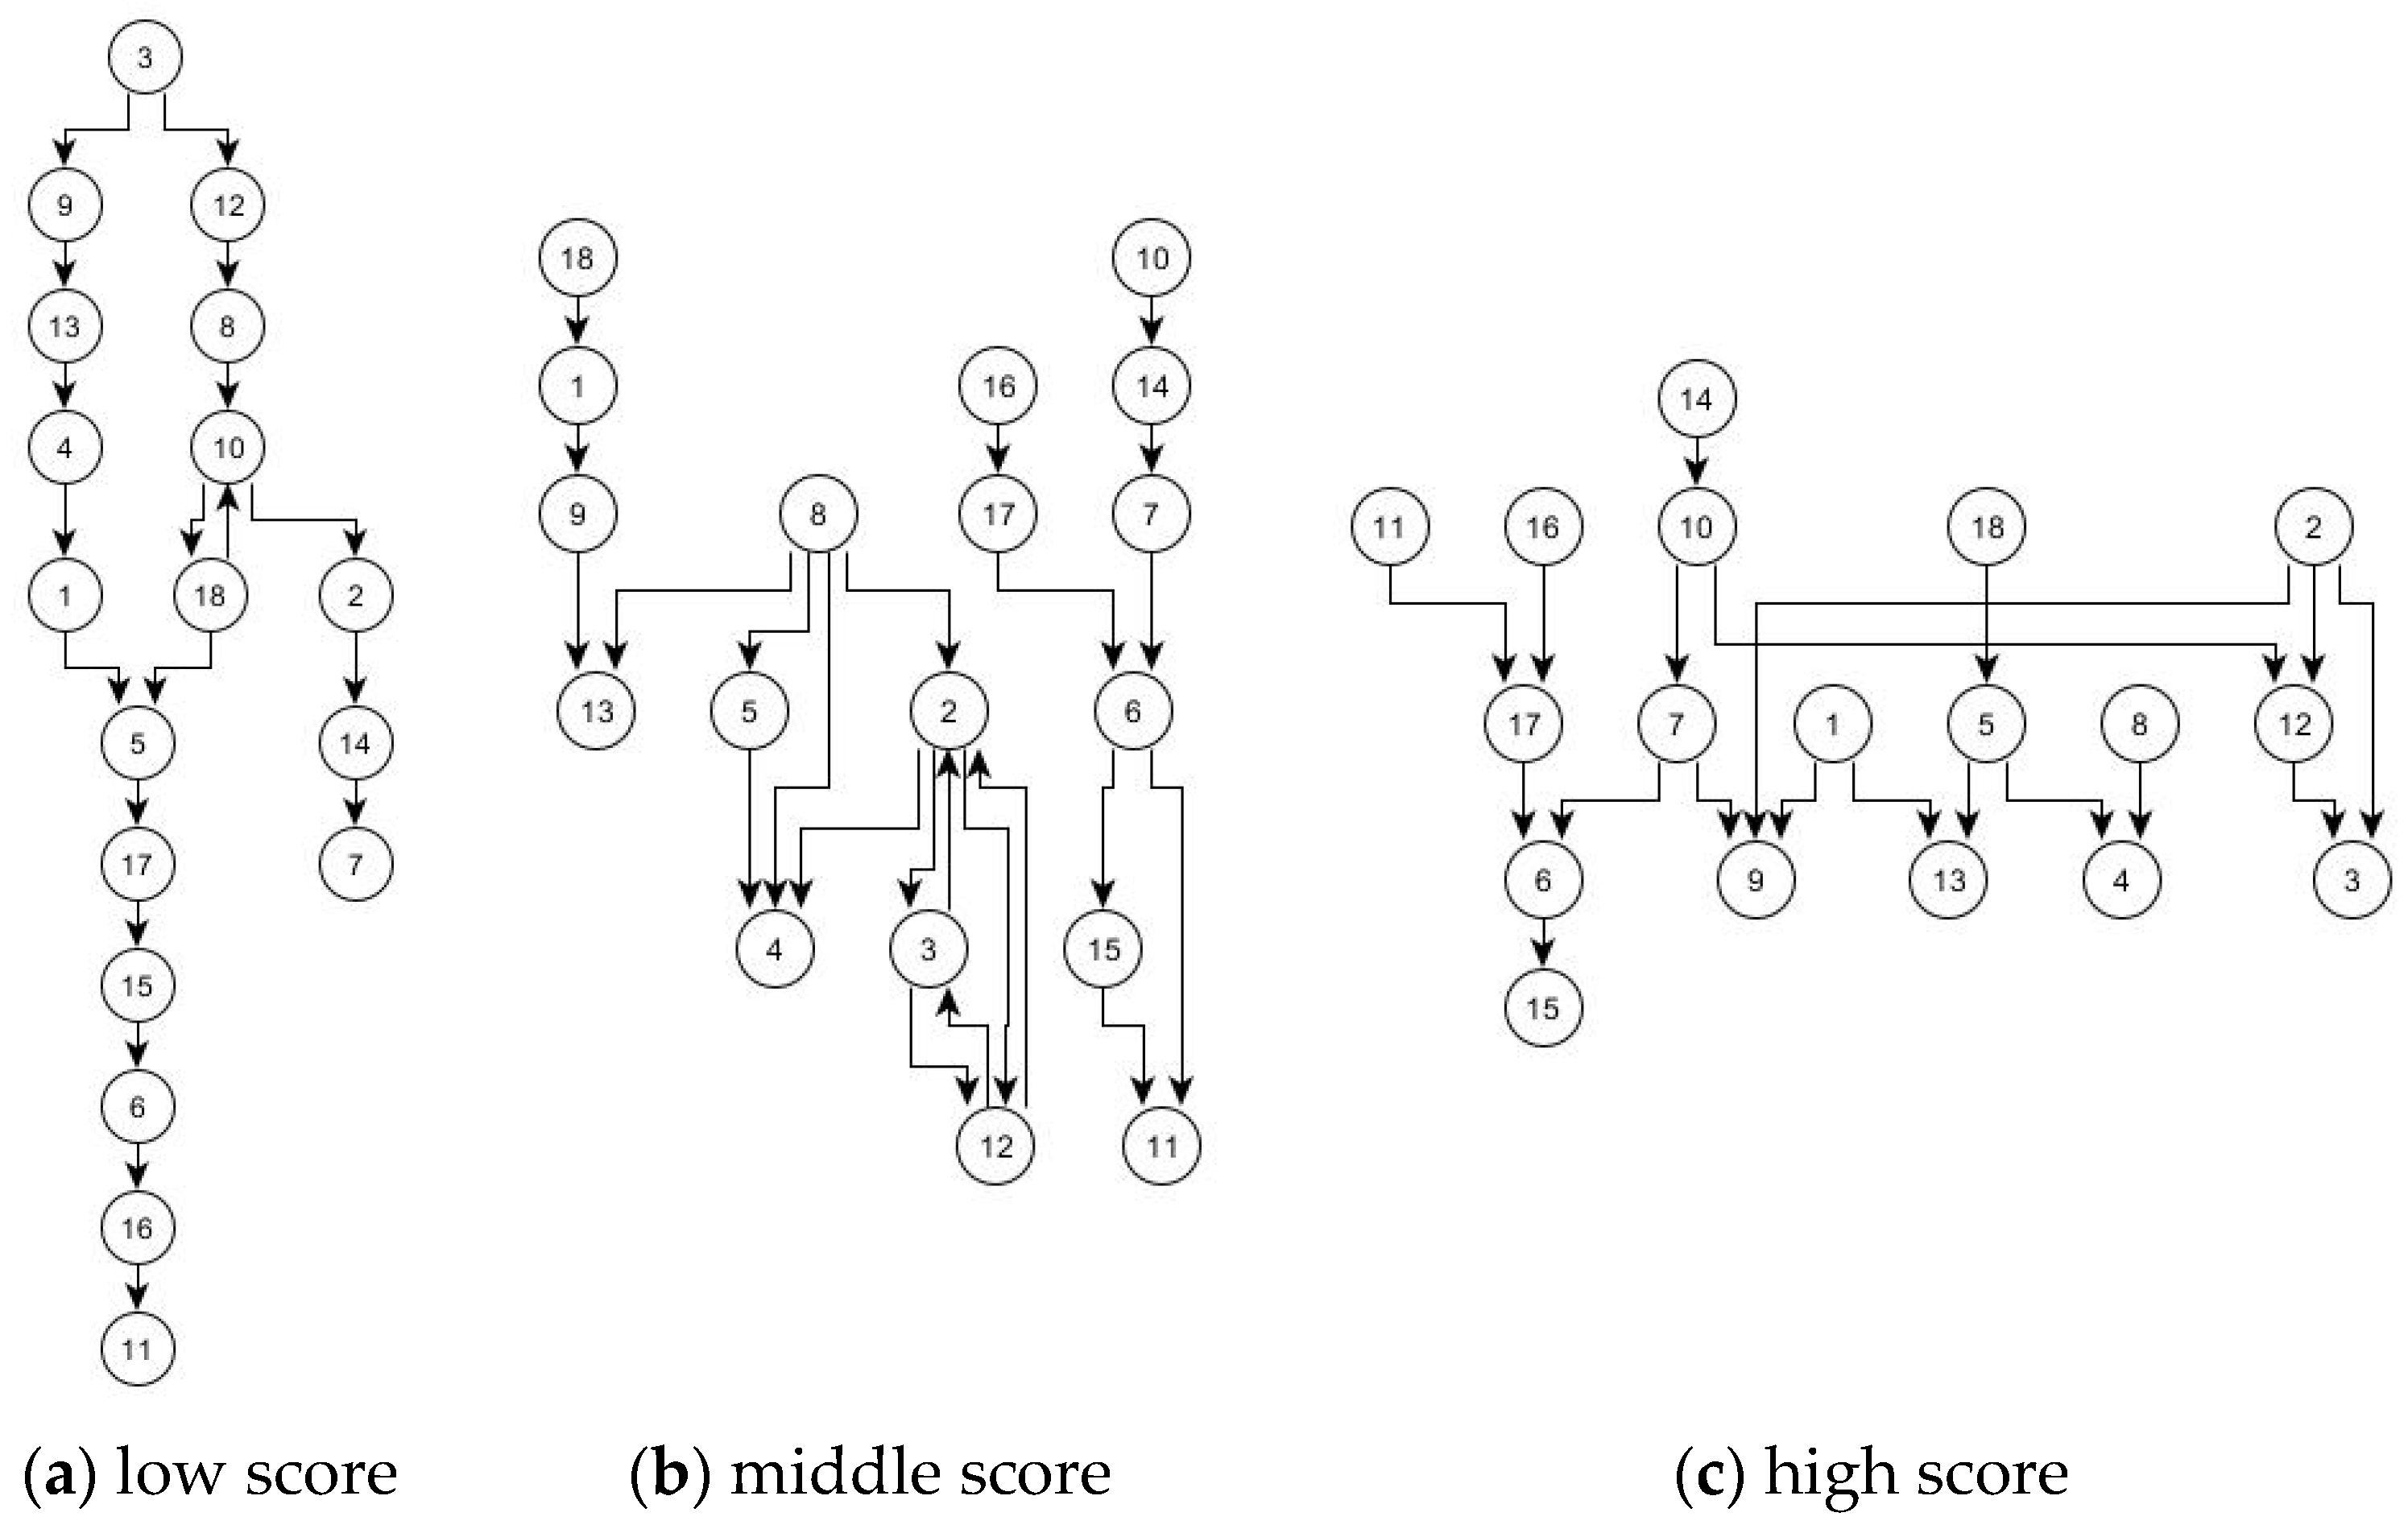
Figure 4 shows, for variant 3b, in (a) the map of the group with the lowest score (−10), in (b) a group with a score of 0 from the midfield, and in (c) the group with the highest score of all (11).
The illustrations in
Figure 4 show, at first glance, understandable differences. Graph (a) is recognizable as the weakest graph, as it has a large diameter, which can be seen from the elongated shape, while (b) is different because more cross-connections can be seen here. However, on closer inspection, it is noticeable that the graph is divided, and the right part also provides a high (partial) diameter. However, (c) is very strongly cross-linked and shows a large width in this representation. It is also striking that (a) and (c) have 19 connections each, while (b) has 23. This is a further indication of the correct function of the methodology, because according to Kinchin [
32], average mappers use many connections, while above average and below average mappers instead construct smaller maps, though above average mappers have more cross-connections. Variant 3b can reproduce these assumptions. It should be noted that the graphs are digitized and then automatically restructured mystery maps, which appear much more confusing in the original (
Figure 1). The structures discernible here are not easily visible to a teacher in the course of a lesson, which is why evaluation technologies are needed.
6. Conclusions
This study’s objective was to develop an evaluation technique for mystery maps based on various references [
4] that should correlate with the diameter as an implemented quality measure of maps/graphs. The evaluation technique should enable teachers to evaluate mystery maps with little effort, with an emphasis on systems thinking regarding the complex networks and the construct of sustainability. Since no such method has been published so far in didactic contexts, the project represents a novelty.
Regarding the evaluation method presented here, it is necessary to create a tool for teachers that enables rapid evaluation of the maps for everyday use. The objective is to enable a quick entry of the connections, which then automatically generate a score for a map. In addition, strong deviations from the reference can be visualized, allowing for targeted promotion of these students.
In summary, it is possible to generate different references within a complex topic on the basis of a mapping technique, which then can be applied in an assessment. To sharpen the method further, more differentiating studies must be carried out. It would be worthwhile to integrate the methodology presented here with other approaches, such as videography, because an interesting conspicuity presented itself: there were no significant differences in the scores of single and group work (cf. methodology section). This difference was not relevant to this project and, as such, received no focus. Nevertheless, it would not correspond to the expectations of cooperative group work [
30,
35] and, therefore, represents an interesting facet for future research. Here, videography could show differentiated indications of individual and group differences and explain our observation.
Similarly, in combination with videography or other approaches, the methodology can be extended to other competences, particularly reading literacy, because the mystery used here has a high degree of text, which was preferred for reasons of uniformity between the information cards. Thus, influences from pictures or diagrams on the processing were avoided. Accordingly, the ability to read was a central requirement in this mystery and is certainly also an interesting aspect in the investigation of mysteries in general.
Further potential areas of application for the methodology presented here include other contexts and subject areas characterized by complexity and interconnectedness, in which networked or systemic knowledge structures are the focus of research, as it is not only in the field of sustainable development that cross-links between dimensions are created [
4]. For example, in the area of teacher training, networking between sub-disciplines [
36] or areas of the teaching profession [
37] are relevant. In the course of a well-founded teacher training program, the diagnostics of the interconnections are absolutely necessary. Whether and how mysteries can be designed and evaluated in this context are considered another exciting branch of research. A correspondingly adapted procedure, in any case, would be conceivable for determining the connections between the relevant areas.


