Process Development of CO2-Assisted Polymer Compression for High Productivity: Improving Equipment and the Challenge of Numbering-Up


Abstract
1. Introduction
2. Materials and Methods
2.1. Materials
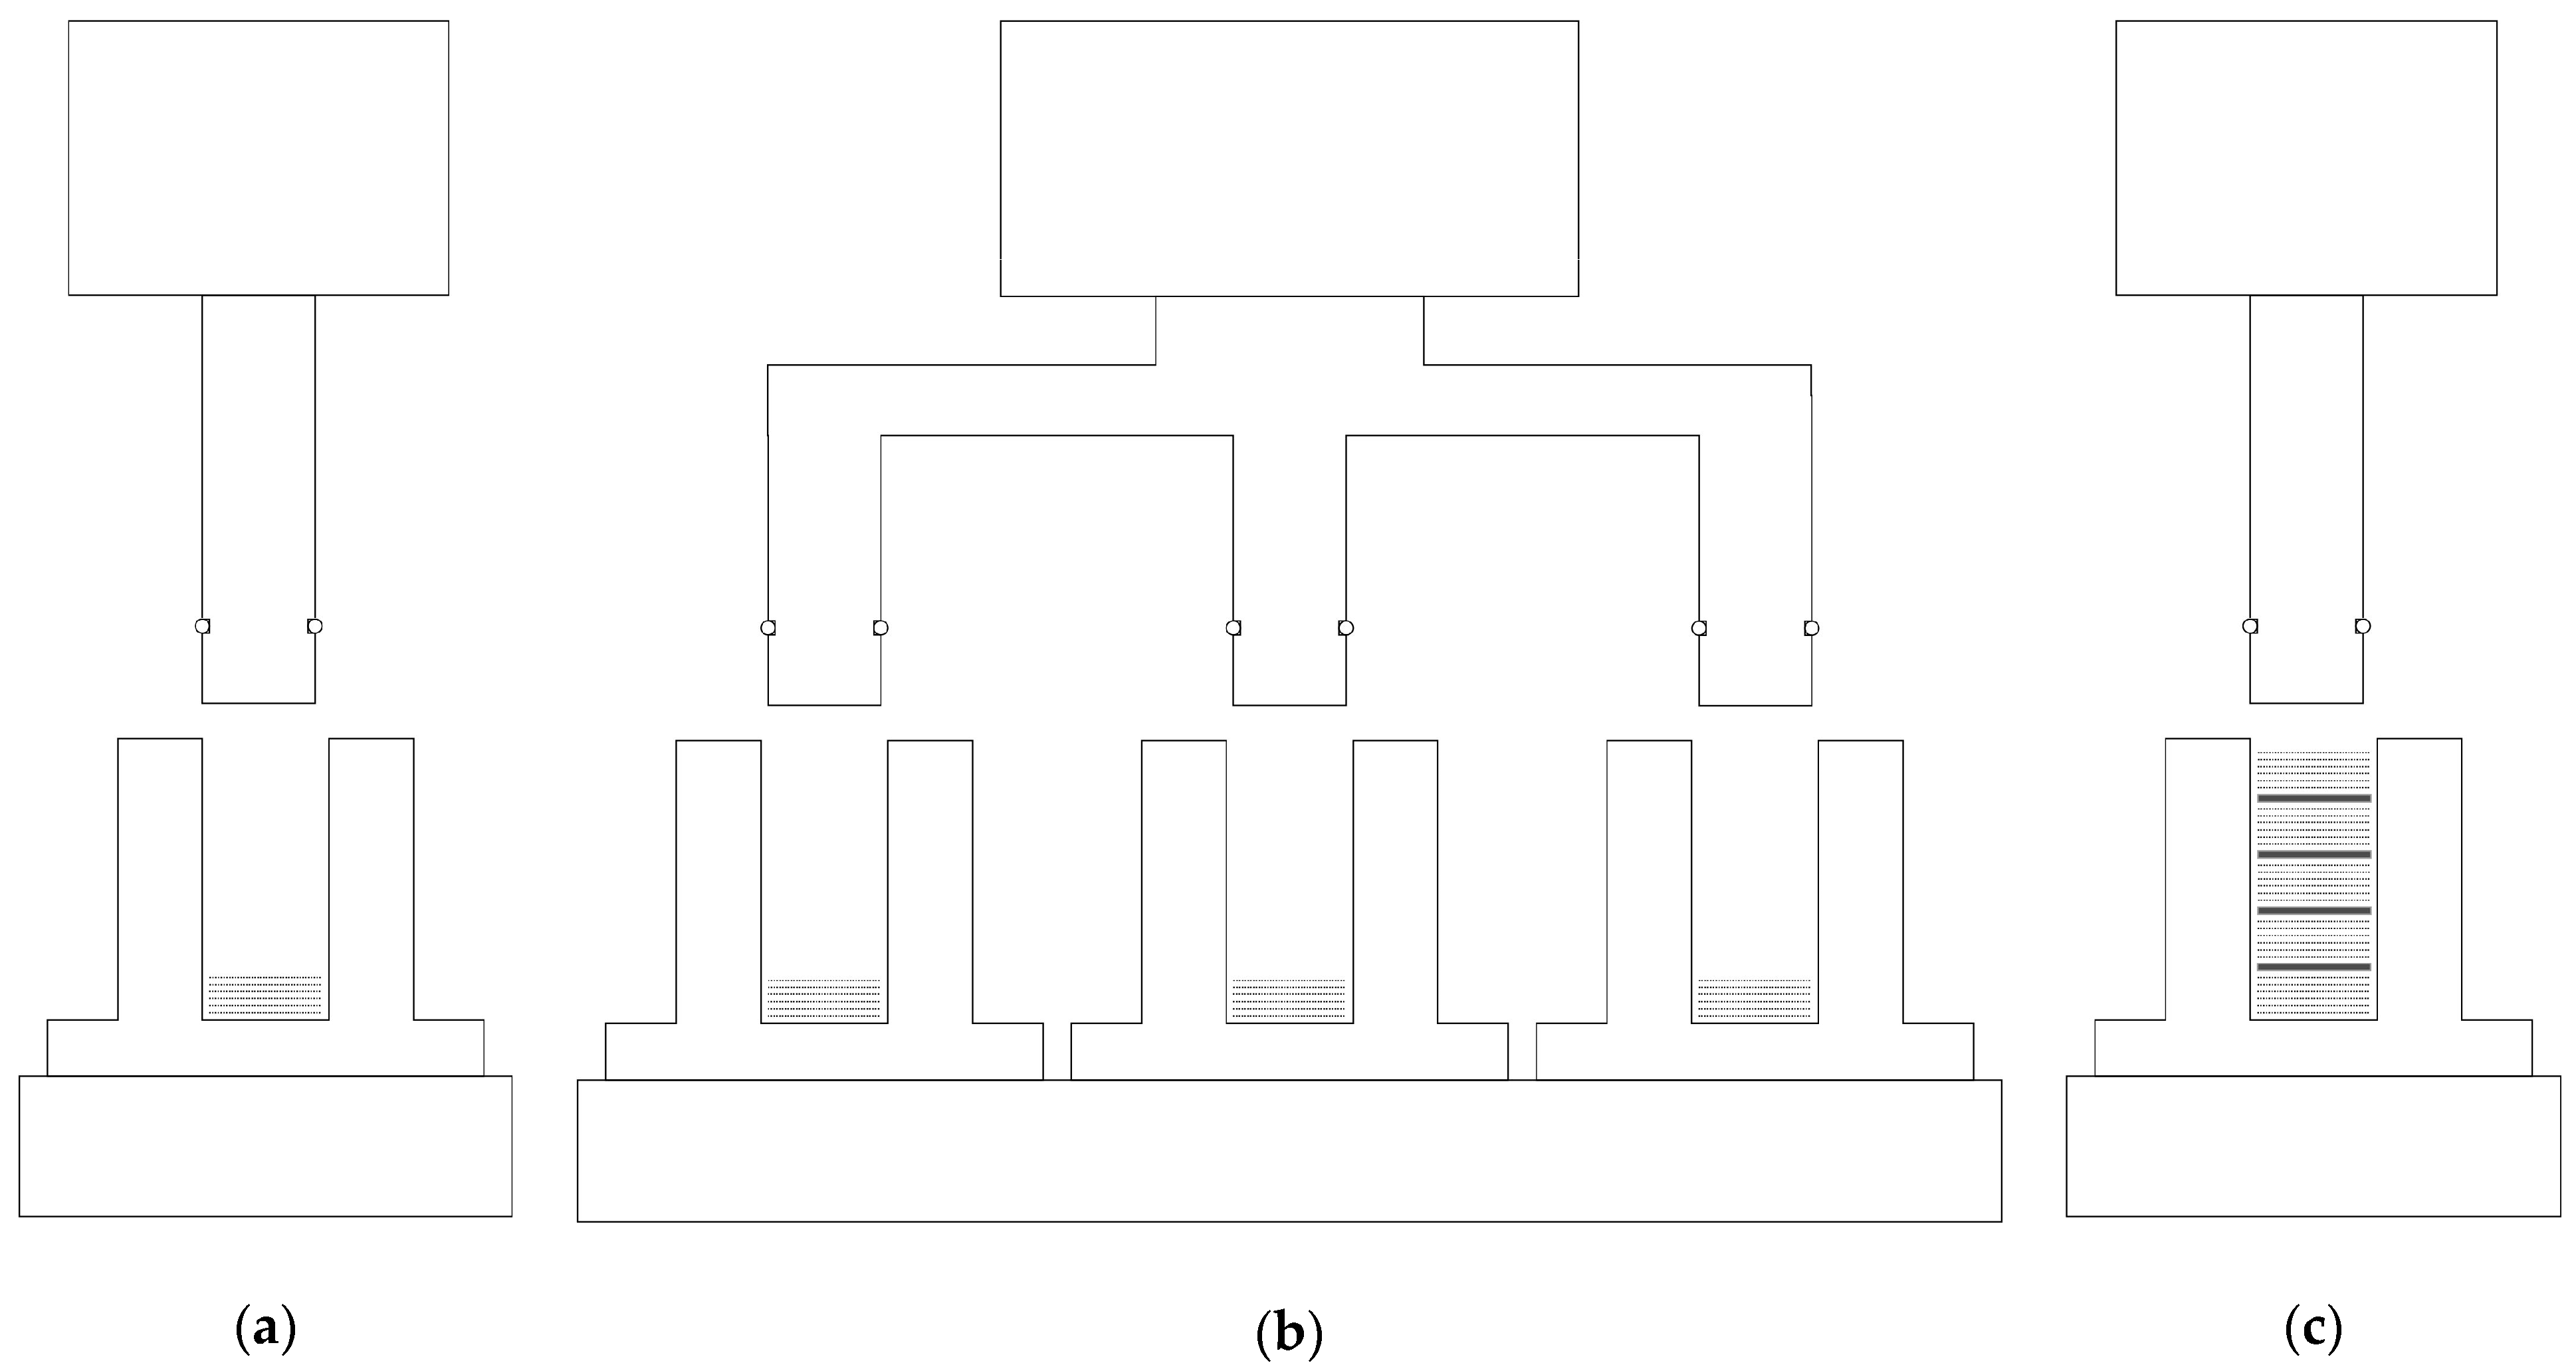
2.2. Equipment
2.3. Experimental Procedure
3. Results and Discussion
4. Conclusions
Author Contributions
Funding
Conflicts of Interest
References
- Young, R.J.; Lovell, P.A. Introduction to Polymers, 3rd ed.; Routledge: Abingdon, UK, 2011; ISBN 978-0849339295. [Google Scholar]
- Fried, J.R. Polymer Science and Technology, 3rd ed.; Prentice Hall: Upper Saddle River, NJ, USA, 2014; ISBN 978-0137039555. [Google Scholar]
- Mills, N.J. Polymer Foams Handbook: Engineering and Biomechanics Applications and Design Guide; Butterworth-Heinemann: Oxford, UK, 2007; ISBN 978-0750680691. [Google Scholar]
- Ishizaki, K.; Komarneni, S.; Nanko, M. Porous Materials—Process technology and applications; Springer Science+Business Media: Dordrecht, NL, USA, 2014; ISBN 978-1461376637. [Google Scholar]
- Aizawa, T. A new method for producing porous polymer materials using carbon dioxide and a piston. J. Supercrit. Fluids 2018, 133, 38–41. [Google Scholar] [CrossRef]
- Kerton, F.; Marriott, R. Alternative Solvents for Green Chemistry, 2nd ed.; RSC Publishing: Cambridge, UK, 2013. [Google Scholar] [CrossRef]
- Eldik, R.; Klärner, F.-G. High Pressure Chemistry–Synthetic, Mechanistic, and Supercritical Applications; Wiley-VCH: Weinheim, Germany, 2002; ISBN 978-3527612628. [Google Scholar]
- Jessop, P.G.; Leitner, W. Chemical Synthesis Using Supercritical Fluids; Wiley-VCH: Weinheim, Germany, 1999; ISBN 978-3527613687. [Google Scholar]
- Taylop, L.T. Supercritical Fluid Extraction; Wiley-Interscience: New York, NY, USA, 1996; ISBN 978-0471119906. [Google Scholar]
- Kazarian, S.G.; Vincent, M.F.; Bright, F.V.; Liotta, C.L.; Eckert, C.A. Specific intermolecular interaction of carbon dioxide with polymers. J. Am. Chem. Soc. 1996, 118, 1729–1736. [Google Scholar] [CrossRef]
- Li, M.; Huang, X.; Liu, H.; Liu, B.; Wu, Y.; Wang, L. Solubility prediction of supercritical carbon dioxide in 10 polymers using radial basis function artificial neural network based on chaotic self-adaptive particle swarm optimization and K-harmonic means. RSC Adv. 2015, 5, 45520–45527. [Google Scholar] [CrossRef]
- Shieh, Y.-T.; Su, J.-H.; Manivannan, G.; Lee, P.H.C.; Sawan, S.P.; Spall, W.D. Interaction of supercritical carbon dioxide with polymers. I. Crystalline polymers. J. Appl. Polym. Sci. 1996, 59, 695–705. [Google Scholar] [CrossRef]
- Shieh, Y.-T.; Su, J.-H.; Manivannan, G.; Lee, P.H.C.; Sawan, S.P.; Spall, W.D. Interaction of supercritical carbon dioxide with polymers. II. Amorphous polymers. J. Appl. Polym. Sci. 1996, 59, 707–717. [Google Scholar] [CrossRef]
- Nalawade, S.P.; Picchioni, F.; Janssen, L.P.B.M. Supercritical carbon dioxide as a green solvent for processing polymer melts: Processing aspects and applications. Prog. Polym. Sci. 2006, 31, 19–43. [Google Scholar] [CrossRef]
- Lian, Z.; Epstein, S.A.; Blenk, C.W.; Shine, A.D. Carbon dioxide-induced melting point depression of biodegradable semicrystalline polymers. J. Supercrit. Fluids 2006, 39, 107–117. [Google Scholar] [CrossRef]
- Kikic, I. Polymer–supercritical fluid interactions. J. Supercrit. Fluids 2009, 47, 458–465. [Google Scholar] [CrossRef]
- Tomasko, D.L.; Li, H.; Liu, D.; Han, X.; Wingert, M.J.; Lee, L.J.; Koelling, K.W. A review of CO2 applications in the processing of polymers. Ind. Eng. Chem. Res. 2003, 42, 6431–6456. [Google Scholar] [CrossRef]
- Jacobs, L.J.M.; Kemmere, M.F.; Keurentjes, J.T.F. Sustainable polymer foaming using high pressure carbon dioxide: A review on fundamentals, processes and applications. Green Chem. 2008, 10, 731–738. [Google Scholar] [CrossRef]
- Feng, D.; Liu, P.; Li, L. Fabrication and cell morphology of a microcellular poly(ether imide)-carbon nanotube composite foam with a three-dimensional shape. J. Appl. Polym. Sci. 2019, 136, 47501. [Google Scholar] [CrossRef]
- Heidari, A.; Fasihi, M. Cell structure-impact property relationship of polypropylene/thermoplastic elastomer blend foams. eXPRESS Polym. Lett. 2019, 13, 429–442. [Google Scholar] [CrossRef]
- Viveiros, R.; Rebocho, S.; Casimiro, T. Green strategies for molecularly imprinted polymer development. Polymers 2018, 10, 306. [Google Scholar] [CrossRef] [PubMed]
- Zhu, J.; Yang, C.; Lu, C.; Zhang, F.; Yuan, Z.; Zhuang, X. Two-dimensional porous polymers: From sandwich-like structure to layered skeleton. Acc. Chem. Res. 2018, 51, 3191–3202. [Google Scholar] [CrossRef] [PubMed]
- Aizawa, T. Fabrication of porosity-controlled polyethylene terephthalate porous materials using a CO2-assisted polymer compression method. RSC Adv. 2018, 8, 3061–3068. [Google Scholar] [CrossRef]
- Aizawa, T. Peel and penetration resistance of porous polyethylene terephthalate material produced by CO2-assisted polymer compression. Molecules 2019, 24, 1384. [Google Scholar] [CrossRef] [PubMed]
- Wakui, Y.; Aizawa, T. Analysis of sustained release behavior of drug-containing tablet prepared by CO2-assisted polymer compression. Polymers 2018, 10, 1405. [Google Scholar] [CrossRef] [PubMed]
- Al-Rawashdeh, M.; Yu, F.; Nijhuis, T.A.; Rebrov, E.V.; Hessel, V.; Schouten, J.C. Numbered-up gas–liquid micro/milli channels reactor with modular flow distributor. Chem. Eng. J. 2012, 207–208, 645–655. [Google Scholar] [CrossRef]
- Kashid, M.N.; Gupta, A.; Renken, A.; Kiwi-Minsker, L. Numbering-up and mass transfer studies of liquid–liquid two-phase microstructured reactors. Chem. Eng. J. 2010, 158, 233–240. [Google Scholar] [CrossRef]
- Tonomura, O.; Tominari, Y.; Kano, M.; Hasebe, S. Operation policy for micro chemical plants with external numbering-up structure. Chem. Eng. J. 2008, 135S, S131–S137. [Google Scholar] [CrossRef]


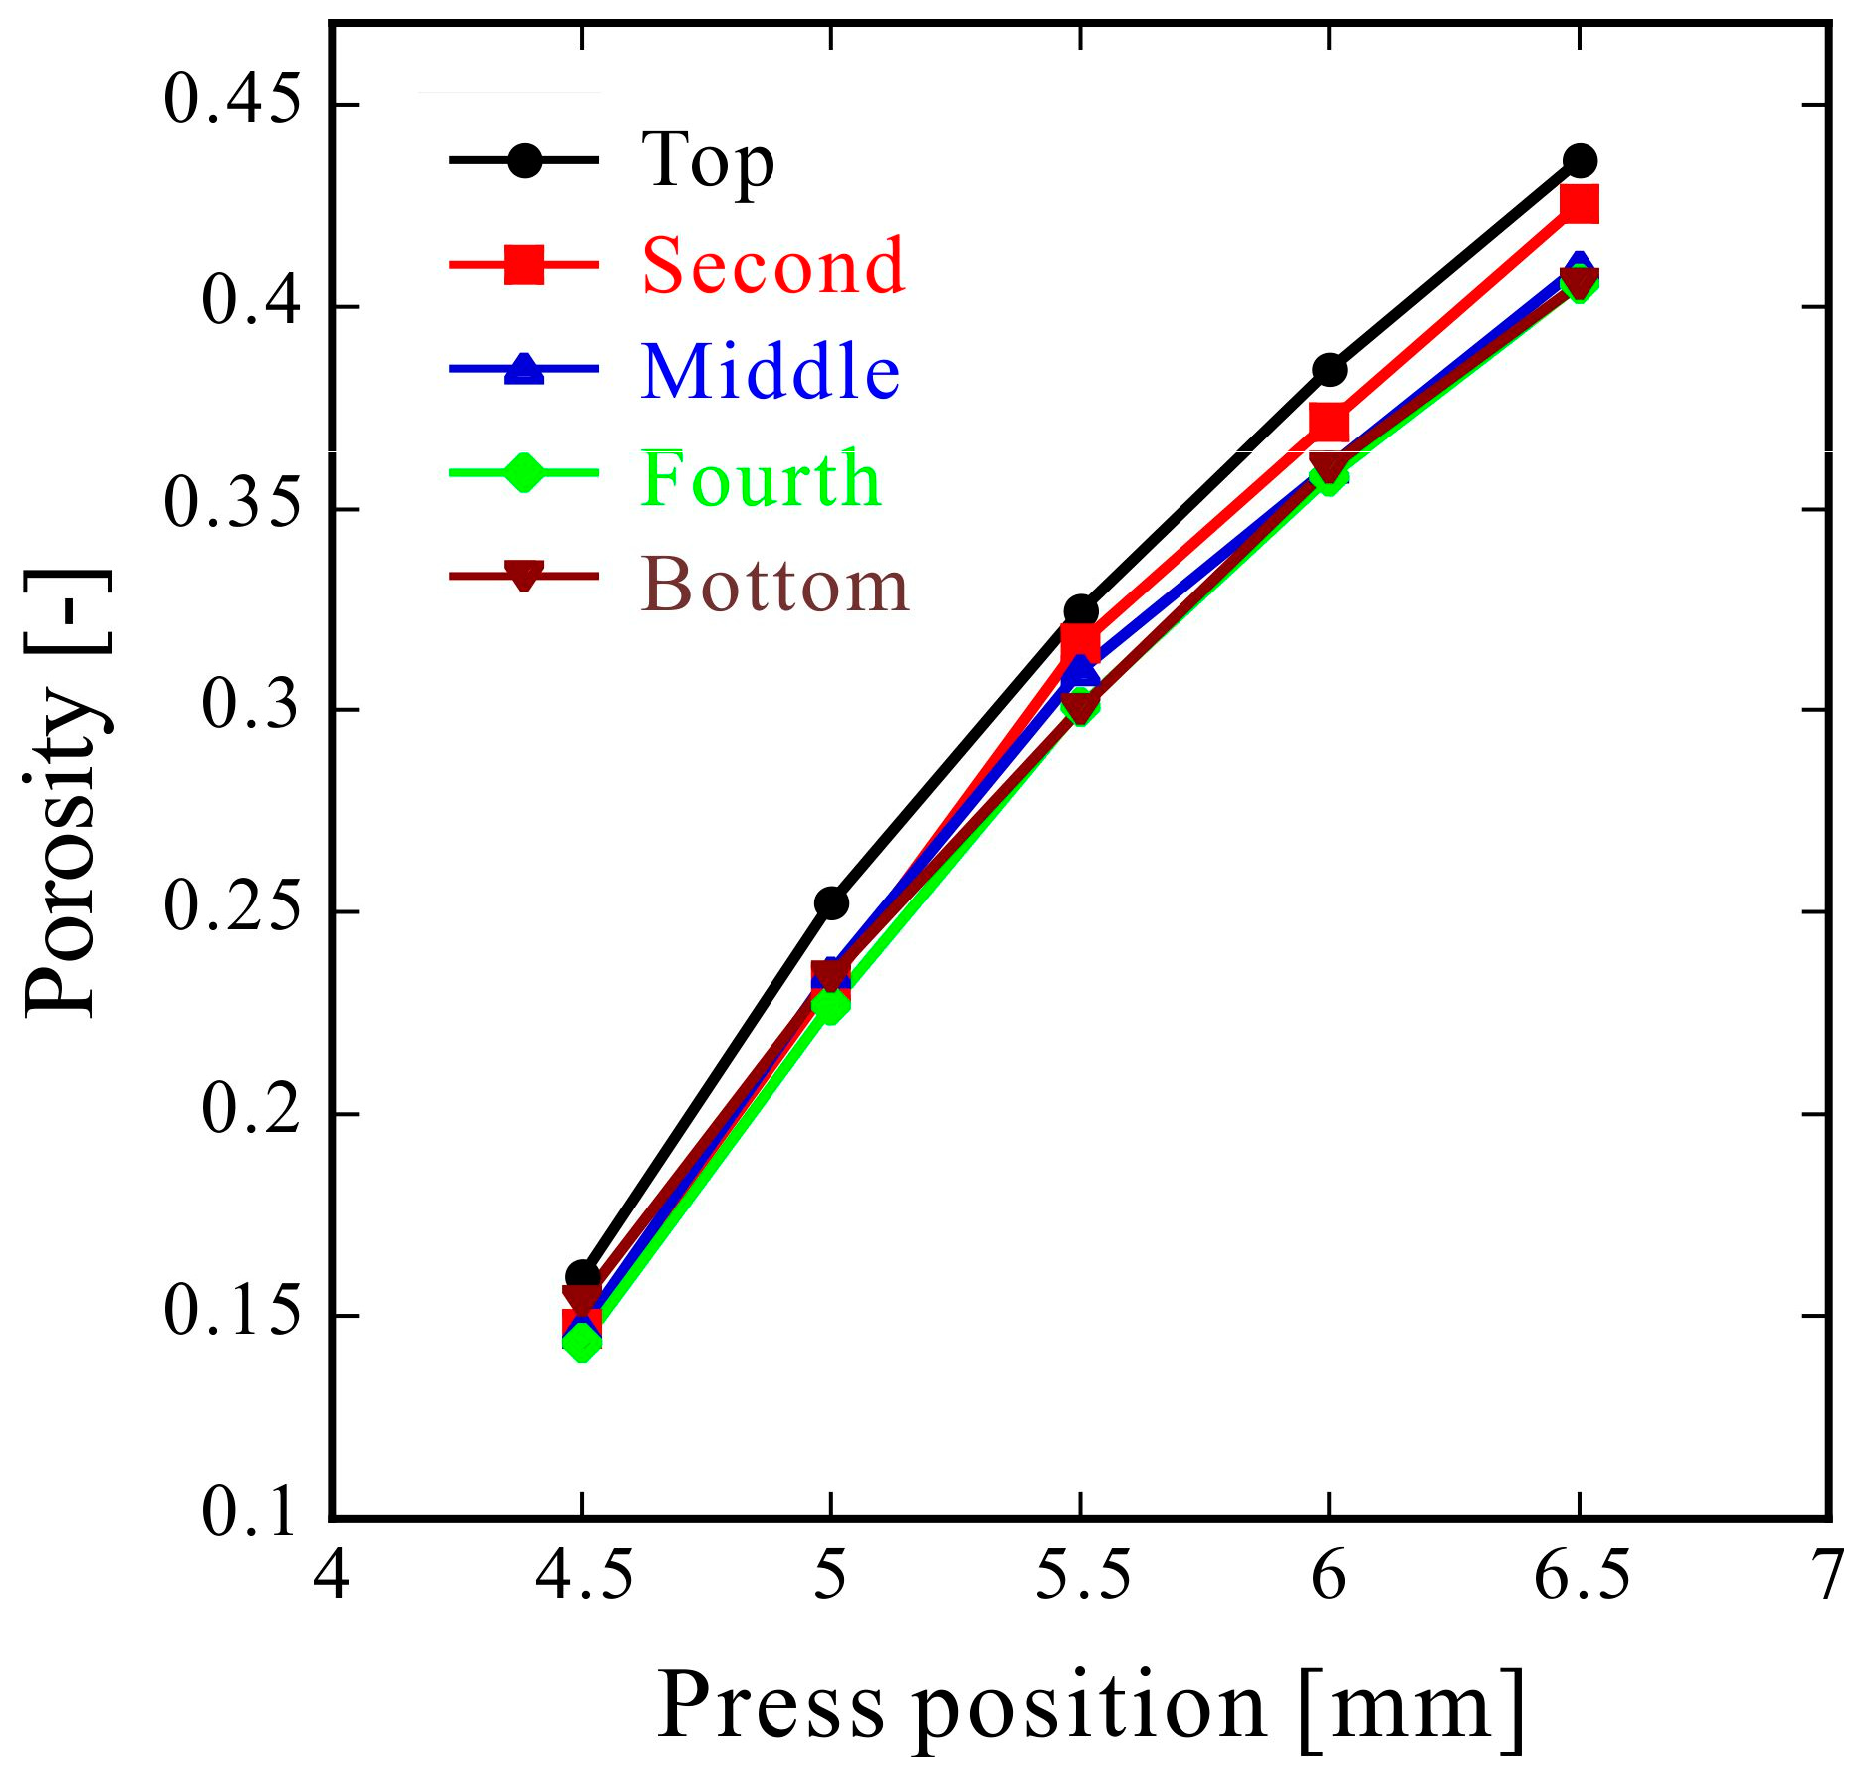
| Press Position [mm] | Sample Position | Thickness [mm] | Standard Deviation [mm] | Porosity [-] | Standard Deviation [-] |
|---|---|---|---|---|---|
| 4.5 | Top | 0.897 | 0.004 | 0.160 | 0.004 |
| Second | 0.884 | 0.006 | 0.147 | 0.006 | |
| Middle | 0.884 | 0.005 | 0.147 | 0.005 | |
| Fourth | 0.880 | 0.007 | 0.143 | 0.007 | |
| Bottom | 0.891 | 0.004 | 0.154 | 0.004 | |
| 5.0 | Top | 1.009 | 0.006 | 0.252 | 0.004 |
| Second | 0.983 | 0.007 | 0.233 | 0.005 | |
| Middle | 0.986 | 0.010 | 0.235 | 0.008 | |
| Fourth | 0.976 | 0.009 | 0.227 | 0.007 | |
| Bottom | 0.985 | 0.009 | 0.234 | 0.007 | |
| 5.5 | Top | 1.117 | 0.013 | 0.325 | 0.008 |
| Second | 1.104 | 0.009 | 0.317 | 0.006 | |
| Middle | 1.093 | 0.009 | 0.310 | 0.005 | |
| Fourth | 1.079 | 0.010 | 0.301 | 0.006 | |
| Bottom | 1.078 | 0.015 | 0.300 | 0.010 | |
| 6.0 | Top | 1.225 | 0.012 | 0.384 | 0.006 |
| Second | 1.200 | 0.014 | 0.371 | 0.008 | |
| Middle | 1.179 | 0.006 | 0.360 | 0.003 | |
| Fourth | 1.175 | 0.016 | 0.358 | 0.009 | |
| Bottom | 1.179 | 0.014 | 0.360 | 0.008 | |
| 6.5 | Top | 1.338 | 0.009 | 0.436 | 0.004 |
| Second | 1.312 | 0.012 | 0.425 | 0.005 | |
| Middle | 1.278 | 0.011 | 0.410 | 0.005 | |
| Fourth | 1.269 | 0.019 | 0.406 | 0.009 | |
| Bottom | 1.269 | 0.010 | 0.406 | 0.005 |
| Press Position [mm] | Sample Position | Thickness [mm] | Standard Deviation [mm] | Porosity [-] | Standard Deviation [-] |
|---|---|---|---|---|---|
| 6.5 | Top | 1.311 | 0.010 | 0.425 | 0.004 |
| Second | 1.293 | 0.019 | 0.417 | 0.009 | |
| Middle | 1.300 | 0.008 | 0.420 | 0.003 | |
| Fourth | 1.294 | 0.011 | 0.417 | 0.005 | |
| Bottom | 1.301 | 0.007 | 0.420 | 0.003 |
© 2019 by the author. Licensee MDPI, Basel, Switzerland. This article is an open access article distributed under the terms and conditions of the Creative Commons Attribution (CC BY) license (http://creativecommons.org/licenses/by/4.0/).
Share and Cite
Aizawa, T. Process Development of CO2-Assisted Polymer Compression for High Productivity: Improving Equipment and the Challenge of Numbering-Up. Technologies 2019, 7, 39. https://doi.org/10.3390/technologies7020039
Aizawa T. Process Development of CO2-Assisted Polymer Compression for High Productivity: Improving Equipment and the Challenge of Numbering-Up. Technologies. 2019; 7(2):39. https://doi.org/10.3390/technologies7020039
Chicago/Turabian StyleAizawa, Takafumi. 2019. "Process Development of CO2-Assisted Polymer Compression for High Productivity: Improving Equipment and the Challenge of Numbering-Up" Technologies 7, no. 2: 39. https://doi.org/10.3390/technologies7020039
APA StyleAizawa, T. (2019). Process Development of CO2-Assisted Polymer Compression for High Productivity: Improving Equipment and the Challenge of Numbering-Up. Technologies, 7(2), 39. https://doi.org/10.3390/technologies7020039