1. Introduction
Large reflector antennas serve as the pivotal signal acquisition and focusing components for radio telescopes, playing a crucial role in planetary science, deep-space exploration, and radio astronomy [
1]. Their high gain, strong directivity, and wide bandwidth make them indispensable for capturing weak signals and performing precise astronomical measurements [
2]. Unlike optical telescopes, radio observations are largely unaffected by weather or interstellar dust, allowing for continuous, all-weather detection across multiple bands [
3]. Driven by the demand for higher sensitivity and resolution, modern antennas are trending toward larger apertures and higher operating frequencies [
4,
5]. Furthermore, the rapid deployment of low-Earth orbit (LEO) satellite constellations and advancements in reusable launch technology have accelerated the global installation of various large-aperture antennas [
6,
7,
8]. Consequently, developing design methodologies that account for local service conditions is essential for enhancing the quality, safety, and reliability of these structures.
However, the increasing aperture of these antennas significantly reduces the structural stiffness and disturbance resistance of the reflectors. Consequently, the performance of large radio telescopes is increasingly susceptible to local climatic conditions. Specifically, operational efficiency is highly dependent on structural deformation and surface accuracy [
9,
10]. During service, external excitations—such as temperature fluctuations, structural self-weight, and wind loads—induce reflector deformation. While gravity-induced [
11,
12] and thermal [
13,
14] deformations are slowly varying factors with well-studied compensation strategies, wind loads present a greater challenge [
15]. Their inherent randomness and time-varying nature result in complex dynamic wind pressure distributions, making it difficult to accurately assess their impact on structural integrity.
To mitigate wind disturbances, researchers have focused on four primary areas: structural optimization, active surface control, radome protection, and advanced servo control algorithms. For instance, the 64 m Parkes Radio Telescope utilizes a segmented design to reduce wind resistance, though this approach limits the effective receiving area for high-frequency waves [
16]. For active surface technology, the Green Bank Telescope in the United States is equipped with 2209 actuators on the back frame to compensate for wind-induced deformation in real time, but the randomness of wind loads makes it difficult to achieve an ideal control effect on wind-induced pointing deviation [
17]. The 65 m Tianma Radio Telescope of Shanghai Astronomical Observatory also utilizes an active surface system, though it faces challenges regarding high costs and actuator failure rates [
18]. While radomes can weaken wind disturbances, they introduce additional electromagnetic loss [
19]. Servo control algorithms, such as linear-quadratic-Gaussian (LQG) control, have been widely used to suppress wind-induced pointing errors in antennas like the 70 m GRAS-4 [
20] and NASA’s Deep Space Network [
21]. However, most current studies simplify the reflector as a rigid body [
22], effectively ignoring the elastic deformation of the reflector surface, which is a critical factor for maintaining the performance of large-aperture antennas. Furthermore, even the few studies adopting the CFD-FEM coupled approach that account for the elastic deformation of the reflector mostly focus merely on the analysis of the global wind-induced vibration response of the structure. They fail to establish a quantitative correlation between wind-induced deformation and the antenna surface accuracy, nor do they reveal the inherent mechanism of surface accuracy degradation under different operational attitudes, rendering the relevant research findings difficult to directly guide the wind-resistant optimization design and active surface control of antennas.
At present, the main research methods for the deformation characteristics of antenna reflectors under wind loads include theoretical modeling, numerical simulation, wind tunnel test, and field measurement [
23]. Limited by cost, versatility, and experimental implementation difficulty, numerical simulation has become the most widely used research method [
24]. Based on computational fluid dynamics (CFD) technology, numerical simulation can realize the numerical calculation of wind load characteristics of structures with low computational cost and scale independence, and can efficiently obtain wind-induced responses under various working conditions [
25]. Mamou et al. [
26] carried out CFD simulations for large telescopes and discussed the correlation between simulation results and wind tunnel experimental data. Ladd et al. [
27] conducted CFD numerical simulations for the Giant Magellan Telescope (GMT), and the results provided a reference for the structural design and site selection of the telescope. Although systematic research progress has been made in the wind load mechanism of large-aperture reflector antennas by scholars based on CFD simulations and wind tunnel tests, obvious research gaps still exist in current relevant CFD-FEM coupled studies. Most of these studies concentrate on the qualitative analysis of wind pressure distribution characteristics and the global structural vibration response, without establishing a quantitative correlation mechanism among random wind loads, elastic deformation of the reflector, and surface accuracy degradation. Meanwhile, existing studies mostly perform steady-state wind load analysis at a single elevation angle, which fails to cover the full operational elevation range of the antenna, nor can they reveal the evolution law and inherent physical mechanism of surface accuracy under different working attitudes subjected to transient random wind disturbances. Consequently, the relevant research results are difficult to directly guide the wind-resistant optimization design and active surface control of large-aperture antennas.
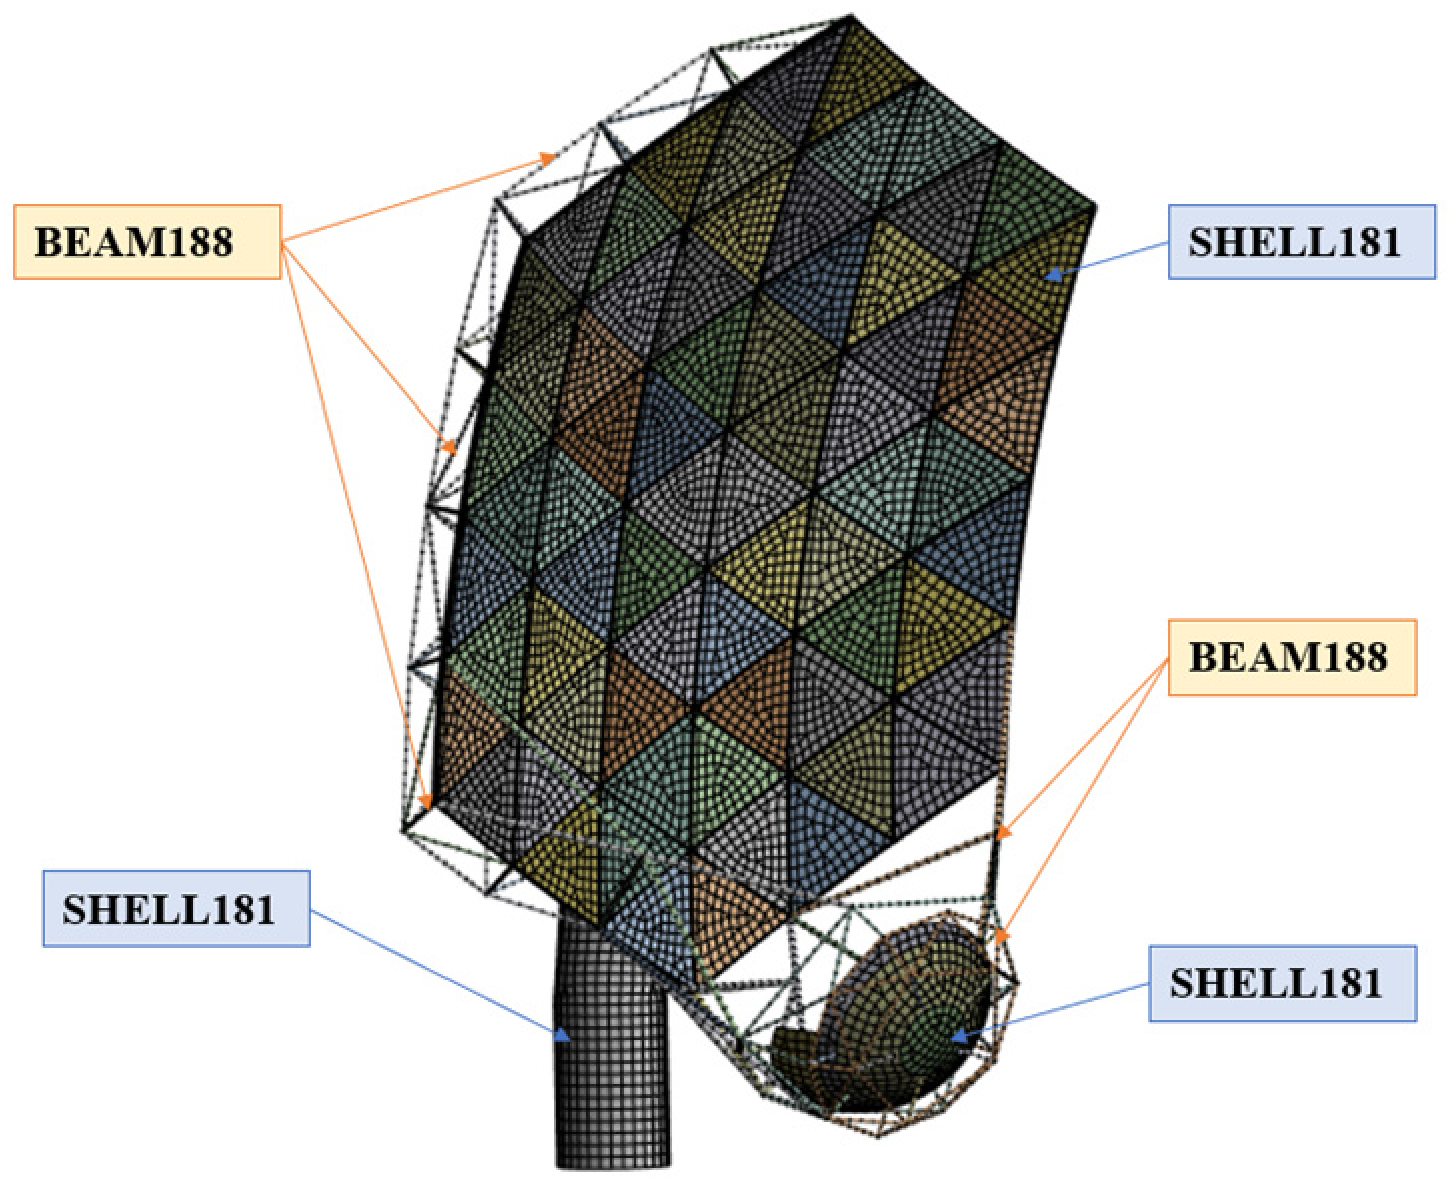
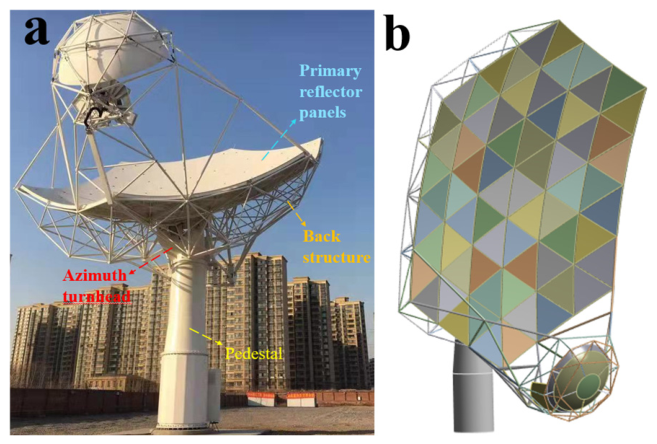
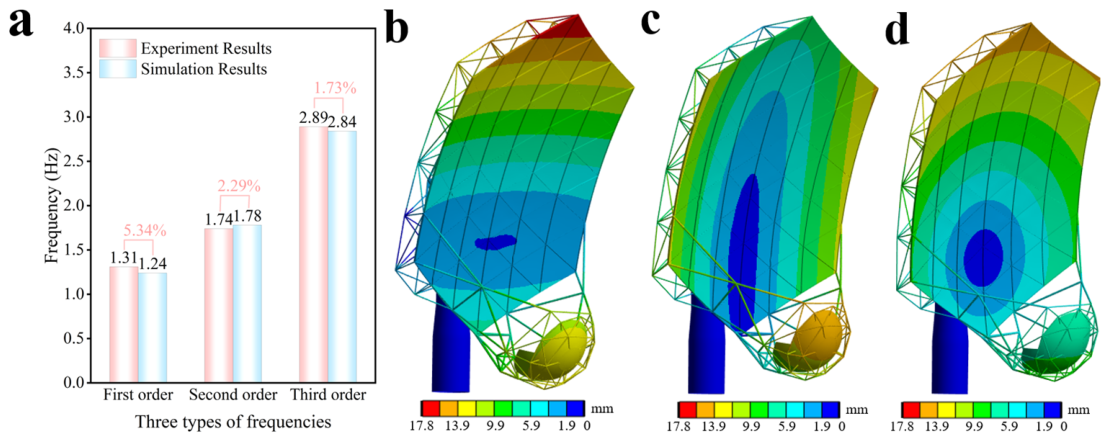
To address these gaps, this paper takes the 15 m × 18 m aperture reflector antenna of the Square Kilometer Array (SKA) as the research object. First, a refined finite element model with detailed structural characteristics of the antenna is established and validated by modal test data. Then, a CFD-FEM coupled fluid–structure interaction (FSI) simulation model of the antenna-wind load interaction is established to calculate the wind pressure coefficient distribution on the reflector surface under different attitudes, and the invariance of the wind pressure coefficient distribution under local environmental wind speeds is verified. On this basis, through transient dynamic analysis covering the full operational elevation range of the antenna, the strong correlation between wind-induced deformation and surface error is clarified, the critical working conditions for surface accuracy degradation of the antenna are accurately identified, the inherent physical mechanism of surface accuracy deterioration under different attitudes is elucidated, and the influence law of transient wind disturbance on antenna accuracy at different elevation angles is systematically investigated. The research results of this paper can provide a solid theoretical basis for the wind-resistant optimization design and the development of active surface control strategies for large-aperture reflector antennas.
3. Computational Fluid Dynamics and Wind Field Simulation
3.1. CFD Numerical Model for Wind Field Simulation
To analyze the wind load characteristics of the antenna, a CFD numerical model of the wind field was established based on the Fluent platform, and the wind pressure distribution on the primary reflector was solved. Owing to the limitations of the mesh generation method, high-quality meshes cannot be effectively generated on the antenna truss members. Additionally, the antenna back-frame is a truss-type openwork structure with a projection shielding ratio of less than 5% on the windward side of the primary reflector, and its influence on the wind pressure distribution of the primary reflector is negligible. Therefore, the back-frame structure is omitted during meshing, and only the finite element models of the dish-shaped primary reflector and hemispherical secondary reflector are established to analyze the wind pressure distribution. The wind pressure loads calculated by this simplified scheme are higher than those under actual operating conditions, and the conclusions on structural response and surface accuracy derived therefrom are conservative, which does not affect the reliability of the core conclusions of this paper.
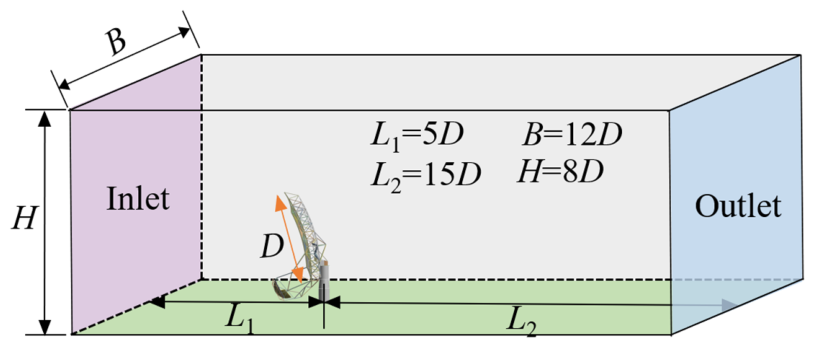
To facilitate fully developed turbulence and mitigate blockage effects, the computational domain was optimized to maintain a maximum blockage ratio of 3%. The characteristic length
of the antenna is taken as 18 m, representing the maximum projection of the reflector. According to the specification in the literature [
30], the geometric parameters of the calculation domain are determined as follows: the upstream length
, the downstream length
, the width
, and the height
. Based on the above parameters, the blocking rate of the calculation domain is calculated as:
It can be seen from Equation (1) that the blocking rate meets the requirements. Since the analysis model used this time is a dish-shaped reflector antenna, for the sake of conservatism, the maximum projection size is taken as the characteristic length, that is,
. The antenna calculation domain model is constructed based on the above size parameters, as shown in
Figure 4. An unstructured mesh was adopted for the discretization of the calculation domain, following the principle of progressive advancement from the boundary surface to the volume elements. Local mesh refinement was carried out on the wall surfaces of the primary and secondary reflectors, with a mesh size of 60 mm. The mesh was encrypted near the wall surface and gradually sparsified in the area far away from the antenna, to improve the refinement and numerical accuracy of the flow field solution and reduce the calculation deviation introduced by mesh discretization.
The boundary conditions were defined to accurately simulate the atmospheric boundary layer. The domain inlet was set as a velocity inlet, while the outlet was defined as a pressure outlet with a zero normal gradient applied to all physical quantities. To minimize boundary interference, the top and lateral surfaces of the computational domain were also configured as pressure outlets. The bottom surface (ground) and the surfaces of the primary and secondary reflectors were modeled as no-slip walls.
Numerical simulations were conducted within the Reynolds-Averaged Navier–Stokes (RANS) framework using the Shear Stress Transport (SST)
turbulence model. This model was selected for its superior capability in capturing flow gradients and separation in near-wall regions [
31]. This turbulence model has been widely verified in transient FSI analysis of fluid machinery such as cross-flow Savonius turbines, and can accurately predict the unsteady flow characteristics and dynamic load distribution under low Reynolds number conditions [
32]. The governing equations for the SST (
) model are defined as follows:
where
represents the generation of turbulent kinetic energy,
is the generation rate of specific dissipation rate
,
and
are the effective diffusion coefficients of
and
,
and
represent the turbulent dissipation of
and
,
and
are user-defined source terms, and
is the cross-diffusion term. Within this framework, the turbulent kinetic energy
, turbulent dissipation rate
, and specific turbulent dissipation rate
are defined as follows:
where
is the wind speed at the reference height;
is the turbulence intensity;
is a constant usually taken as 0.09; and
is the turbulence length scale.
3.2. Calculation of Wind Pressure Coefficient
The aerodynamic impact of wind loads on the antenna structure is conventionally quantified by the dimensionless wind pressure coefficient
. The local surface wind pressure coefficient is defined as follows:
where
is the local static pressure on the structural surface,
is the free stream static pressure,
is the air density, and
is the free stream velocity. The actual wind pressure acting on the reflector is composed of the pressure difference between the windward side and the leeward side, so the surface wind pressure coefficient can be expressed as follows:
where
and
are the wind pressure coefficients on the front and back surfaces of the reflector, respectively.
To verify the invariance of the wind pressure coefficient distribution on the antenna reflector under local environmental wind speeds, the wind pressure coefficients under different wind speed conditions (15 m/s, 20 m/s, 25 m/s) covering the local wind speed range were calculated, and the influence of elevation angle (15°~90°) on the wind pressure distribution was investigated with the azimuth angle fixed at 0°.
3.3. Characterization of Instantaneous Wind Field Time History
To enhance the fidelity of fluctuating wind simulations and accurately capture the effects of stochastic wind loads, the wind power spectral density (PSD) was modeled using the Davenport spectrum [
33]. This spectrum is widely recognized in wind engineering for describing horizontal gustiness. The power density function of the Davenport spectrum utilized in this study is defined as:
where
,
is the average wind speed at the height of 10 m (taken as 20.9 m/s in this study),
is the coefficient reflecting the ground roughness (taken as 0.00129 according to the literature [
34]), and
is the frequency of fluctuating wind, with a value range of
Hz.
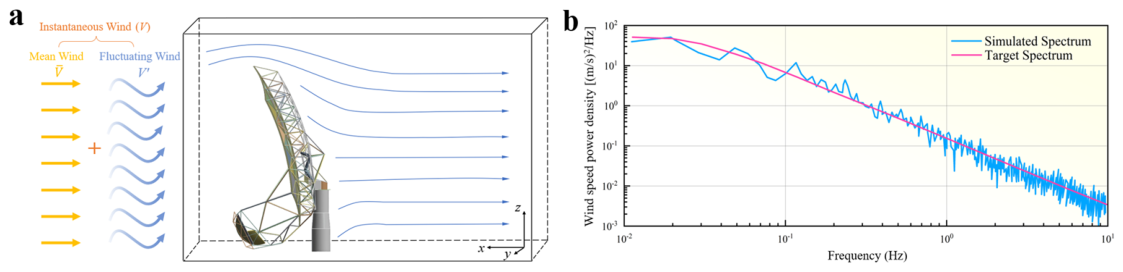
Given that the total height of the antenna is only 25 m, vertical wind speed gradients are relatively minor. Consequently, the inflow at the computational boundary was treated as a uniform flow field, assuming constant velocity across the height. The antenna is positioned in a face-on windward orientation relative to the incoming flow, as illustrated in
Figure 5a. The wind speed time series was generated using a linear filtering method based on an autoregressive (AR) model [
35].
As shown in
Figure 5b, the simulated power spectrum demonstrates excellent agreement with the target Davenport spectrum within the critical frequency range of 0.01–10 Hz, satisfying the accuracy requirements for wind load characterization. The frequency-domain complex amplitudes were transformed into the time domain via Inverse Fast Fourier Transform (IFFT) to produce the fluctuating wind speed time history.
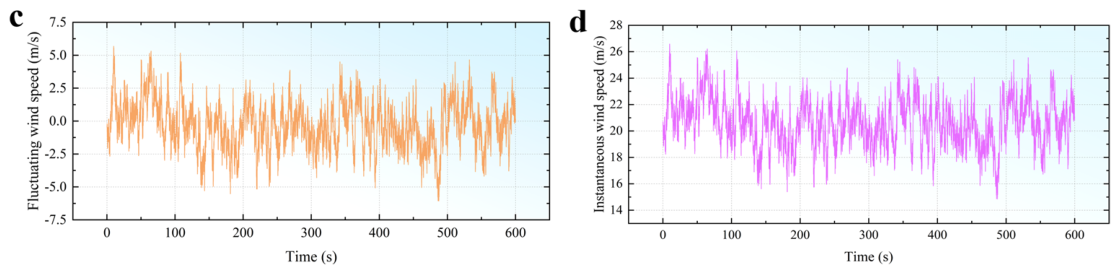
Figure 5c presents the resulting time history at the center of the primary reflector. From a statistical perspective, the simulated signal exhibits the characteristic randomness and non-stationarity inherent in turbulent fluctuations. The wind speed at the same node changes randomly with time, which conforms to the basic statistical laws of turbulent fluctuations. In terms of its physical composition, the instantaneous wind can be decomposed into two parts: the mean wind and the fluctuating wind. The former, as a deterministic function of spatial position, is usually characterized by a mean wind profile (such as a logarithmic law or exponential law profile). The latter is regarded as a random field of time and space, often modeled as an ergodic Gaussian process, and characterized by statistical indicators such as turbulence intensity, power spectral density, and turbulence integral scale.
The instantaneous wind speed at any point in the space can be expressed as the superposition of the average wind speed and the fluctuating wind speed:
where
is the average wind speed,
is the time-dependent fluctuating wind speed, and
,
,
are the fluctuating wind components in the
,
,
directions, respectively. The time history of the instantaneous wind speed at the center of the main reflector of the antenna under the action of horizontal crosswind is shown in
Figure 5d.
3.4. Fluid–Structure Interaction (FSI) Numerical Implementation
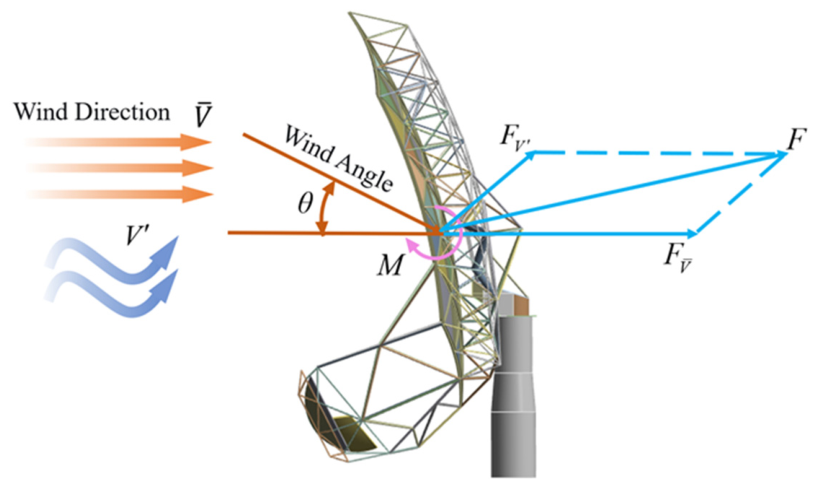
The dynamic wind load exerted on the antenna structure is characterized by two distinct components: a deterministic mean component and a stochastic fluctuating component [
36]. A schematic representation of these forces is provided in
Figure 6. Here,
denotes the total wind force,
represents the wind force generated by the mean wind, and
refers to the wind force generated by the fluctuating wind.
is the wind moment caused by the wind load. θ denotes the wind incidence angle, defined as the angle between the incoming wind vector and the antenna pointing direction.
In this study, the spectral representation method was employed to synthesize the instantaneous wind speed time history based on the prescribed fluctuating wind spectrum. This facilitated a comprehensive evaluation of the structural dynamic response under various wind excitations. To calculate the wind loads, a wind-aligned coordinate system was established, resolving the total aerodynamic force into three orthogonal components: drag, lift, and lateral forces. The instantaneous wind force at a specific point as
, accounting for both mean and fluctuating contributions, is expressed as:
where
is the air density (taken as 1.25
),
is the wind pressure coefficient at point
, and
is the windward area corresponding to point
.
The FSI numerical simulation was implemented by the following steps: (1) Pressure mapping: The wind pressure coefficient distribution on the reflector surface under different elevation angles was obtained through CFD steady-state simulation; (2) Wind field synthesis: The instantaneous wind speed time history was generated based on the Davenport spectrum; (3) Load Mapping: The dynamic wind load time history at each node of the reflector was calculated according to the wind pressure coefficient and instantaneous wind speed, and was loaded onto the FE model of the antenna; (4) Transient analysis: Transient dynamic analysis was carried out to obtain the wind-induced deformation, stress response, and surface accuracy evolution of the antenna structure under different elevation angles. To ensure the statistical reliability of the results, three independent realizations of the instantaneous wind field were simulated and analyzed.
3.5. Evaluation Metric for Surface Accuracy
Surface accuracy is the core index that determines the electromagnetic wave reflection and focusing quality and electrical performance of the antenna, and is the key evaluation basis for the design and optimization of high-precision antennas [
37]. The root mean square error (RMSE) of structural deformation is used as the quantitative index of surface accuracy [
38], which is calculated by the square root of the mean square deviation between the discrete sampling points and the best-fit paraboloid. Compared with the extreme value index, RMSE can comprehensively characterize the overall surface deviation of the reflector, taking into account the cumulative effect of local micro-deformation and the integrity of the overall surface. The RMSE is calculated as:
where
is the number of sampling points on the reflector surface,
is the deformation of the
-th sampling point, and
is the average deformation of all sampling points.
4. Results and Discussion
4.1. Wind Pressure Distribution Characteristics on the Reflector Surface
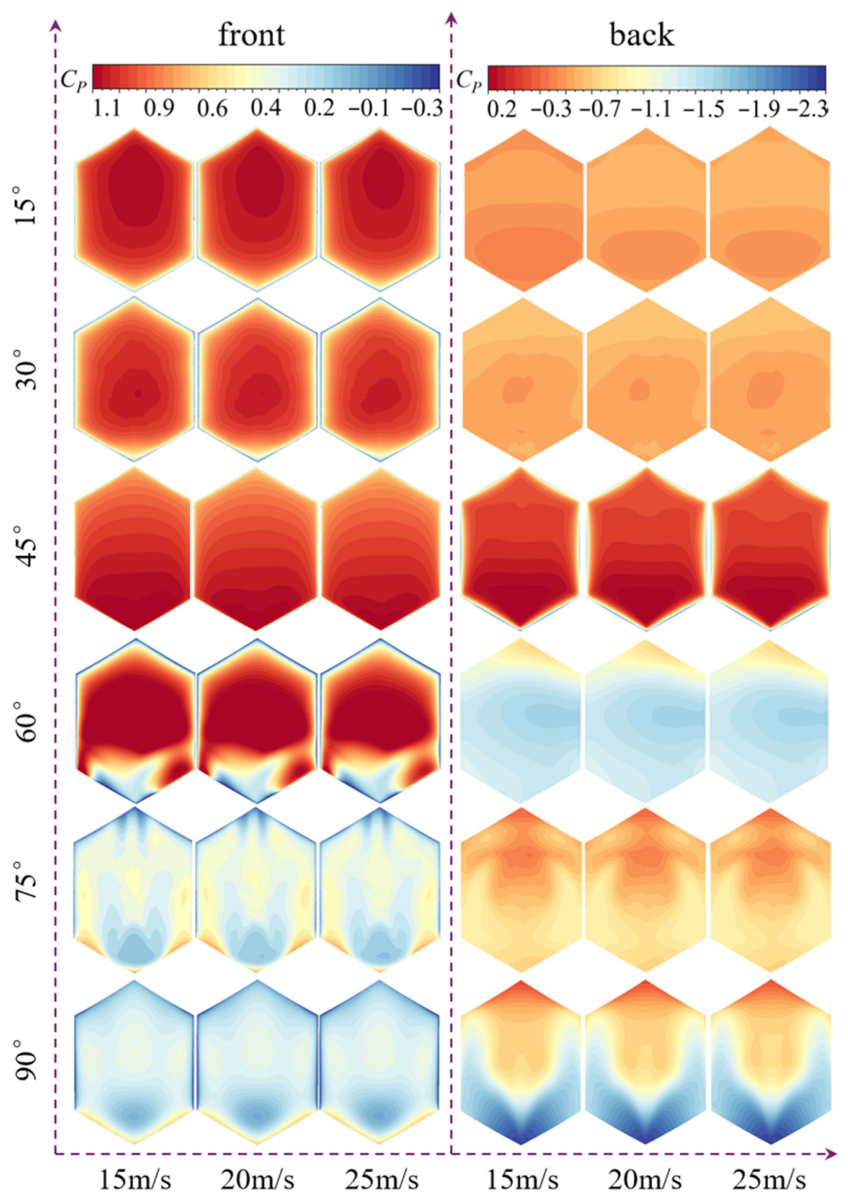
The wind pressure coefficient distribution on the front and back surfaces of the antenna reflector under different elevation angles and wind speeds is shown in
Figure 7. The results show that the distribution of the wind pressure coefficient on the antenna reflector surface is independent of the wind speed, which verifies the distribution invariance of the wind pressure coefficient under local environmental wind speeds. This conclusion provides a basis for the subsequent calculation of dynamic wind loads under instantaneous wind speeds.
For the hexagonal dish-shaped antenna with a secondary reflector, the wind pressure coefficient distribution under different elevation angles (15°~90°) shows significant angle dependence, which is jointly regulated by the dish curvature of the reflector, the blocking of the secondary reflector, and the incident characteristics of the airflow. The wind pressure distribution under different elevation angles can be divided into three stages: at the low elevation angle stage (15°, 30°), the primary reflector presents a deep dish-shaped structure. The front surface is dominated by positive pressure, with a high peak value in the central area, reaching 1.1 at 15°. The back surface presents a large-scale gradient negative pressure distribution. This is because the deep dish-shaped structure forms a significant “air pocket effect”, and the incoming flow directly impacts the concave surface of the reflector, resulting in high positive pressure in the central area. At the medium elevation angle stage (45°, 60°), the dish curvature of the reflector decreases with the increase in elevation angle, and the reflector tends to be flat. The peak value of positive pressure on the front surface gradually decreases, dropping to 0.6 at 45° with a more uniform distribution, and the gradient of the negative pressure area on the back surface becomes slower. At high elevation angle stage (75°, 90°), the primary reflector is approximately planar. A local negative pressure area appears on the front surface at 75°, and the front surface distribution tends to be uniform at 90°, with a peak value of 0.57. A large negative pressure appears on the back surface, as low as −2.3. At this stage, the incoming flow is parallel to the reflector axis, and the flow separation on the back surface leads to a significant negative pressure area.
The above distribution law clarifies the wind pressure load characteristics of the primary reflector under different working conditions, and provides a flow field basis for the wind resistance strength design and wind-induced vibration control of the antenna structure.
4.2. Wind-Induced Deformation and Stress Response of the Antenna Structure
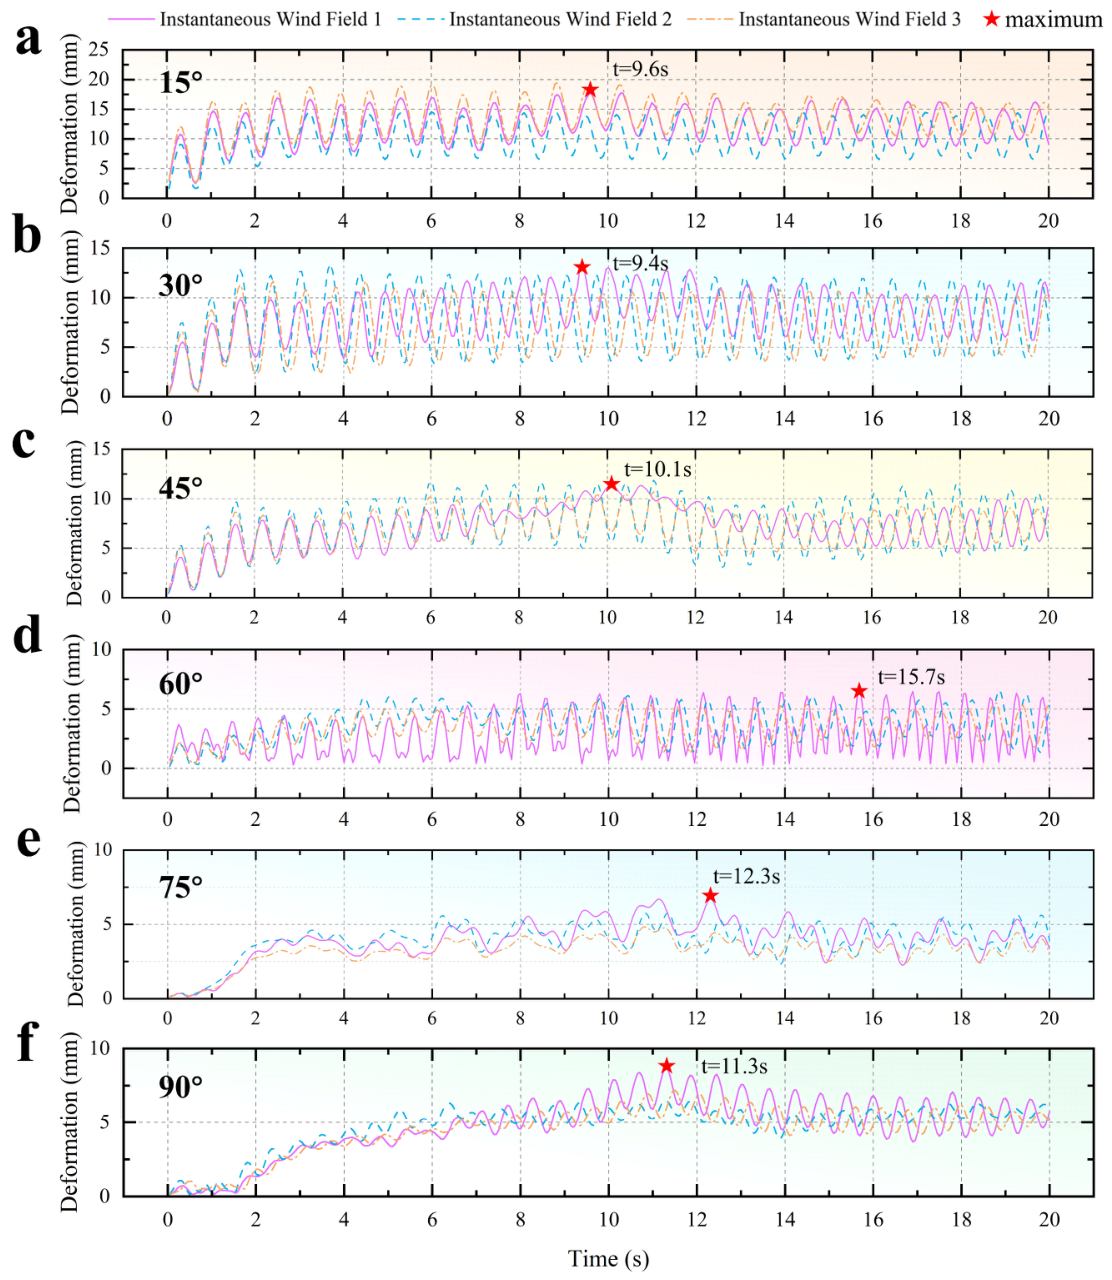
The variation trend of the deformation extreme value of the antenna primary reflector with time under different elevation angles under three groups of instantaneous wind fields is shown in
Figure 8. The results show that the deformation of the antenna primary reflector presents an obvious vibration trend under instantaneous wind speeds, and the maximum value of the deformation extreme value mostly occurs at the middle time. The variation trends of the deformation extreme value of the three groups of tests are similar, and the wind-induced vibration periods under the first three elevation angles are close, while the vibration periods and curve shapes under the last three elevation angles are quite different, which is related to the multi-factor coupling effect of wind field characteristics and structural response.
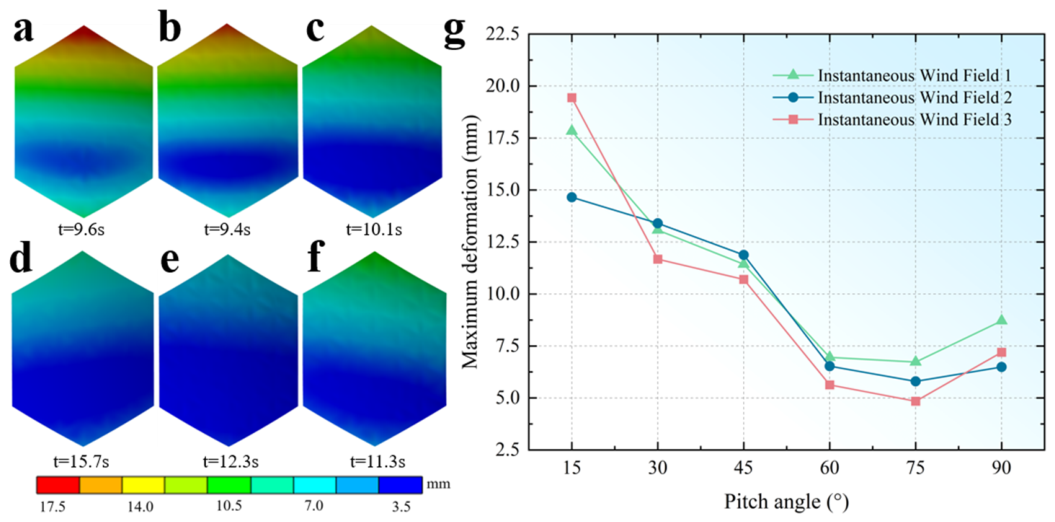
The deformation nephograms of the antenna reflector at the time of maximum deformation extreme value under the first instantaneous wind field are shown in
Figure 9a–f, and the maximum values of the deformation extreme value under different elevation angles are shown in
Figure 9g. The results show that the variation trend of the reflector deformation under instantaneous wind speeds corresponds to the variation trend of the wind pressure coefficient. Under different elevation angles, the deformation extreme value of the primary reflector all occurs at the upper windward area of the reflector, and the deformation presents a gradient distribution. The overall deformation of the antenna reflector is small when the elevation angle is large.
It is worth noting that the extreme deformation of the antenna reflector peaks at an elevation angle of 15°, and decreases with the increase in the elevation angle from 15° to 75°, which is governed by the conventional normal wind load mechanism. In contrast, the deformation at an elevation angle of 90° shows an abnormal rebound compared with that at 75°, which is controlled by a completely different secondary aerodynamic load mechanism. Specifically, the dominant load at an elevation angle of 15° is the normal wind load: the deep dish-shaped reflector forms a significant “air pocket effect” under the concave windward condition, resulting in uniformly distributed positive pressure on the windward surface of the reflector with a peak wind pressure coefficient of 1.1, which drives the overall bending deformation of the reflector through the normal bending moment; this effect continuously weakens as the elevation angle increases and the reflector tends to be flat. At an elevation angle of 90°, the reflector is nearly horizontal, and the normal wind load is greatly reduced compared with the 15° condition; however, the fluctuating characteristics of instantaneous wind significantly increase the proportion of the tangential component of the wind load, which is several times that of the 75° condition. Aerodynamically, the incoming flow is parallel to the reflector axis at this attitude, triggering complete flow separation on the leeward surface of the reflector and forming a large-scale low-pressure wake region with a peak negative pressure coefficient of −2.3, while the windward surface still maintains a uniformly distributed positive pressure with a peak value of 0.57. This distribution forms a strong asymmetric wind pressure field with coexisting positive and negative pressure regions, further generating a significant overturning moment coupled in the normal and tangential directions. As the secondary load mechanism dominating the 90° elevation angle condition, this overturning moment drives the bending-torsion coupled deformation of the reflector, eventually leading to an abnormal rebound of the extreme deformation.
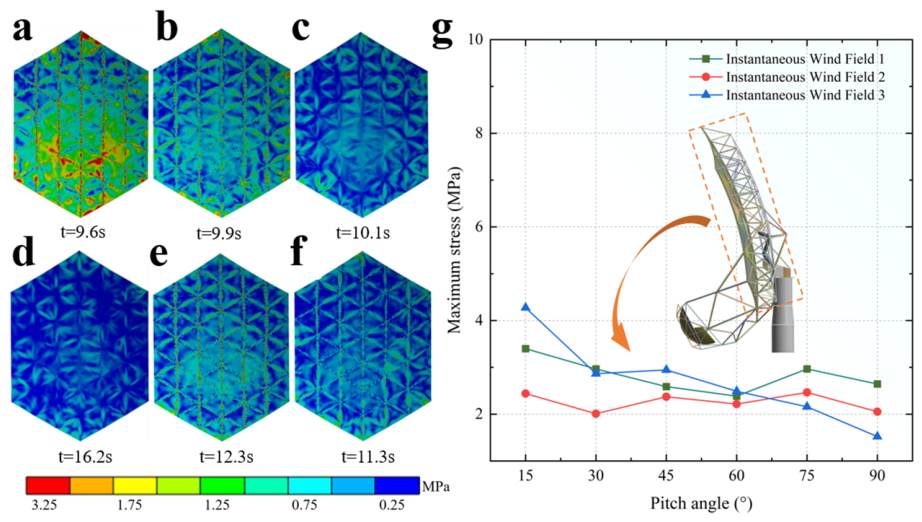
The stress nephograms of the antenna reflector at the time of maximum stress extreme value under the first instantaneous wind field are shown in
Figure 10a–f, and the maximum values of the stress extreme value under different elevation angles are shown in
Figure 10g. The results show that the stress on the antenna reflector surface mainly exists at the connection part between the rib plate and the panel, the stress value at the center of each panel is small, and the stress distribution on the reflector is relatively uniform. The maximum stress value under all working conditions is less than 4.2 MPa, which is far lower than the allowable stress of structural steel, indicating that the antenna structure has sufficient strength under wind loads. The maximum stress extreme value also reaches the maximum at 15° elevation angle, which is consistent with the deformation law. Unlike the deformation, the stress at the 75° elevation angle is relatively large, and the maximum stress extreme value at 90° is lower than that at 75°, which is because the stress is more sensitive to the local load gradient, while the deformation is dominated by the overall bending moment.
4.3. Evolution Law of Surface Accuracy Under Instantaneous Wind Disturbance
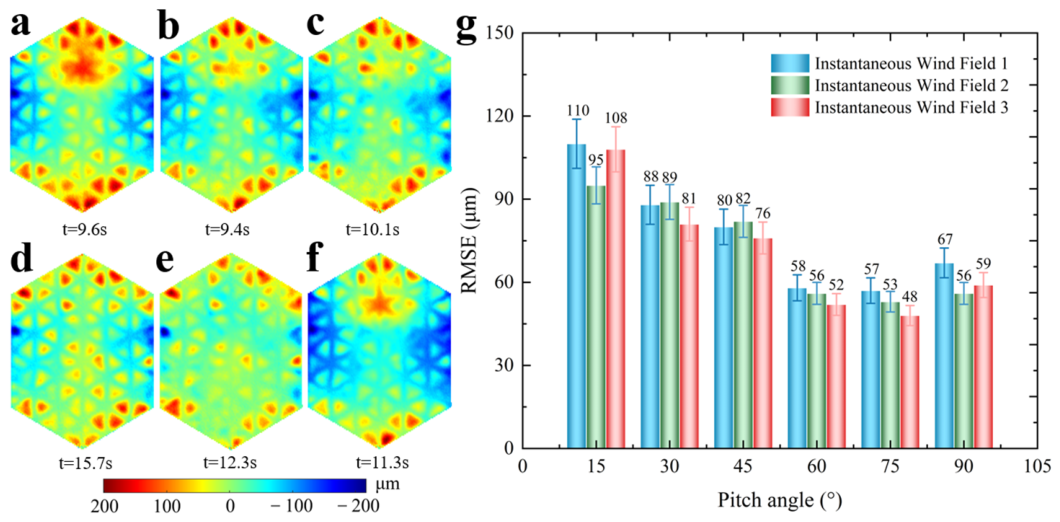
The RMSE distribution of the reflector deformation at the time of maximum accuracy error under the first instantaneous wind field is shown in
Figure 11a–f, and the maximum RMSE values under different elevation angles are shown in
Figure 11g. The results show that the RMSE of the deformation mostly occurs at the center of the panel, and the RMSE value is relatively larger in the areas with large deformation, such as the windward area and the edge of the reflector.
Under different elevation angles, the variation trend of the reflector deformation is consistent with that of RMSE, and the time when the deformation extreme value reaches its maximum is the same as the time when the RMSE reaches its maximum, showing a strong correlation between the two. When the elevation angle is between 15° and 75°, the RMSE decreases with increasing elevation angle. The RMSE reaches the maximum at 15° elevation angle due to the “air pocket effect”, which means the worst surface accuracy; the RMSE drops to the lowest at 75° elevation angle, with the best surface accuracy; the RMSE shows an abnormal increase at 90° elevation angle, which is consistent with the deformation law.
The above results indicate that the 15° and 90° elevation angles of the antenna are the critical working conditions for surface accuracy degradation. For the investigated SKA antenna, the design tolerance of surface root mean square error (RMSE) is specified as 200 μm within its operating frequency band of 0.35 GHz to 15.3 GHz, with a maximum allowable gain loss of 0.5 dB caused by surface deformation. The wind-induced RMSE at 15° and 90° elevation angles accounts for 54% and 33% of the antenna’s design tolerance, respectively, which exerts the most significant impact on the high-frequency electromagnetic performance of the antenna. Accordingly, these two elevation angles should be the core focus of control and adjustment in the actual operation of the antenna: for the 15° elevation angle, the control strategy should focus on suppressing the overall bending deformation of the reflector caused by the large normal wind load, while for the 90° elevation angle, the control priority should be placed on mitigating the torsional deformation induced by the asymmetric wind pressure distribution.
The spatial distribution of surface-accuracy RMSE shown in
Figure 11 provides a quantitative basis for the formulation of control commands for active surface actuators of large reflector antennas. In engineering applications, the reflector panels of the antenna are discretely supported by actuators mounted on the back frame, and the deformation of each panel can be directly regulated by the corresponding actuator. The RMSE distribution in this study clarifies the deviation characteristics of the reflector relative to the best-fit paraboloid, and its peak values are concentrated at the panel centers and the windward edge of the reflector, which are the core regions for wind-induced deformation compensation.
The mapping from RMSE distribution to actuator commands consists of three core steps: (1) Spatial matching: Matching the sampling points for RMSE calculation with the layout nodes of actuators, and extracting the panel deformation at the position corresponding to each actuator; (2) Compensation calculation: Taking the best-fit paraboloid as the reference, inversely calculating the normal displacement compensation of each actuator to eliminate surface errors; (3) Command optimization: A gradient compensation strategy is adopted for the overall bending deformation at 15° elevation angle, and a zoned differential compensation strategy is adopted for the asymmetric torsional deformation at 90° elevation angle. This method can convert the simulation results of this study into wind disturbance feedforward pre-compensation commands for the active surface system and provides a feasible implementation path for systems engineers.
5. Conclusions
This study systematically investigated the wind load characteristics and transient dynamic responses of an 18 m SKA reflector antenna using a coupled CFD-FEM fluid–structure interaction (FSI) framework. By integrating steady-state wind pressure mapping with transient Davenport wind speed spectra, the research clarifies the evolution of structural deformation, stress distribution, and surface accuracy across varying elevation angles. The main conclusions are summarized as follows:
1. The wind pressure coefficient () distribution on the reflector surface remains independent of wind speed, demonstrating significant distribution invariance under local environmental conditions. The aerodynamic load is highly sensitive to the elevation angle; the maximum positive pressure on the front surface reaches 1.1 at 15° elevation angle, while the back surface experiences a peak negative pressure of −2.3 at 90° elevation angle.
2. The maximum deformation of the antenna reflector under instantaneous wind disturbance occurs at the upper windward area of the reflector, and the maximum stress occurs at the connection part between the rib plate and the panel. The deformation extreme value reaches a peak at 15° elevation angle and decreases with increasing elevation angle from 15° to 75°, but shows an abnormal increase at 90° elevation angle due to the overturning moment caused by the asymmetric wind pressure distribution. The maximum stress under all working conditions is less than 4.2 MPa, which meets the strength requirement.
3. The Root Mean Square Error (RMSE) of the surface profile exhibits a strong correlation with extreme deformation values. The 15° and 90° elevation angles are the key working conditions for surface accuracy degradation, which should be the focus of wind disturbance control.
These findings establish a quantitative theoretical foundation for the wind-resistant design, structural optimization, and active surface control strategies necessary for maintaining the performance of large-scale steerable antennas. Future research will focus on the following aspects: (1) Carry out wind tunnel tests to further verify the accuracy of the numerical simulation results, where the geometric similarity and Reynolds number similarity criteria will be adopted as the core scaling laws to ensure the consistency between the test data of the scaled model and the full-scale prototype; (2) Develop a targeted active surface control strategy based on the revealed wind-induced deformation law to compensate for the surface accuracy degradation caused by wind loads; (3) Conduct multi-objective optimization design of the antenna back frame structure to improve the wind resistance performance of the antenna.