


Abstract
This research presents the design, numerical analysis, and experimental validation of a compact radial turbine intended for mini-turbocharger applications in UAV power systems. To meet the stringent requirements of UAV propulsion—such as lightweight construction, high efficiency at small scales, and stable performance across varying operating altitudes—a test rig was constructed to experimentally estimate turbine torque and shaft power across selected operating conditions. Complementary CFD simulations were performed to evaluate aerodynamic behavior, including flow distribution, torque generation, and power output at multiple rotational speeds matched to experimental mass-flow rates. Additional high-speed CFD simulations were conducted to predict turbine performance in operational regimes typical of UAV engines, where experimental testing is challenging. The combined CFD–experimental methodology provides accurate performance prediction for micro-scale radial turbines across different volute geometries and operating conditions. The results contribute essential insights for the development of next-generation miniaturized turbochargers aimed at enhancing UAV engine efficiency, high-altitude capability, and overall flight endurance.
1. Introduction
The operational scope of Unmanned Aerial Vehicles (UAVs) has grown significantly in the last decade, moving from short-range tactical support to crucial strategic roles in Medium-Altitude Long-Endurance (MALE) and High-Altitude Long-Endurance (HALE) missions. Continual surveillance, atmospheric research, telecommunications relay, and disaster management are among the tasks now assigned to modern UAVs. These missions m) and flight durations measured in days rather than hours [1,2]. However, the propulsion demands for these conditions provide a serious engineering challenge: the vehicle needs to be small and light in order to efficiently carry the payload, but it also needs a power system that can provide continuous power in low-temperature, oxygen-starved stratospheric environments [3].
Air density significantly decreases around 37% of sea level at 30,000 feet, and at 60,000 feet, it is less than 10% [4]. In air-breathing propulsion systems, such a decrease in density causes a significant “power decay.” For every 1000 feet of altitude gain, a naturally aspirated internal combustion engine (ICE) loses about 3% of its power, making it difficult to deliver continuous power and maintain flight at MALE/HALE ceilings [5,6,7].
While electric propulsion has matured rapidly for small UAVs, current lithium–polymer batteries have energy densities of only 150–250 Wh/kg and remain inadequate for long-duration flight, especially when compared to hydrocarbon fuels, which offer approximately 12,000 Wh/kg [8,9]. As a result, the internal combustion engine continues to be the preferred powerplant for long-endurance UAVs due to its superior fuel efficiency and thermal performance over miniature gas turbines [5,10].
Integration of turbocharging is not only an enhancement but a necessity to overcome the altitude power degradation [6,11]. However, adapting turbocharging systems to “mini” UAV-class engines (4–50 kW) introduces aerodynamic and mechanical challenges absent at automotive scale. As turbomachinery shrinks to sub-50 mm diameters [12], Reynolds numbers drop, and the flow regime enters laminar–turbulent transition. In this regime, thickened boundary layers and viscous dominance increase the system’s sensitivity to separation and secondary flow losses [13,14]. Additionally, physical characteristics like surface roughness and tip clearance do not scale linearly; manufacturing tolerances that are insignificant on a truck turbocharger become major performance killers on a micro-turbine, resulting in high leakage flows that reduce stage efficiency [15,16,17].
Small unmanned aerial vehicles (UAVs) need power systems that are light, compact, and reliable. Among these, radial-inflow turbines (RITs) are particularly attractive due to their geometric compactness, robustness to off-design conditions, and scalability to small diameters. While recent demonstrations of micro gas turbines and turbogenerators showcase the potential of RITs, they also reveal enduring difficulties in achieving high efficiency, effective heat management, and component matching during real-world missions [18,19,20,21].
The complexity of designing efficient RITs increases sharply at miniature scales. Classical design tools help pick specific speed/diameter, set velocity triangles, and estimate losses at a “meanline” level [22,23,24,25]. But small-scale effects such as blade tip clearance, surface roughness, and manufacturing deviations can dominate overall behavior. Empirical and computational studies have shown that interactions between tip-leakage jets, near-shroud scraping flows, and endwall separation zones reduce efficiency and torque output [26,27]. These effects motivate a turbine-first approach that explicitly accounts for tip-gap physics, endwall shaping, and diffusion control, all supported by data over a wide range of speeds and pressure ratios.
This turbine-focused strategy begins with the volute, whose area–radius evolution and tongue geometry strongly influence pressure distribution and swirl. In compact turbomachines, the limited volute volume amplifies unsteadiness and introduces phase lag, especially under pulsating flow conditions typical of engine exhausts. Even in steady tests, volutes can produce asymmetric inlet profiles that impair incidence and cause local choking [28,29]. During early design, reduced-domain CFD, for example, simulating a single rotor passage with boundary conditions that mimic the volute, can screen concepts quickly, provided the approach is validated against experiments and its limits are understood [30].
Following the volute, the stator (nozzle) accelerates the flow, sets the stage reaction, and determines rotor incidence. In miniature turbines, nozzle passages may develop supersonic zones and strong endwall interactions due to low Reynolds number effects. Whether the boundary layer remains laminar, transitions, or becomes turbulent has a direct impact on flow separation and performance. Therefore, CFD frameworks often include the Menter SST model for robust near-wall behavior, the Spalart–Allmaras model for economical screening, and correlation-based transition modeling (e.g., ) when transition strongly influences separation [31,32,33].
The rotor then finalizes the aerodynamic loop. Here, inducer angles and leading-edge thickness must balance incidence robustness with shock control. Exducer back-sweep mitigates exit swirl and diffusion within a compact meridional profile. However, at small diameters, the tip-gap becomes a significant fraction of the blade span, and the resulting leakage jet strongly influences both efficiency and heat transfer. Experimental and computational results show that the resulting losses scale with the local blade speed and depend on the clearance distribution from inducer to exducer [26,27]. Three-dimensional inverse design methods can manage these factors by targeting specific loading and secondary flow behavior within packaging constraints [34].
To keep the turbine at the center of analysis while still comparing across machines and operating points, we use a similarity framework: corrected rotor speed (normalized by inlet pressure and temperature), pressure ratio (total-to-static), and non-dimensional work/flow coefficients. This approach retains classical performance map interpretability while addressing small-scale turbine effects [22,23,24,25]. Our focus is the mini-turbocharger for torque and shaft power rather than just isentropic efficiency, because these directly size the generator coupling and downstream components.
CFD plays a central role in predicting how the volute, stator, and rotor interact. Stage-resolved simulations are necessary to capture the sharp gradients found in compact, highly loaded turbines. We combine widely used closures () with transition modeling when the Reynolds number suggests it will matter [31,32,33]. Notably, previous studies reveal non-quasi-steady rotor behavior under pulsating flow conditions: while rotor capacity may appear steady, work output does not—due to volute volume and stator phase effects [28,29]. For fast iteration, we also use reduced-domain CFD with explicit validation to bound where it applies [30].
Credible CFD requires disciplined verification and validation (V&V). To ensure simulation credibility, mesh convergence was verified through torque stability checks rather than formal Richardson extrapolation. A base mesh of ~500,000 elements was refined using snappyHexMesh, with 5–7 prism layers and target growth ratio [35,36]. Instead of relying on theoretical extrapolation, CFD torque predictions were directly compared with experimental measurements from a BLDC-based regenerator system operating in a passive-equilibrium mode. This method provided strong evidence that the numerical setup accurately captured the dominant aerodynamic forces driving rotor torque, while avoiding excessive uncertainty from parameters that could not be experimentally constrained [37,38].
At this scale, turbine torque measurement poses unique challenges: torque signals are small, and parasitic losses—friction, windage, leakage—can dominate the energy budget. Recent approaches use eddy-current dynamometers or contactless magnetostrictive torque sensing that do not disturb the system, paired with high-response pressure and temperature probes for stage work accounting [39,40,41]. Because boundary-layer thickness is comparable to geometric tolerances, precise control of tip-clearance, surface quality, and alignment becomes essential [26,27].
To extract meaningful performance insights from limited test time, Design of Experiments (DOE) methods provide structured ways to study multi-variable interactions. Rather than single-factor testing, Taguchi orthogonal arrays offer efficient early-stage screening (e.g., ) using signal-to-noise metrics that prioritize torque/power (larger-the-better) or minimize losses (smaller-the-better) [42,43,44,45,46]. In our approach, Taguchi DOE is used to identify critical geometric parameters—such as volute (Area [A] over Radius [R]), and tongue clearance, nozzle throat angle, rotor tip-gap, and surface finish—before proceeding with exhaustive testing [47,48].
Motivated by the need for advanced mini-turbochargers for UAV propulsion, this paper presents the design, simulation, and experimental validation of a compact RIT. The design method links meanline targets to three-dimensional features that manage incidence, diffusion, and leakage within tight spatial limits [22,23,24,25]. The CFD workflow predicts flow distribution, rotor passage velocities, torque, and shaft power across corrected speeds and pressure-ratio sweeps, and V&V consistent with accepted guidance [31,32,33,35,36,37]. The experimental setup provides direct torque measurements and validation-grade datasets across speeds, while isolating aerodynamic work from mechanical losses [38,39,41].
In summary, the paper contributes (i) a compact-turbine design methodology for a mini-turbocharger for a high-altitude UAV that embeds scale-aware loss control and explicit tip-gap management [22,23,24]; (ii) a stage-resolved RANS/SST framework that predicts turbine torque and power at high corrected speeds [31,33]; and (iii) a compact, modular test bench and measurement procedure that allows side-by-side comparison of multiple scroll geometries and provides low-speed torque and power data with quantified uncertainty. The remainder of the paper details turbine design and geometry, CFD methods and V&V, the test facility, and comparisons of CFD and experiments across rotational speed sweeps.
2. Materials and Methods
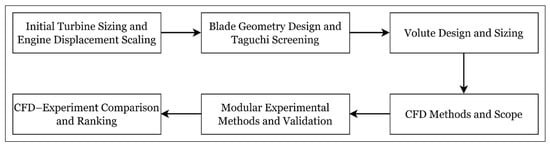
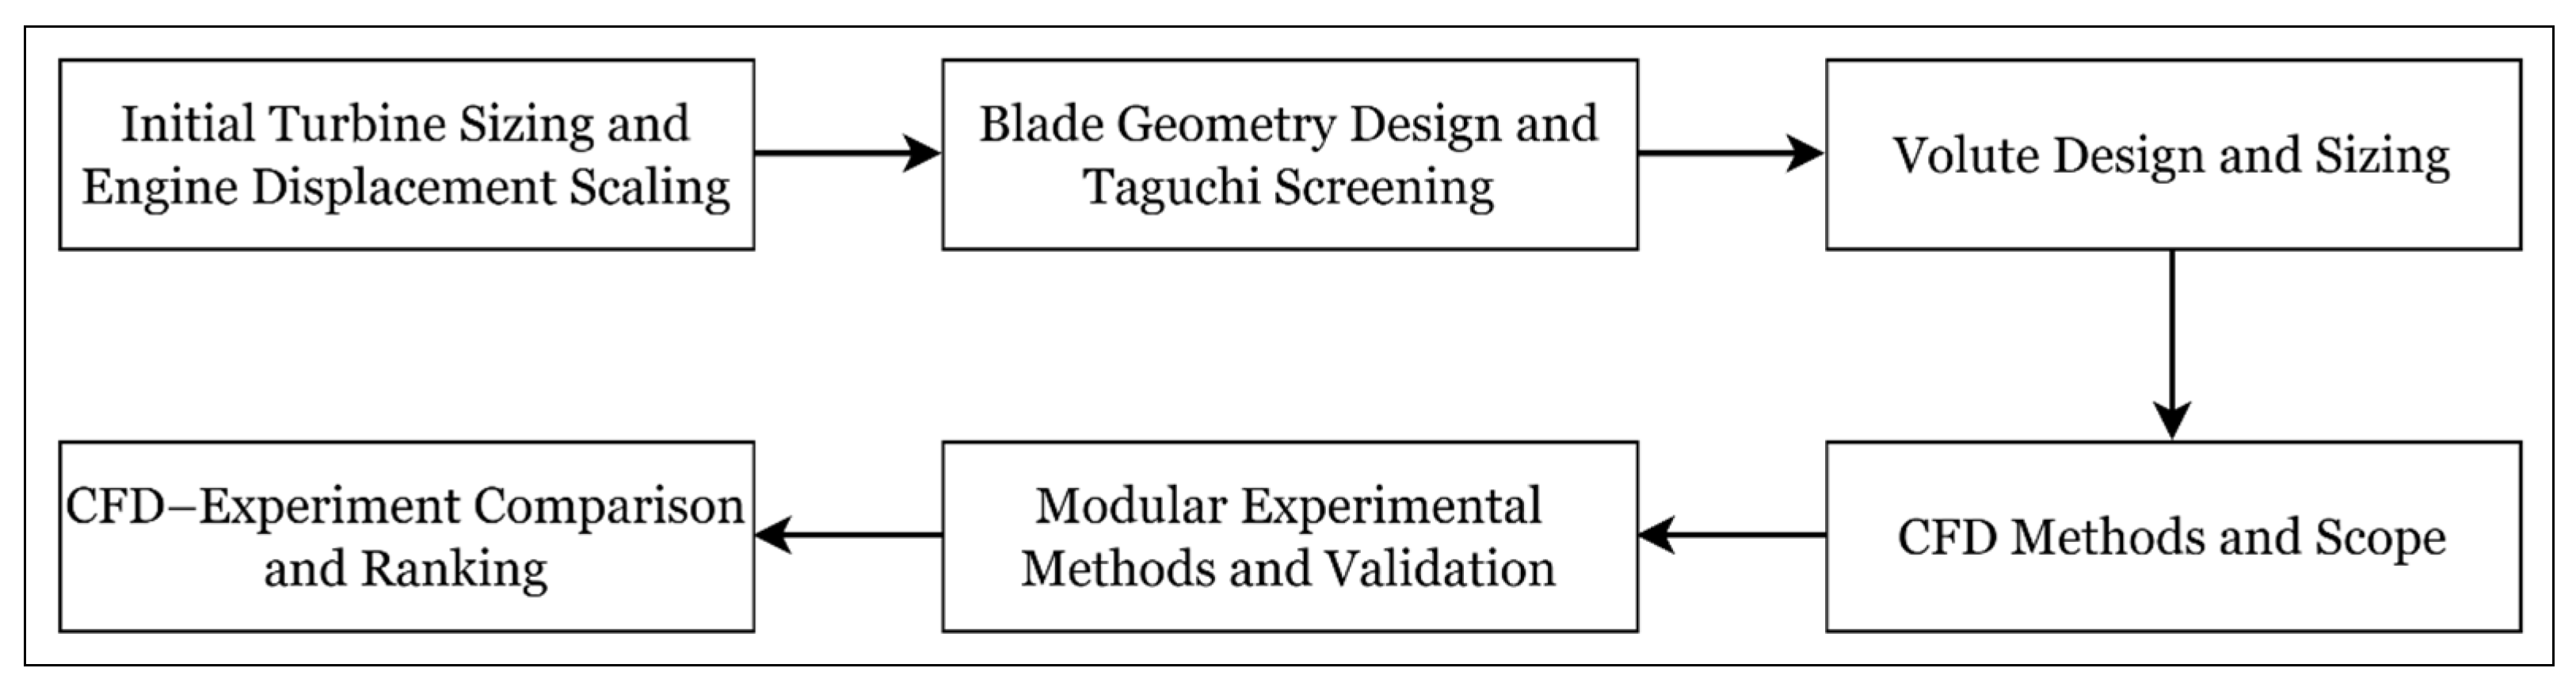
The flowchart in Figure 1 briefly represents the study’s methodology, mapping out the transition from initial design to experimental testing, while the individual steps are described in detail in the subsequent sections.
Figure 1.
Flowchart of the proposed research framework.
2.1. Turbine Sizing
Commercial turbochargers larger than our target scale were surveyed to establish a practical geometric trend between engine displacement volume and a simple turbine rotor volume proxy. Rotor “volume” is used only as a packaging/scale metric in this step; aerodynamic sizing is refined later. Using the published inducer diameters for several units, we approximated each rotor as a right circular cylinder and computed
where is the characteristic rotor diameter, and is the rotor height (axial length of the bladed region). Across the surveyed set, the empirical ratio
clustered between and . We adopted a central, conservative value of to extrapolate down to our target engine displacement volume L (Liters) and 0.1 L (Liters). This provides a physically reasonable starting size that we will validate and refine with CFD and an experiment in Section 3. The use of simple geometric proxies here is consistent with preliminary sizing practices in radial turbines [22,23,24].
As a first pass, we fixed the rotor aspect ratio at
based on the design examples that motivated our blade study and typical proportions reported for compact turbocharger rotors [23,49]. This assumption is only for initial packaging; will be re-checked after CFD verifies flow capacity and mechanical limits.
Given a target engine displacement volume and chosen ratio , the target rotor “volume “ in Liter (L) is
With the aspect ratio , the cylinder model yields
We then use these as the geometric envelope for the detailed blade and volute design (next subsections).
Using and , the sizes below in Table 1 follow directly from the equations above.
Table 1.
First-pass turbine sizes from displacement–volume scaling (cylinder proxy, , ).
These match the back-of-the-envelope values we derived from the commercial survey and sit near the lower end of the observed band, which is deliberate to avoid under-sizing the flow path at miniature scale. For reference, applying the same formula to a L case yields mm and mm, consistent with the trend seen in larger units.
This sizing step fixes the packaging envelope for each target displacement and provides a starting exducer area for continuity checks. In the next subsections we (i) design the blade within this envelope to hit the target work/flow coefficients at the design pressure ratio (blade subsection) and (ii) size the volute/nozzle to deliver the required capacity and swirl (volute subsection). Quantities like mass flow, pressure ratio, and corrected speed are then verified by stage-level CFD and, ultimately, by gas-stand testing. Any deviations will be reconciled by adjusting , passage heights, or the volute as needed, per standard meanline practice [22,23].
2.2. Turbine Blade Design (Type-B-Inspired; Chord-Agnostic)
The rotor blade geometry was developed within the integrated stage design (sizing targets for (stage loading coefficient), (flow coefficient), and (rotor peripheral speed)). For the blade itself, we took inspiration from a bent, swept-back pressure-side edit that (i) keeps the chord fixed, (ii) uses a short straight segment at the front (“inner”) portion of the pressure side, and (iii) applies a swept-back arc over the second half of the chord to increase the inlet metal angle [49]. The source paper distinguishes a milder edit (Type B) from a more aggressive one (Type A) by the backward displacement at the start of the front straight: Type B uses mm while Type A uses mm; both retain the front segment and the second-half arc [49]. We adopt these cues for our compact radial–inflow turbine section and tune parameters to meet our stage-level targets. The related literature supports the usefulness of sweep/bend for controlling turbine stresses and aero performance [50,51,52,53].
2.2.1. Chord-Agnostic Pressure-Side Construction (Math)
Let denote our actual blade chord (not necessarily 60 mm). We reference the paper’s 60 mm only to define non-dimensional ratios that scale cleanly to .
Scaled backward displacement (Type-A/B ratios):
Defining the dimensionless displacement ratios from the source as
For our chord , the corresponding backward displacements are
Local Coordinates with front straight:
Work in 2D section coordinates with the chord along ; the trailing edge is . Place the start of the front straight at , and use the inclination specified by the source for the inner/front straight:
To ensure the arc resides in the “second-half of the chord”, define a non-dimensional arc-start location and the front-segment length . The straight-to-arc junction point is
Swept-back arc over the second half (tangent continuity):
Following the paper’s cue that the swept portion is “designed with an arc to add an inlet angle” [49], connect to with a circular arc tangent to at . The circle center lies on the normal line through :
Enforcing that the circle of radius passes through yields
A useful diagnostic is the resultant bend angle,
which we target within a physically plausible sweep/bend band (roughly – as reported in related studies; when a specific target is desired, we adjust slightly to achieve ) [51,52].
Suction side and thickness:
Consistent with [49], we retain the baseline (Type-O) suction-side profile and replace only the pressure side by the front straight plus arc. If the exact Type-O suction profile is not shareable, a neutral surrogate (single smooth thickness peak with centered near ) is used for CFD and later swapped with the true curve.
2.2.2. Spanwise Stacking (Optional for 3D Rotor)
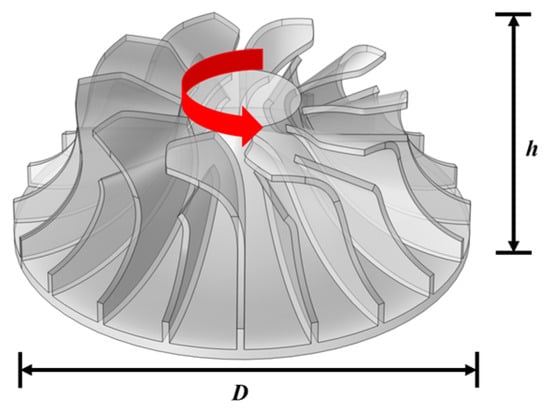
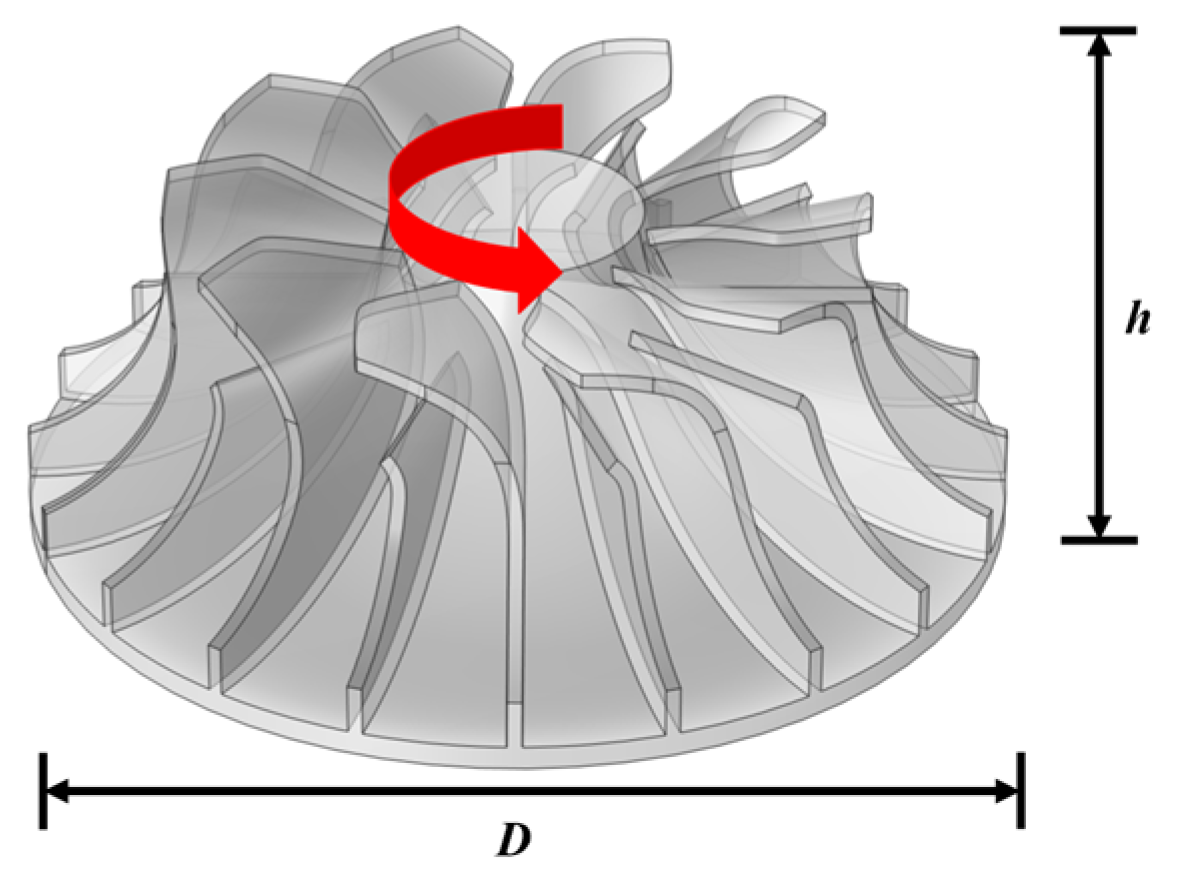
For a compact rotor, we apply the same 2D construction at hub/mid/tip, linearly interpolating and across span, as shown in Figure 2. A mild leading-edge sweep () may be added if structural screening indicates a benefit; the source’s FSI rationale—that moderate bend/sweep reduced deformation while preserving performance—motivates starting near the Type-B ratio () [49].
Figure 2.
Spanwise stacking context for the compact rotor and height-to-diameter reference used for packaging and sealing.
2.2.3. Decision Gates and Iteration
We apply three gates: (A) geometry plausibility—require in a band (adjust or otherwise); (B) aerodynamic feasibility—design map points meet torque/power targets with acceptable losses; (C) optional structural check—one-way stress screening (or literature evidence) confirms that the moderate bend ratio is safer than aggressive [49,50].
2.2.4. Design-Phase Local Sensitivity Screening
To quantify local sensitivity around the Type-B-inspired edit using few runs, during the design phase, we used a three-factor, three-level Taguchi screening to probe local sensitivity around the Type-B-inspired edit. The DOE was used internally to select a baseline combination of , and and is shown in Table 2. We do not report full S/N tables here for brevity, as the focus is on the CFD and experimental validation of the final selected geometry and IP constraints. We use dimensionless levels, so the plan is chord-agnostic.
Table 2.
Taguchi plan (dimensionless, chord-agnostic) centered on the Type-B-inspired edit.
- A: scaled backward displacement , (Type-O/B/A-like) [49];
- B: arc start location (keeps the arc in the “second half”) [49];
- C: either a small leading-edge protrusion amplitude to strengthen the front bend, or a targeted bend (solve to hit each target) [49,52].
We evaluate each run at a fixed corrected speed and pressure ratio. Responses: shaft torque and power (S/N “larger-the-better”), and a loss metric (e.g., stage total-pressure loss or, if modeled, tip-leakage flow; S/N “smaller-the-better”) with standard formulas [43,44,47]:
The screening indicated that the Type-B-like displacement () with mid-chord arc start () and moderate leading-edge protrusion () offered the best torque–loss trade-off. We therefore fix these values for the baseline rotor used in all CFD and experimental validation below.
2.3. Volute Design and Sizing (Case A; Round–Asymmetric Selection)
2.3.1. Design Basis and Interfaces
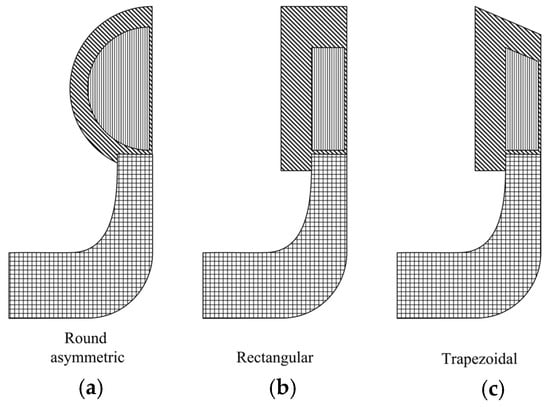
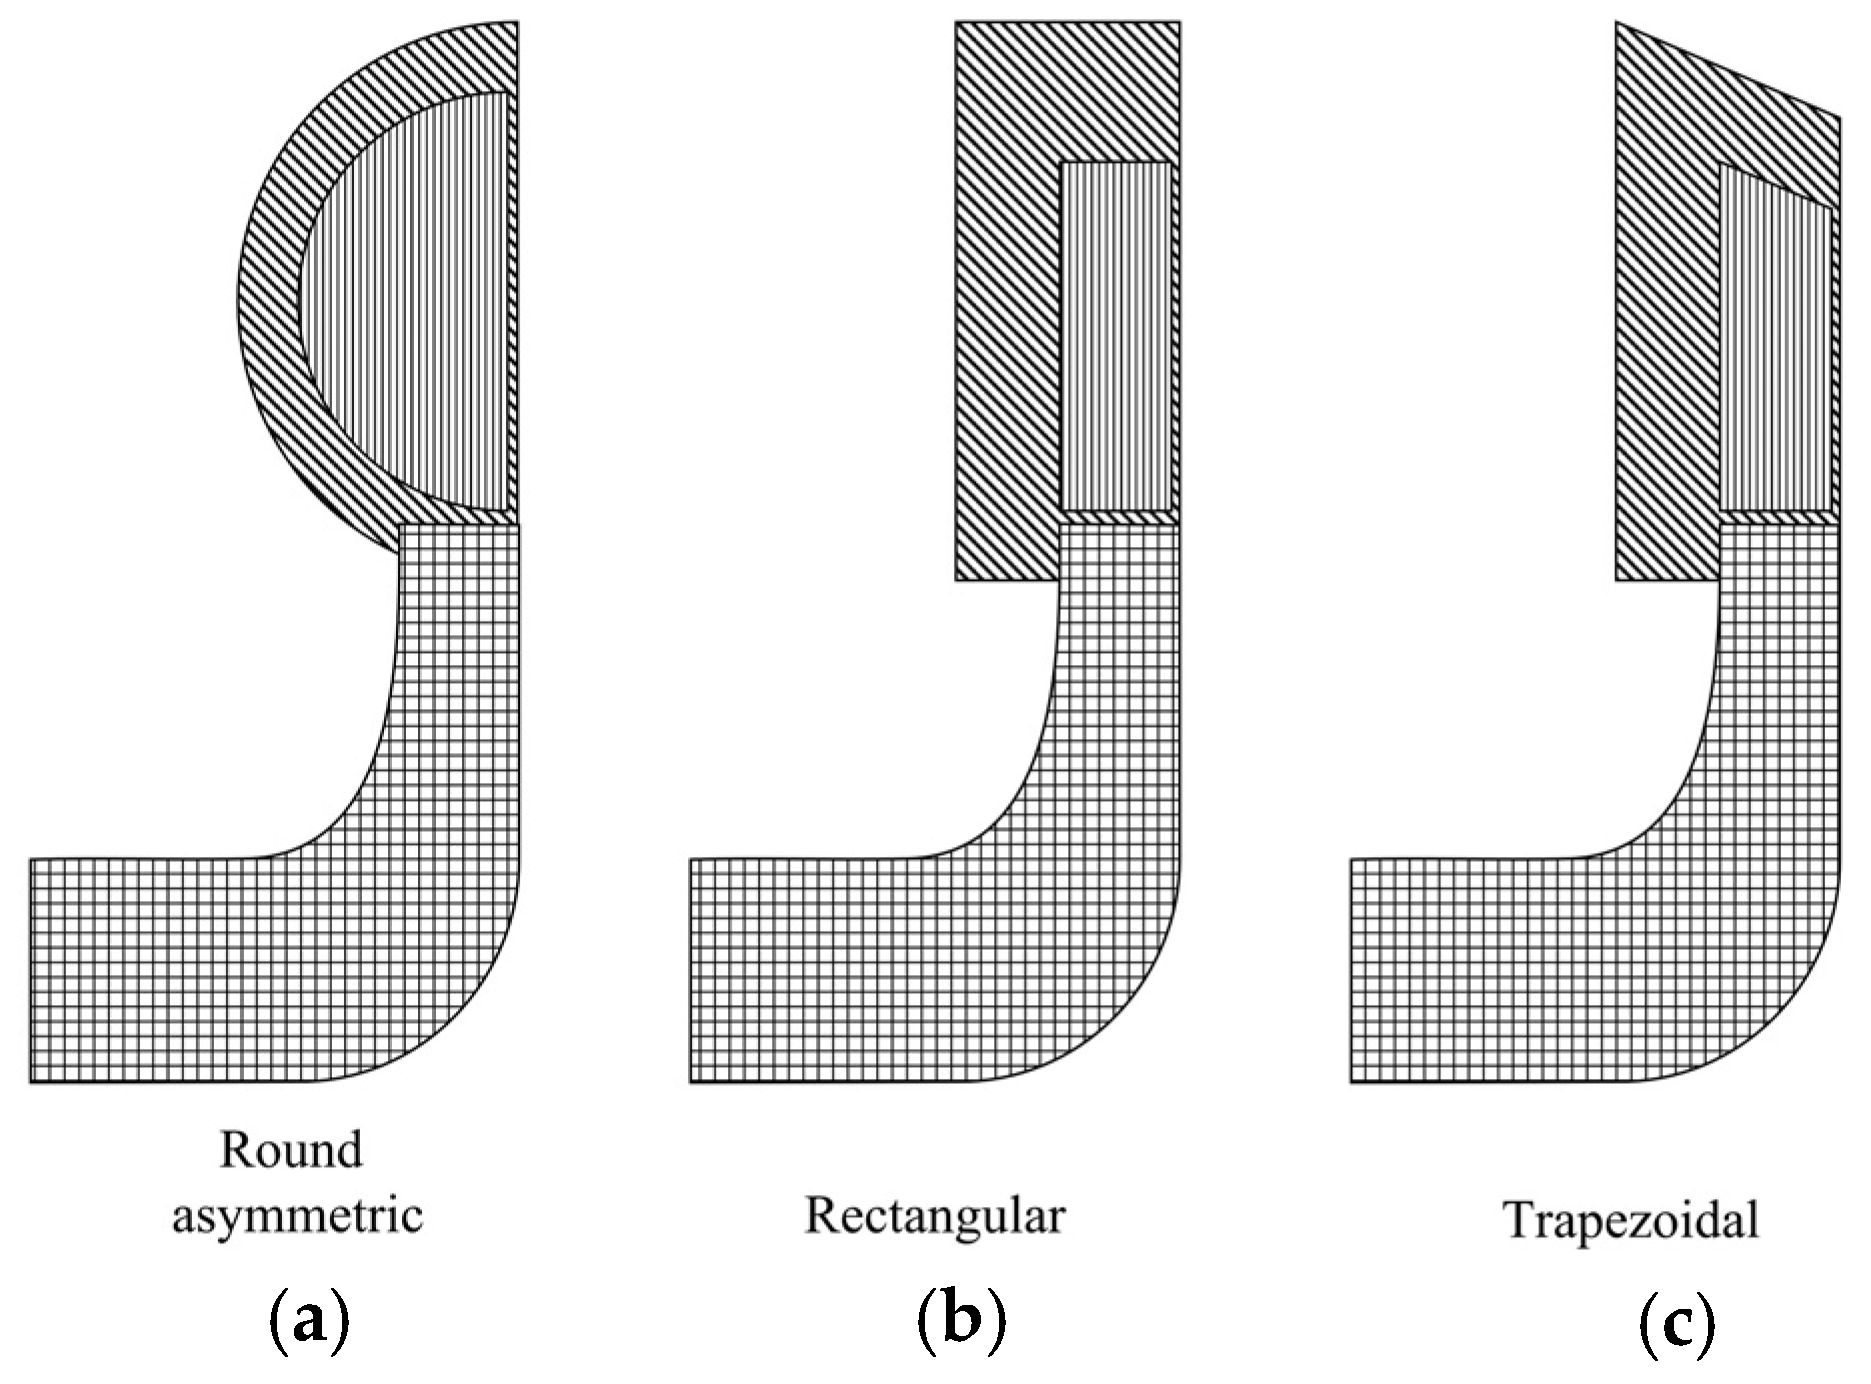
The volute was sized to deliver the design mass flow () and target inlet conditions to the stator plane while fitting packaging limits around the rotor–stator module. Inputs from turbine sizing fix the total inlet state to the scroll , the design speed, and the annulus height at the stator inlet; the blade design section specifies the desired inlet swirl angle band to avoid excessive rotor incidence. We evaluated several common volute cross-sections—round–asymmetric, rectangular, and trapezoidal—as shown in Figure 3, then finalized the round–asymmetric option for the prototype due to its balance of manufacturability and flow uniformity at our scale [54].
Figure 3.
Volutes of (a) Round–asymmetric, (b) Rectangular, and (c) Trapezoidal geometrical cross-sections.
2.3.2. Area Progression A(θ) (Velocity/Mach-Based Sizing)
Let measure the wrap angle from the tongue, with . Assuming approximately uniform discharge into the annulus along the wrap, the mass still in the scroll is
We size the cross-section for a target bulk velocity (or bulk Mach) in the scroll. Using a constant-bulk-velocity rule (equivalently, a constant-Mach rule if density is updated), the required area progression is
where ( follow from and the chosen (typically 0.2–0.3 to keep losses low). For implementation, we used the classic velocity-based Stepanoff law with cutwater compensation, as provided in CFTurbo; the same progression can be imported or generated from first principles for reproducibility [54].
2.3.3. Spiral Centerline R(θ) and Packaging
The scroll centerline is fit with a simple spiral, chosen to meet the outer-radius envelope while accommodating the area law above. An Archimedean form or logarithmic both work; we tuned (or ) to keep nearly flat through mid-wrap (helps circumferential uniformity) and to avoid self-intersection at the tongue. Tongue angle and fillet radius were kept above meshing limits, with a small extra gap added near the tongue to reduce local blockage at the final few degrees of wrap.
The rotor blade tip clearance was modeled explicitly in the CFD domain, using a radial gap of approximately 0.5 mm. The tip-gap was resolved using local mesh refinement and was consistent with the measured manufacturing tolerance in the physical prototype.
2.3.4. Cross-Section Geometry and Aspect Ratio
For each a section shape and aspect ratio set the dimensions from .
In all cases from Table 3, smoothness constraints ( and dimensions) were enforced to avoid abrupt diffusion jumps.
Table 3.
Formulas used to derive section dimensions from the target area progression . Here, is the section aspect ratio, and is a small flare fraction ().
2.3.5. Diffuser Considerations
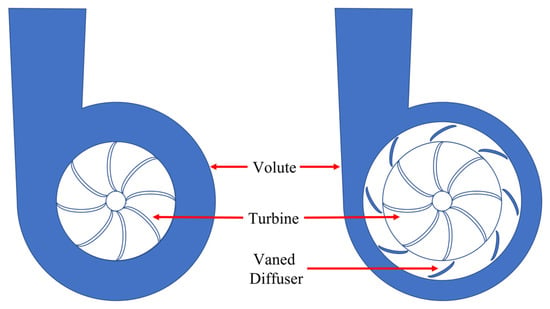
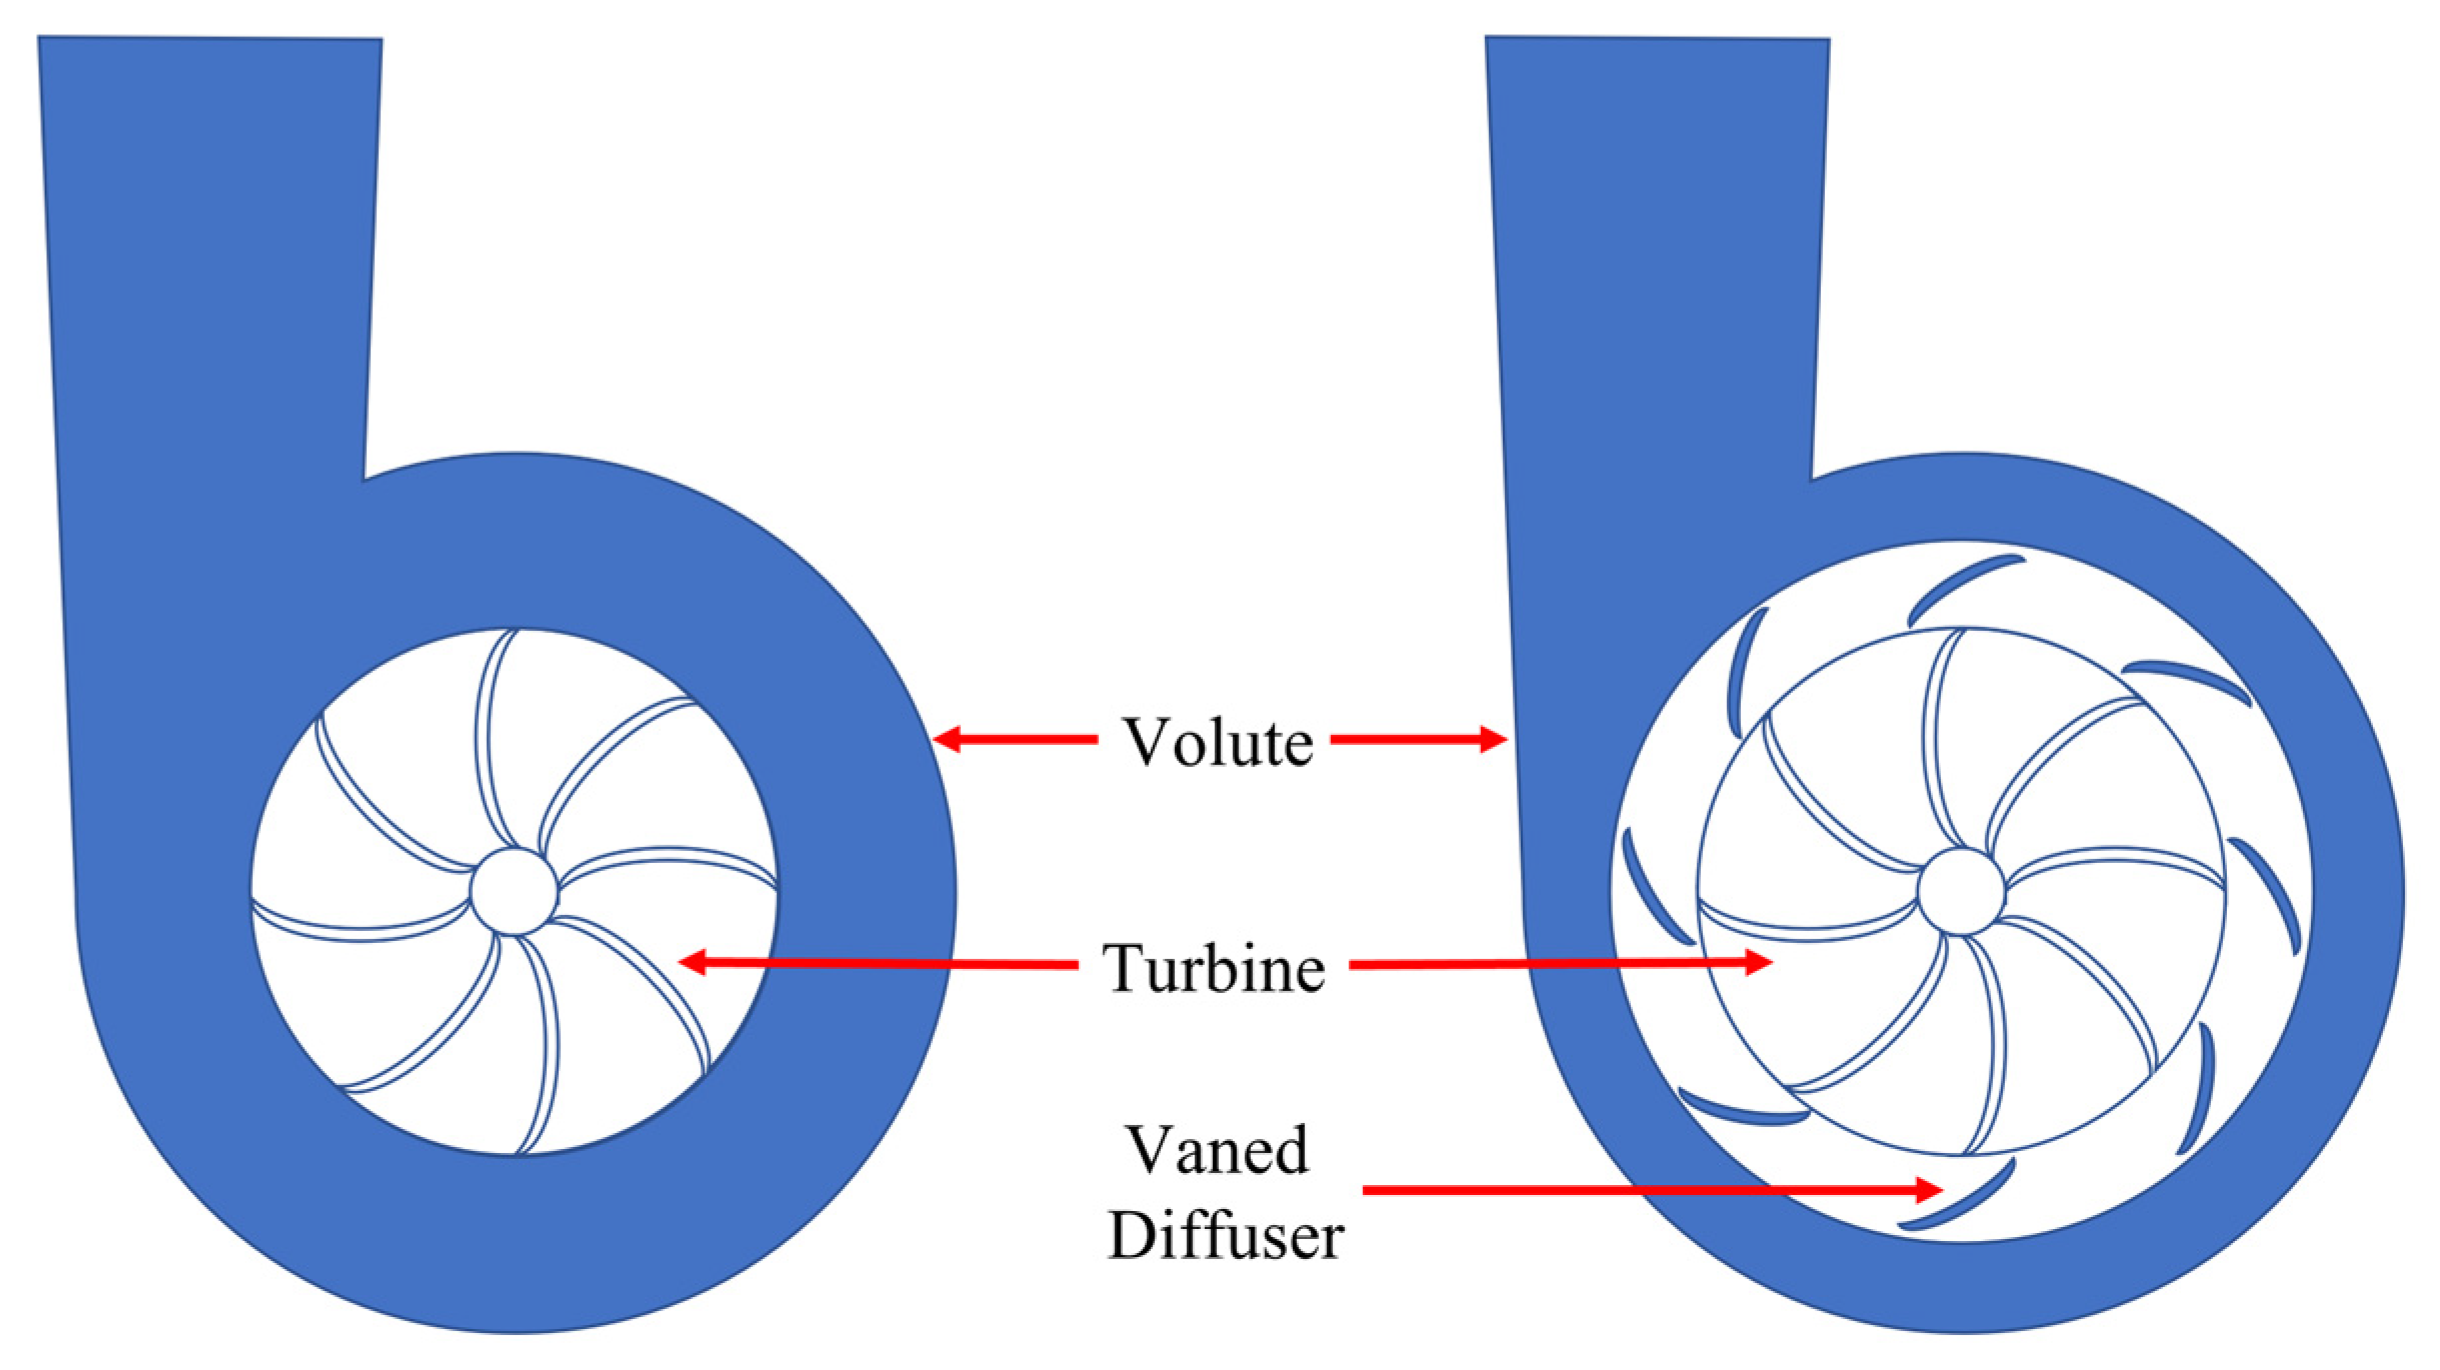
A downstream diffuser can recover rotor-exit kinetic energy, but its pressure recovery drops as the inlet swirl angle increases. Measurements and modeling show diffuser performance is sensitive to the flow angle at entry; high swirl raises wall friction effects and limits the recovery (and recovering the tangential component also costs radius). Given our miniaturized scale and the manufacturing goal for a first-article prototype, we did not include a discrete vaned diffuser downstream of the volute. Instead, we rely on the scroll’s gentle area growth and a short, straight outlet to avoid adding a second diffusing system whose benefit would be marginal at our target swirl band and resources, as shown in Figure 4. This choice will be explicitly revisited in the validation section by comparing total-pressure loss and circumferential non-uniformity at the stator inlet with and without a simple pipe extension.
Figure 4.
Volute with no diffuser and volute with vaned diffuser.
An integrated wastegate (volute bypass) was considered for transient control and flow range extension, but we excluded it from the prototype for (i) reduced machining complexity, (ii) tighter build envelope, and (iii) to isolate scroll and rotor/stator effects in CFD and rig tests. The omission is documented here so that readers understand the hardware constraint; future iterations can add an external bypass once the baseline aero–mechanical performance is validated.
2.4. CFD Methods
2.4.1. Purpose and Scope
All numerical simulations in this study were performed using the open-source CFD software OpenFOAM v2412 with a steady-state Reynolds-Averaged Navier–Stokes (RANS) framework. A pressure-based solver was employed to model subsonic flow conditions. The simulations were conducted to rank turbine–volute configurations based on aerodynamic performance at moderate-to-high rotational speeds (50,000–100,000 rpm) and low mass flow rates (0.004–0.009 kg/s), representative of miniature UAV turbocharger operation.
Only the continuity and momentum equations were solved, while the energy equation was intentionally omitted. An isothermal flow assumption was adopted, with the reference temperature K for the high-speed CFD cases (50,000–100,000 rpm) to represent elevated turbine inlet conditions, and K for low-speed simulations (2000–15,000 rpm) to ensure direct consistency with the experimental test conditions. All solid boundaries were treated as adiabatic.
This modeling approach was selected to align with the scope of the present study, which focuses on mechanical torque and power trend validation rather than full aerothermal efficiency prediction. The experimental test bench was designed to measure shaft torque and power using a BLDC generator and was not equipped to resolve small temperature variations across the turbine. Introducing the energy equation would therefore require additional thermal boundary assumptions that could not be experimentally verified, potentially introducing unnecessary uncertainty into the numerical–experimental comparison.
Under the given operating conditions, turbine torque is primarily governed by pressure-driven momentum transfer across the rotor blades, while density variations associated with thermal effects were considered secondary for the purpose of preliminary design screening and relative performance ranking. Consequently, the numerical results reported in this study focus on torque and power trends rather than thermal efficiency. Inclusion of full energy coupling and high-temperature exhaust modeling is identified as an important direction for future work.
2.4.2. Modeling Assumptions and Solver Setup
- Gas model: isothermal ideal gas, , viscosity evaluated at and held constant;
- Turbulence: for robust near-wall behavior at these Reynolds numbers;
- Rotor treatment: Multiple Reference Frame (MRF) for the rotor; mixing-plane at stator/rotor interface in stage runs.
2.4.3. Domain, Boundary Conditions, and Operating Points
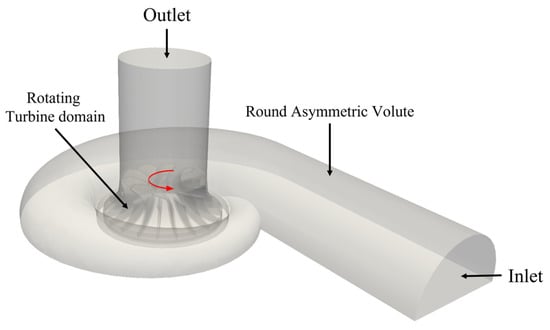
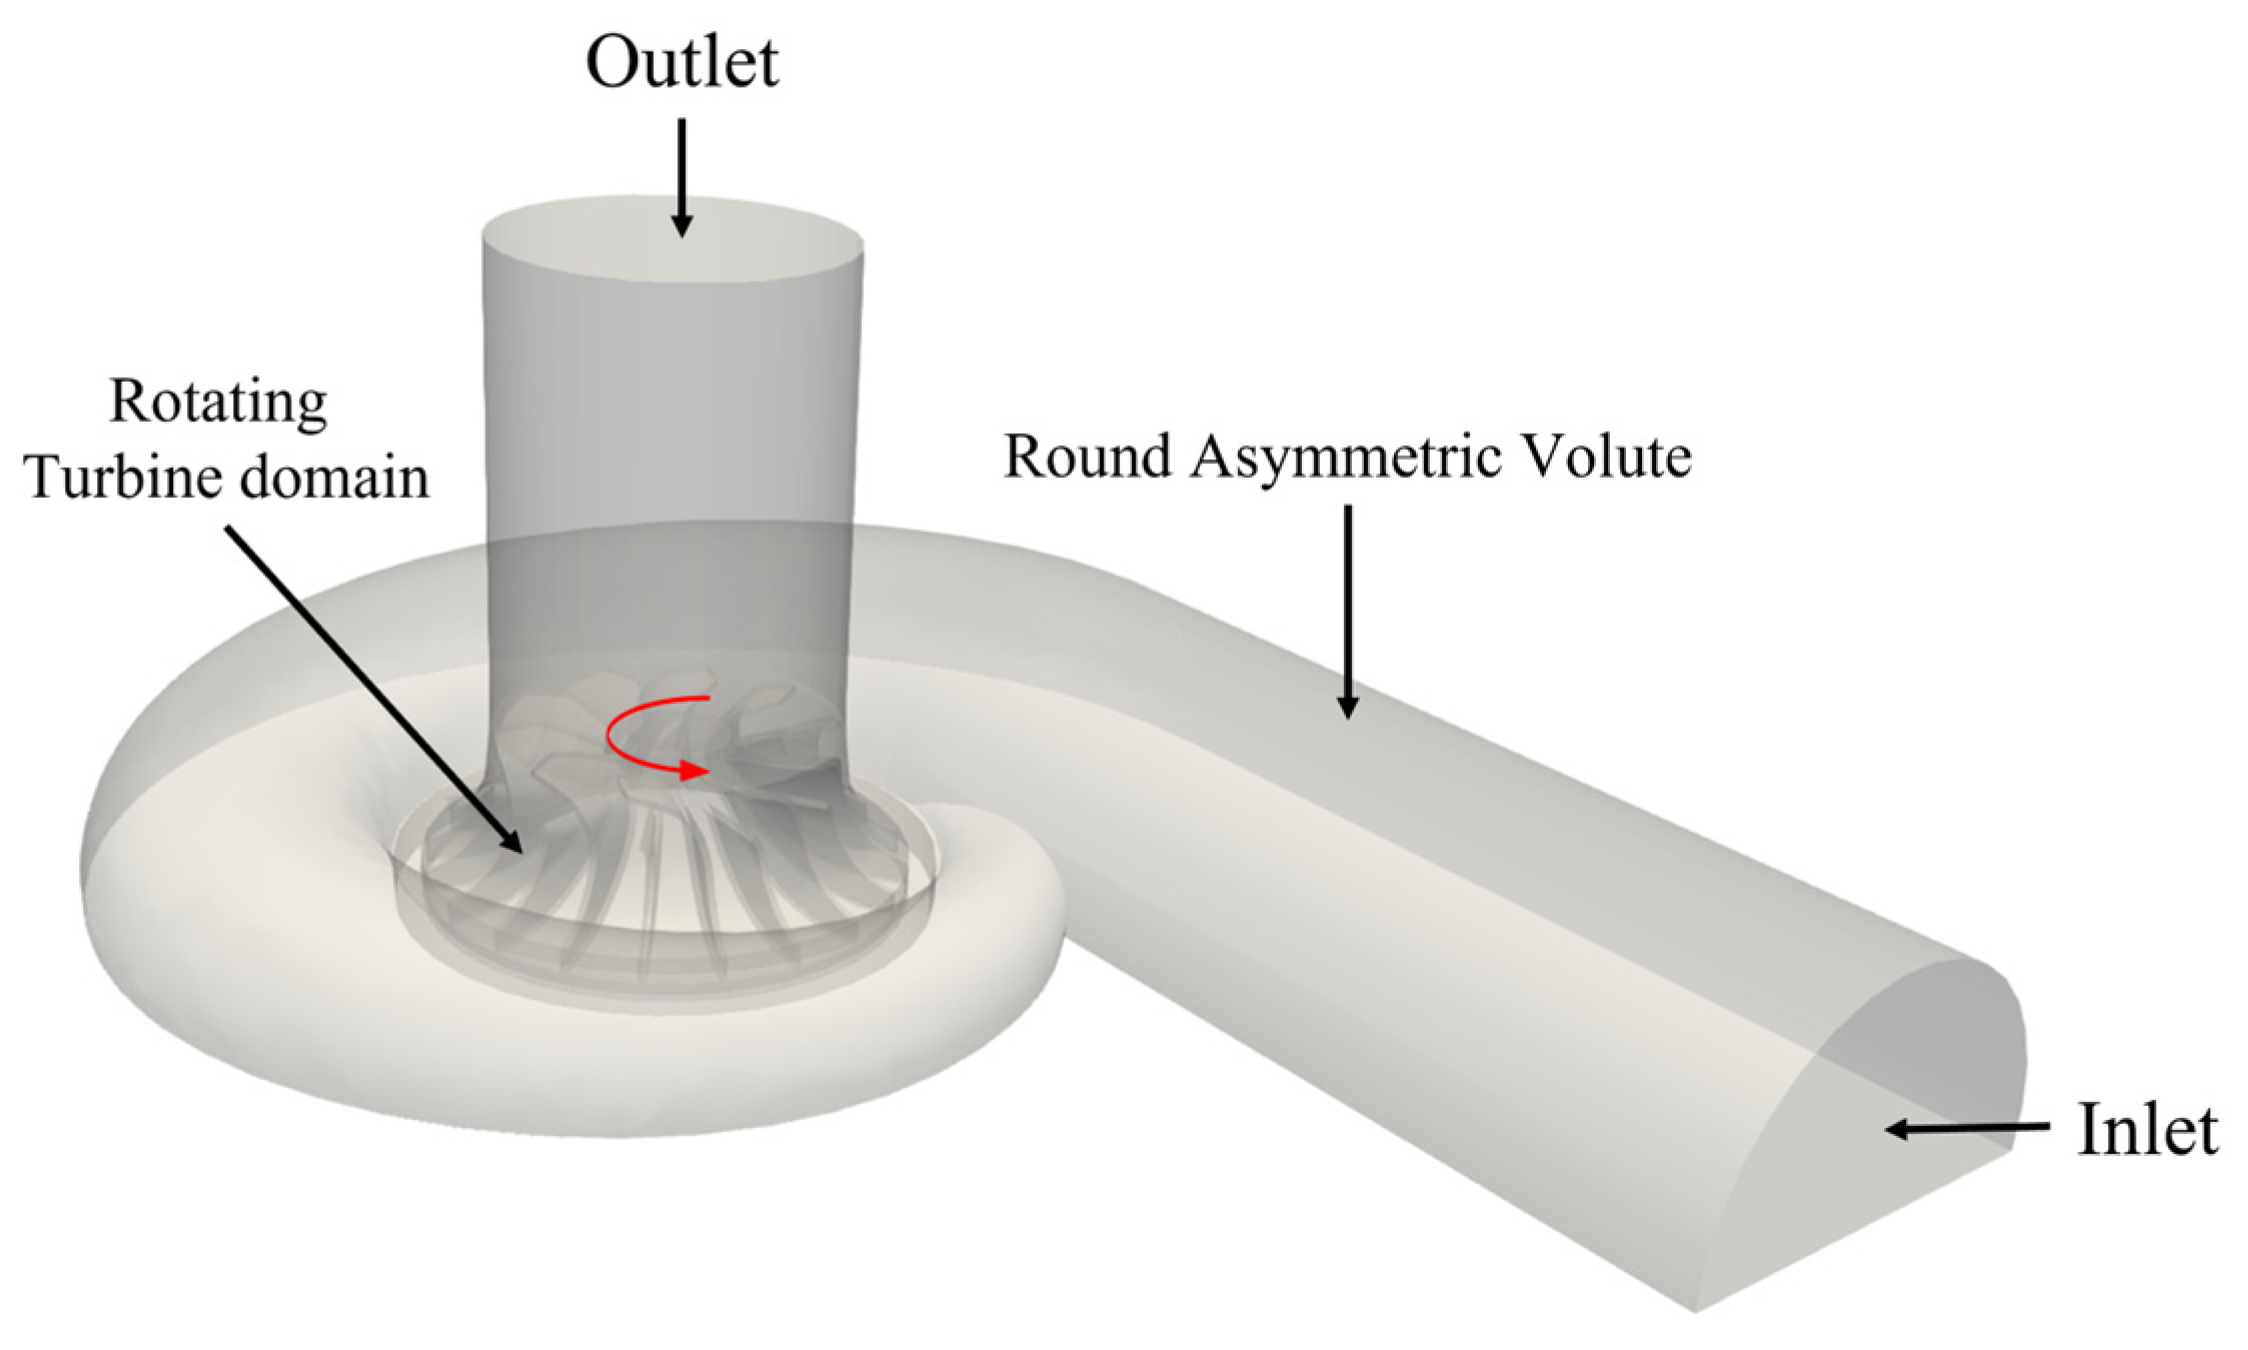
Although the target application is high-altitude UAV operation, experimental and CFD boundary conditions as shown in Figure 5 were based on atmospheric outlet pressure (1 bar) to enable controlled, safe torque validation. The aerodynamic performance and torque generation were governed by the expansion ratio, which reflects operational conditions even under sea-level backpressure.
Figure 5.
Turbine boundary conditions patch locations.
- Inlet (volute mouth): prescribed mass-flow kg/s;
- Outlet (downstream of rotor): fixed statics pressure atm;
- Walls: no-slip, adiabatic (consistent with isothermal modeling); rotor speed set to the target rpm for torque extraction.
2.4.4. Meshing and Numerics
The computational mesh was generated using blockMesh+snappyHexMesh, resulting in approximately 500,000 mesh elements, which provides a high spatial resolution for the present micro-scale turbine geometry (20 mm diameter). Local mesh refinement was applied in regions of strong pressure gradients, including the rotor blades, blade tip clearance, and volute tongue. To ensure adequate near-wall resolution, 5–7 prism layers were applied on all solid boundaries with a growth rate not exceeding 1.2, targeting y+ ≤ 1 in accordance with the requirements of the k–ω turbulence model.
Second-order spatial discretization schemes were employed for all transport equations, together with a SIMPLE-family pressure–velocity coupling. Convergence was assessed using a combination of residual-based and physics-based criteria. In addition, residuals were set to for all the simulations; solution convergence was confirmed by enforcing a global mass imbalance and ensuring that the rotor torque variation remained within over the final 500 iterations. While the maximum number of iterations was set to 500 to ensure a safety margin, the simulations consistently reached a numerical plateau between 250 and 350 iterations.
2.4.5. Torque and Power Evaluation
Rotor torque is computed as the surface moment of pressure and viscous stresses about the shaft axis,
and shaft power with . (Implementation note: this is a standard surface integral; in packages that expose stress components directly, the same result is obtained with a surface integration operator over blade/hub/shroud using the local moment arm, e.g., expressions of the form about .) Total pressure for reporting is built from the solver fields as .
2.4.6. Flow-Quality and Separation Checks
To ensure attached, streamlined flow through the scroll and nozzle, we monitor (i) flow streamlines, pressure contours to visualize complex flow patterns; (ii) identify crucial regions like boundary layers and separation; (iii) identify regions of negative skin friction () and near-wall recirculation; and (iv) identify circumferential statistics at the stator inlet: and the standard deviation of swirl angle .
2.4.7. Illustrative Results Used to Size the Test Matrix
The round–asymmetric volute case was used during screening; the simulated torque and power span are presented in Table 4.
Table 4.
Representative CFD torque range for the round–asymmetric volute used to define DOE operating points.
With rad/s, the corresponding powers are W. These values guided the operating points chosen for the DOE comparing volute geometries; the same post-processing is applied to the final round–asymmetric scroll geometry selected for hardware.
We rank candidate volutes by (i) higher torque/power within 0.004–0.016 kg/s, (ii) lower scroll loss to the stator plane, and (iii) better inlet uniformity (lower and ) with no or minimal separation. The top configuration (round–asymmetric, with chosen tongue clearance and aspect ratio) is carried forward to fabrication and experiment; also, the other volute configurations were analyzed and proceeded for the experimental part for V&V.
2.5. Experimental Methods (Modular Scroll Testing with BLDC Generator)
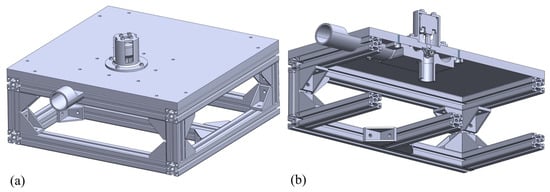
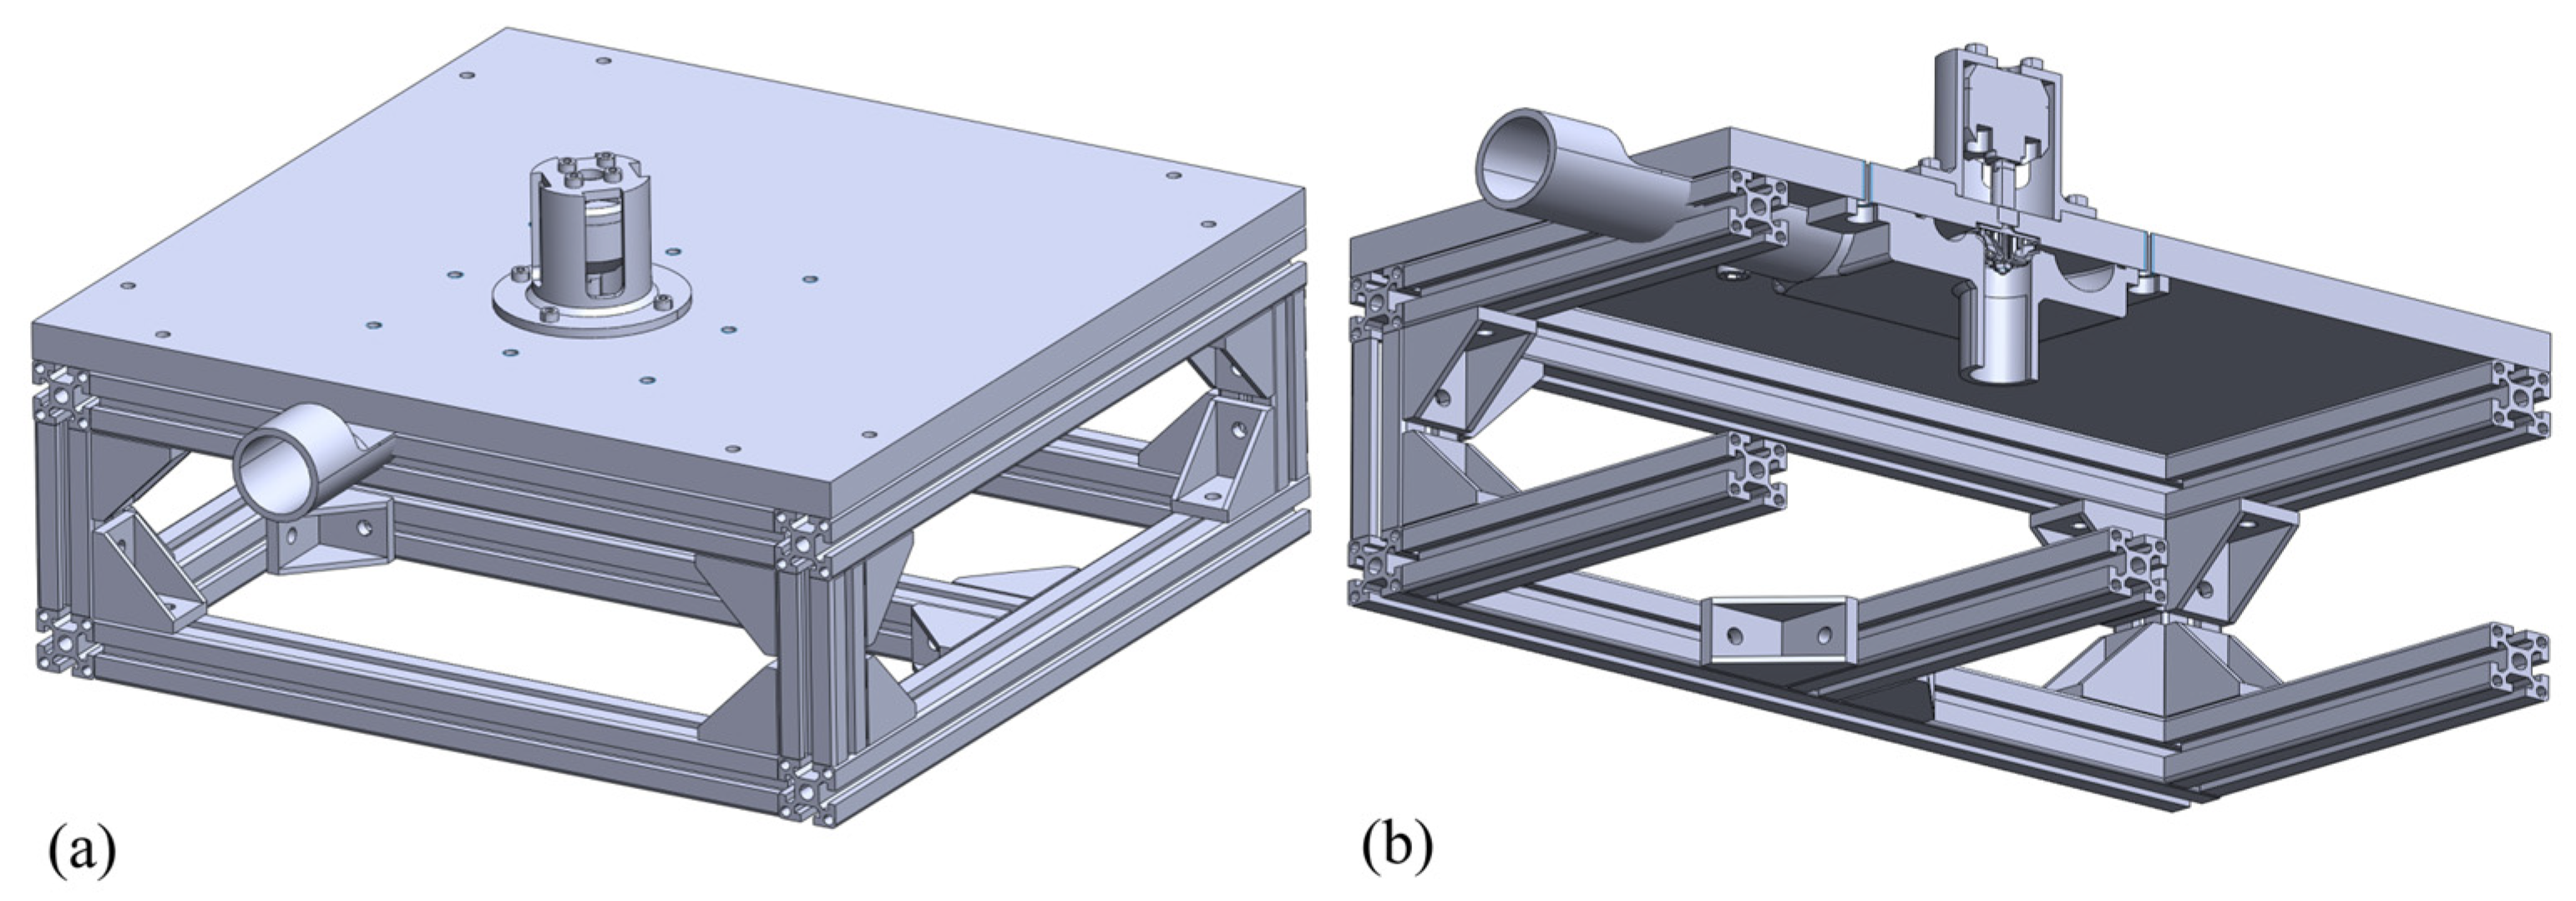
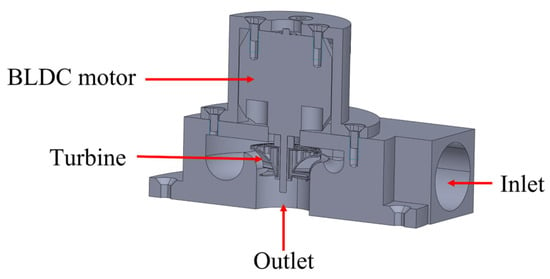
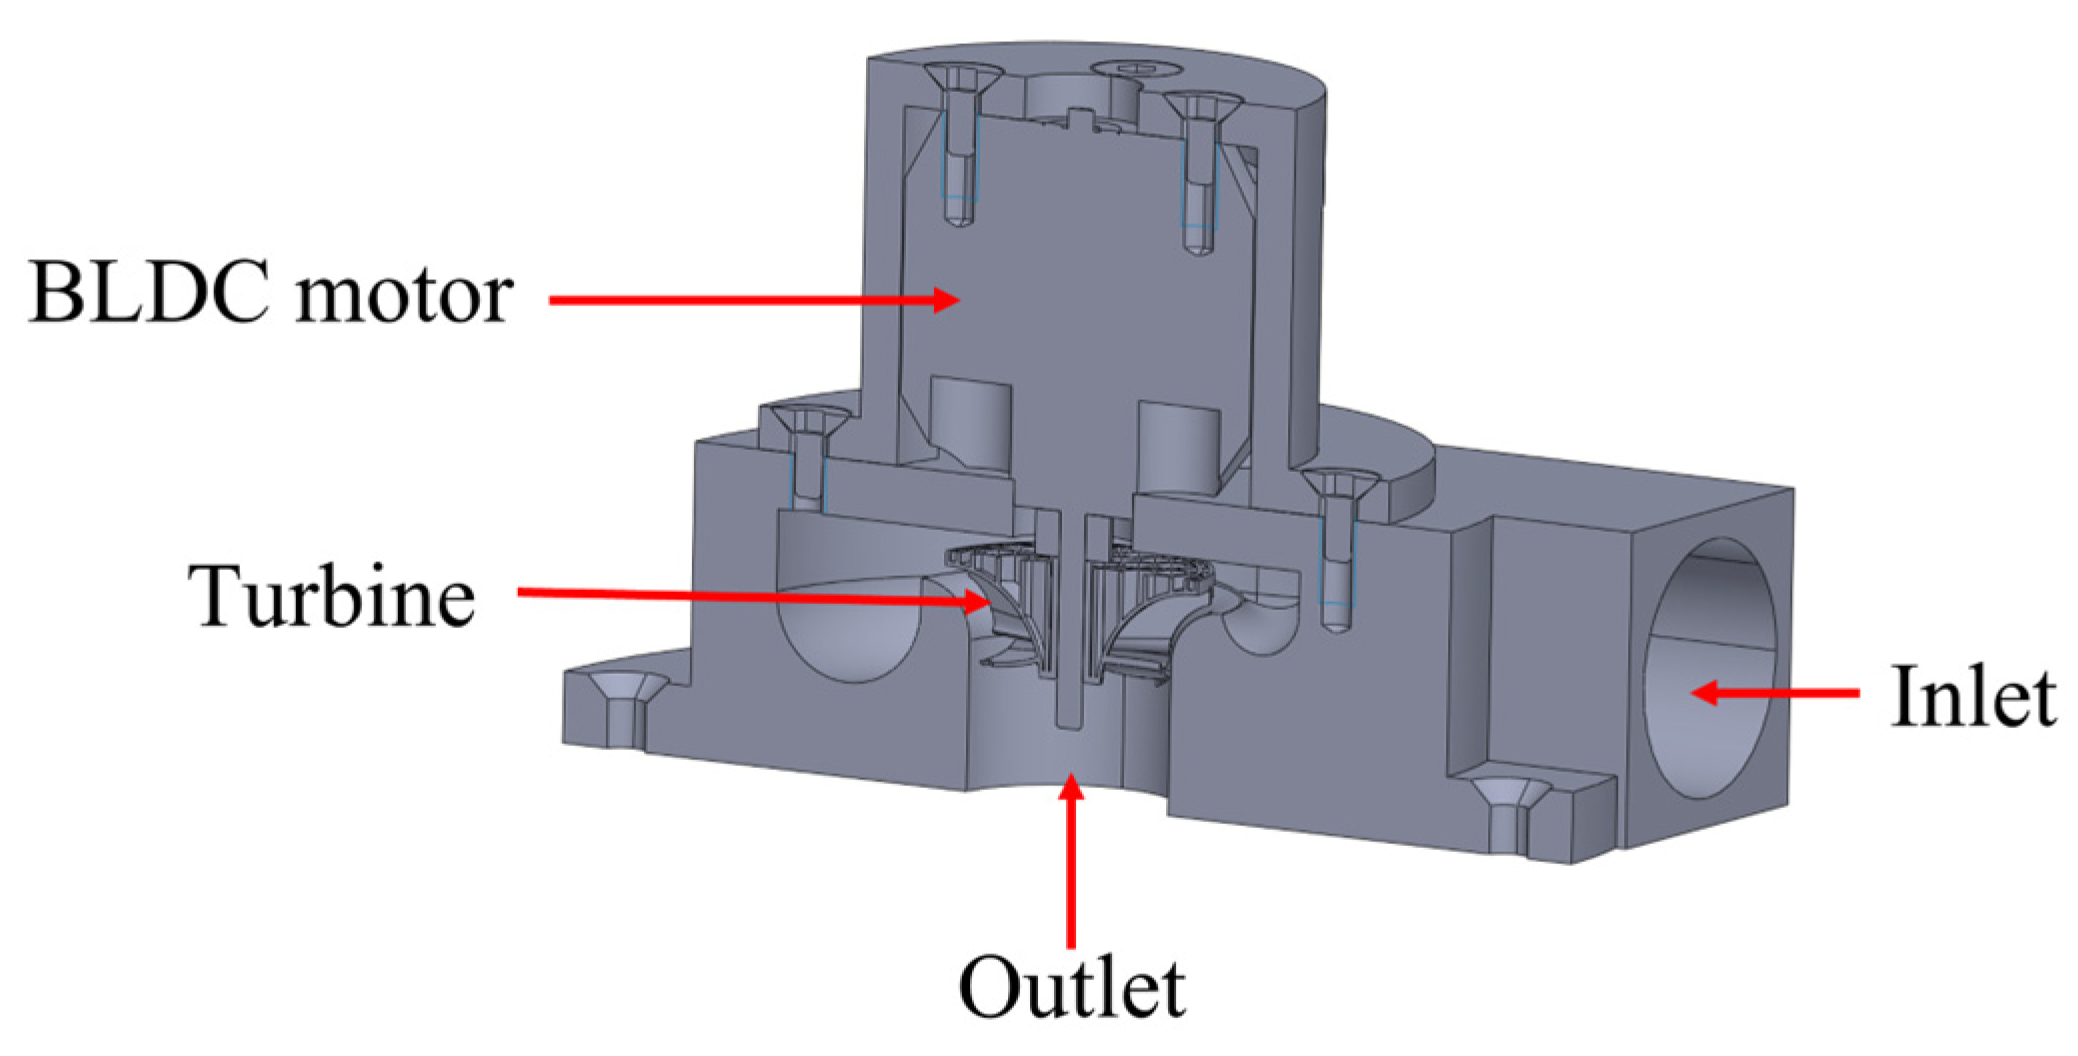
We built a modular test bench as shown in Figure 6 to validate the CFD trends at miniature scale and to choose a volute for hardware. The bench allows the volute to be swapped while the rest of the assembly (nozzle, rotor, bearings, generator, sensors, and plumbing) remains unchanged. All tests use compressed air. Operating points spanning rpm and were used (the corresponding kg/s range used in CFD).
Figure 6.
Experiment test bench (a) isometric and (b) cutaway view.
2.5.1. Hardware and Instrumentation
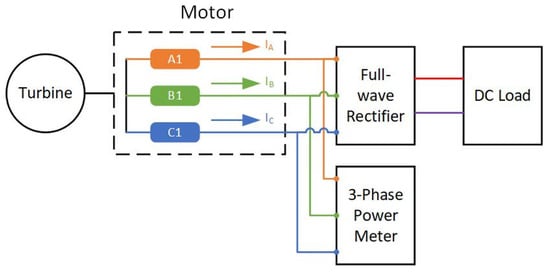
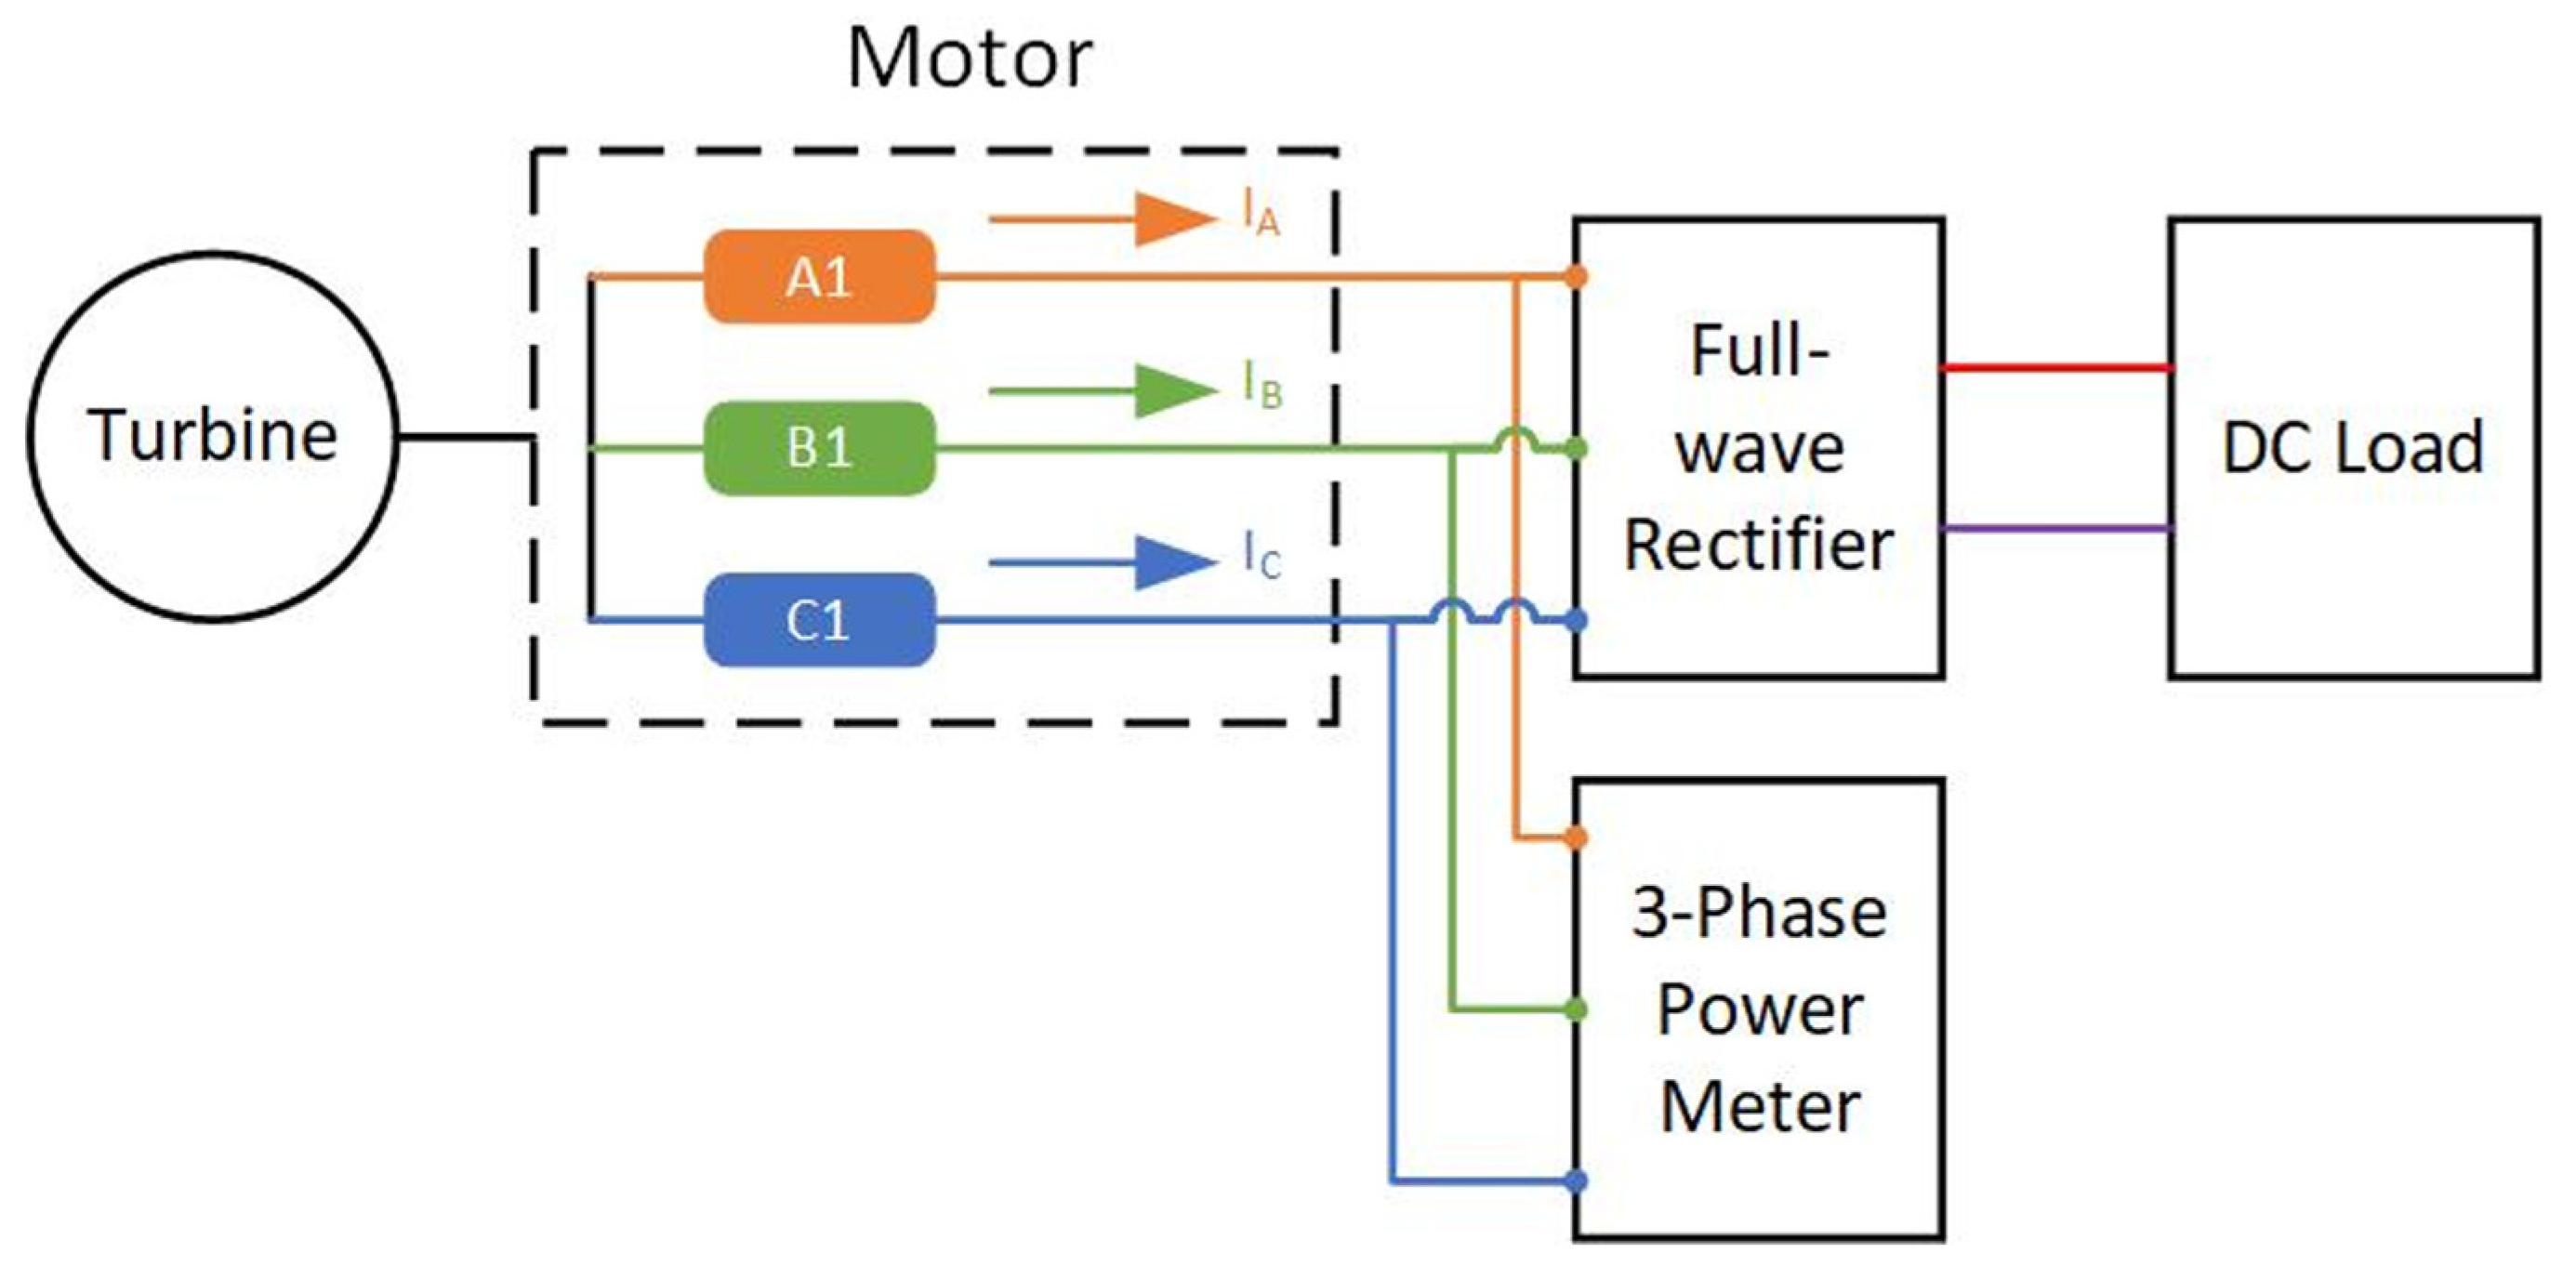
- Rotor-generator drivetrain: the turbine shaft is coupled directly to a brushless DC (BLDC) motor (A2212/10T, 1400 KV) that operates as a three-phase generator. The generator feeds a three-phase power meter (AC side), then a full-wave rectifier and a DC load (for controlled electrical absorption, ITECH IT6015C-80-450 Bidirectional Programmable DC Power Supply) as shown in Figure 7;Figure 7. Schematic of BLDC circuit.
- Volute modules: rectangular, round–asymmetric, and trapezoidal scrolls are 3D-printed and mounted to the same stator/rotor cartridge as shown in Figure 8 to isolate volute effects;Figure 8. BLDC generator in turbine assembly.
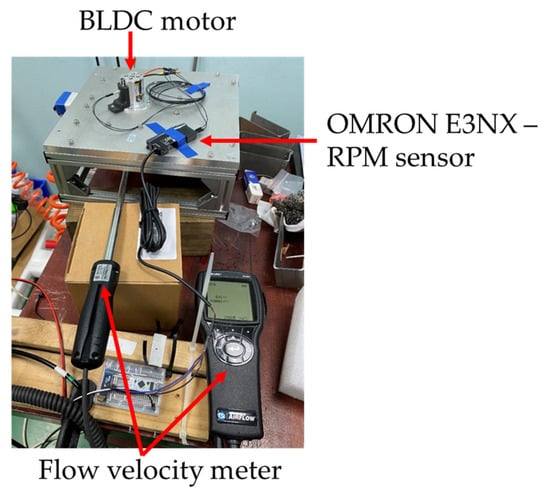
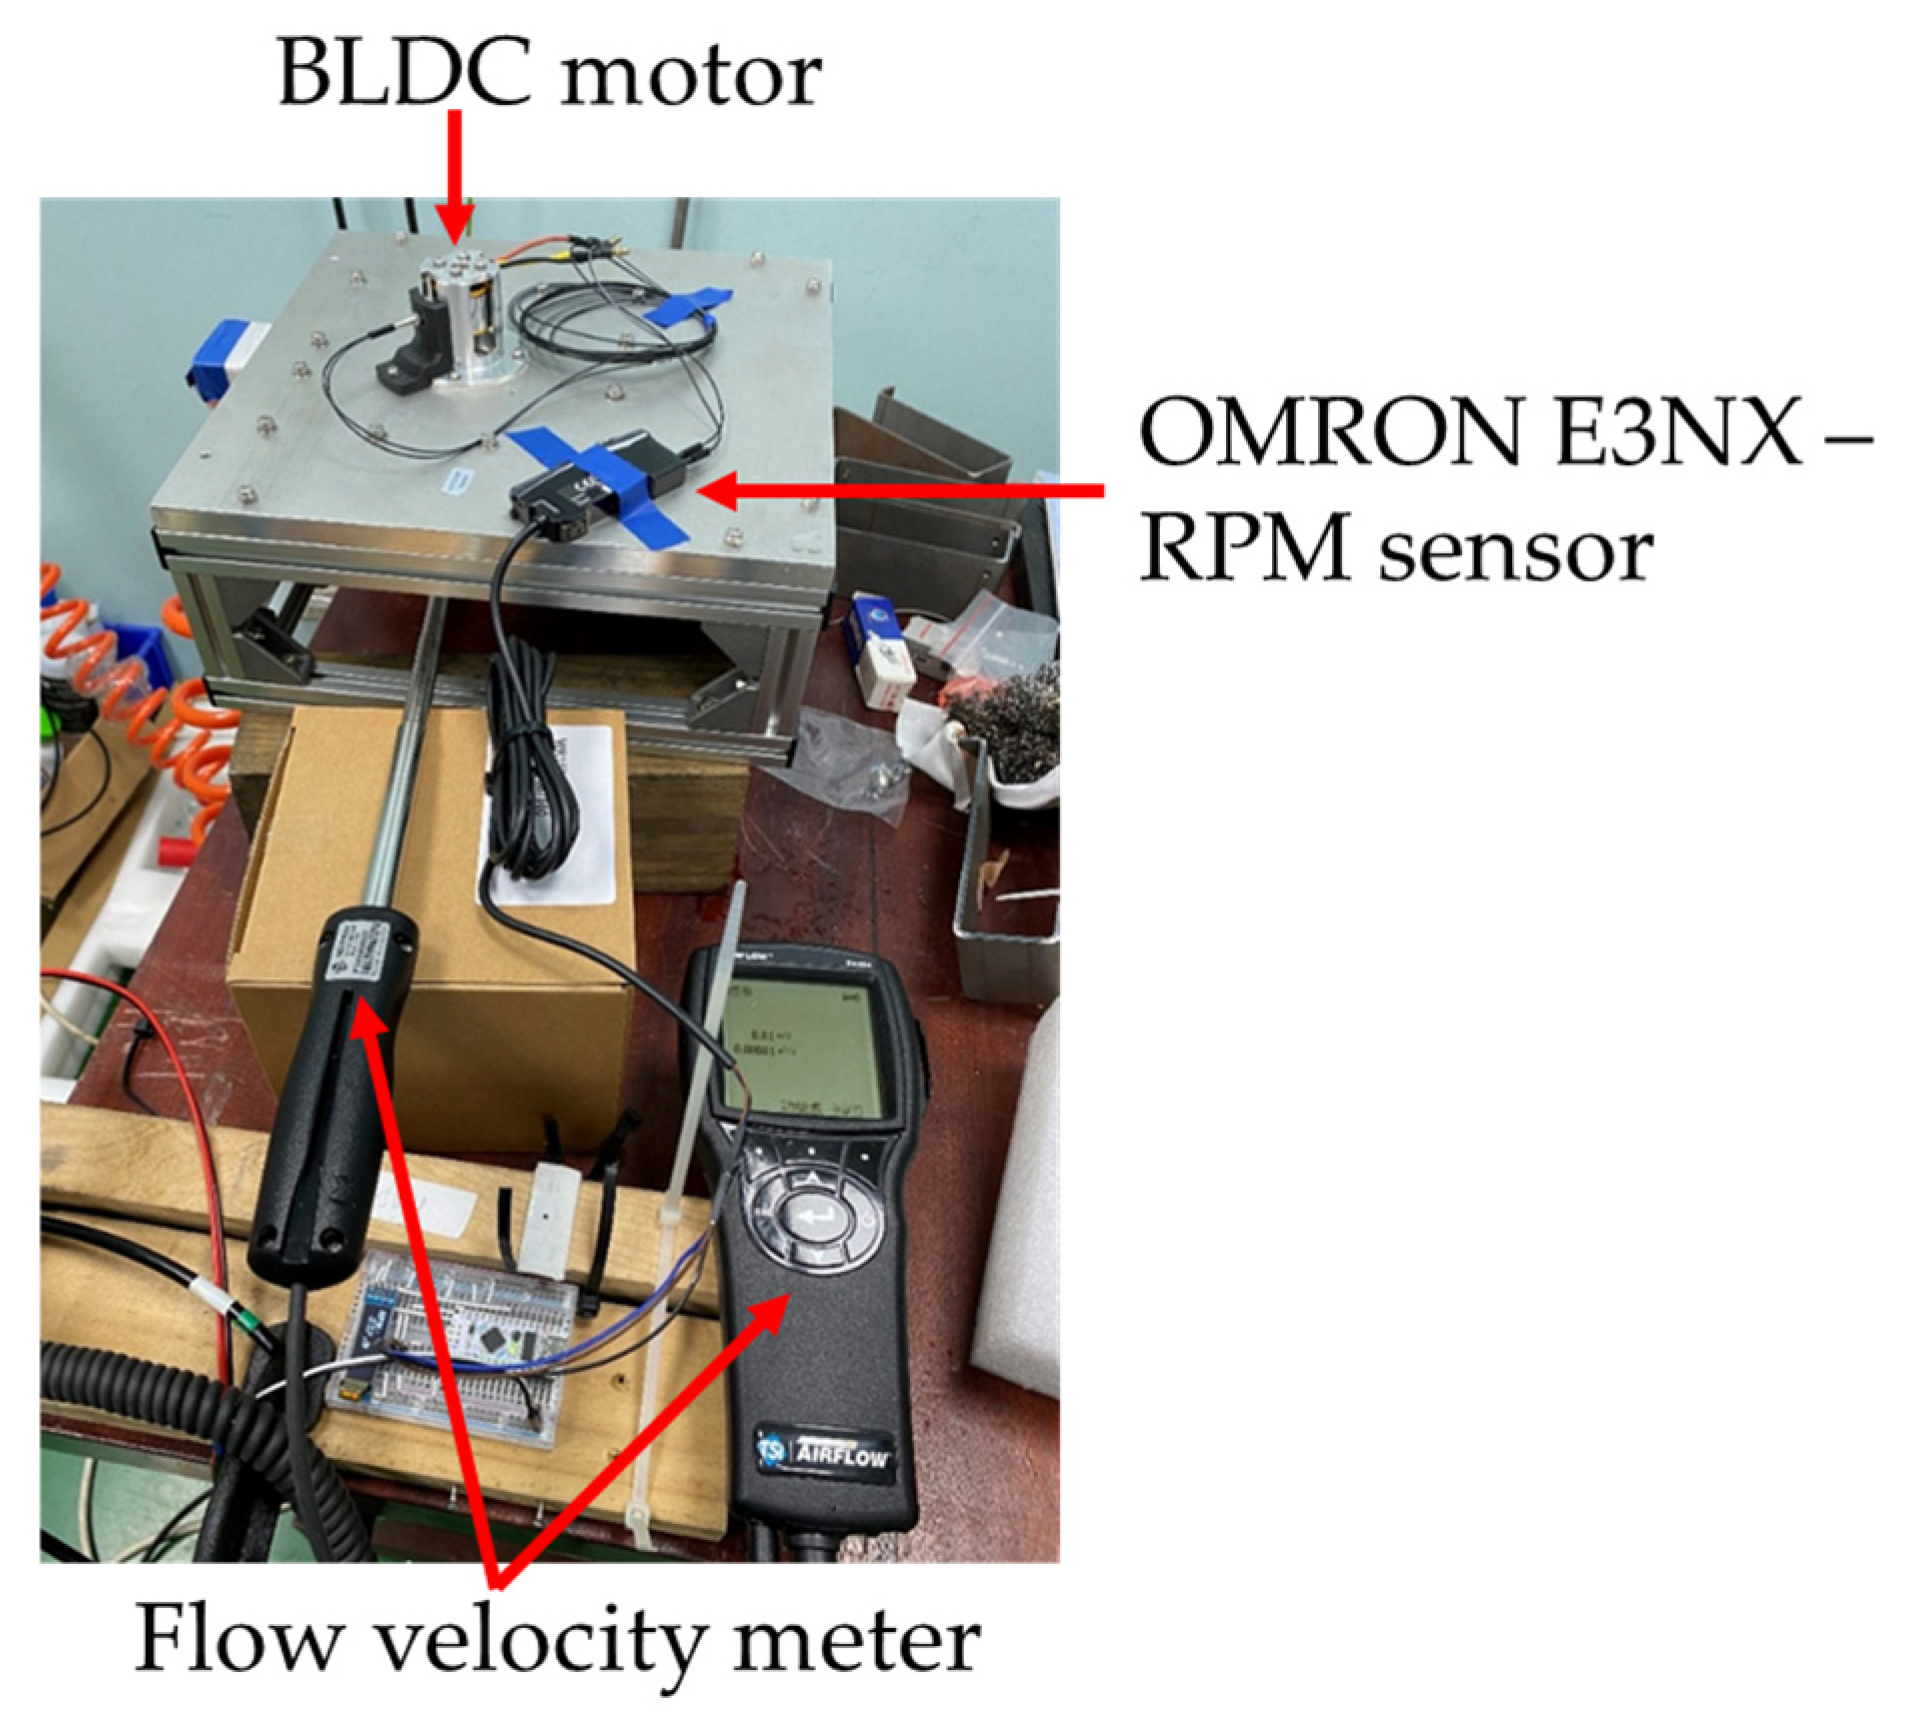
- Sensors: a three-phase power meter, tachometer/encoder (or back-EMF frequency) for (OMRON E3NX-CA11), a pitot or anemometric flow velocity probe (The TSI Airflow Instruments Multi-Function Anemometer TA465) at the outlet as shown in Figure 9, and pressure/temperature taps for ambient density (used only to convert volumetric to mass flow when needed).Figure 9. Full test bench assembly.
2.5.2. Test Procedure and Data Reduction
For each volute:
- Leak-check, set the same shaft end-float and tip-gap shim as in CFD, and align the scroll tongue to a marked datum;
- Step the air valve to reach target Pin and N; hold until readings stabilize (≥10 s);
- Log: N, three-phase real power (AC side), phase voltages/currents, outlet velocity Vout, outlet area Aout, and line ;
- Repeat the sweep (up and down) to quantify hysteresis and repeatability; then swap the volute and repeat.
For data reduction,
Path A—Power method (cross-check):
Here, is the combined generator + rectifier efficiency; its value is obtained from a calibration and bounded in the 0.70–0.90 range for sensitivity checks (we report both the nominal and bounds).
Path B—Back-EMF/torque constant method (currently used for reporting):
For sinusoidal BLDC generators in SI units, the torque constant and back-EMF constant are equal, [55,56]. With the measured line-to-line back-EMF (rms) ad speed ,
We use Path B only as a consistency check against Path A and for quick diagnosis during setup.
The turbine was originally designed for a target operating range of 50,000–100,000 rpm, representative of high-altitude UAV power systems, and the corresponding CFD simulations were conducted at these speeds during the design phase. However, during experimental validation, the achievable rotational speed was limited by the testing methodology rather than the turbine design itself. Due to the micro-scaled turbine dimensions (20 mm rotor diameter and 1 mm shaft diameter), conventional high-speed turbine test rigs were not feasible.
Therefore, a BLDC motor-based generator was employed as a regenerative load, which safely operates within a rotational speed range of approximately 5000–12,000 rpm. In this configuration, the turbine rotational speed is not externally imposed but self-adjusts based on the balance between aerodynamic driving torque and electrically imposed generator load under a fixed boundary condition.
The experiments were thus intended to validate torque and power trends and demonstrate turbine–volute feasibility at miniature scales. CFD simulations were performed at discrete representative rotational speeds to enable direct comparison with experimental equilibrium points, while higher-speed simulation results serve as a performance forecast for future high-speed experimental development.
Flow verification:
We verify the operating range independently via outlet velocity and area:
Agreement within the flowmeter’s uncertainty band confirms is in the CFD range.
At each operating point, we compute (i) shaft torque and power , (ii) electrical output , and (iii) corrected pressure and speed. We compare trends (slope vs. and ) and absolute values to the steady isothermal CFD. Because CFD omits the energy equation, the match criterion is set on torque and power rather than efficiency (target 10–15% in the mid-range) and on qualitative inlet-uniformity behavior inferred from pressure rake/flow visualization.
2.5.3. Uncertainty and Repeatability
Uncertainties in the experimental measurements include power-meter calibration, generator–rectifier system efficiency estimation , tachometer or frequency-to-speed conversion, outlet velocity probe bias, and geometric tolerances in the area estimation . We follow the JCGM/GUM framework [38] to quantify uncertainty by combining both Type A (statistical repeatability) and Type B (instrumentation and calibration) components. The combined standard uncertainty is propagated to mechanical torque τ and shaft power .
To ensure repeatability and minimize systemic error, each volute configuration was tested multiple times, with test orders deliberately alternated to check for thermal drift or bearing warm-up effects. The generator-based braking torque was estimated using the known BLDC motor constant , allowing torque to be derived directly from load current without requiring mechanical braking or torque. Experimental torque readings were found to agree with CFD predictions within 12%, validating the measurement repeatability and confirming the adequacy of the mesh and solver setup.
3. Results and Discussion
3.1. CFD Results
We ran RANS with the model under isothermal properties at 298.15 K and 700 K, solving continuity and momentum only to rank three volute geometries—round–asymmetric, rectangular, and trapezoidal—over the target low mass-flow band (0.004–0.016 kg/s) at the 2000–10,000 rpm range and 50,000–100,000 rpm range (for future predictions). The outlet was fixed at 1 atm. Rotor torque was integrated on the rotor surfaces and shaft power computed as with . We also examined flow quality at the stator inlet using streamline visualizations colored by velocity magnitude to understand complex flow patterns and identify crucial regions like boundary layers and separation.
We mapped the three volute geometries in Table 5 with higher rpm cases firstly here: round–asymmetric, rectangular, trapezoidal, at 50,000 rpm and 100,000 rpm. Rotor torque was surface-integrated, and shaft power was . In the actual test bench experiment and validation section, the lower rpm range numerical analyses were discussed again in detail.
Table 5.
Torque and power from isothermal CFD at representative design speeds.
Across both speeds, the round–asymmetric volute produced the highest torque and power.
- At 50,000 rpm: +297% vs. rectangular and +172% vs. trapezoidal in power (same factors apply to torque);
- At 100,000 rpm: +75% vs. rectangular and +94% vs. trapezoidal.
This consistent lead supports using the round–asymmetric scroll as the baseline for hardware.
3.1.1. Flow-Field Interpretation
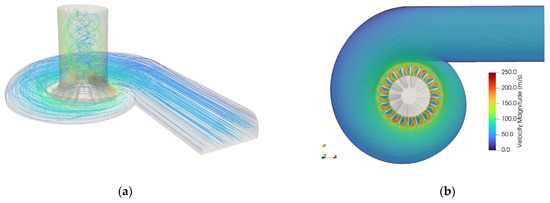
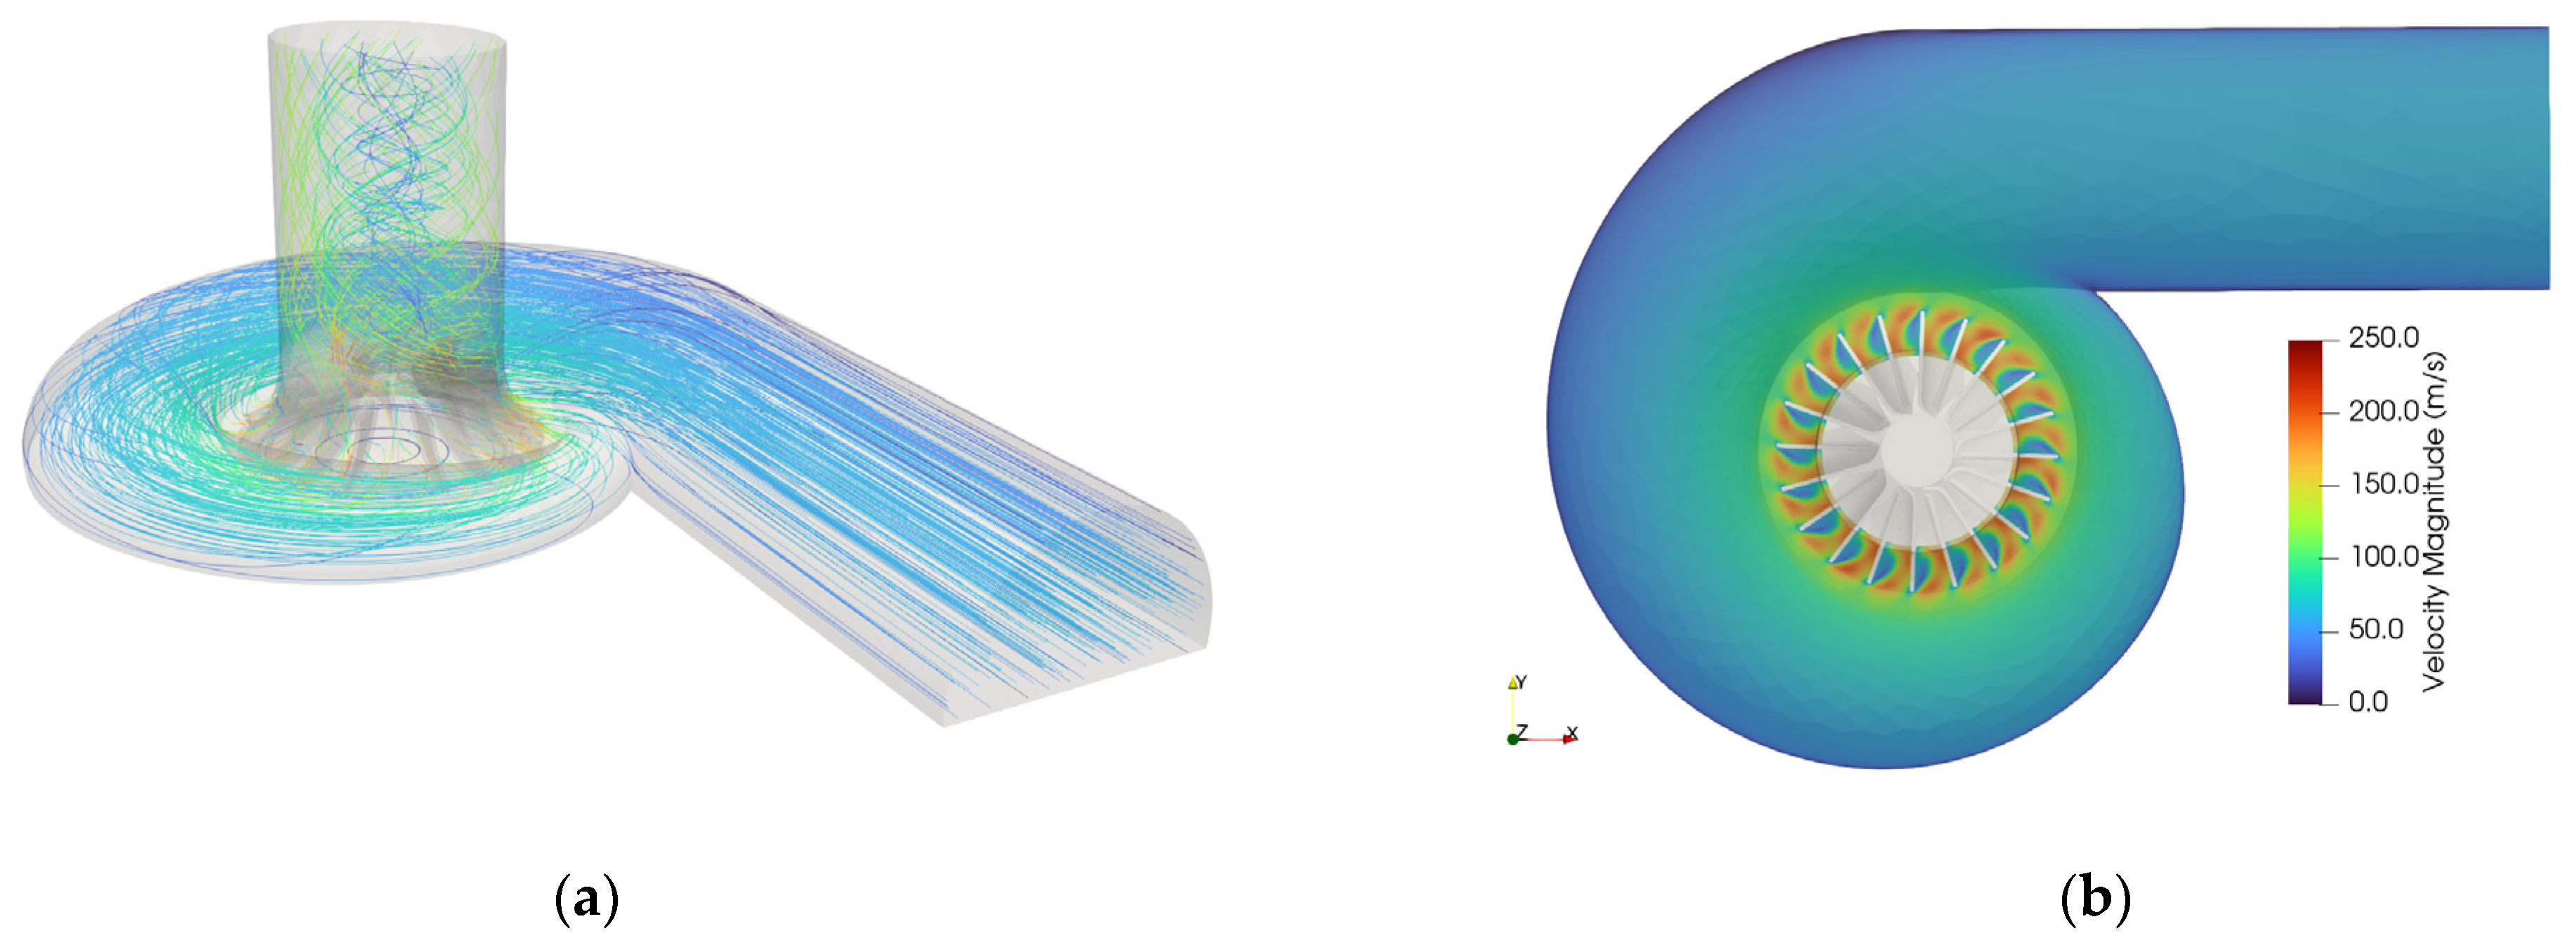
Figure 10.
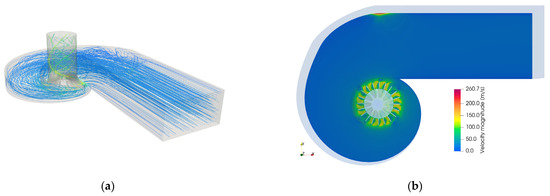
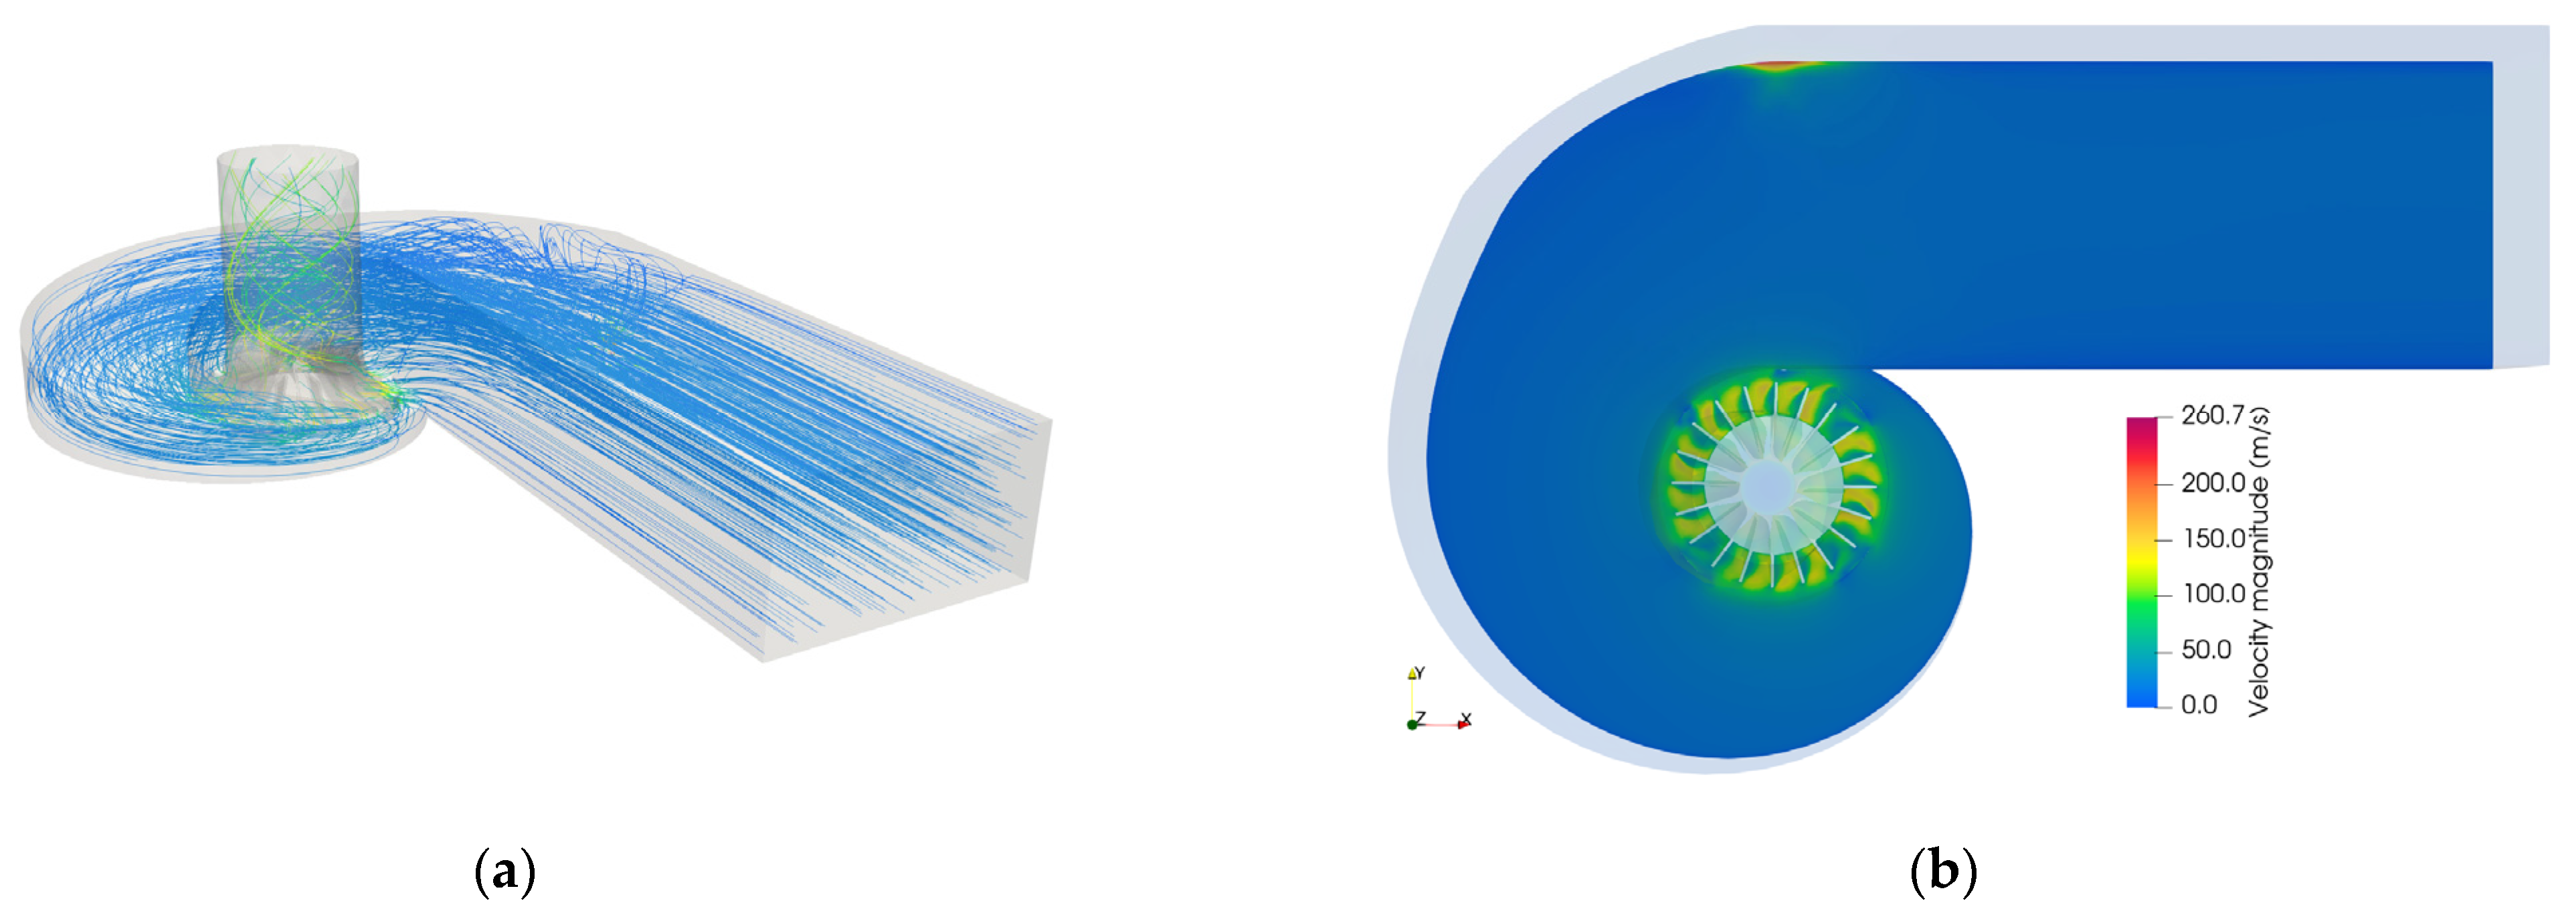
(a) Streamlines; (b) Cut slice on XY plane near the blade-tip colored by velocity magnitude in the round–asymmetric volute at 50 k rpm and .
Figure 11.
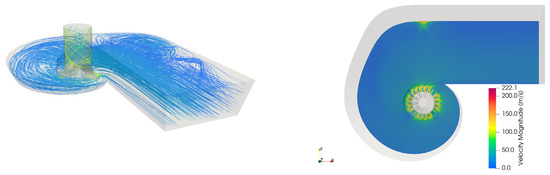
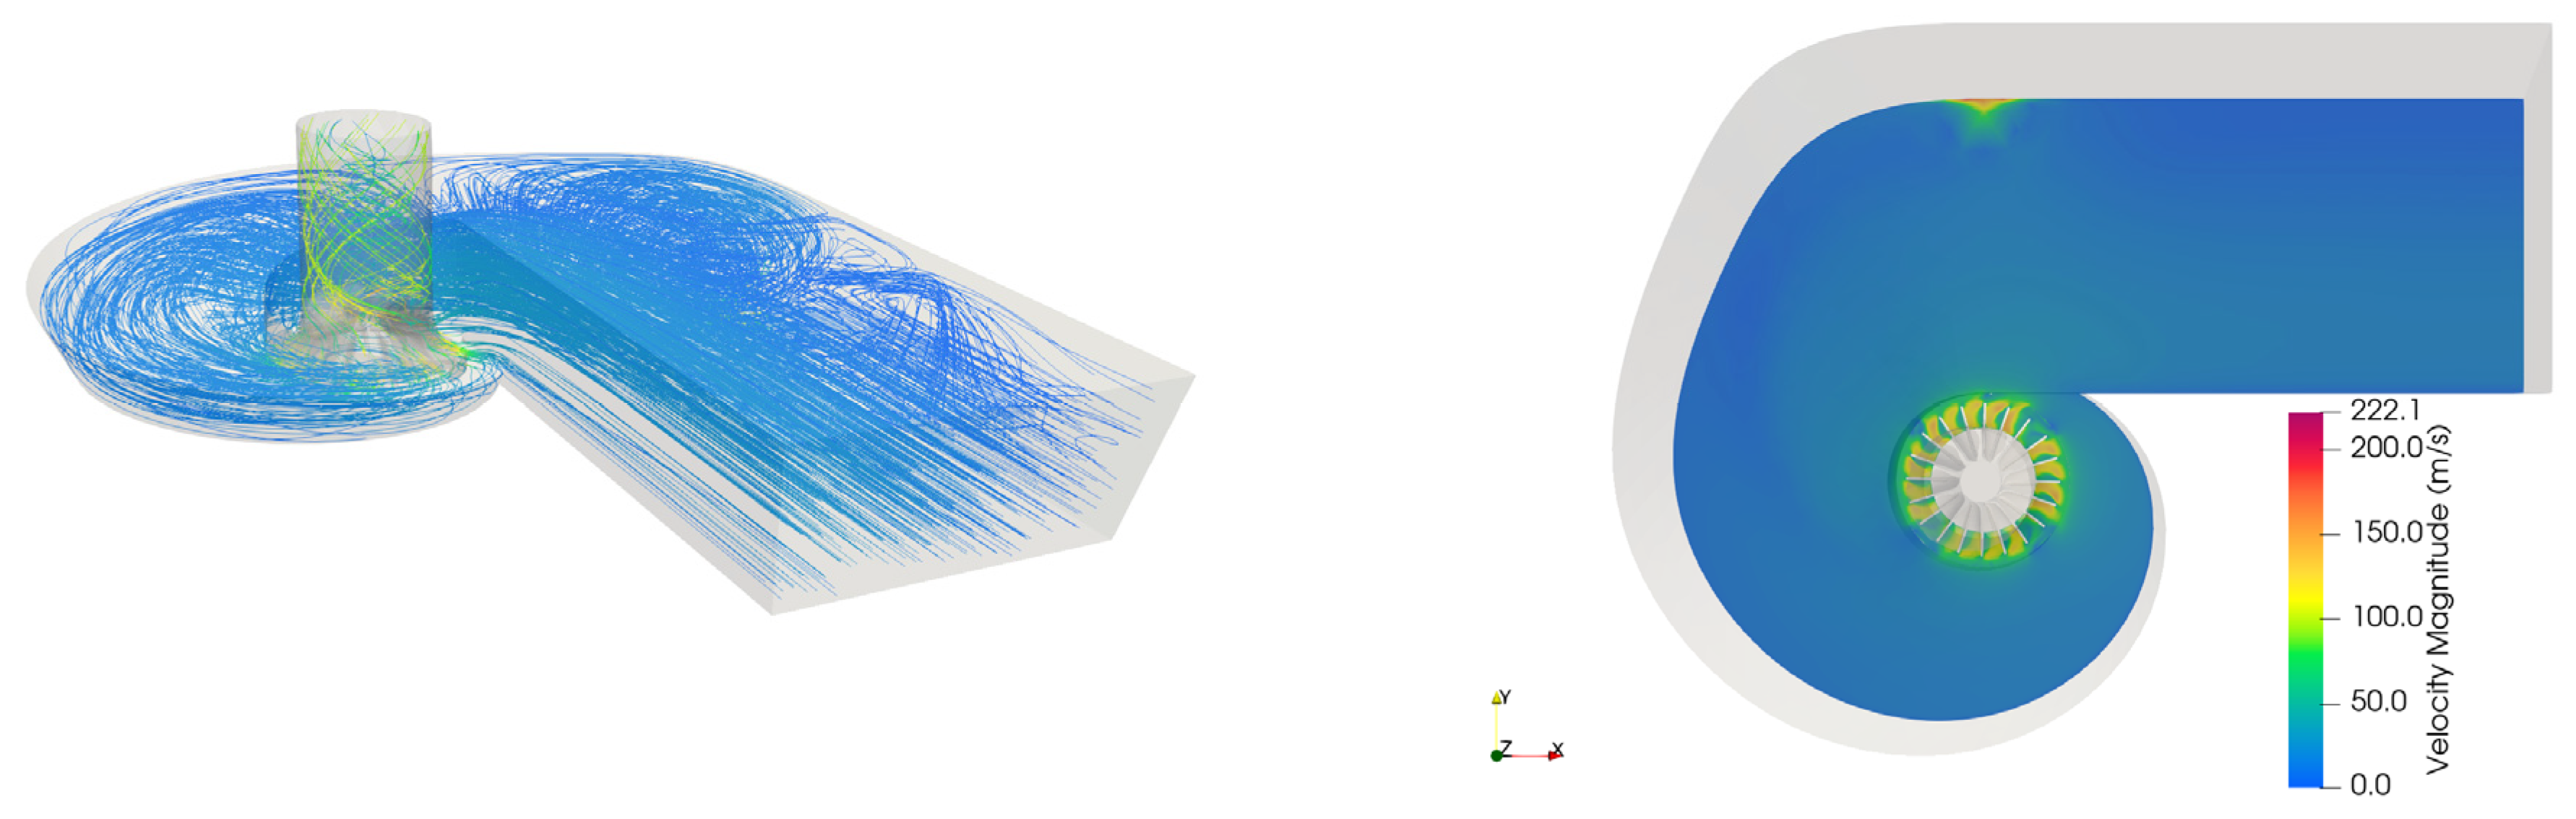
(a) Streamlines; (b) Cut slice on XY plane near the blade-tip colored by velocity magnitude in the rectangular volute at 50 k rpm and .
Figure 12.
Streamlines colored by velocity magnitude in the trapezoidal volute at 50 k rpm and .
- Round–Asymmetric Volute (Figure 10): Streamlines remain well attached along the outer scroll wall and continue smoothly through the tongue region. The entry column into the stator inlet is well organized, with minimal cross-flow distortion or secondary motion. This suggests favorable pressure recovery and low scroll-induced loss. From a secondary flow perspective, the round–asymmetric volute shows reduced radial migration and less transverse pressure imbalance, indicating strong suppression of Dean-type vortices. This leads to more axial, uniform inflow into the rotor, enabling higher torque and power extraction. The configuration thus offers the best aerodynamic performance and inlet quality among the three designs.
- Rectangular Volute (Figure 11): A pronounced corner-driven recirculation cell is observed in the upstream straight segment, especially at the outer corner before the bend. Additional separation zones occur near the tongue region, where streamlines detach and reattach—indicative of a stronger adverse pressure gradient. These flow disturbances result in higher secondary flow intensity, with transverse vortex structures disrupting the core inlet column. These effects manifest as high entropy generation and poor incidence alignment at the nozzle leading edge, directly correlating with the observed lower torque output in both simulation and experiment. The rectangular shape’s sharp geometric transitions intensify flow non-uniformity and degrade rotor inflow conditions.
- Trapezoidal Volute (Figure 12): At moderate speeds (~50,000 rpm), this volute shows some aerodynamic improvement over the rectangular type. However, persistent secondary vortices develop along the outer scroll wall downstream of the bend, and these vortices intensify with increased speed (100,000 rpm). The streamline pathlines show moderate deviation and skewness near the tongue and outlet, resulting in mild pressure recovery loss. The secondary flow strength remains intermediate, with radial cross-flows causing modest inflow misalignment. As a result, its performance ranks between the rectangular and round–asymmetric volutes, consistent with the observed torque and power trends.
The flow behaviors above explain the Taguchi/DOE outcome: Factor A (section type) selects the round–asymmetric level at both speeds. The magnitude of improvement (75–297%) justifies this choice even before experimental validation. Tongue clearance and section aspect ratio will be tuned around the round–asymmetric baseline in the follow-on screening.
3.1.2. Modeling Limits and What to Expect When Adding ~15,000 rpm
These results use an isothermal, momentum-only model. Absolute efficiencies are therefore not reported; the emphasis is on relative differences driven by separation and loss in the scroll and at the stator inlet—phenomena that are well captured here. For comparison with the bench (limited to 15,000 rpm), we will run CFD cases at the same mass-flow sub-band. At lower speed, the incidence and local Mach numbers drop; we expect:
- The same geometry ranking (round–asymmetric > trapezoidal > rectangular) to hold;
- Reduced separation intensity in rectangular/trapezoidal relative to their 50 k/100 k behavior, but still measurably worse than round–asymmetric;
- Torque/power to scale down approximately with (and with any mass-flow adjustment needed to match the bench), preserving the relative gaps.
3.2. Experiment Results and Comparison with CFD
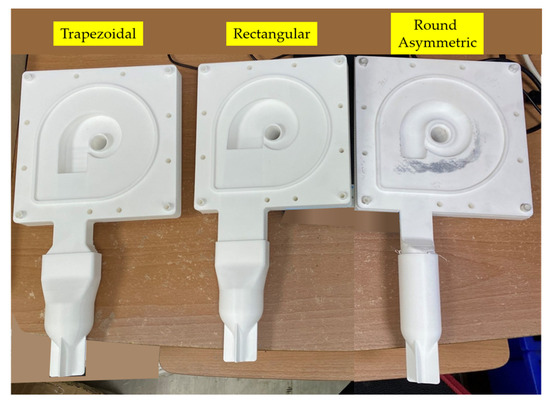
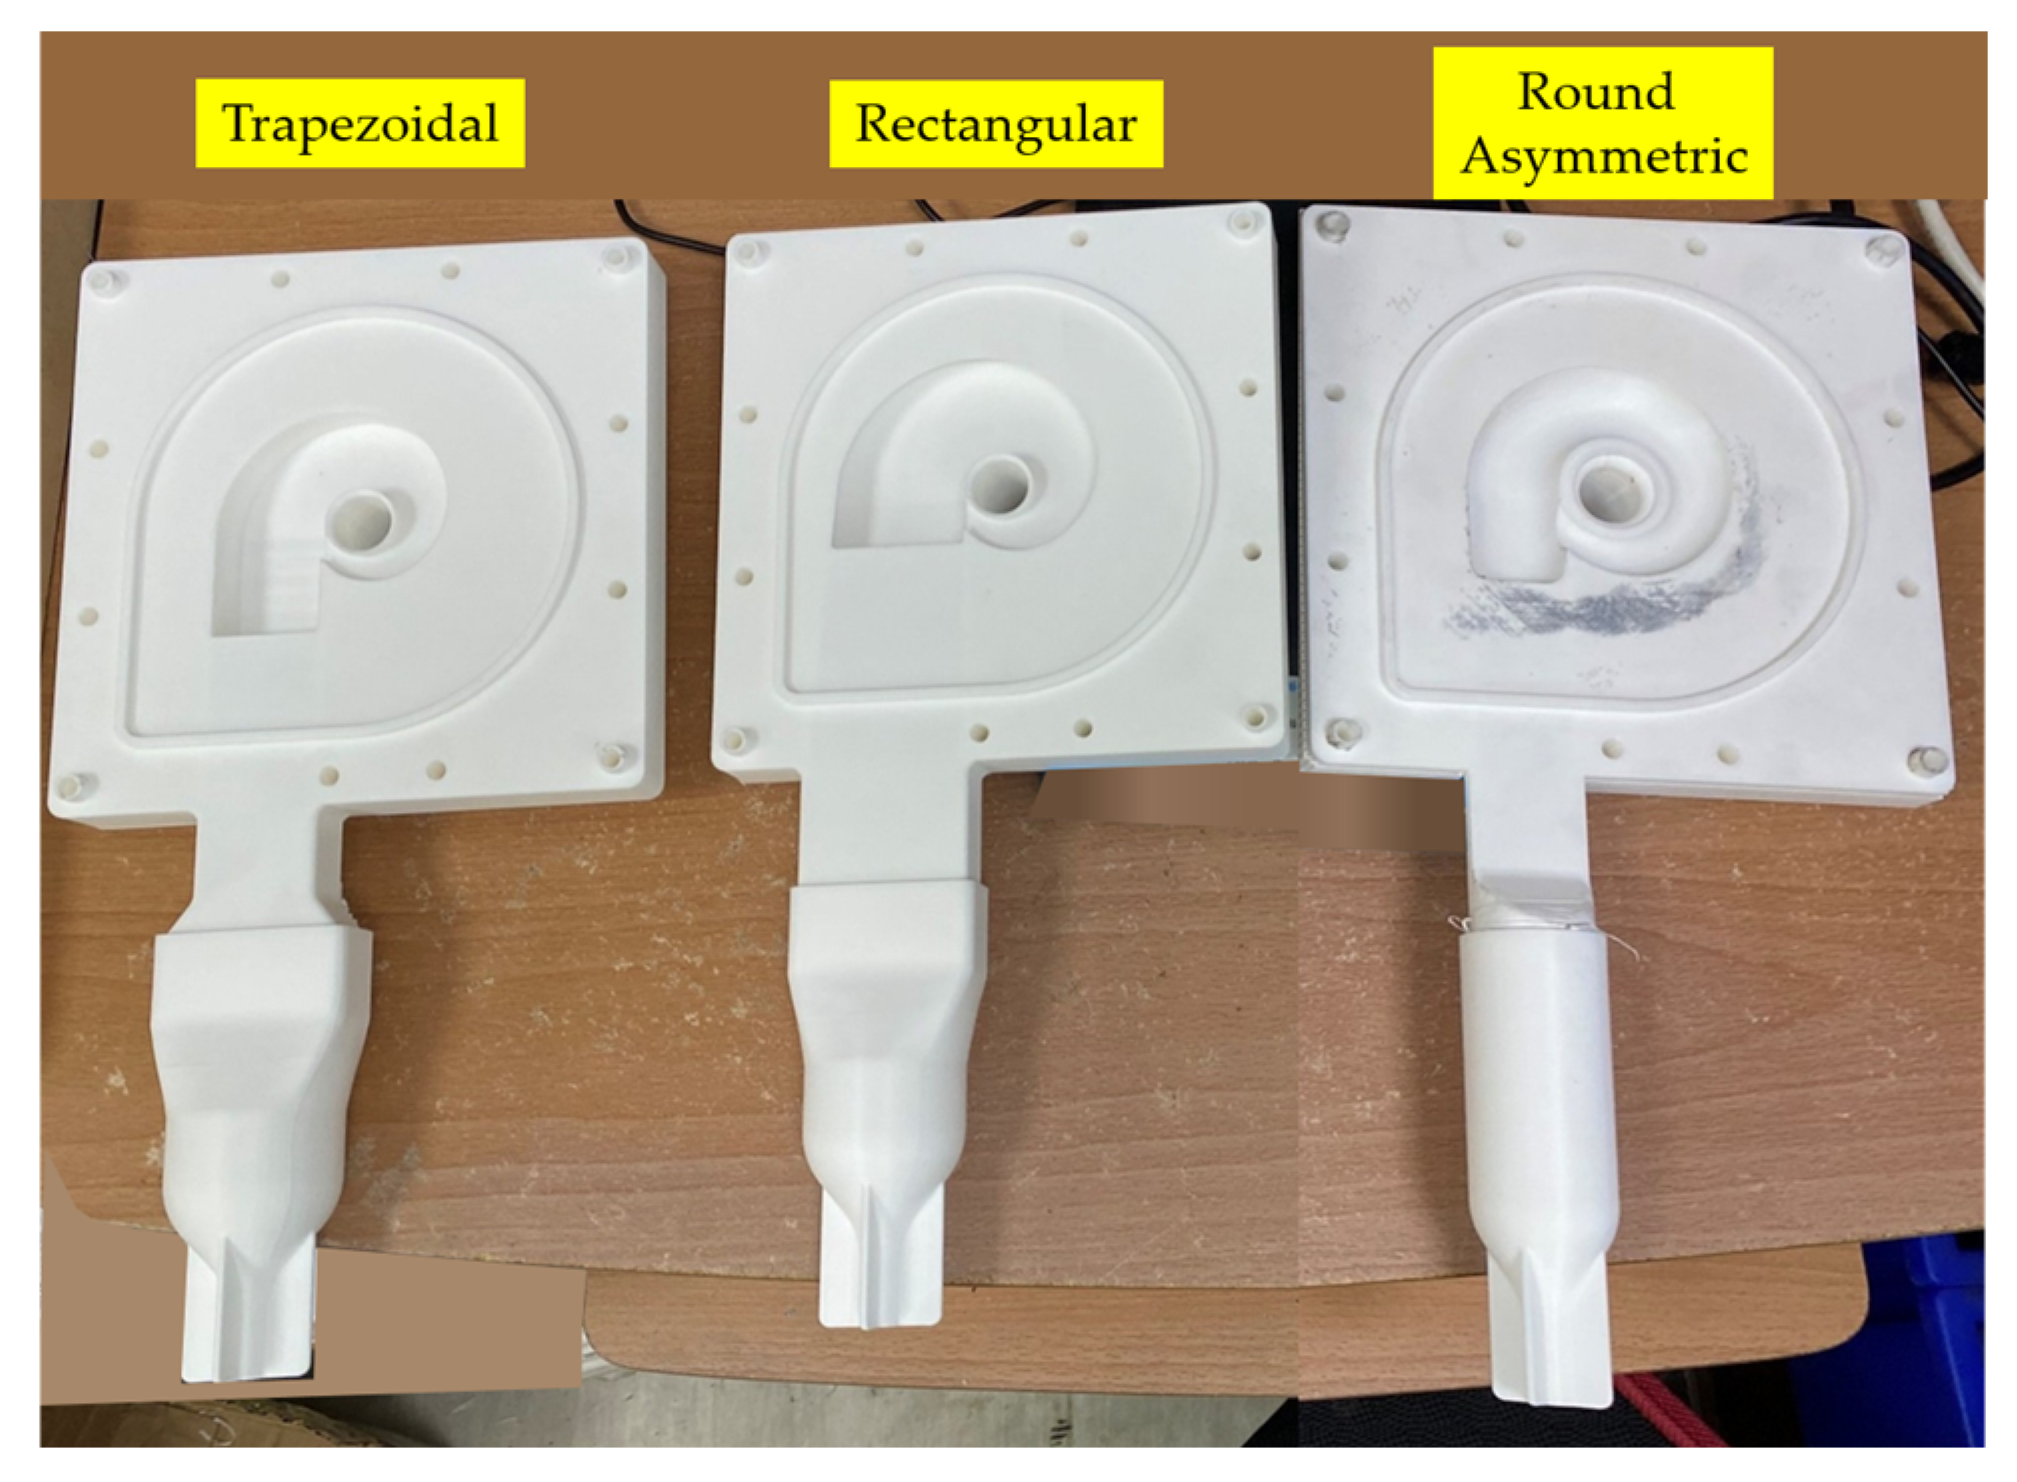
To validate the CFD model at the speeds our prototype bench can safely run, we performed low-speed tests for each volute geometry, as shown in Figure 13. The current test bench utilizes 3D-printed volutes, a BLDC motor used as a generator, and a conservative balance/bearing envelope. It runs reliably up to . This represents a bench limitation and not a turbine design limit. For the fluid temperature, no treatment was made, and the fluid was kept at 25 °C. The inlet pressure was stepped up from 65 psi to 80 psi in 5 psi increments. At each increment, we applied electrical load and held current steady long enough to read the voltage and speed (rpm). We recorded data using Path A and Path B, as described in the Materials and Methods section.
Figure 13.
Three-dimensional printed volute geometries for experimental analysis.
Table 6, Table 7 and Table 8 show the measured mechanical powers reduced from the experiment of all three volute shapes at different rpms; we chose to compare values where the current provided was 0.2 amps, as this current allowed us to measure the most data points and is kept consistent across all three volute shapes. The observed torque losses and swirl distortion at the rotor exit are partially attributed to tip-leakage flow effects, which were modeled using the 0.5 mm clearance in both simulation and physical testing.
Table 6.
Experimental power vs. rotational speed, round–asymmetric volute.
Table 7.
Experimental power vs. rotational speed, rectangular volute.
Table 8.
Experimental power vs. rotational speed, trapezoidal volute.
In order to match the experiment, conditions of CFD cases were changed to reflect actual conditions in the experiment, which would allow us to use our experimental values to validate our CFD results. The temperature of the fluids was set to 25 °C, and the outlet pressure was set to ambient to match bench conditions. Mass flow rate was adjusted so that the CFD cases correspond to the bench inlet-pressures of 0.0045 for round–asymmetric, 0.005 for rectangular, and 0.0090 kg/s for trapezoidal volute shape. The same rpm was used when available on the CFD grid; if not, the nearest rpm step is used. The rotor torque integrated from wall forces was used and resulted in our simulation power being calculated as:
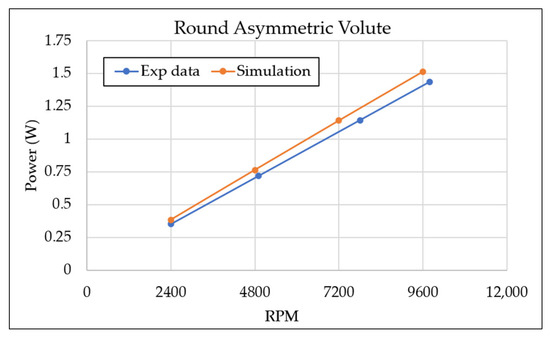
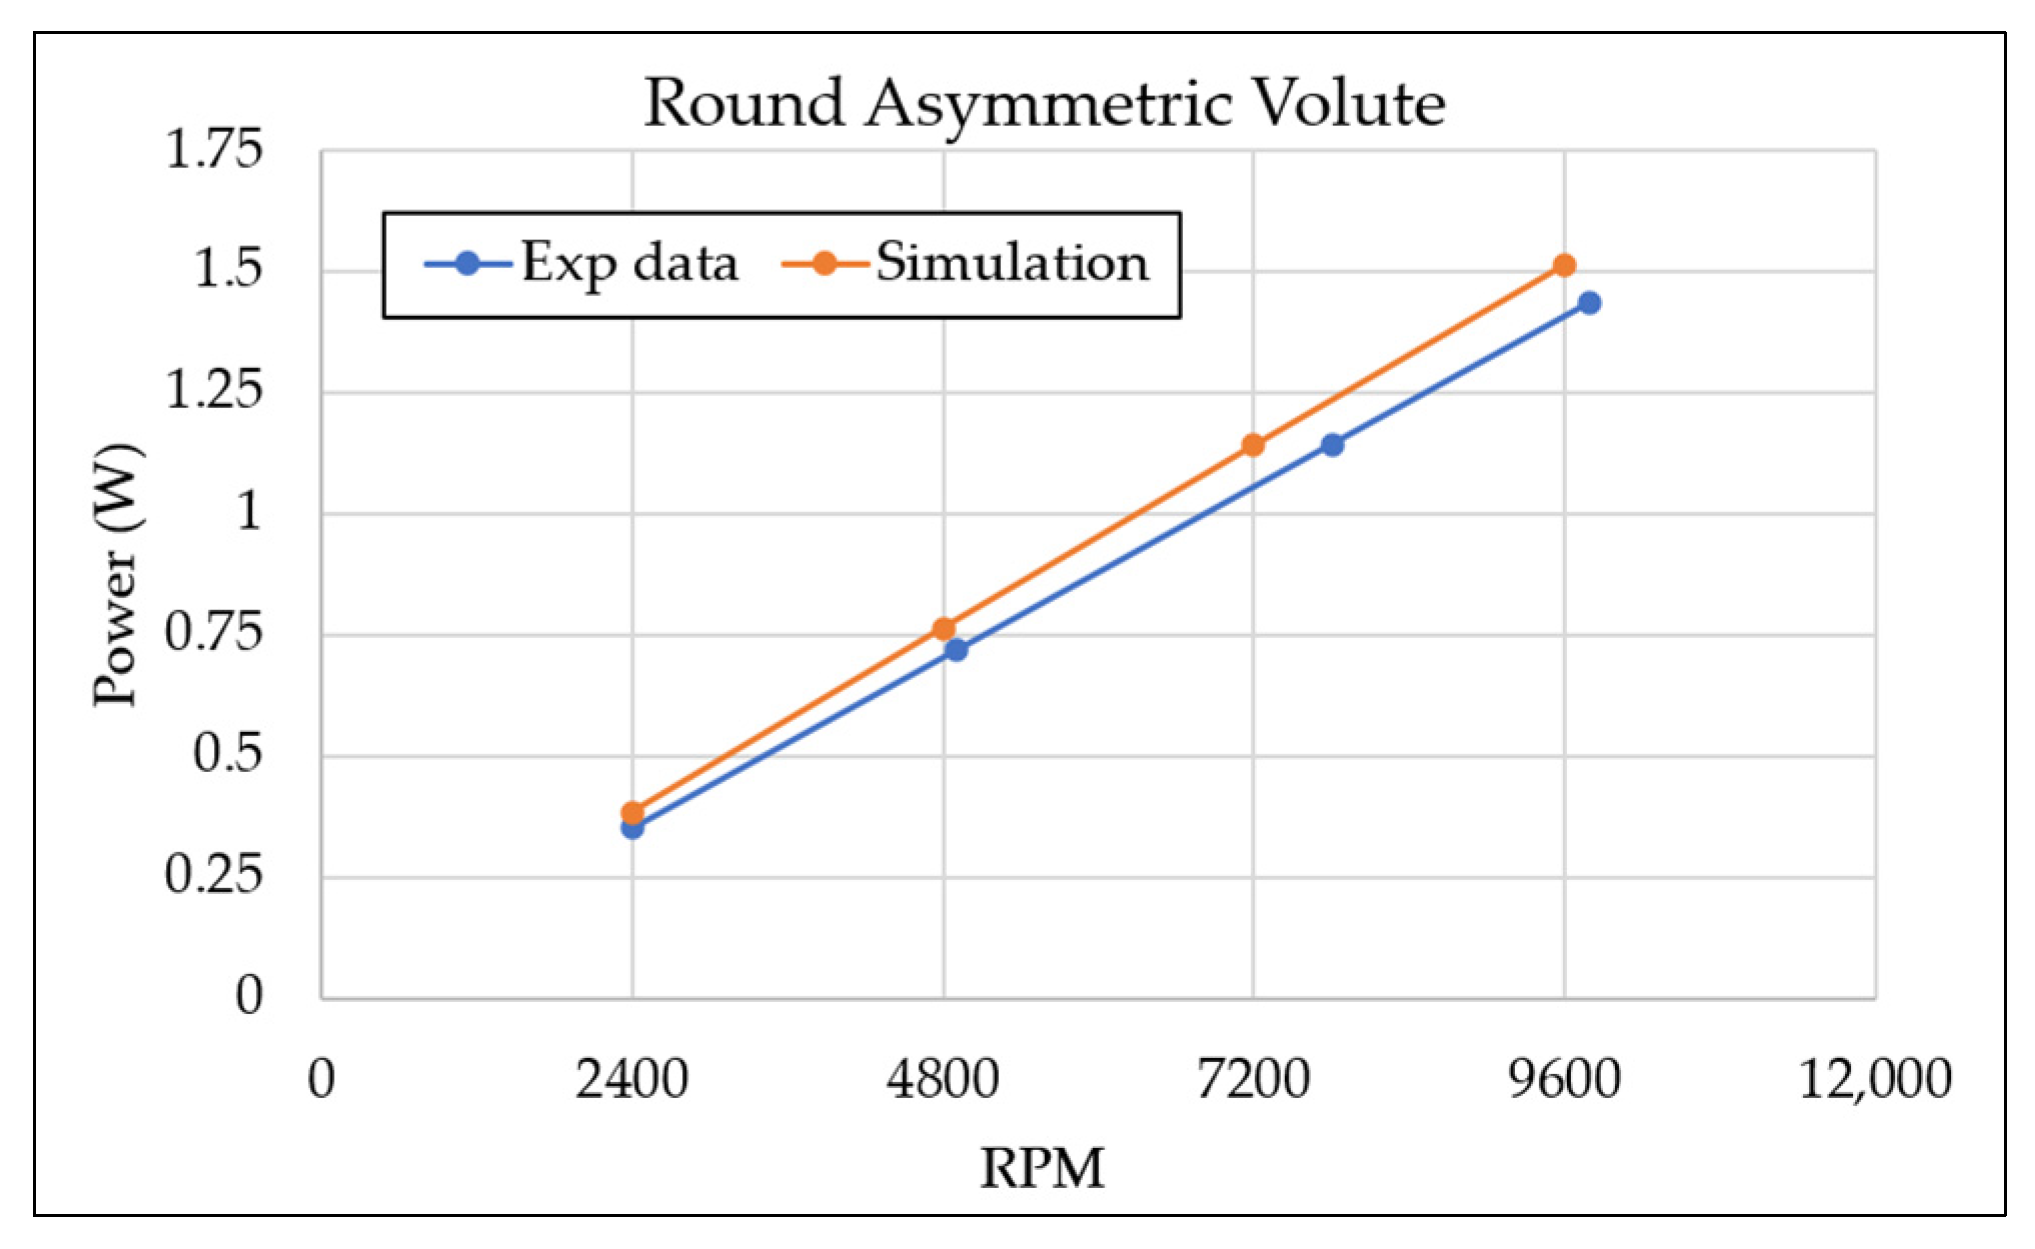
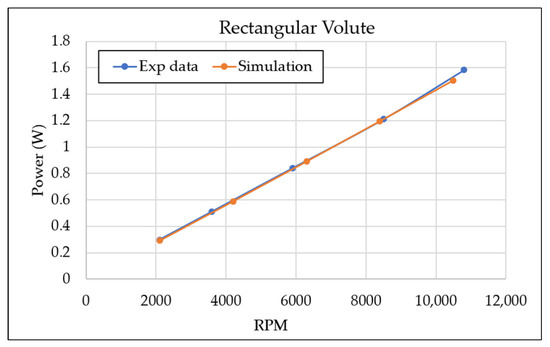
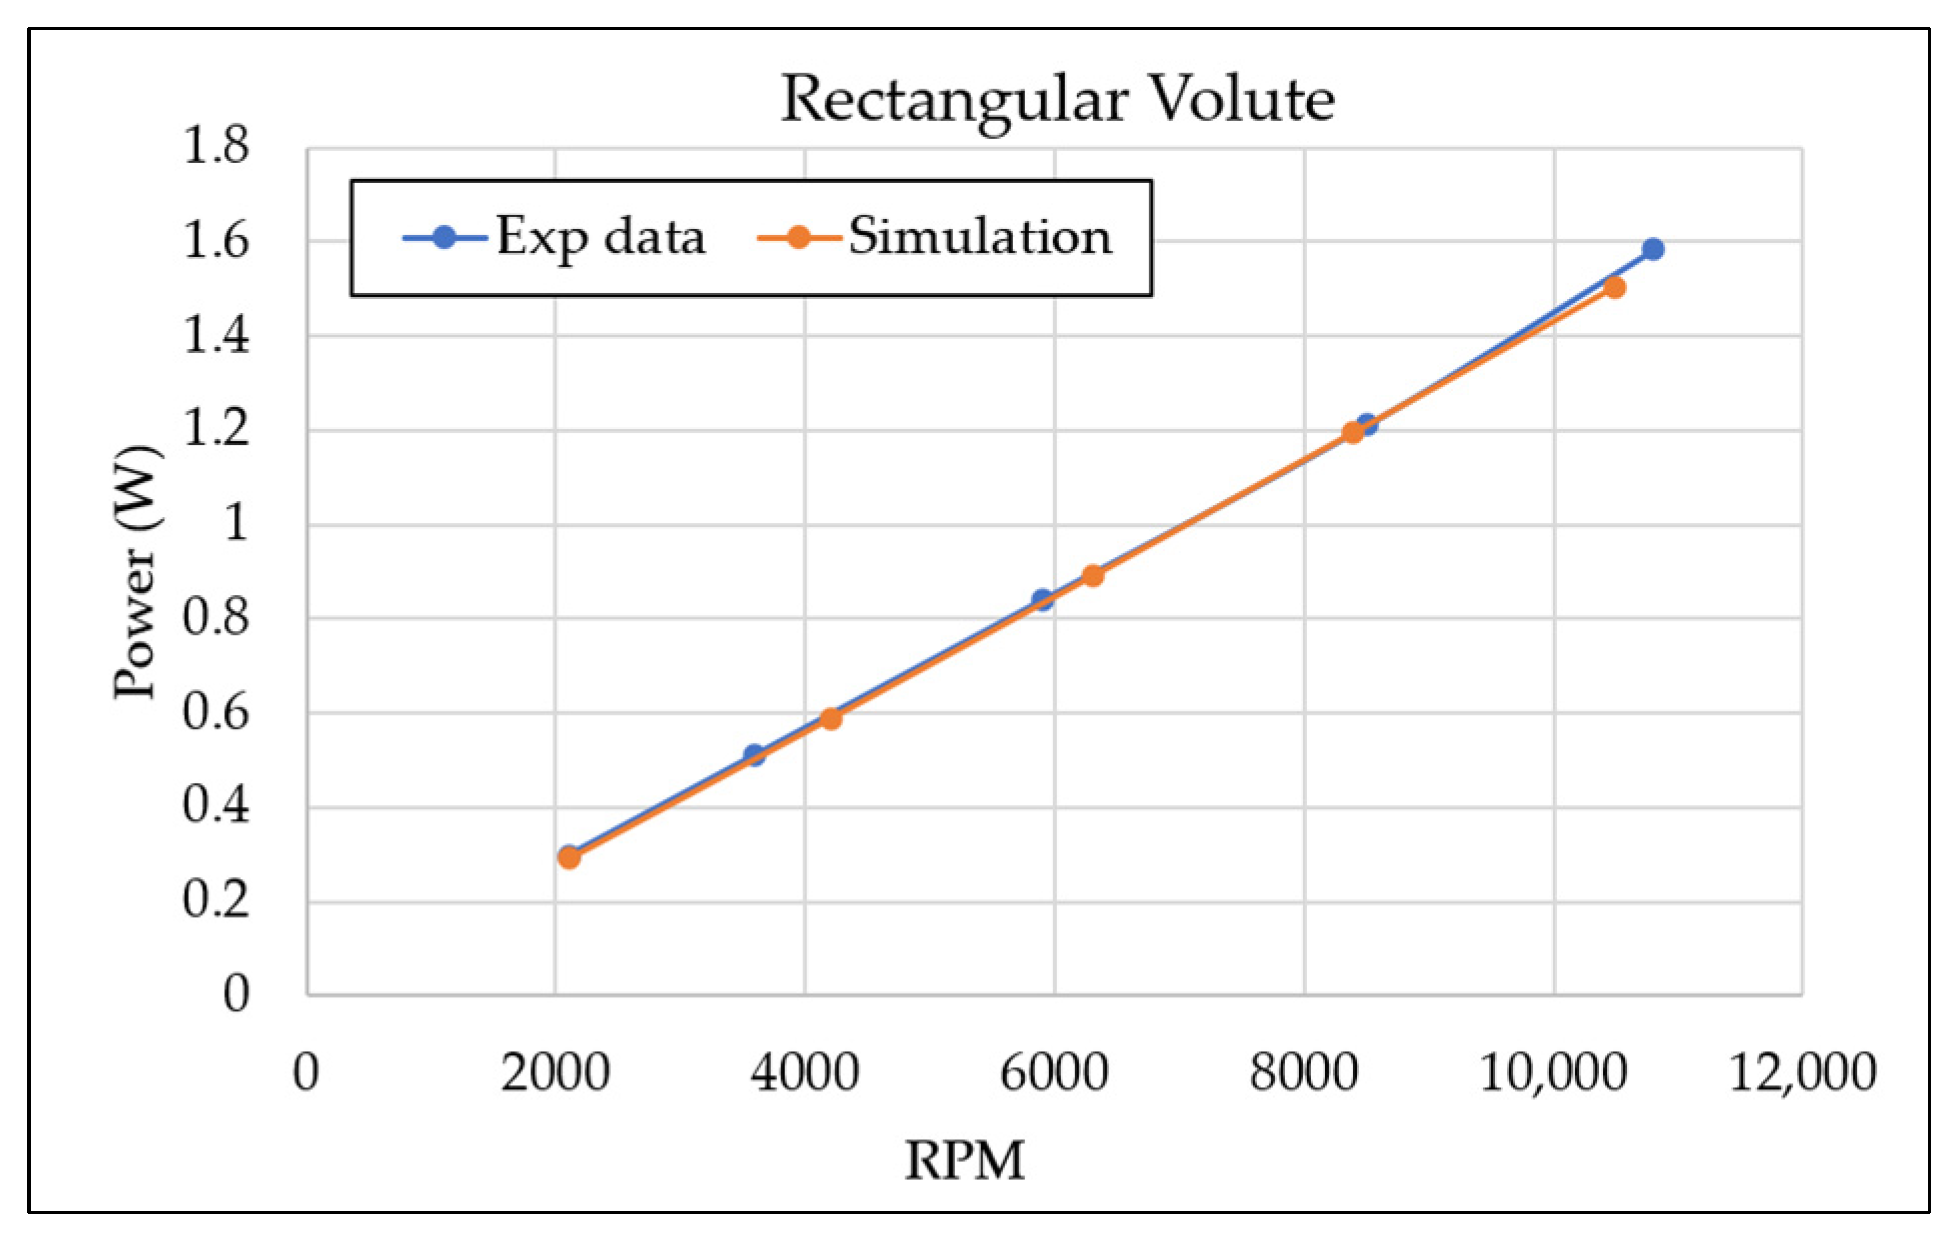
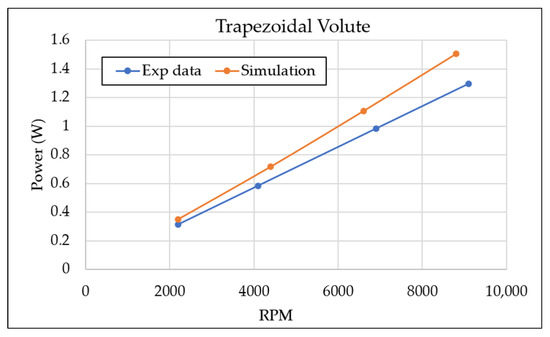
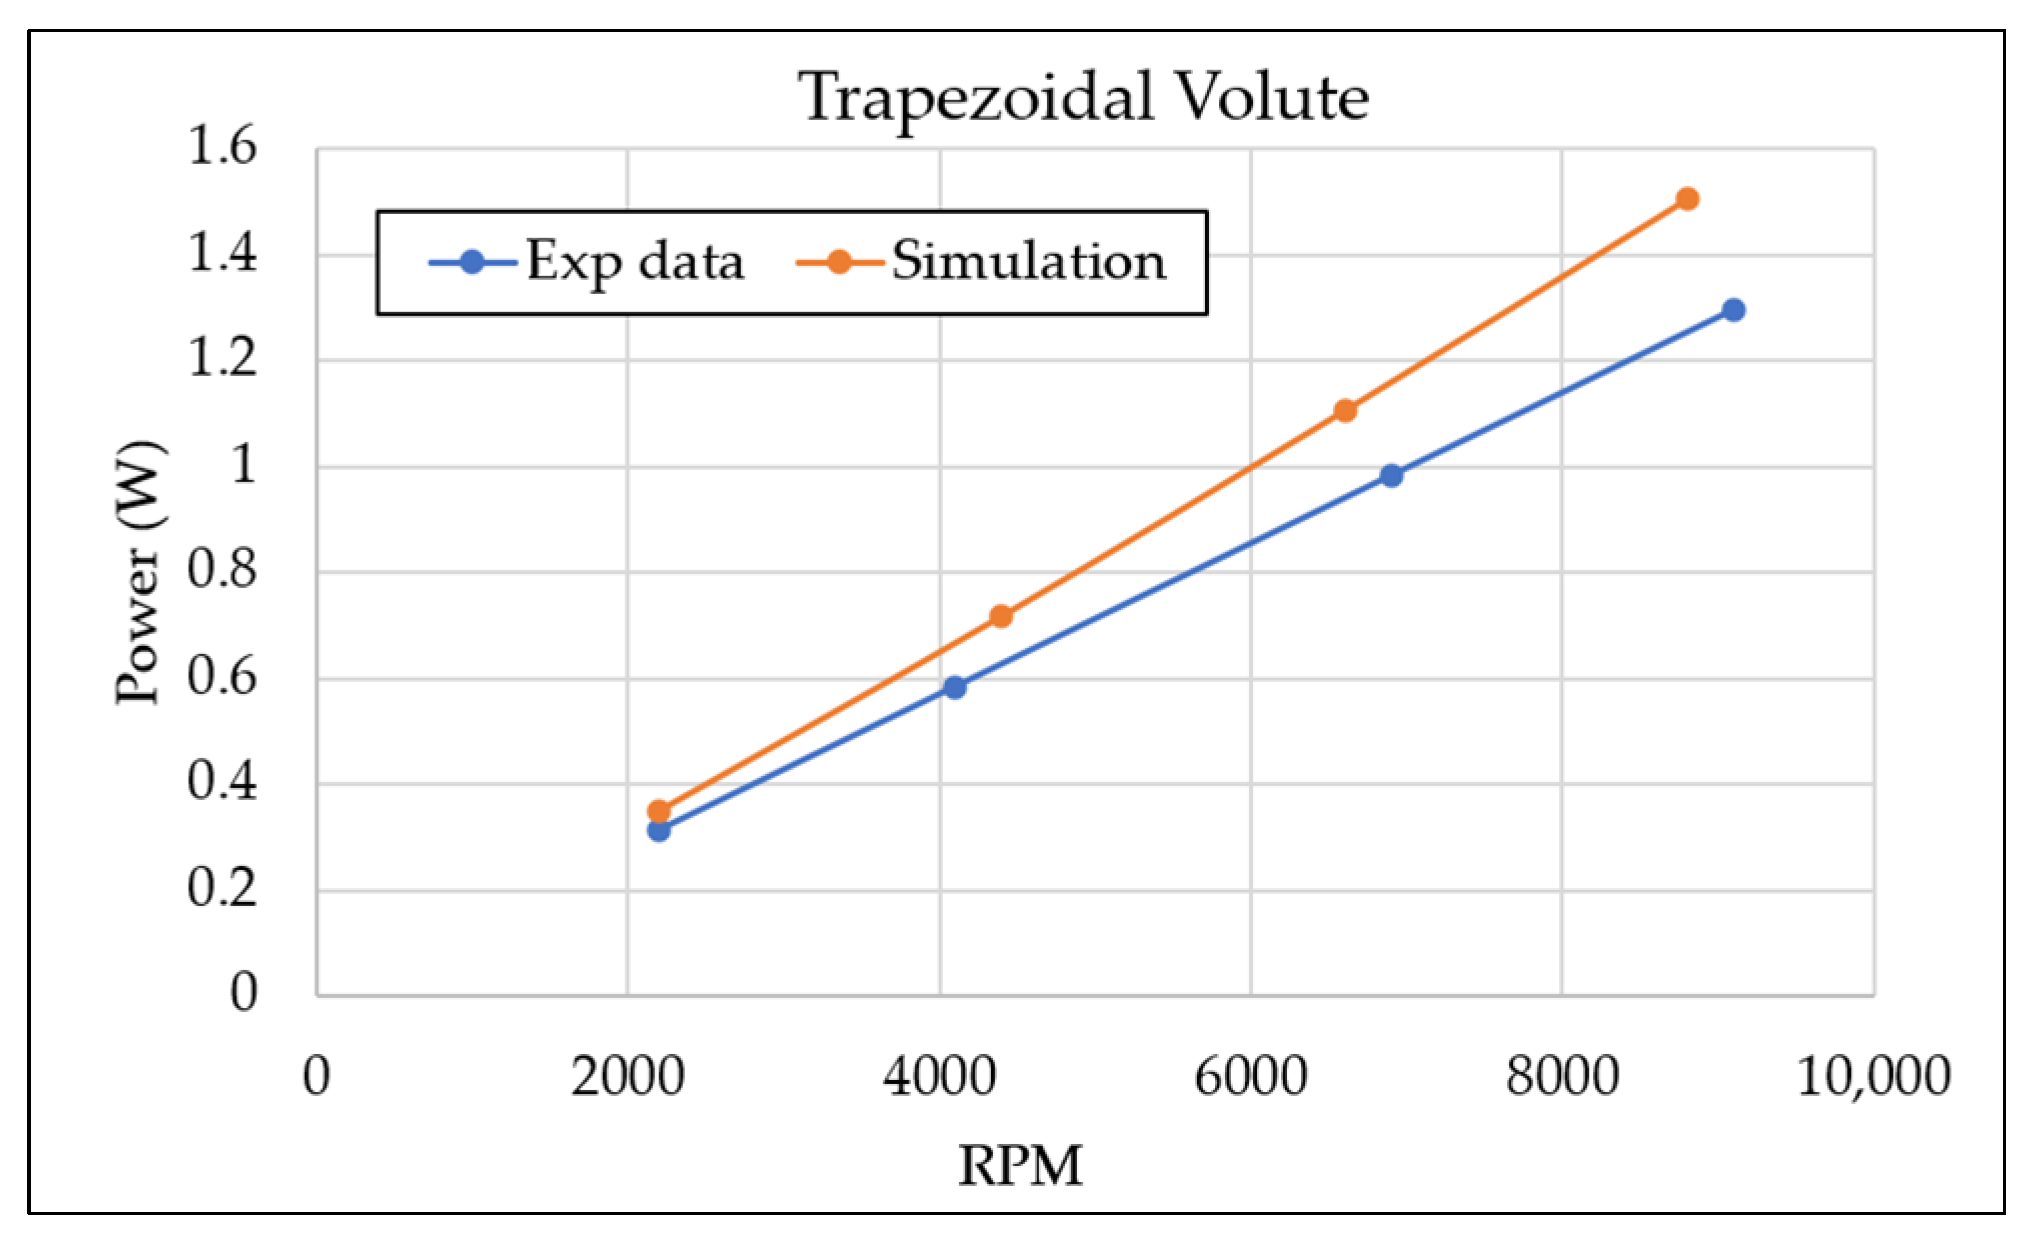
The results from the CFD simulations are compared side-by-side with the experimental values recorded here and plotted together for comparison for all three volute shapes in Table 9, Table 10 and Table 11 and Figure 14, Figure 15 and Figure 16:
Table 9.
Experimental vs. CFD power for the round–asymmetric volute at matching rotational speeds.
Table 10.
Experimental vs. CFD power for the rectangular volute at matching rotational speeds.
Table 11.
Experimental vs. CFD power for the trapezoidal volute at matching rotational speeds.
Figure 14.
Experimental and CFD power vs. RPM curves for the round–asymmetric volute.
Figure 15.
Experimental and CFD power vs. rotational speed curves for the rectangular volute.
Figure 16.
Experimental and CFD power vs. rotational speed curves for the trapezoidal volute.
From the above Figure 14, Figure 15 and Figure 16, it can be deduced at each dataset that is close to linear from 2 to 11 k rpm, a straight line can be fitted as:
where is the shaft power, is the rpm, is a small intercept, and is the slope that is physically the power gain per rpm. The linear lines of best fit for each dataset are shown below:
Based on Table 12, it can be observed that for the round–asymmetric volute, experiment and CFD slopes are very close (0.1466 vs. 0.1571 W/krpm; ≈−7% in experiment relative to CFD). This supports the CFD momentum-only model for this scroll at low speed. For the rectangular volute, slopes essentially match (0.1476 vs. 0.1443 W/krpm; ≈+2% in experiment). The rectangular scroll therefore validates well in the absolute trend, despite its lower power level than round–asymmetric. In the trapezoidal volute, CFD’s slope is higher than experiment (0.1747 vs. 0.1424 W/krpm; ≈+23% in CFD). This indicates extra real losses (tip-gap, leakage, surface finish, and small assembly leaks) that are not in the aero-only model and affect this shape more strongly. This is consistent with the CFD flow pictures showing stronger secondary motion for the trapezoid.
Table 12.
Linear power to rotational speed fits for experimental and CFD data across volute geometries.
Cross-Geometry Trends
Across geometries, the ordering is preserved: both the bench data and the simulations identify the round–asymmetric scroll as the best performer in this rpm band. When we compare fitted power–speed slopes (a proxy for effective torque), the experimental slopes are tightly clustered at about 0.142–0.148 W/krpm, with round–asymmetric and rectangular slightly ahead of trapezoidal. In contrast, the CFD fits give the trapezoidal the highest slope, while the bench shows it as the lowest. That divergence points to losses that the aero-only model does not include and that affect the trapezoidal shape more strongly: tip-gap leakage, small assembly leaks, roughness, and tongue-region dissipation. For design, this means the round–asymmetric scroll offers the best combination of validated low-speed torque gain and clean flow attachment at 50–100 k rpm; the rectangular option is consistently lower but predictable; and the trapezoidal option underperforms in practice unless tip-gap and surface finish can be held to tighter tolerances.
A second consistent pattern is that the simulation curves sit above the experimental curves for most paired points and in the linear fits. This bias is expected: the CFD model represents an idealized flow path (perfect sealing, smooth walls at target roughness, no generator load path, no bearing/windage losses, perfect alignment), whereas the bench necessarily includes real-world parasitics (finite tip clearance, micro-leaks at joints, surface finish effects, back-EMF and internal resistance in the generator/rectifier, bearing drag, slight misalignments). These effects shift absolute power downward in the experiment without changing the relative ordering across geometries, which is what we need for design choices.
Taken together, the trends support three design conclusions. First, the round–asymmetric scroll offers the best combination of validated low-speed torque gain and the cleanest flow attachment at design speeds. Second, the rectangular scroll performs lower in absolute terms but is predictable: experiment and CFD slopes agree closely, making it a s baseline for controlled sensitivity studies and DOE. Third, the trapezoidal scroll underperforms in practice relative to its CFD promise unless tip-gap and surface finish are tightly controlled and assembly leakage is eliminated; its real-world losses grow faster than the ideal model predicts. These findings motivate a focused DOE around the round–asymmetric geometry for incremental gains, and a risk-reduction DOE for the trapezoidal geometry that explicitly varies tip-gap shims, surface finishing steps, and tongue clearance, using the slope-based metric as the comparison anchor across rpm and test conditions.
4. Conclusions
In order to solve the power-limitation issues of high-altitude UAV propulsion systems, this work effectively demonstrated the design, numerical analysis, and experimental validation of a small radial-inflow turbine. We developed a reliable framework for forecasting the performance of micro-turbomachinery where Reynolds number effects and geometric tolerances are crucial by combining stage-resolved CFD with a specially designed modular test bench.
Three different volute geometries—round–asymmetric, rectangular, and trapezoidal—were compared, and the results provided crucial information for integrating mini-turbochargers:
- The Round–Asymmetric Design’s Aerodynamic Advantage: In both the theoretical and experimental instances, the round–asymmetric volute persistently produced the maximum torque and power output. It is the ideal candidate for the volume-constrained, weight-sensitive architecture of a UAV propulsion system due to its superior performance, which shows reduced internal flow distortion and improved incidence matching with the rotor.
- Geometric Sensitivity and Manufacturing Limitations: The trapezoidal design showed the biggest difference between CFD predictions and experimental results, whereas the rectangular volute closely followed the baseline. This discrepancy reveals a crucial sensitivity to practical manufacturing limitations, particularly tongue dissipation, surface roughness, and tip-gap leakage, which are amplified at the miniature scale needed for drones. The trapezoidal case’s CFD over-prediction provides a cautionary note about intricate cross-sections that could result in high secondary flow losses in real-world applications.
- Validation of the Predictive Model: The numerical study is validated by the strong linear agreement in power-speed trends between the experiment and the isothermal CFD model, despite the test bench limits (2000–11,000 rpm). Idealized flow paths and predicted parasitic losses (bearing friction, windage) are accountable for the deviation between simulation and experiment. This consistency provides a foundation for the CFD model’s application in forecasting performance at the 50,000–100,000 rpm regimes necessary for high-altitude operation.
Implications for UAV Applications: The development of the high-altitude UAV’s propulsion system is directly assisted by this research. We propose a strategy to optimize shaft power recovery from exhaust gases without adding weight to the engine by determining that the round–asymmetric volute is the most reliable design for micro-scale applications. By ensuring that the turbocharger can efficiently sustain manifold pressure at stratospheric altitudes, the validated “turbine-first” design process increases the aircraft’s mission ceiling and endurance.
Future work will concentrate on (i) upgrading the test facility with non-intrusive torque sensing and improved balancing to reach operational speeds (50 k–100 k rpm); (ii) implementing precision-machined hardware to minimize tip-clearance and surface roughness effects; and (iii) integrating the energy equation into the CFD framework to resolve heat transfer effects in order to close the gap between the current validated model and a flight-ready prototype. The above steps will help finalizing a high-efficiency, compact turbocharger capable of redefining the performance limitations of next-generation UAVs.
5. Patents
A Taiwan patent has been applied for and passed the review. The case number in ITRI is P53140035TW, and the title is Twin-Shaft Turbocharger System and Method for Gyroscopic Compensation.
Author Contributions
Conceptualization, V.J.J. and R.M.; methodology, V.J.J., C.-L.W. and R.M.; software, V.J.J. and R.M.; validation, V.J.J., R.M., Y.-H.C. and C.-L.W.; formal analysis, R.M., Y.-H.C. and C.-W.Y.; investigation, V.J.J., R.M. and C.-L.W.; resources, C.-L.W., C.-C.L. and W.-Y.W.; data curation, Y.-H.C., C.-W.Y., C.-C.L. and W.-Y.W.; writing—original draft preparation, R.M. and V.J.J.; writing—review and editing, V.J.J.; supervision, V.J.J. and C.-L.W.; project administration, V.J.J. All authors have read and agreed to the published version of the manuscript.
Funding
This research was funded by Industrial Technology Research Institute, Taiwan.
Data Availability Statement
The original contributions presented in this study are included in the article. Further inquiries can be directed to the corresponding author.
Acknowledgments
The authors would like to thank Mechanical and Mechatronics Systems Research Laboratories for the funding and allowing us to carry out the research.
Conflicts of Interest
The authors declare no conflicts of interest.
References
- Tsach, S.; Yaniv, A.; Avni, H.; Penn, D. High Altitude Long Endurance (HALE) UAV for Intelligence Missions. In Proceedings of the ICAS PROCEEDINGS; AIAA: Reston, VA, USA, 1996; Volume 20, pp. 368–379. [Google Scholar]
- National Research Council; Commission on Engineering and Technical Systems; Aeronautics and Space Engineering Board; National Materials Advisory Board; Aeronautics for Advanced Uninhabited Air Vehicles. Uninhabited Air Vehicles: Enabling Science for Military Systems; National Academies Press: Washington, DC, USA, 2000; ISBN 978-0-309-06983-0. [Google Scholar]
- Bents, D.J.; Mockler, T.; Maldonado, J.; Harp, J.L.; King, J.F.; Schmitz, P.C. Propulsion System for Very High Altitude Subsonic Unmanned Aircraft. SAE Trans. 1998, 107, 100–115. [Google Scholar]
- United States Committee on Extension to the Standard Atmosphere. U.S. Standard Atmosphere, 1976; National Oceanic and Amospheric Administration: Washington, DC, USA, 1976.
- Lim, B.J.; Kang, Y.S.; Kang, S.W. Performance Analysis of a Turbocharged SI Engine System for UAV. KSFM J. Fluid Mach. 2016, 19, 43–49. [Google Scholar] [CrossRef] [Scilit]
- Kang, Y.S.; Lim, B.J.; Cha, B.J. Multi-Stage Turbocharger System Analysis Method for High Altitude UAV Engine. J. Mech. Sci. Technol. 2017, 31, 2803–2811. [Google Scholar] [CrossRef] [Scilit]
- Mansouri, H.; Ommi, F. Performance Prediction of Aircraft Gasoline Turbocharged Engine at High-Altitudes. Appl. Therm. Eng. 2019, 156, 587–596. [Google Scholar] [CrossRef] [Scilit]
- Abhinandan, H.; Dhanraj, A.; Katoch, A.; Singh, R.R. A Comprehensive Review of Advancements in Powering and Charging Systems for Unmanned Aerial Vehicles. arXiv 2025, arXiv:2511.13122. [Google Scholar] [CrossRef] [Scilit]
- Ismail, N.; Mohd Kamal, N.L.; Norhashim, N.; Abdul Hamid, S.; Sahwee, Z.; Ahmad Shah, S. Electric Propulsion and Hybrid Energy Systems for Solar-Powered UAVs: Recent Advances and Challenges. Drones 2025, 9, 846. [Google Scholar] [CrossRef] [Scilit]
- Large, J.; Pesyridis, A. Investigation of Micro Gas Turbine Systems for High Speed Long Loiter Tactical Unmanned Air Systems. Aerospace 2019, 6, 55. [Google Scholar] [CrossRef] [Scilit]
- Rodgers, C. Turbocharging a High Altitude UAV C.I. Engine. In 37th Joint Propulsion Conference and Exhibit; American Institute of Aeronautics and Astronautics: Reston, VA, USA, 2025. [Google Scholar]
- Hosseini, S.V.; Gamil, A.; Soodani, S.; Nikolaidis, T.; Madani, S.H.; Chen, Y.K.; Chizari, M. Design and Manufacturing Challenges of a Microturbine Wheel. In Proceedings of the 15th European Conference on Turbomachinery Fluid dynamics & Thermodynamics, Budapest, Hungary, 24–28 April 2023. [Google Scholar]
- Lissaman, P.B.S. Low-Reynolds-Number Airfoils. Annu. Rev. Fluid Mech. 1983, 15, 223–239. [Google Scholar] [CrossRef] [Scilit]
- Kim, T.-G.; Jung, Y.-J.; Jung, Y.; Choi, M. Effects of Low Reynolds Numbers on Performance of a One-Stage Axial Compressor. Trans. Jpn. Soc. Aeronaut. Space Sci. 2015, 58, 280–288. [Google Scholar] [CrossRef] [Scilit]
- Sun, Q.; Gong, Y.; Li, Q. Effect of Tip Clearance Flow on the Evaluation of Slip Factor for Micro Impellers. In Proceedings of the Turbo Expo: Power for Land, Sea, and Air; American Society of Mechanical Engineers: New York, NY, USA, 2012; Volume 44717, pp. 663–669. [Google Scholar]
- Sebastián, A.; Abbas, R.; Valdés, M. Effect of Pressurization on Tip Leakage Losses in Micro-Scale Centrifugal Compressors. In Proceedings of the 14th European Conference on Turbomachinery Fluid Dynamics & Thermodynamics, Gdansk, Poland, 12–16 April 2016; European Turbomachinery Society: Florence, Italy, 2021. [Google Scholar]
- D’souza, R.; Sharma, R.N. An Experimental Study of an Ultra-Micro Scale Gas “Turbine”. Appl. Therm. Eng. 2019, 163, 114349. [Google Scholar] [CrossRef] [Scilit]
- Frigioescu, T.-F.; Badea, G.P.; Dombrovschi, M.; Condruz, M.R.; Crunțeanu, D.-E.; Cican, G. The Design and Development of a UAV’s Micro-Turbogenerator System and the Associated Control Testing Bench. Electronics 2023, 12, 4904. [Google Scholar] [CrossRef] [Scilit]
- Weerakoon, A.H.S.; Assadi, M. Micro Gas Turbines in the Global Energy Landscape: Bridging the Techno-Economic Gap with Comparative and Adaptive Insights from Internal Combustion Engines and Renewable Energy Sources. Energies 2024, 17, 5457. [Google Scholar] [CrossRef] [Scilit]
- Fu, L.; Feng, Z.; Li, G. Experimental Investigation on Overall Performance of a Millimeter-Scale Radial Turbine for Micro Gas Turbine. Energy 2017, 134, 1–9. [Google Scholar] [CrossRef] [Scilit]
- Kupka, D.; Koloničný, J. Design and Experimental Investigation of a Micro-Scale Bladeless-Type Steam Turbine. Appl. Therm. Eng. 2024, 239, 122119. [Google Scholar] [CrossRef] [Scilit]
- Whitfield, A.; Baines, N.C. Design of Radial Turbomachines; A Pearson Education Print on Demand Edition; Longman Scientific & Technical: Harlow, UK, 1990; ISBN 978-0-470-21667-5. [Google Scholar]
- Aungier, R.H. Turbine Aerodynamics: Axial-Flow and Radial-Flow Turbine Design and Analysis; ASME Press: New York, NY, USA, 2006; ISBN 0-7918-0241-8. [Google Scholar]
- Balje, O.E.; Japikse, D. Turbomachines—A Guide to Design Selection and Theory. J. Fluids Eng. 1981, 103, 644. [Google Scholar] [CrossRef] [Scilit]
- Dixon, S.L.; Hall, C.A. Chapter 8―Radial Flow Gas Turbines. In Fluid Mechanics and Thermodynamics of Turbomachinery, 6th ed.; Dixon, S.L., Hall, C.A., Eds.; Butterworth-Heinemann: Boston, MA, USA, 2010; pp. 265–302. ISBN 978-1-85617-793-1. [Google Scholar]
- Dambach, R.; Hodson, H.P. Tip Leakage Flow in a Radial Inflow Turbine with Varying Gap Height. J. Propuls. Power 2001, 17, 644–650. [Google Scholar] [CrossRef] [Scilit]
- Denton, J.D. Loss Mechanisms in Turbomachines. In Proceedings of the GT1993; Volume 2: Combustion and Fuels; Oil and Gas Applications; Cycle Innovations; Heat Transfer; Electric Power; Industrial and Cogeneration; Ceramics; Structures and Dynamics; Controls, Diagnostics and Instrumentation; IGTI Scholar Award; ASME: New York, NY, USA, 1993; Available online: https://cir.nii.ac.jp/crid/1362544420845917312#citations_container (accessed on 10 December 2025).
- Galindo, J.; Fajardo, P.; Navarro, R.; García-Cuevas, L.M. Characterization of a Radial Turbocharger Turbine in Pulsating Flow by Means of CFD and Its Application to Engine Modeling. Appl. Energy 2013, 103, 116–127. [Google Scholar] [CrossRef] [Scilit]
- Payri González, F.; Serrano Cruz, J.R.; Fajardo, P.; Reyes Belmonte, M.Á.; Gozalbo Belles, R. A physically based methodology to extrapolate performance maps of radial turbines. Energy Convers. Manag. 2012, 55, 149–163. [Google Scholar] [CrossRef] [Scilit]
- Danieli, P.; Masi, M.; Lazzaretto, A.; Carraro, G. An Engineering Approach for the Fast Simulation of Radial Inflow Turbines with Vaneless Spiral Casing by Single-Channel CFD Models. E3S Web Conf. 2021, 312, 11003. [Google Scholar] [CrossRef] [Scilit]
- Menter, F.R. Two-Equation Eddy-Viscosity Turbulence Models for Engineering Applications. AIAA J. 1994, 32, 1598–1605. [Google Scholar] [CrossRef] [Scilit]
- Spalart, P.; Allmaras, S. A One-Equation Turbulence Model for Aerodynamic Flows. In 30th Aerospace Sciences Meeting and Exhibit; Aerospace Sciences Meetings; American Institute of Aeronautics and Astronautics: Reston, VA, USA, 1992. [Google Scholar]
- Langtry, R.B.; Menter, F.R. Correlation-Based Transition Modeling for Unstructured Parallelized Computational Fluid Dynamics Codes. AIAA J. 2009, 47, 2894–2906. [Google Scholar] [CrossRef] [Scilit]
- Zangeneh, M. A Compressible Three-Dimensional Design Method for Radial and Mixed Flow Turbomachinery Blades. Int. J. Numer. Methods Fluids 1991, 13, 599–624. [Google Scholar] [CrossRef] [Scilit]
- Celik, I.; Ghia, U.; Roache, P.J.; Freitas, C.; Coloman, H.; Raad, P. Procedure of Estimation and Reporting of Uncertainty Due to Discretization in CFD Applications. J. Fluids Eng. 2008, 130, 078001. [Google Scholar] [CrossRef] [Scilit]
- Roache, P.J. Verification and Validation in Computational Science and Engineering; Hermosa Publishers: Socorro, NM, USA, 1998; ISBN 978-0-913478-08-0. [Google Scholar]
- Standard for Verification and Validation in Computational Fluid Dynamics and Heat Transfer―ASME. Available online: https://www.asme.org/codes-standards/find-codes-standards/standard-for-verification-and-validation-in-computational-fluid-dynamics-and-heat-transfer (accessed on 21 October 2025).
- JCGM 100: Evaluation of Measurement Data―Guide to the Expression of Uncertainty in Measurement. Available online: https://www.sci.utah.edu/~kpotter/Library/Papers/jcgm:2008:EMDG/index.html (accessed on 21 October 2025).
- Szymko, S.; McGlashan, N.R.; Martinez-Botas, R.; Pullen, K.R. The Development of a Dynamometer for Torque Measurement of Automotive Turbocharger Turbines. Proc. Inst. Mech. Eng. Part D J. Automob. Eng. 2007, 221, 225–239. [Google Scholar] [CrossRef] [Scilit]
- Szymko, S. The Development of an Eddy Current Dynamometer for Evaluation of Steady and Pulsating Turbocharger Turbine Performance; University of London: London, UK, 2006. [Google Scholar]
- Lüddecke, B.; Filsinger, D.; Ehrhard, J.; Steinacher, B.; Seene, C.; Bargende, M. Contactless Shaft Torque Detection for Wide Range Performance Measurement of Exhaust Gas Turbocharger Turbines. J. Turbomach. 2013, 136, 061022. [Google Scholar] [CrossRef] [Scilit]
- Ross, P.J. Taguchi Techniques for Quality Engineering: Loss Function, Orthogonal Experiments, Parameter and Tolerance Design; McGraw-Hill: New York, NY, USA, 1996; ISBN 978-0-07-053958-7. [Google Scholar]
- Taguchi, G. Introduction to Quality Engineering: Designing Quality Into Products and Processes; Asian Productivity Organization: Tokyo, Japan, 1986; ISBN 978-92-833-1083-9. [Google Scholar]
- Park, S.H.; Kim, J.J. Quality Engineering Using Robust Design and Analysis. In Proceedings of the Industrial Statistics; Kitsos, C.P., Edler, L., Eds.; Physica-Verlag HD: Heidelberg, Germany, 1997; pp. 3–15. [Google Scholar]
- Roy, R.K. A Primer on the Taguchi Method; Society of Manufacturing Engineers: Schaumburg, IL, USA, 1990; ISBN 978-0-87263-468-8. [Google Scholar]
- Antony, J. 2―Fundamentals of Design of Experiments. In Design of Experiments for Engineers and Scientists (Second Edition); Antony, J., Ed.; Elsevier: Oxford, UK, 2014; pp. 7–17. ISBN 978-0-08-099417-8. [Google Scholar]
- Montgomery, D.; St, C. Design and Analysis of Experiments, 9th ed.; John Wiley & Sons: Hoboken, NJ, USA, 2022; ISBN 9781119113478. [Google Scholar]
- Box, G.E.P.; Hunter, J.S.; Hunter, W.G. Statistics for Experimenters: Design, Innovation, and Discovery; John Wiley & Sons: Hoboken, NJ, USA, 2005; ISBN 978-0-471-71813-0. [Google Scholar]
- Li, M.; Li, Y.; Jiang, F.; Hu, J. An Optimization of a Turbocharger Blade Based on Fluid–Structure Interaction. Processes 2022, 10, 1569. [Google Scholar] [CrossRef] [Scilit]
- Naik, P.; Lehmayr, B.; Homeier, S.; Klaus, M.; Vogt, D.M. Influence of Turbocharger Turbine Blade Geometry on Vibratory Blade Stresses. J. Eng. Gas Turbines Power 2018, 141, 021015. [Google Scholar] [CrossRef] [Scilit]
- Lampart, P.; Witanowski, Ł.; Klonowicz, P. Efficiency Optimisation of Blade Shape in Steam and ORC Turbines. Mech. Mech. Eng. 2018, 22, 553–564. [Google Scholar] [CrossRef] [Scilit]
- Gao, J.; Huo, D.; Wang, G.; Ma, G. Advances in Axial Turbine Blade Profile Aerodynamics. Proc. Inst. Mech. Eng. Part C J. Mech. Eng. Sci. 2021, 235, 652–669. [Google Scholar] [CrossRef] [Scilit]
- Jiang, S.; Li, Z.; Li, J. Effects of the Squealer Winglet Structures on the Heat Transfer Characteristics and Aerodynamic Performance of Turbine Blade Tip. Int. J. Heat Mass Transf. 2019, 139, 860–872. [Google Scholar] [CrossRef] [Scilit]
- Mortazavi, F. CFD-Based Impeller and Seal Rotordynamic Forces. Ph.D. Thesis, Texas A&M University, College Station, TX, USA, 2018. [Google Scholar]
- Hendershot, J.R., Jr.; Miller, T. Design of Brushless Permanent-Magnet Motors; Oxford University Press: Oxford, UK, 1995; ISBN 978-0-19-859389-8. [Google Scholar]
- Krishnan, R. Permanent Magnet Synchronous and Brushless DC Motor Drives; CRC Press: Boca Raton, FL, USA, 2017; ISBN 978-1-315-22148-9. [Google Scholar]

Disclaimer/Publisher’s Note: The statements, opinions and data contained in all publications are solely those of the individual author(s) and contributor(s) and not of MDPI and/or the editor(s). MDPI and/or the editor(s) disclaim responsibility for any injury to people or property resulting from any ideas, methods, instructions or products referred to in the content. |
© 2026 by the authors. Licensee MDPI, Basel, Switzerland. This article is an open access article distributed under the terms and conditions of the Creative Commons Attribution (CC BY) license.