Article

Multidisciplinary Design Optimization for the Conceptual Design of Supersonic Civil Aircraft Based on Full-Carpet Sonic Boom/Aerodynamic Characteristics Employing Differential Evolution

1
School of Aerospace Engineering, Tsinghua University, Beijing 100084, China
2
Department of Power Mechanical Engineering, National Tsing Hua University, Hsinchu 300044, China
*
Author to whom correspondence should be addressed.
Aerospace 2026, 13(1), 96; https://doi.org/10.3390/aerospace13010096
Submission received: 18 December 2025 / Revised: 11 January 2026 / Accepted: 12 January 2026 / Published: 15 January 2026
(This article belongs to the Special Issue Aircraft Conceptual Design: Tools, Processes and Examples)

Abstract

Reducing the sonic boom intensity and increasing the cruise lift-to-drag ratio are pivotal technologies for the successful development of supersonic civil aircraft. To address the limitation that sonic boom research primarily focuses on characteristics directly beneath the flight track, a full-carpet sonic boom and aerodynamic characteristics prediction software (AERO-BOOM) was independently developed. This software is based on the Panel Method, Modified Linearized Theory, the Waveform Parameter Method, and the Stevens Perceived Noise Evaluation Method. AERO-BOOM can efficiently assess the lift-to-drag ratio and the full-carpet sonic boom characteristics of supersonic civil aircraft. Building upon this software, a Multidisciplinary Optimization design platform for full-carpet sonic boom and aerodynamic characteristics of supersonic civil aircraft was established, utilizing an in-house hybrid surrogate-aided differential evolution optimization algorithm. For a supersonic civil aircraft, both fuselage optimization and overall aircraft optimization were conducted. The optimization objectives were the lift-to-drag ratio and the full-carpet sonic boom loudness (FBL). The optimization results demonstrate that fuselage optimization (e.g., employing a downward-cambered nose) increased the lift-to-drag ratio by 0.26 and reduced the FBL by 0.62 PLdB. Furthermore, the overall aircraft optimization (involving modifications to the wing planform and increasing the tail sweep angle) yielded a 1.51 increase in the lift-to-drag ratio and a 1.09 PLdB reduction in the FBL.

1. Introduction

The pursuit of high-speed and cost-effective transportation has long been a fundamental objective in aviation. Driven by global economic integration, the demand for long-range passenger transportation continues to grow. Consequently, supersonic civil aircraft represents a vital direction and an essential trend [1]. The primary barriers to the practical implementation of supersonic civil aircraft are excessive sonic boom loudness and low cruise economy (or poor cruise efficiency) [2,3].
Sonic boom is an acoustic phenomenon unique to supersonic aircraft. The shock and expansion wave system surrounding a supersonic aircraft propagates toward the ground. Due to nonlinear interactions, these waves interact and coalesce, ultimately forming two strong shock waves at ground level [4]. Because of the unacceptable disturbance posed by a sonic boom [5], current supersonic civil aircraft are restricted to flying subsonically over land [6,7,8]. This significantly affects the efficiency and economy of supersonic civil aircraft operations. The low cruise economy is primarily attributed to wave drag. While the primary sources of drag for high-subsonic civil aircraft are induced drag and friction drag, resulting in low overall drag and a high lift-to-drag ratio, supersonic civil aircraft experience significant additional wave drag during cruise. This wave drag greatly reduces the cruise lift-to-drag ratio and substantially lowers fuel efficiency (or fuel economy). Historically, the Concorde and the Tu-144 were the only two supersonic passenger aircraft to enter commercial service. Although they achieved technological milestones, they ultimately failed to achieve long-term profitability owing to the aforementioned challenges, leading to their withdrawal from the market.
Past setbacks have not deterred global interest in the development of supersonic civil aircraft. Since the 1960s, leading aviation nations, including the United States, Europe, Russia, and Japan, have initiated numerous development programs and introduced a range of configuration concepts [2]. Notably, NASA’s “N+3” generation supersonic civil aircraft development program, launched in 2010, established stringent performance targets [9] for different types of supersonic civil aircraft, including sonic boom intensity and cruise efficiency.
Sonic boom prediction methods are generally categorized into two components: the near-field overpressure distribution and the ground sonic boom signature. Classical theoretical approaches, such as the Modified Linearized Theory by Whitham [10] and Walkden [11], and the simplified method by Carlson [12], offered the capability to predict characteristics from the near-field to the ground. Thomas’ Waveform Parameter Method (WPM) [13] was developed to simulate the signal propagation process to the ground. Modern high-fidelity methods, however, exhibit a distinct division of tasks: near-field prediction predominantly utilize Computational Fluid Dynamics (CFD) methods [14,15,16,17,18,19,20,21,22,23] to obtain highly reliable overpressure signals. Ground signature prediction leverages methods derived from the Generalized Burgers equation [24] to accurately capture atmospheric dissipation and dispersion effects.
Aerodynamic characteristics prediction primarily relies on the Panel Method and CFD methods. The Panel Method (such as Newton’s method, the ACM method, etc. [25,26,27,28]) features high computational efficiency and is suitable for conceptual design and external shape optimization. CFD methods obtain high-fidelity results by solving the Navier–Stokes equations but entail significant computational costs, rendering them more appropriate for the detailed design stage.
Reducing sonic boom intensity while enhancing the lift-to-drag ratio remains a formidable challenge in the development of next-generation supersonic civil aircraft, necessitating urgent resolution. Darden [29] noted that in supersonic aircraft design, optimizing for a single characteristic often leads to degradation of another. Therefore, sonic boom and aerodynamic characteristics must be synergistically balanced through Multidisciplinary Optimization (MDO) [3]. Researchers have conducted considerable research effort in the field of sonic boom and aerodynamic MDO design. According to different low-boom design approaches, optimization design methods are broadly classified into two categories [2].
The first category comprises the inverse design method based on the Jones–Seebass–George–Darden (JSGD) theory for sonic boom minimization. Feng et al. [30] used the WPM to predict sonic boom characteristics and the Supersonic Area Rule to evaluate drag characteristics, thereby establishing an optimization framework based on the JSGD inverse design method and a Multi-Objective Genetic Algorithm (MOGA). Li et al. [2] implemented a hybrid-fidelity approach integrating multiple techniques to predict sonic boom characteristics and developed an optimization tool based on multiple inverse design methods, including the JSGD method. Furthermore, CFD results indicated that the optimized configuration achieved higher cruise efficiency. Yang et al. [31] proposed an MDO method for the conceptual design of supersonic civil aircraft that incorporates low-boom design principles. By determining the target inverse equivalent area, they performed MDO and fuselage shape modification, ultimately obtaining a supersonic civil aircraft conceptual configuration with low weight and low-sonic-boom intensity.
The second category involves a forward design method based on external shape parameterization and optimization. Shan et al. [3] used the SU2 solver to solve the three-dimensional Euler equations to evaluate near-field overpressure distribution and aerodynamic performance, while employing the Burgers equation to evaluate the ground sonic boom signature. They established an efficient global constrained MDO framework based on the Constrained Expected Hypervolume Improvement Matrix criterion. Liu et al. [32] conducted numerical simulations using the Reynolds-Averaged Navier–Stokes (RANS) equations to determine near-field overpressure distribution and aerodynamic performance, they subsequently utilized the WPM for ground signature evaluation, developing a high-fidelity gradient-based optimization approach leveraging the Discrete Adjoint Method. Liu et al. [33] solved the Euler equations on a Cartesian mesh to obtain near-field overpressure distribution and solved the Burgers equation to obtain the ground sonic boom signature, developing the coupled flow-field and sonic boom adjoint optimization design software AMDEsign. Chan [34] used the three-dimensional Panel Method A502 to determine near-field overpressure distribution and aerodynamic performance and applied Whitham’s theory to propagate the near-field signal to the ground. Combined with the MOGA, a rapid optimization method for supersonic aircraft was established.
The studies mentioned above have primarily focused on the sonic boom characteristics directly beneath the flight track (under-track, zero off-track angle ϕ = 0 ° ), leaving the characteristics off the flight track (off-track, nonzero off-track angle ϕ 0 ° ) insufficiently explored. However, the impact of a sonic boom on the ground is regional, encompassing a spatial extent termed the “sonic boom carpet” [4]. Previous research [35] has indicated that optimization targeting only under-track sonic boom intensity may lead to a detrimental increase in off-track intensity. In recent years, with the development of low-boom technology, full-carpet low-boom design methods have emerged as a focal point of research.
Significant progress has been made recently in the study of full-carpet sonic boom characteristics. In 2013, Nayani [36] proposed a grid deformation technique for calculating full-carpet sonic boom characteristics. In 2014, Ordaz et al. [35] formulated an evaluation framework for an aircraft’s full-carpet sonic boom characteristics. In 2015, Ordaz et al. [37] performed weighted optimization of sonic boom characteristics at under-track and at 25° off-track using the Adjoint Gradient Method for Optimization, targeting design variables including the wing and horizontal-tail airfoil shape, rear fuselage contour, and nacelle geometry. In 2019, Kirz [38] performed full-carpet sonic boom and aerodynamic characteristics MDO, employing the JWB standard configuration [39] as the baseline configuration, optimizing airfoil shape and wing planform parameters. In 2024, Chen et al. [40] explored the impact of wing dihedral angle on full-carpet sonic boom characteristics. In 2025, Chen et al. [41] established a full-carpet sonic boom optimization design methodology for low-boom supersonic civil aircraft configurations.
Currently, there is a notable paucity of research concerning the MDO of full-carpet sonic boom and aerodynamic characteristics. The existing literature predominantly emphasizes the fine-tuning of localized geometric features, while optimization studies targeting the holistic configuration parameters of the entire aircraft remain insufficiently addressed.
This study introduces the independently developed the full-carpet sonic boom and aerodynamic characteristics prediction software (AERO-BOOM), which is capable of efficient prediction of both full-carpet sonic boom and aerodynamic characteristics of supersonic civil aircraft. Extensive validation against various benchmark cases confirms that the accuracy of AERO-BOOM meets the requirements of the conceptual design stage for supersonic civil aircraft.
Leveraging these capabilities, this study employs an in-house hybrid surrogate-aided differential evolution (HSADE) optimization algorithm [42], which integrates Response Surface Methodology (RSM), to construct a full-carpet sonic boom and aerodynamic characteristics MDO design platform for supersonic civil aircraft.
Subsequently, fuselage shape optimization and overall aircraft aerodynamic conceptual configuration optimization were carried out, taking key parameters such as wing sweep angle, dihedral angle, twist-angle distribution, and fuselage radius distribution as design variables. The results demonstrate the effectiveness of the proposed optimization framework in achieving a synergistic balance between aerodynamic efficiency and full-carpet sonic boom reduction.

2. Sonic Boom/Aerodynamic Prediction Methods in AERO-BOOM

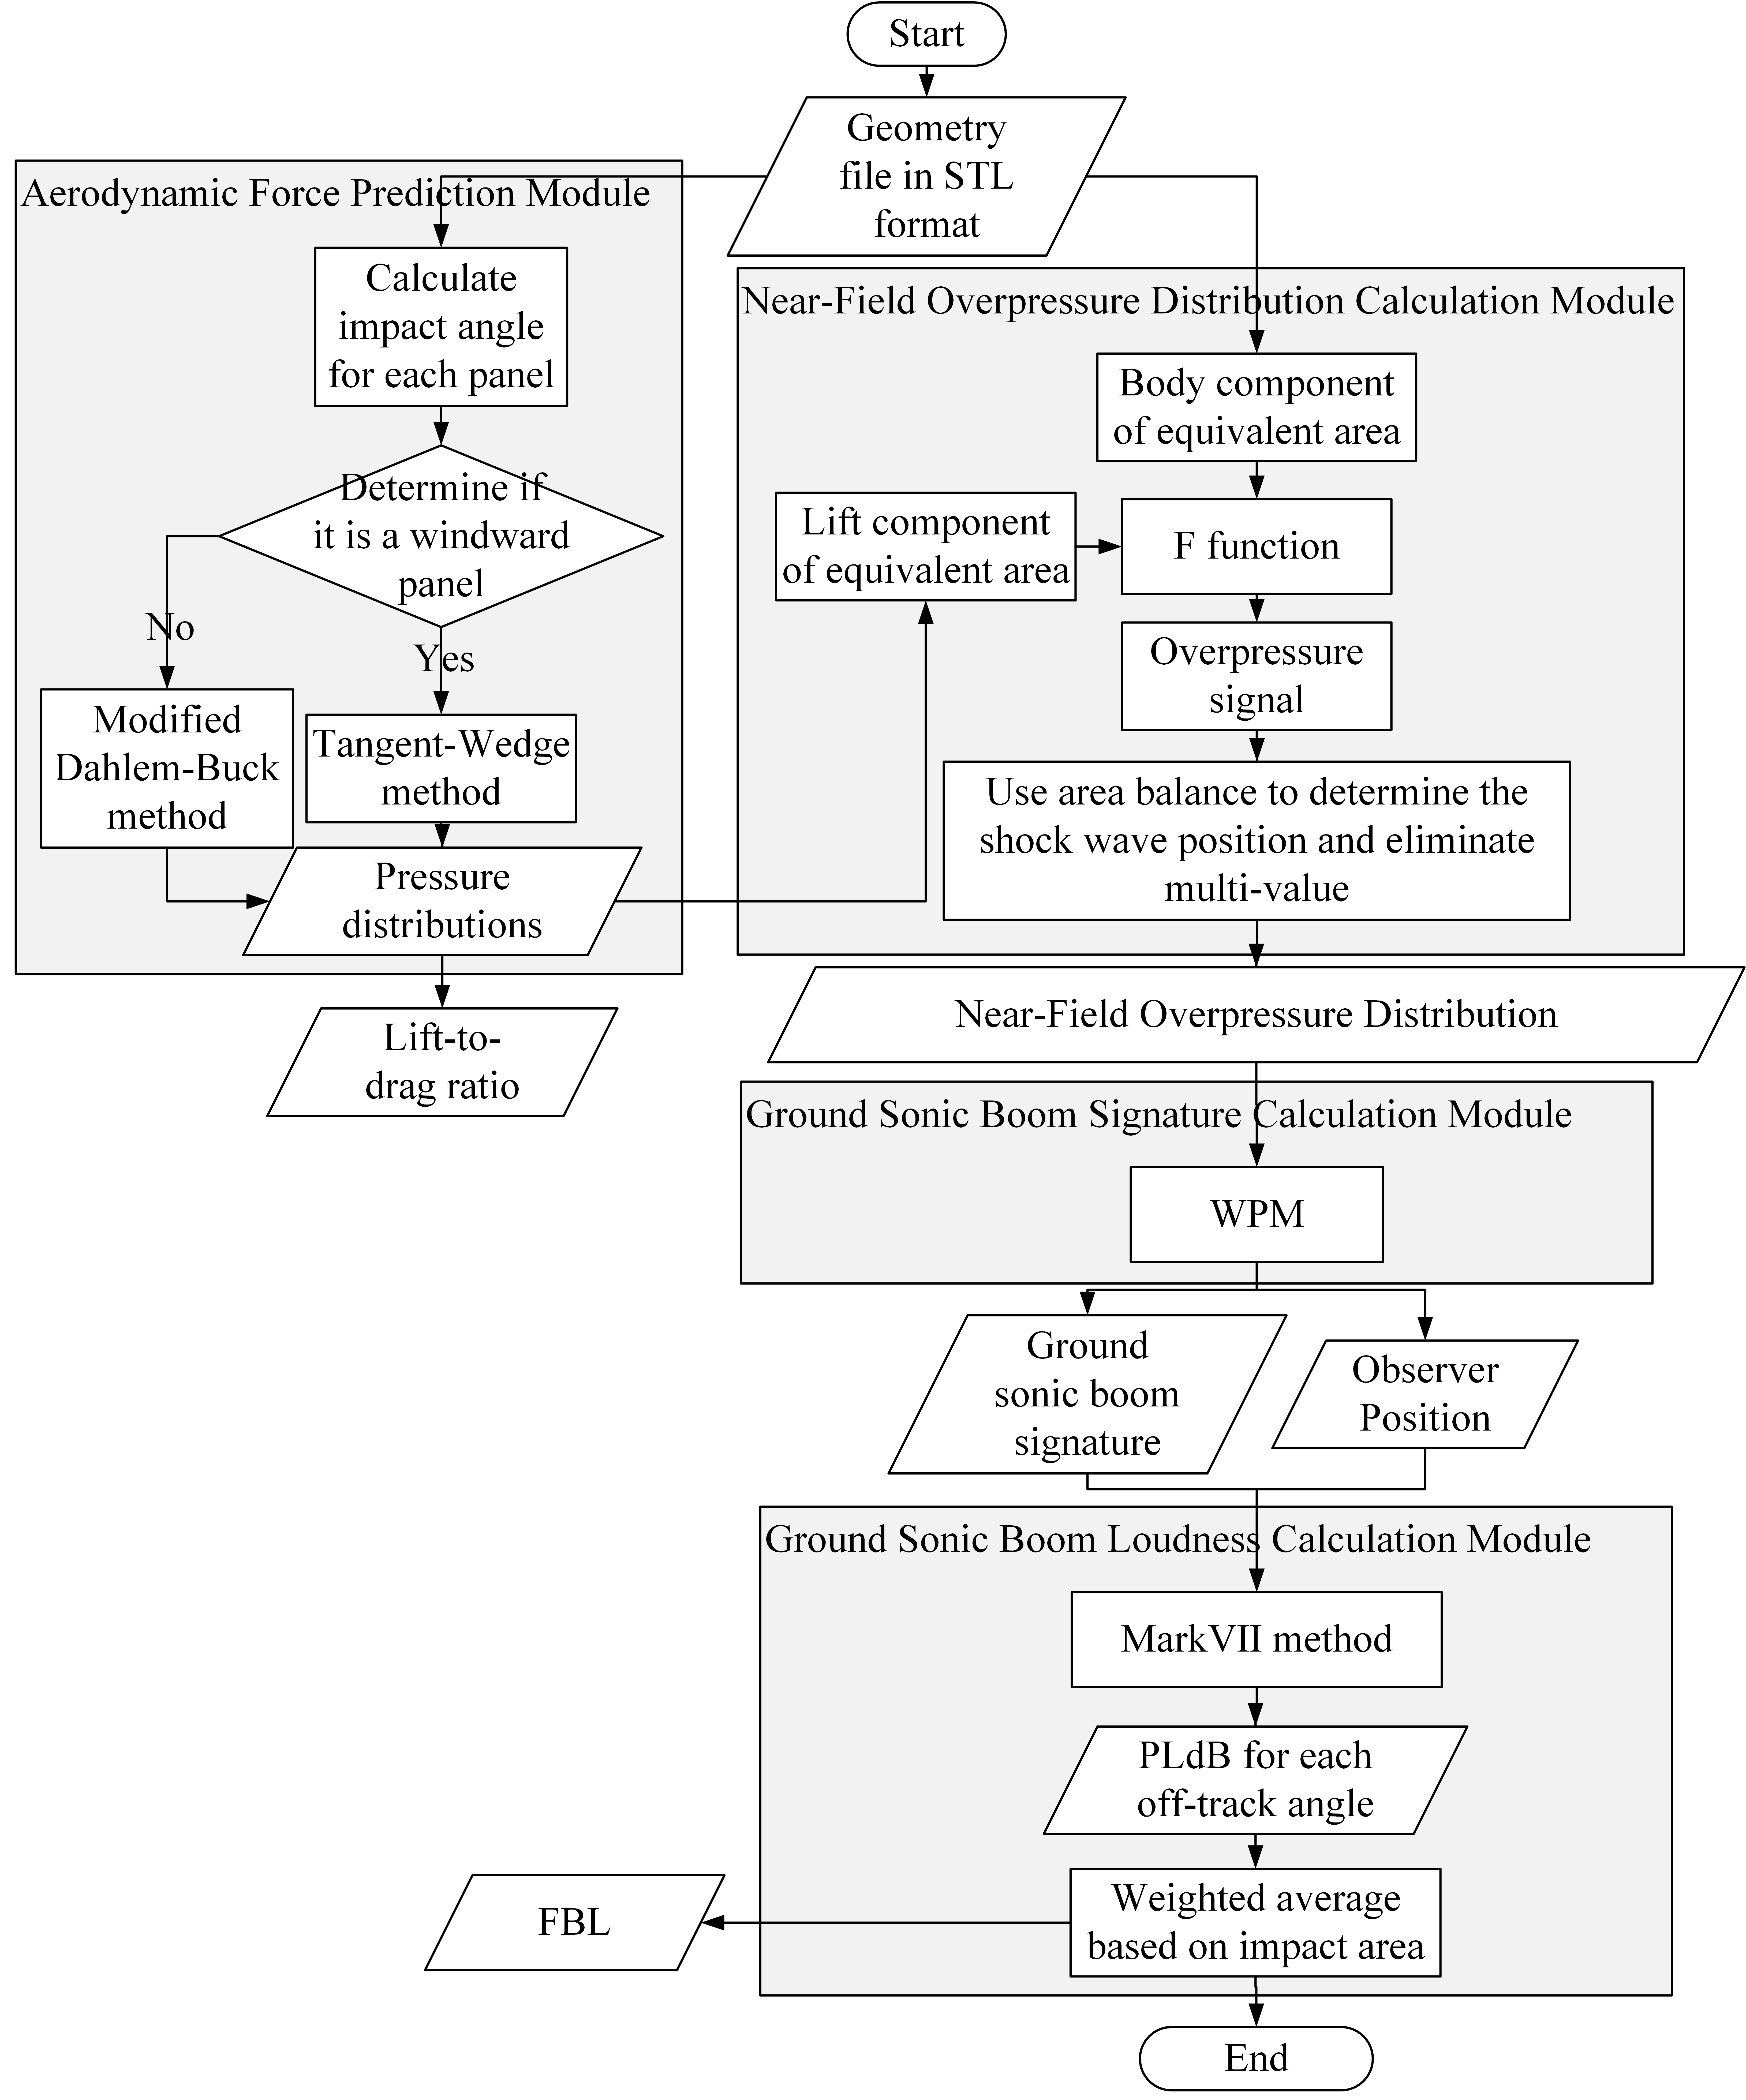
AERO-BOOM comprises four functional modules: aerodynamic force prediction, near-field overpressure distribution calculation, ground sonic boom signature calculation, and ground sonic boom loudness calculation. The aerodynamic force prediction module utilizes the Panel Method, specifically employing the Tangent-Wedge method for the windward side and the modified Dahlem–Buck method for the leeward side to extract pressure distributions, which are subsequently integrated to obtain lift and drag. The near-field overpressure distribution calculation module is based on the Modified Linearized Theory. The ground sonic boom signature calculation module uses the WPM. The ground sonic boom loudness calculation module employs the Mark VII method [43], proposed by Stevens, to quantify the ground sonic boom signature as Perceived Loudness in Decibels (PLdB). The perceived loudness levels at various off-track angles are then subjected to a weighted averaging process to derive the full-carpet sonic boom loudness (FBL).
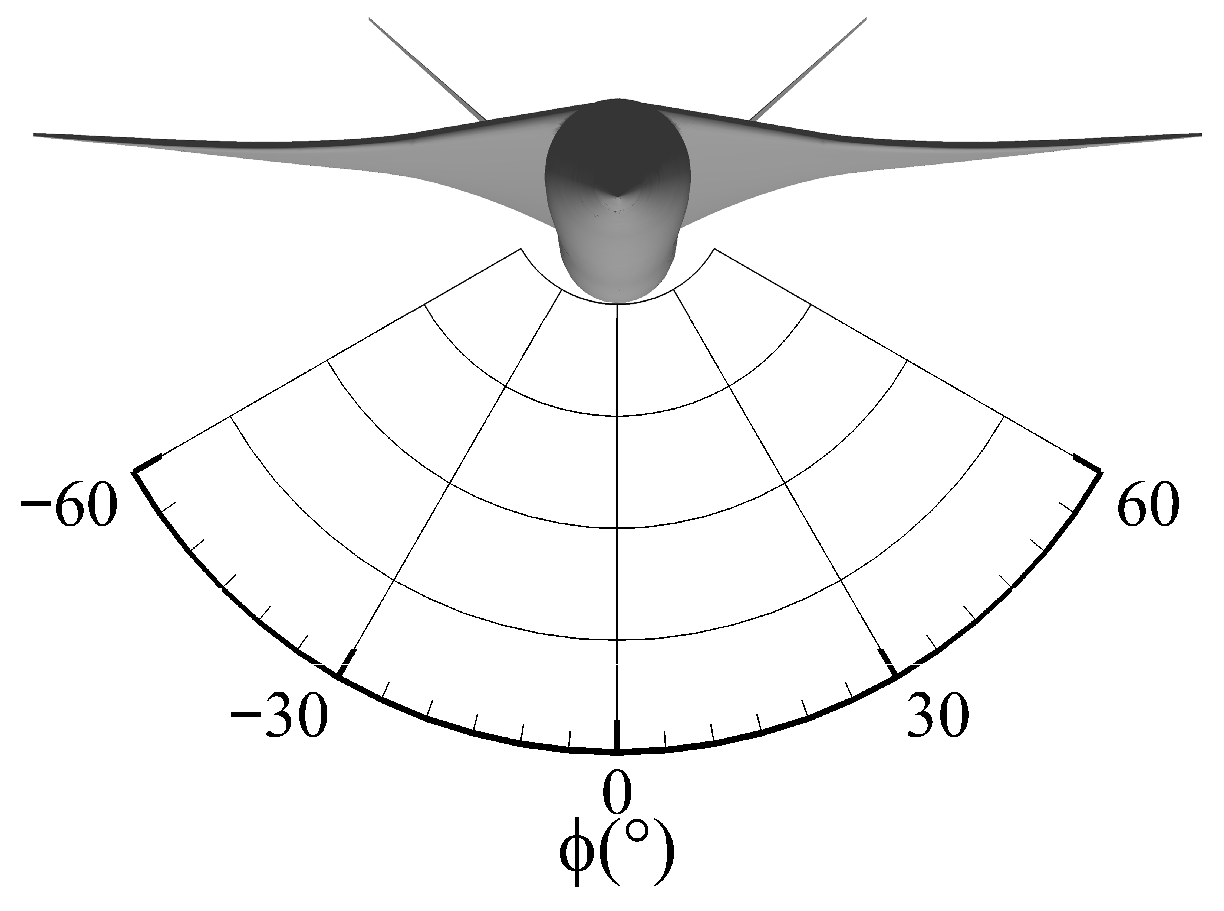
The calculation workflow of AERO-BOOM (v1.0) is depicted in Figure 1. Upon importing the geometry in STL format, the aerodynamic characteristics are initially determined. Subsequently, the near-field and ground sonic boom characteristics are sequentially calculated for all off-track angles (definitions shown in Figure 2), converted into perceived loudness levels, and finally weighted and averaged to obtain the FBL.

2.1. Efficient Aerodynamic Force Prediction Method

The aerodynamic force prediction module of AERO-BOOM utilizes the Panel Method to compute the aircraft surface pressure distributions C p , which are then integrated to obtain lift L and inviscid drag D , thereby determining the lift-to-drag ratio K = L / D . This module provides K and C p as primary outputs. K is directly recorded as one of AERO-BOOM’s results, and C p is fed into the near-field overpressure distribution calculation module to calculate the lift component of equivalent area A L .
The aerodynamic force prediction module uses different surface pressure calculation methods for the windward and leeward sides. By incorporating the selection criteria established by An et al. [26] and considering the cruise condition and geometric characteristics of supersonic civil aircraft, the Tangent-Wedge method is assigned to the windward side while the Dahlem–Buck method is utilized for the leeward side. Zhang et al. [44] evaluated several efficient aerodynamic force prediction approaches, and the results showed that this specific combination offers superior predictive accuracy.
The Tangent-Wedge method assumes that local pressure is determined solely by the surface inclination equivalent to a 2D wedge, offering high efficiency for compression surfaces despite neglecting 3D cross-flow effects [45]. Meanwhile, the Dahlem–Buck method employs a semi-empirical formula to approximate the pressure in expansion regions; however, its accuracy is inherently limited by its reliance on empirical slope-dependent coefficients and the omission of complex viscous-inviscid interactions [46].
For a panel i on the windward side, the pressure coefficient C p i is [26]
C p i = γ + 1 2 θ i 2 1 + 1 + 4 γ + 1 M a θ i 2
For a panel i on the leeward side, C p i is [26,47]
C p i = C p D ( θ i ) a θ i n
where
C p D ( θ ) = 1 sin 3 4 4 θ i + 1 sin 2 θ i θ i 22.5 ° κ sin 2 θ i θ i > 22.5 °
κ = 3.24 0.08867 θ i + 0.002775 θ i 2 4.333 × 10 5 θ i 3 + 2.5 × 10 7 θ i 4
a = 6 0.3 M a + sin ln M a 0.588 π 1.20
n = 1.15 0.5 sin ln M a 0.916 π 3.29
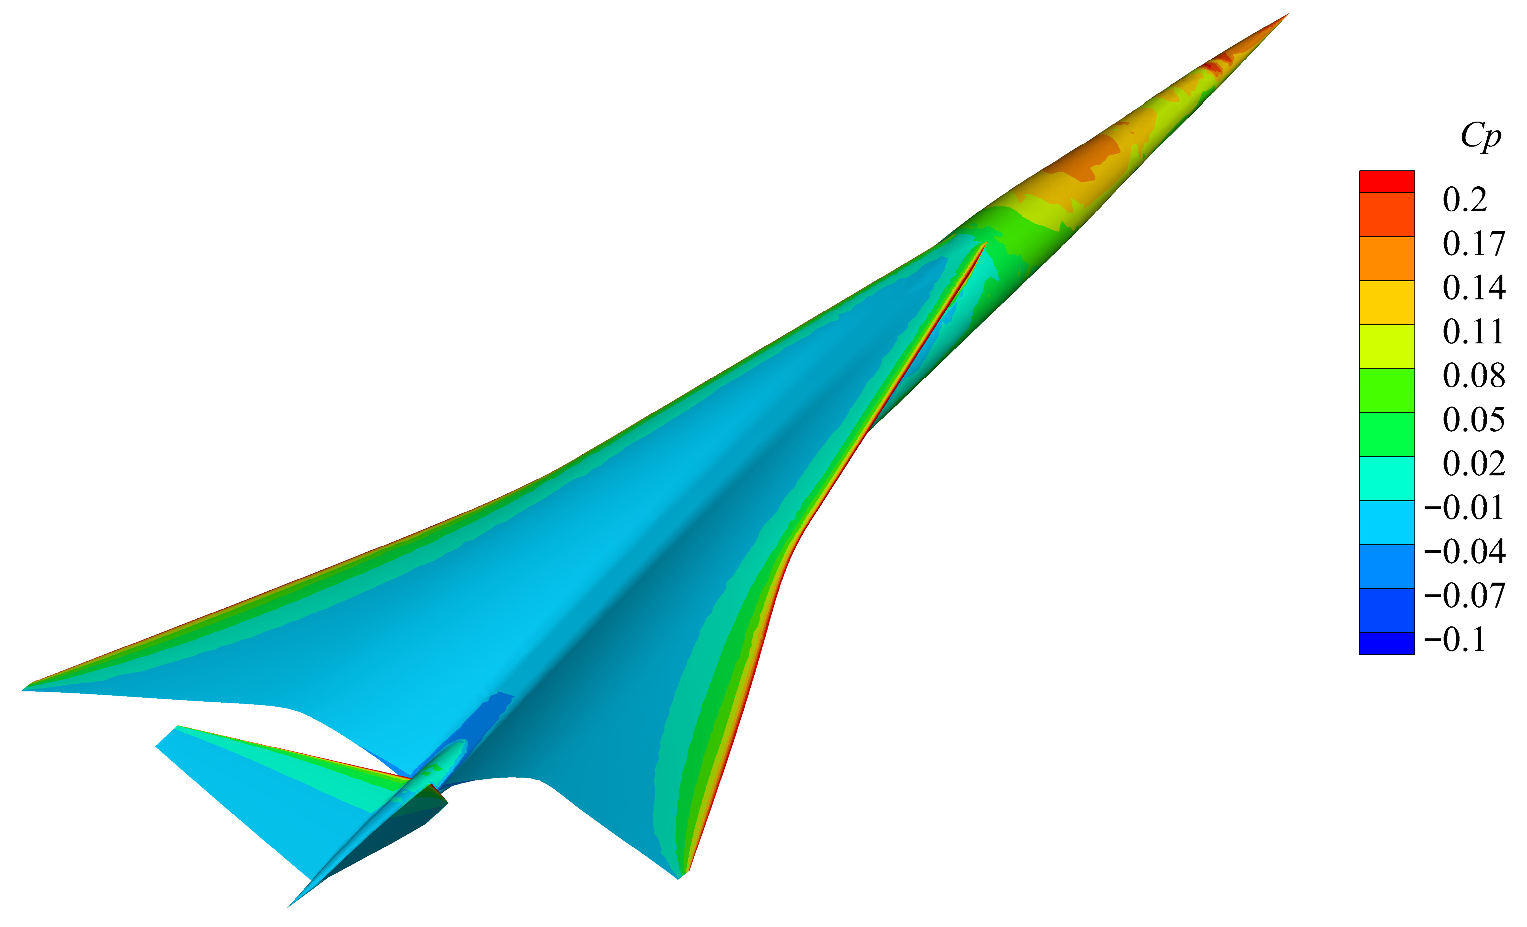
In the above equation, M a is the freestream Mach number and γ is the ratio of specific heats of air. The results of the surface pressure coefficient calculation for a supersonic civil aircraft configuration with a V-tail layout are shown in Figure 3.
The lift and drag characteristics of aircraft are obtained by integrating the surface pressure distributions. The lift L is given by
L = l i = 1 2 ρ V 2 C p i S i N i k
The drag D is given by
D = d i = 1 2 ρ V 2 C p i S i N i i
The lift-to-drag ratio K is
K = L / D
In the equation, l i is the lift generated by panel i , d i is the drag, S i is the area of the panel i , k is the vertical unit vector, and i is the horizontal unit vector.

2.2. Sonic Boom Characteristics Prediction Methods

AERO-BOOM integrates near-field and ground sonic boom prediction methods.
The Modified Linearized Theory is utilized to resolve sonic boom characteristics in the near field. This method employs the hypothesis of corrected characteristics, substituting linear Mach lines with exact characteristics to locate shocks. It assumes physical perturbations propagate along these paths via linearized laws. While effective, it faces geometric constraints, requiring slender, pointed bodies. Furthermore, its mathematical precision is limited to a first-order approximation, meaning the predicted position of the rear shock remains only first-order accurate due to neglected higher-order flow interactions.
A cylindrical coordinate system x , r , ϕ is established with the origin at the origin of the aircraft coordinate system and the aircraft X-axis as the longitudinal axis. r denotes the radial distance from the observation point to the X-axis. For any point P x p , r p , ϕ p in space, the overpressure signal is expressed as [4]
Δ p p = γ M a 2 2 B r p F y , ϕ
In the equation, F y , ϕ is the Whitham F-function corresponding to the characteristic line passing through point P .
The F-function plays a pivotal role in sonic boom prediction and minimization methodologies, as it encapsulates the perturbations induced by the aircraft geometry on the surrounding flow-field. Mathematically, it is proportional to the second derivative of the equivalent area distribution, as demonstrated in Equation (11):
F C , ϕ = 1 2 π 0 x y = C , r = 0 A x , ϕ d x C x
In the equation, A ( x , ϕ ) is the equivalent area in the ϕ direction, which is composed of the body component A V ( x , ϕ ) and the lift component A L ( x ) and is defined in Equation (12):
A ( x , ϕ ) = A V ( x , ϕ ) + A L ( x )
The ground sonic boom signature calculation of AERO-BOOM is performed using the WPM implementation developed by Thomas [13,48]. Built upon the Modified Linearized Theory and Geometric Acoustics theory, this method enables the efficient simulation of far-field sonic boom signals across diverse off-track angles and varying atmospheric conditions.
The ground sonic boom loudness calculation module uses the open-source perceived loudness level calculation program PyLdB [49], which applies the Mark VII method to calculate the ground sonic boom loudness P L d B . After obtaining the loudness corresponding to each off-track angle ϕ , the full-carpet sonic boom loudness F B L is calculated by referencing the weighted averaging method proposed by Chen et al. [40,41].
F B L = y max y max P L d B ( y ) d y 2 y max
In the equation, y is the coordinate of the observation point output by the ground sonic boom signature calculation module, y max is the coordinate of the sonic boom carpet cutoff point, and 2 y max is the sonic boom carpet width.

2.3. Benchmark Model Cases Study Validation

To assess the predictive accuracy of AERO-BOOM, this study simulated the benchmark cases in Table 1. The obtained results were compared against wind-tunnel measurements, CFD numerical data, and results reported by other researchers.

2.3.1. SEEB-ALR

SEEB-ALR, concerning a body of revolution (see Figure 4), is one of the benchmark models released by the First AIAA Sonic Boom Prediction Workshop [17] (SBPW-1). This benchmark model was designed based on JSGD theory, and its near-field overpressure signal exhibits a flat-top signature. This model is used in this study to verify the accuracy of AERO-BOOM’s modules for near-field overpressure distribution calculation, ground sonic boom signature calculation, and ground sonic boom loudness calculation.
SBPW-1 provided wind-tunnel measurements for the overpressure signal at a distance of 1.2 L e n g t h along the under-track centerline of the SEEB-ALR model [50], where L e n g t h is the reference length of model.
Numerous researchers reported calculation results to SBPW-1. This study selects the result from Aftosmis et al. [51] for comparison, computed via the Cart3D solver on a Cartesian mesh to solve the Euler equations.
For convenience of comparison and analysis, the abscissa of the near-field overpressure signal in the following discussion is uniformly normalized to [39]
τ = ( x B r ) / L e n g t h
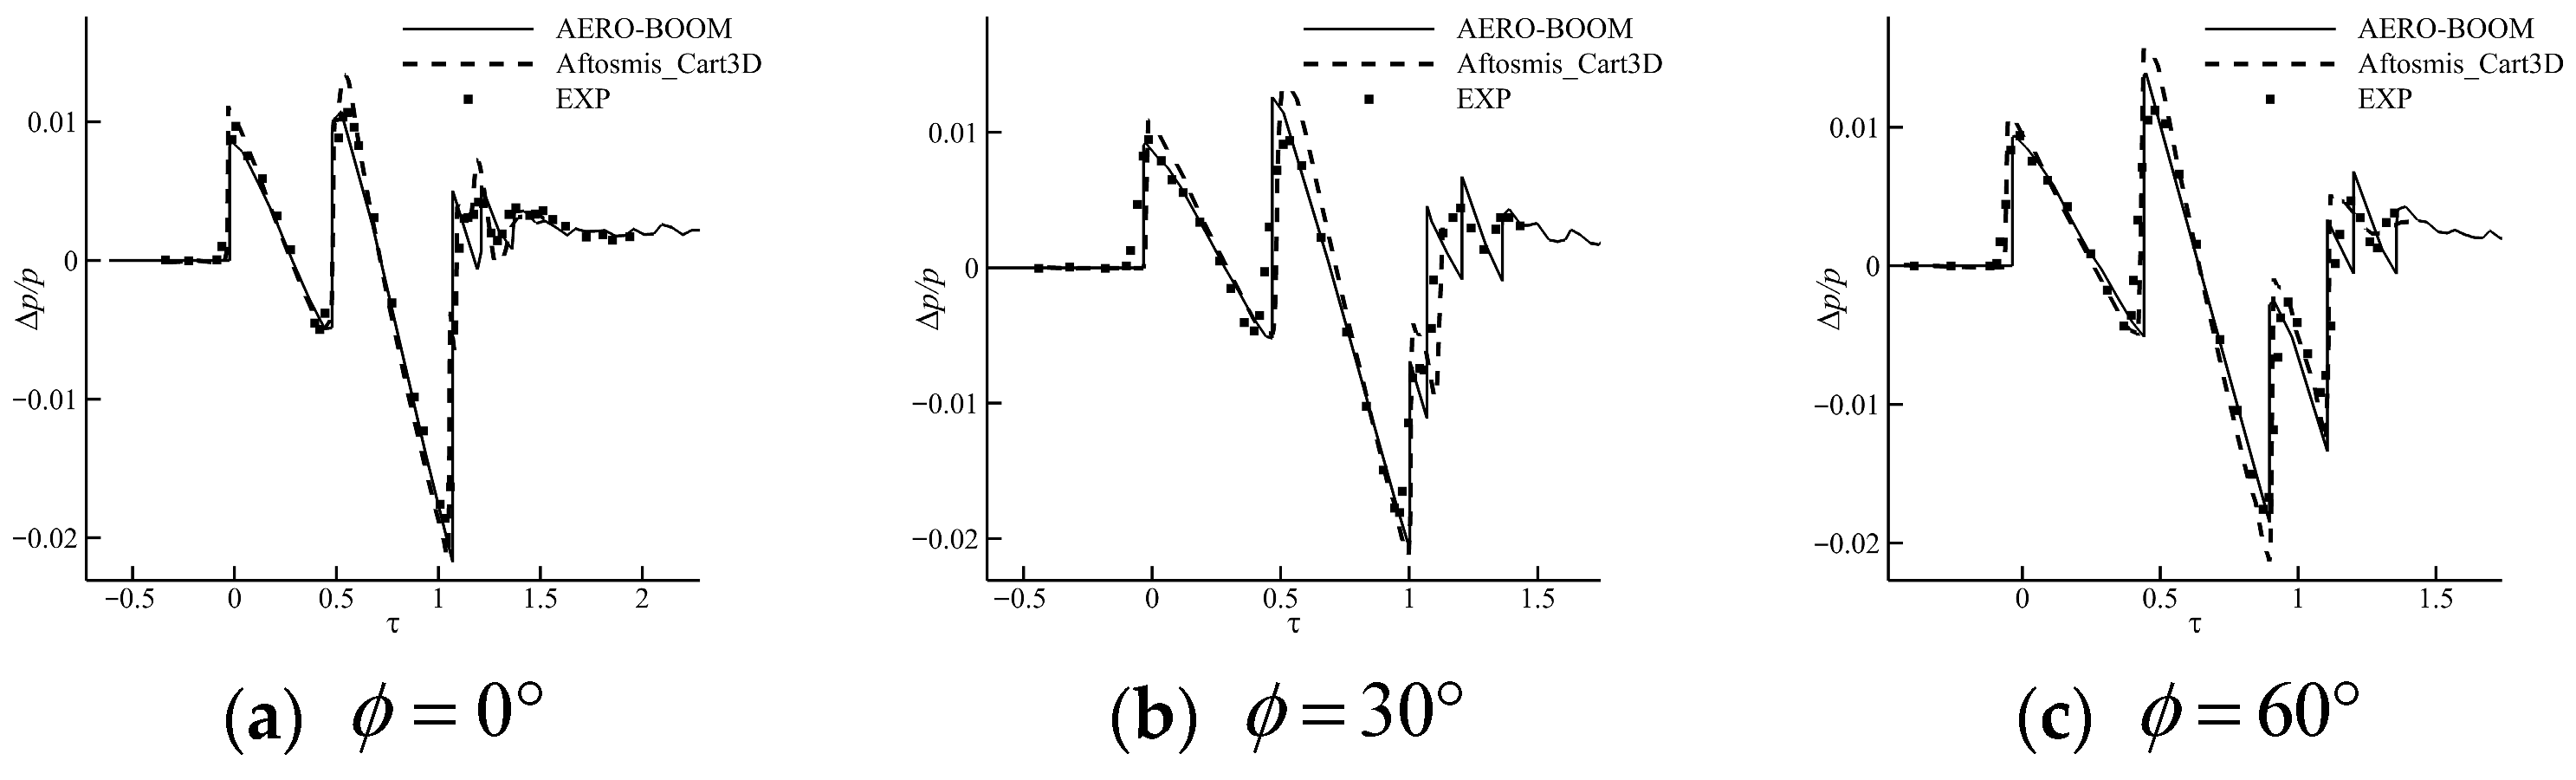
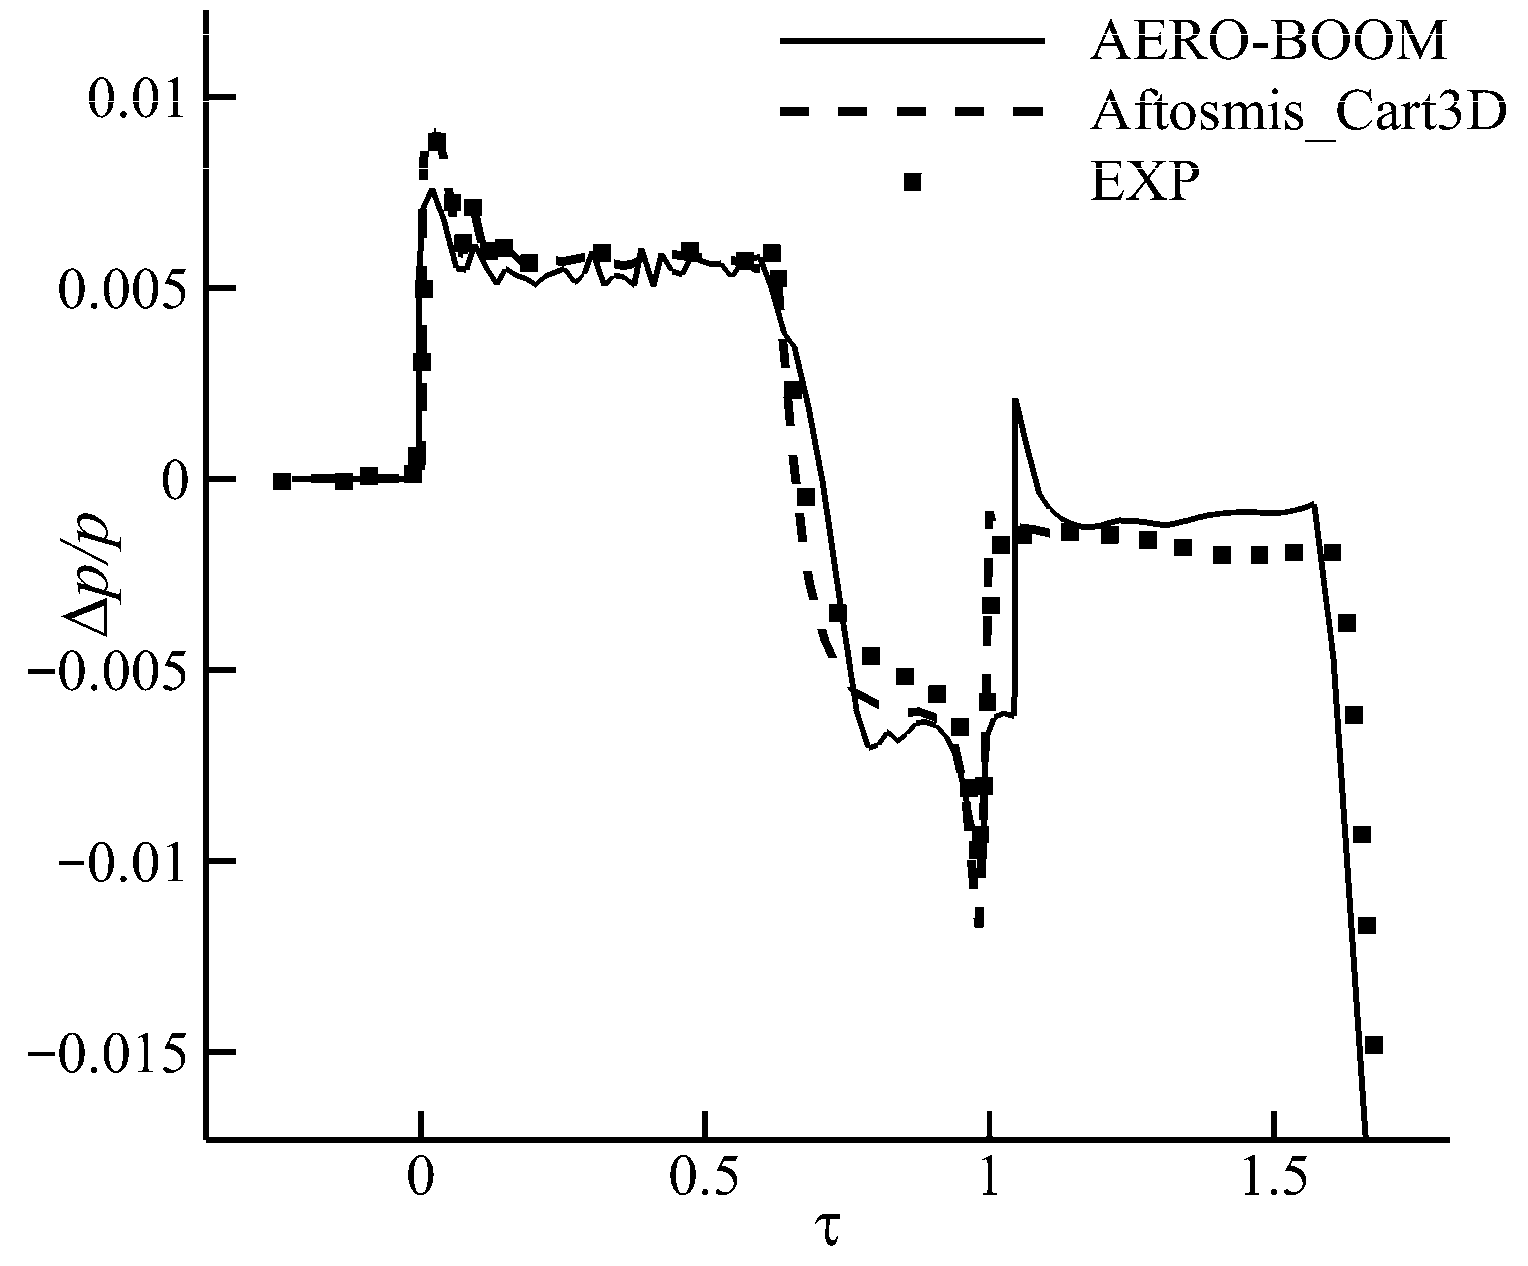
The comparison of the near-field overpressure signal results is shown in Figure 5. The prediction result from AERO-BOOM exhibits good overall agreement with the wind-tunnel measurements. However, owing to the inherent limitations of the Modified Linearized Theory, a minor discrepancy is observed in the tail shock region.
SBPW-1 also released the far-field sonic boom signal for the SEEB-ALR model [17]. This signal was calculated by NASA’s high-fidelity far-field sonic boom prediction software, sBOOM (v1.4), based on the near-field wind-tunnel measurement.
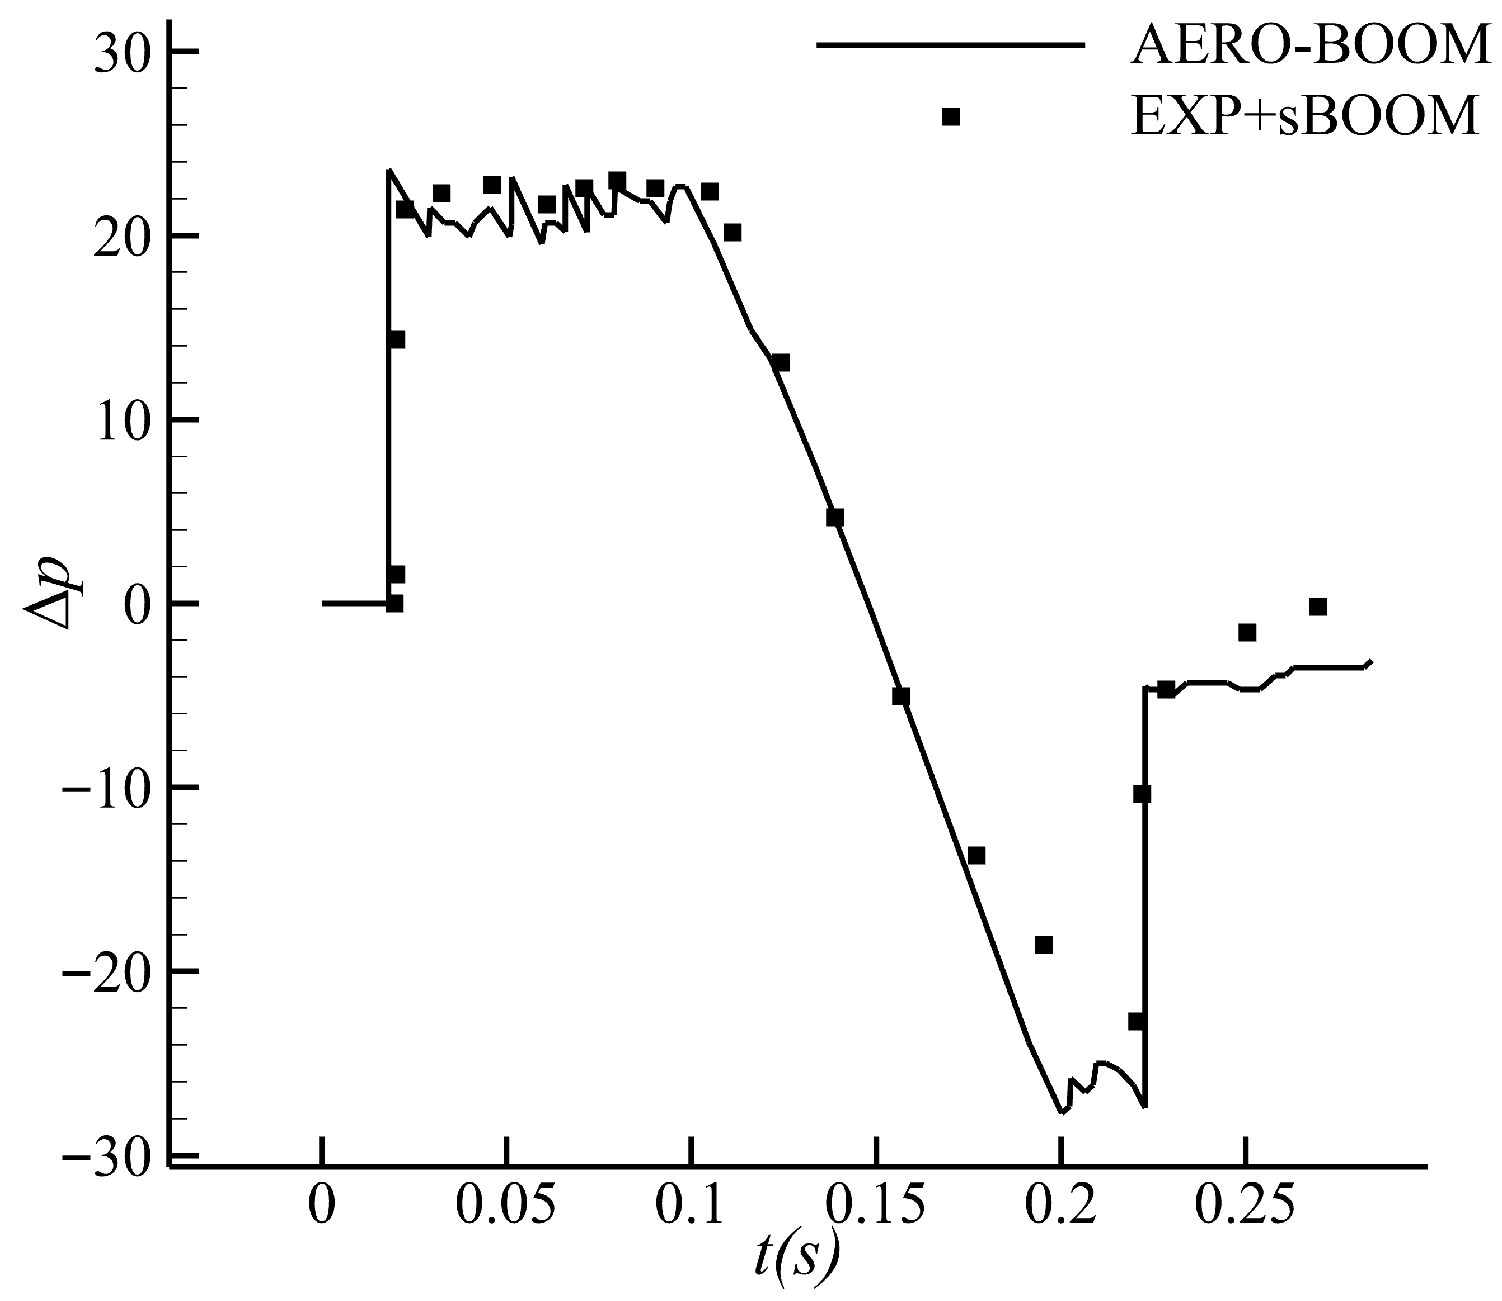
The comparison of the far-field sonic boom signals is shown in Figure 6. The peak overpressure of the leading shock and the signal align well with the results obtained from sBOOM, although the tail shock magnitude is slightly overestimated. According to the literature [17], the ground Perceived Loudness in Decibels for SEEB-ALR is 92PLdB. AERO-BOOM’s loudness prediction result is 92.7 PLdB. Such a degree of fidelity satisfies the requirements for the conceptual and preliminary design phases of supersonic civil aircraft.

2.3.2. DWB at Zero Angle of Attack

DWB configuration is a classic wing-body benchmark model introduced by NASA in 1973 [52]. It was originally developed to investigate the influence of planform shape on sonic boom characteristics, and an extensive database of experimental and computational data has been established for it. Furthermore, this model served as a core benchmark case in the SBPW-1.
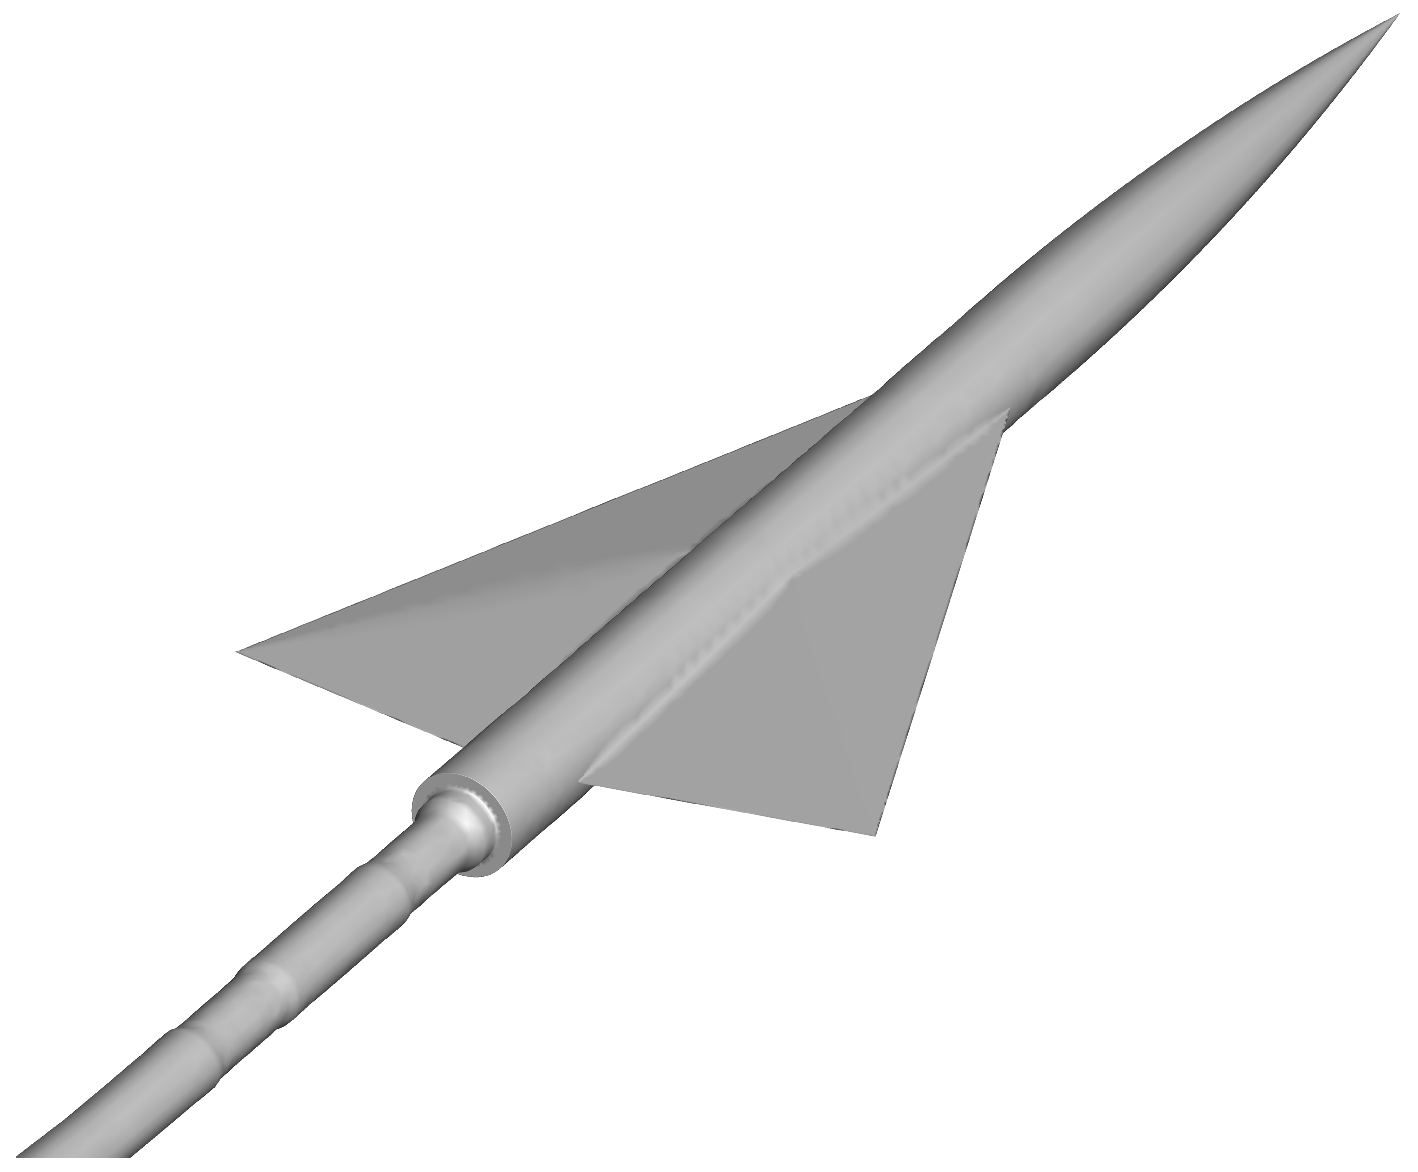
DWB comprises a body-of-revolution fuselage and a delta wing, and features a symmetric diamond airfoil section, as shown in Figure 7. This case is a non-lifting condition, thus employed to assess the fidelity of AERO-BOOM’s near-field overpressure distribution calculation module at different off-track angles. The calculation results are compared with the wind-tunnel measurements [17,51] and the Cart3D results are reported by Aftosmis et al. [51], as shown in Figure 8.
Figure 8. Comparison of AERO-BOOM near-field results for different off-track angles with SBPW-1 submission and experimental results.
Aerospace 13 00096 g008

2.3.3. DWB with Angle of Attack

The NASA Fundamental Aeronautics Program Sonic Boom Prediction Workshop in 2008 [18] designated the DWB with an angle of attack of 4.74° as a benchmark case. The sonic boom characteristics of this case are significantly governed by lift-induced effects. This case is utilized herein to evaluate the integrated performance of the accuracy of AERO-BOOM’s aerodynamic force prediction and near-field overpressure distribution calculation module under lifting conditions.
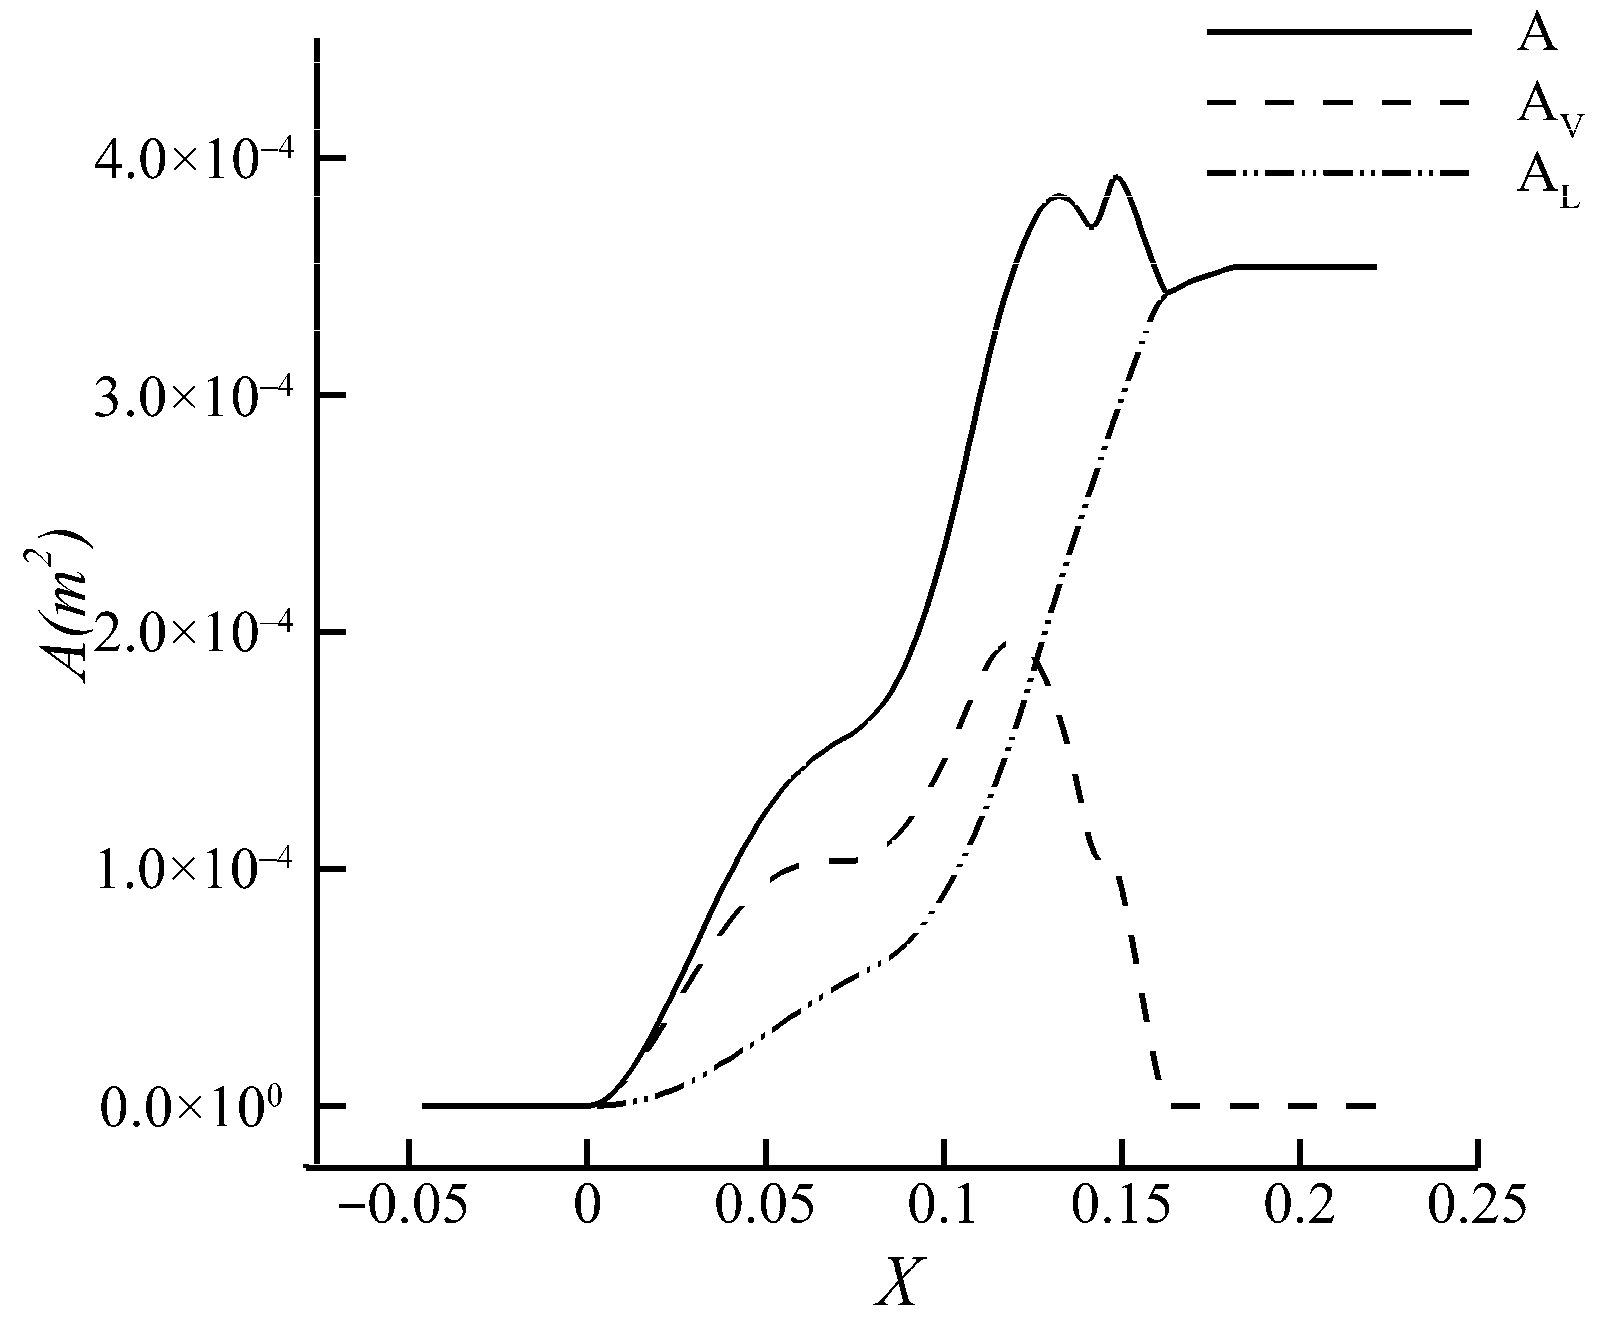
Figure 9 shows the equivalent area distribution for this case. It can be seen that the equivalent area A is composed of the body component A V and the lift component A L , and both components jointly influence the sonic boom characteristics.
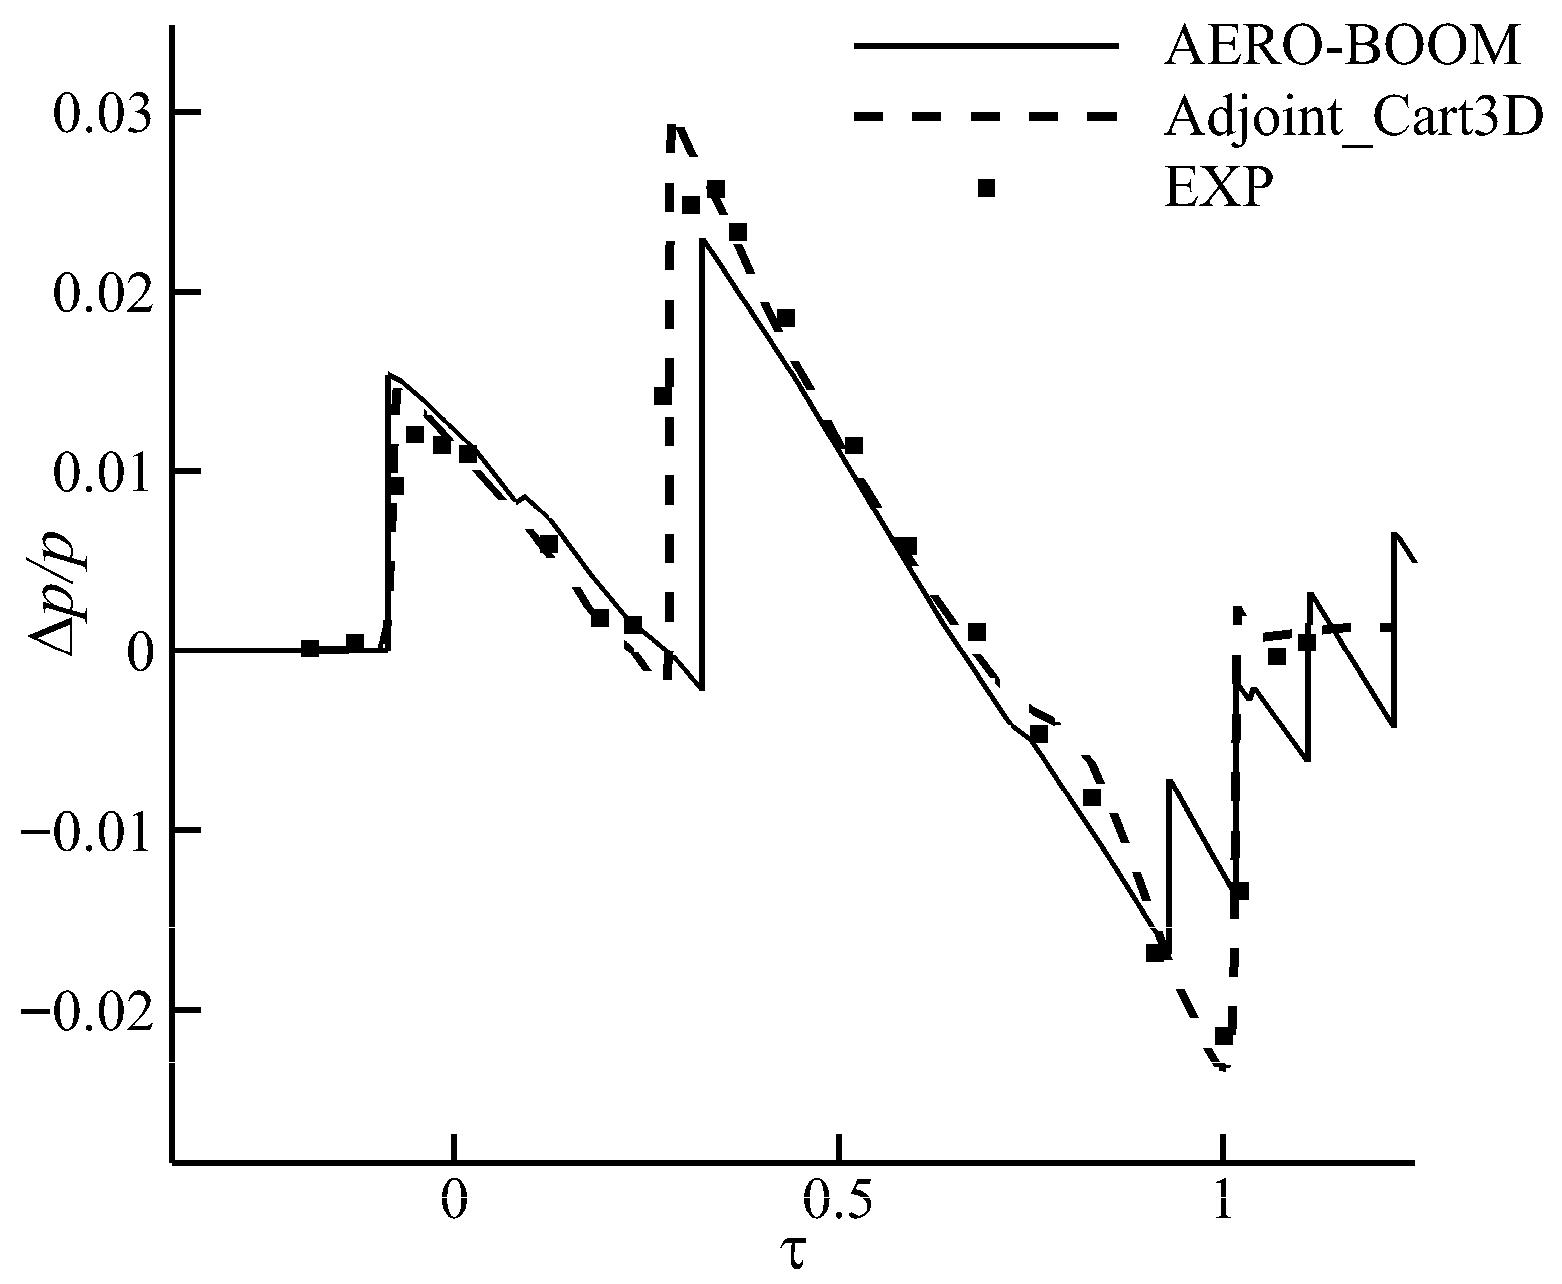
The near-field overpressure signal for this case is shown in Figure 10. The peak overpressure of the leading shock is close to the experimental result, while the trailing shock intensity is slightly smaller than the experimental value.
Numerical simulations were performed using CFD, and the resulting data were compared with both wind-tunnel measurements and AERO-BOOM’s aerodynamic force prediction result. As summarized in Table 2, the predictive precision of AERO-BOOM’s aerodynamic force prediction module is well within the acceptable margin for the conceptual design phase of supersonic civil aircraft.

3. Multidisciplinary Optimization Design Platform for the Full-Carpet Sonic Boom/Aerodynamic Characteristics of Supersonic Civil Aircraft

3.1. Optimization Algorithm

This study develops an integrated optimization framework centered on HSADE [42], which incorporates RSM. The differential evolution algorithm is an iterative population-based heuristic method that uses crossover and mutation to find the optimum. This method can efficiently locate the global optimum independent of gradient information for the objective function.
HSADE was specifically chosen for its superior convergence depth and robustness compared to other evolutionary algorithms. By synergistically combining the robust global searching capability of DE with the high-efficiency local search of the Radial Basis Function (RBF) response surface, HSADE effectively balances exploration and exploitation. Its core advantages lie in several advanced strategies, including self-adaptive parameters, a double-defeat tournament selection operator, and a competition rule based on the population environment, all of which prevent premature convergence and ensure a more thorough search of the design space. Furthermore, the reliability and performance of HSADE have been extensively validated through multiple complex aerodynamic optimization cases in the aerospace field, such as airfoil and flap designs [53,54,55].

3.2. Optimization Process

The framework for the supersonic civil aircraft MDO design platform, which is powered by HSADE algorithm, shown in Figure 11, to optimize full-carpet sonic boom and aerodynamic characteristics:
  • An initial candidate population is generated through Latin Hypercube Sampling. This approach ensures a uniform and space-filling distribution of individuals across the predefined design space of the variables.
  • The fitness of each individual in the initial population (i.e., lift-to-drag ratio K and full-carpet sonic boom loudness F B L ) is systematically evaluated, thereby establishing the initial parent generation for the optimization process.
  • The parent generation generates a subset of offspring individuals through crossover and mutation. The parent generation is also added to the database, and a Radial Basis Function (RBF) response surface is constructed from the database. A portion of new individuals is then derived through localized search performed on the RBF surrogate.
  • The two subsets of offspring collectively constitute the candidate pool. Their fitness is subsequently evaluated using the AERO-BOOM.
  • Based on the evaluation results, elite individuals are selected to form the offspring generation.
  • If the termination condition is not met, the current population is updated and serves as the parent generation for the subsequent iteration, repeating steps 3 through 5. If the termination condition is met, the optimization process concludes.
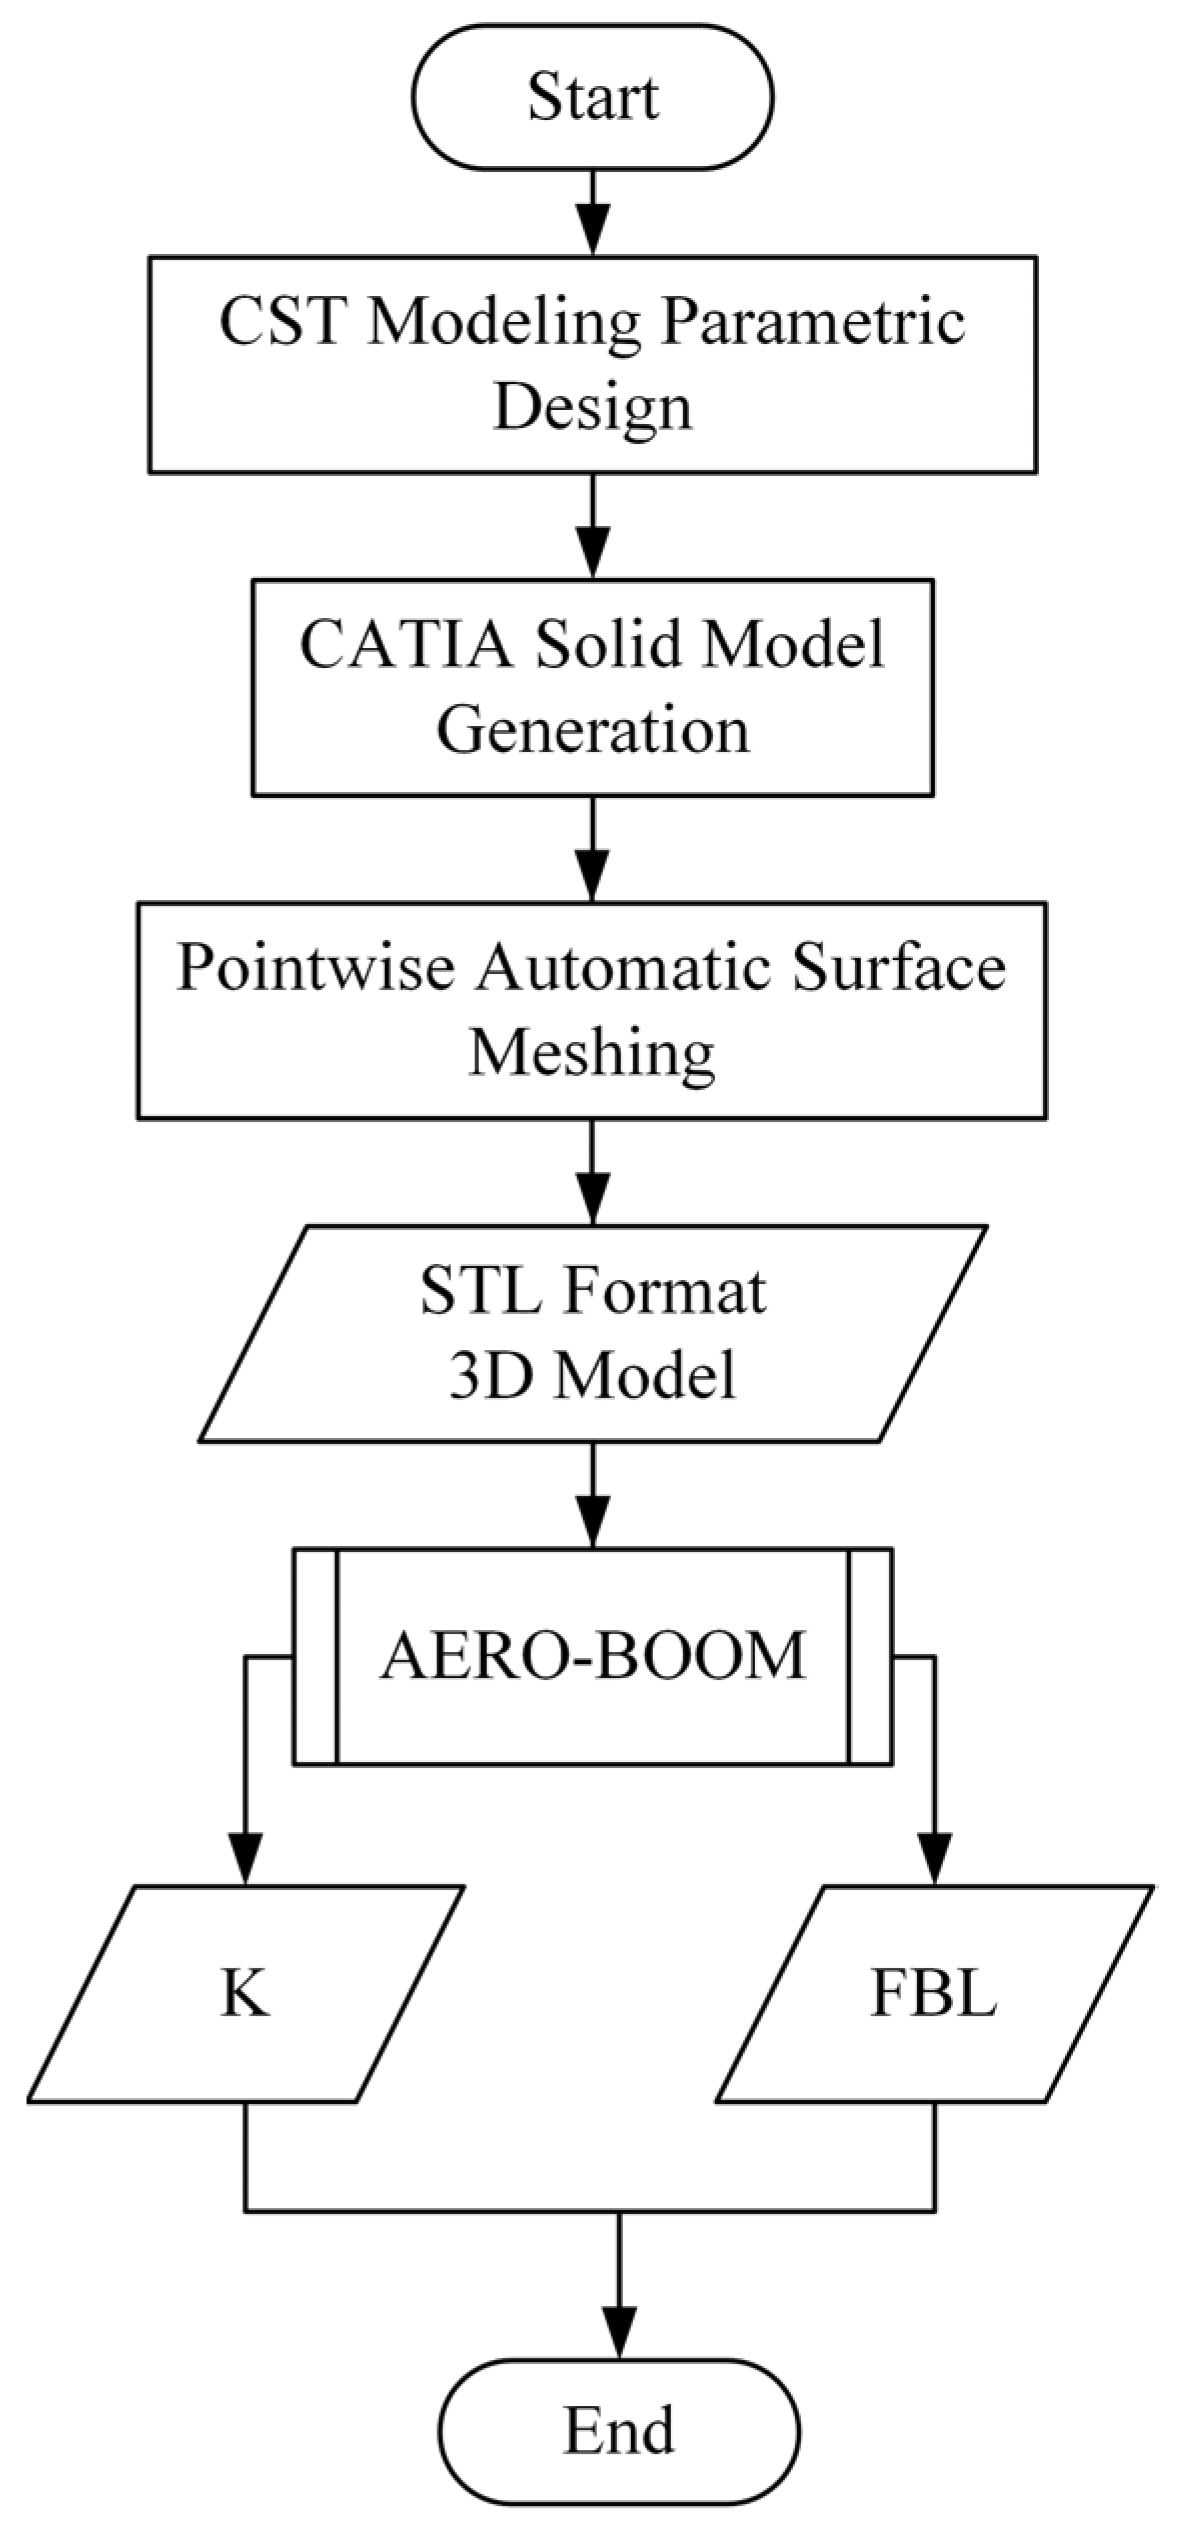
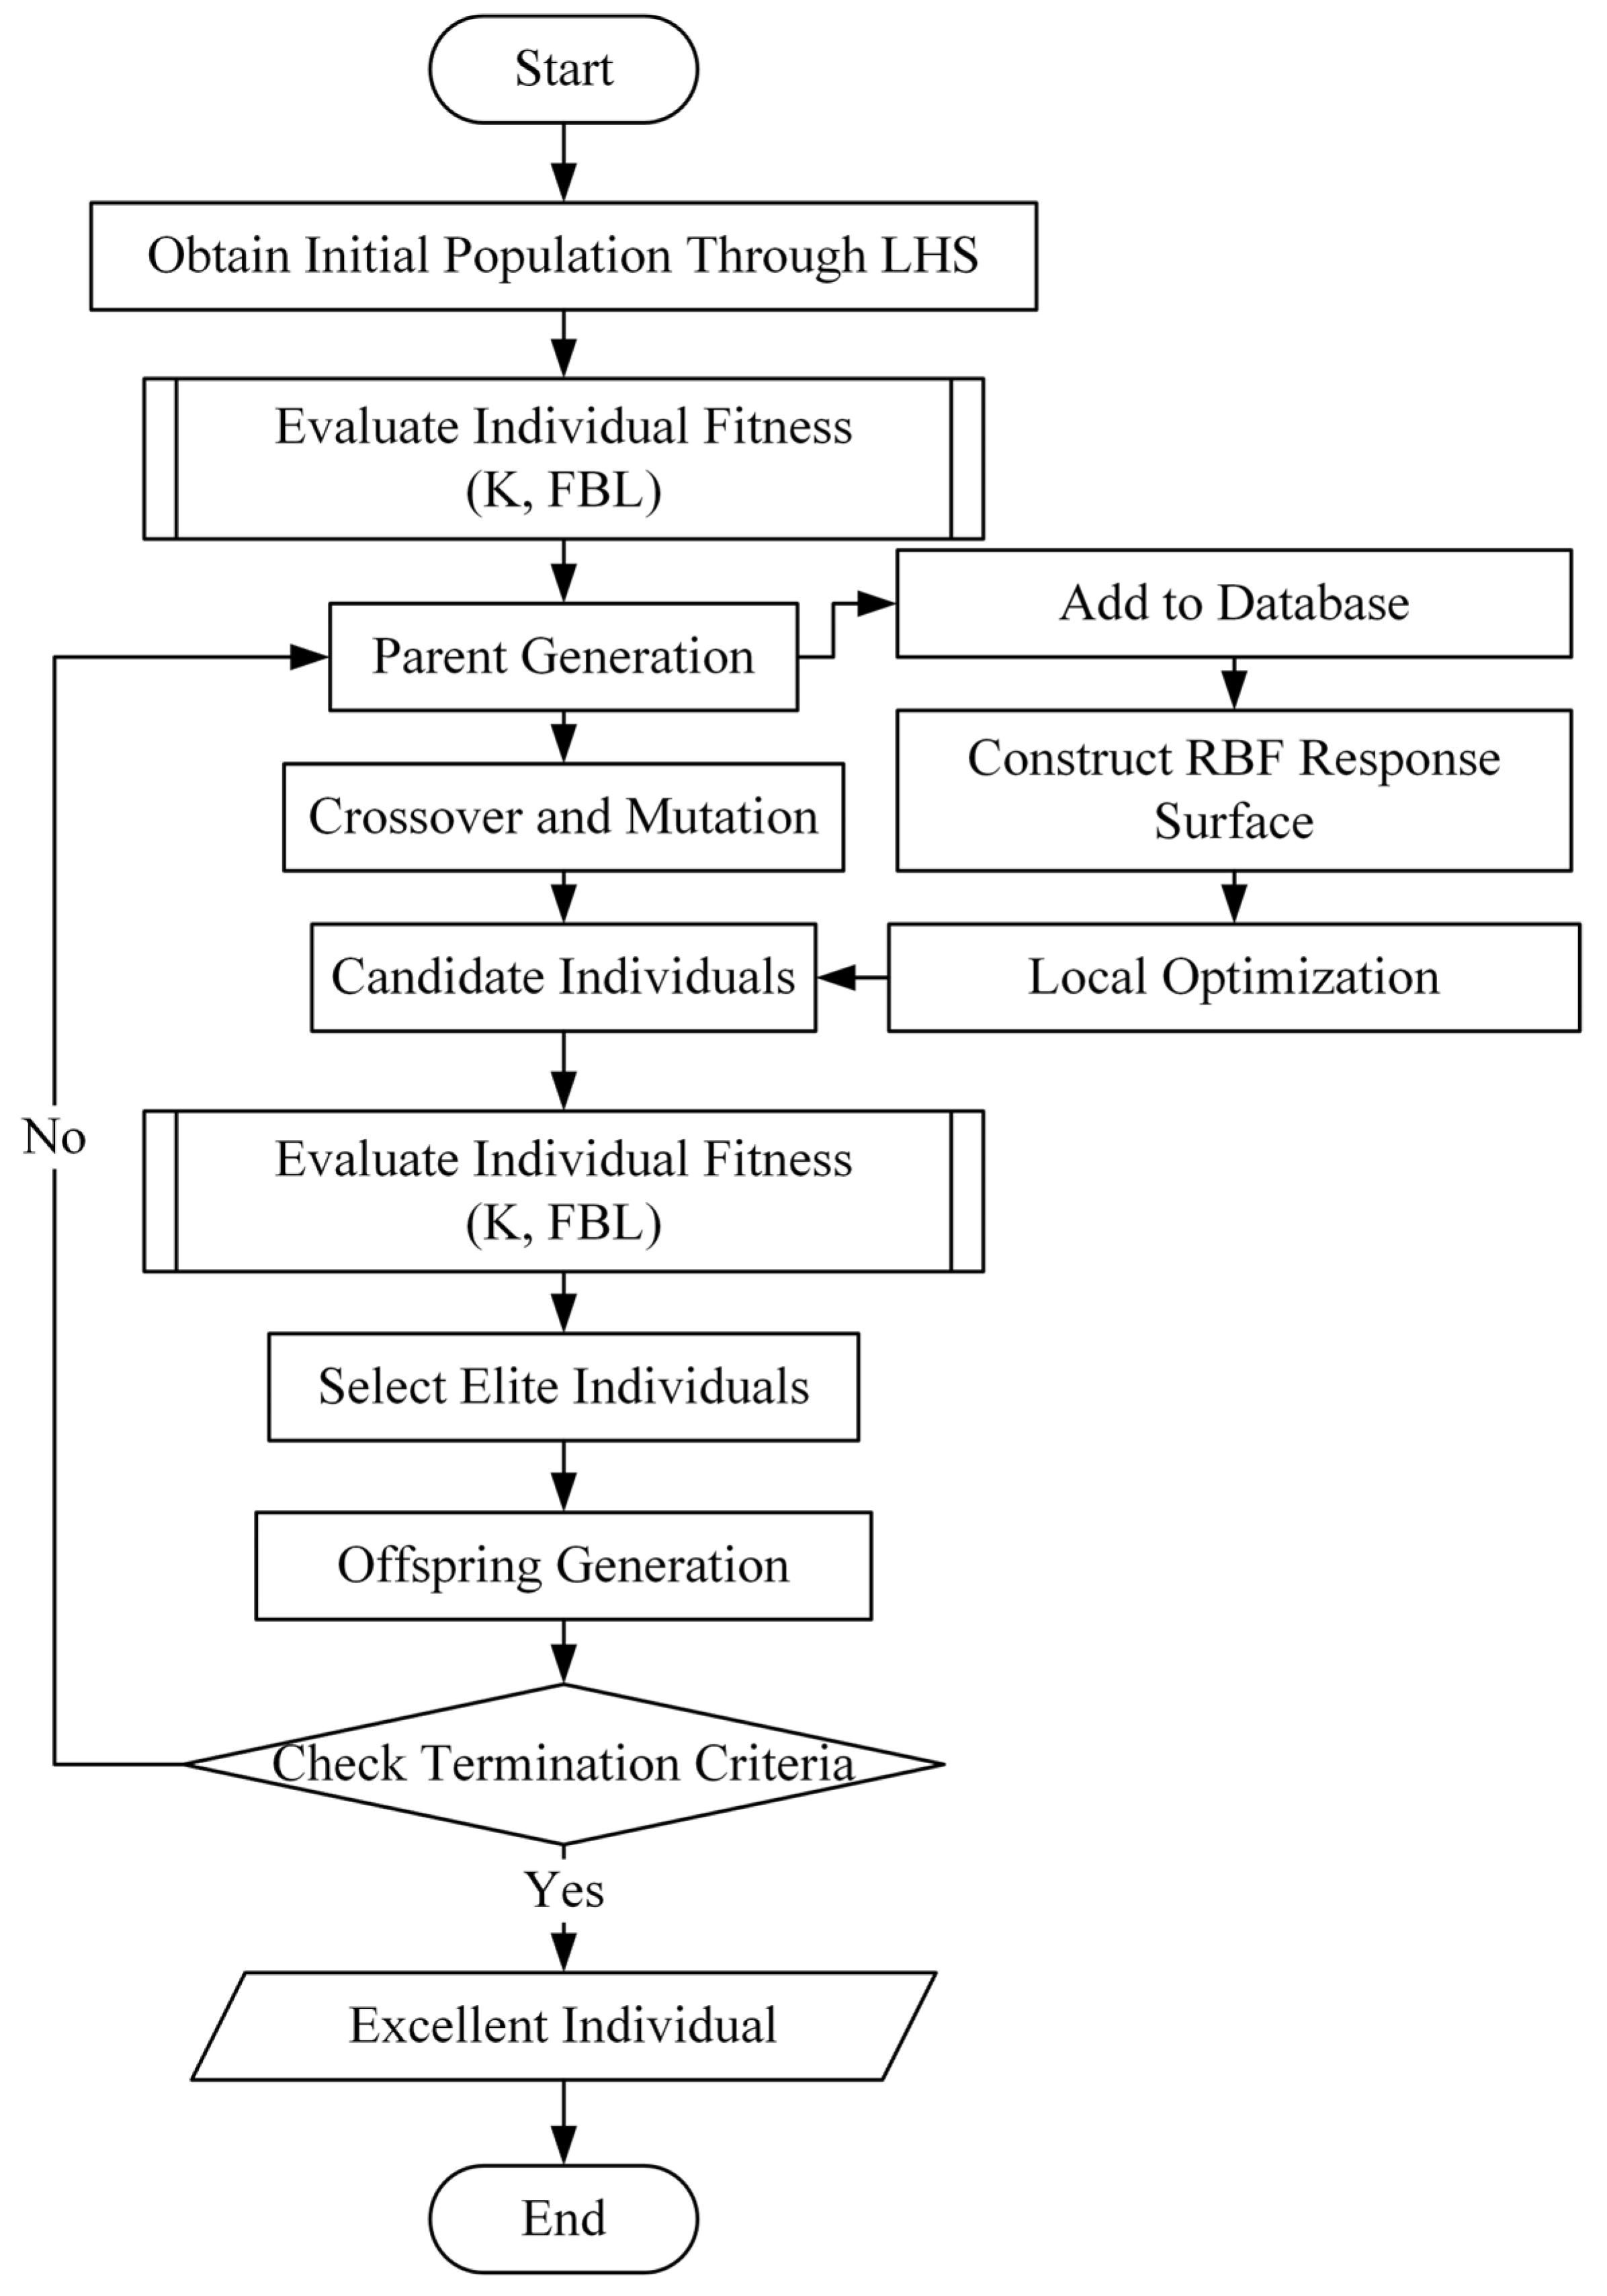
The subprocess for “Evaluating Individual Fitness” in steps 2 and 2 is shown in Figure 12. The steps are as follows:
  • For each individual, the optimization algorithm assigns a specific vector of design variables. Subsequently, the geometric model is generated using the CST modeling [56] parametric shaping method, and a solid model is automatically reconstructed via the CATIA secondary development interface.
  • The generated solid model is imported into Pointwise to facilitate the automated generation of a triangular surface mesh. The discretized surface is subsequently exported in STL format, serving as the geometric input for the AERO-BOOM solver.
  • AERO-BOOM executes the calculation process shown in Figure 1 and outputs K and F B L .

4. Optimization Platform Case Validation

4.1. Parametric Modeling of Supersonic Civil Aircraft

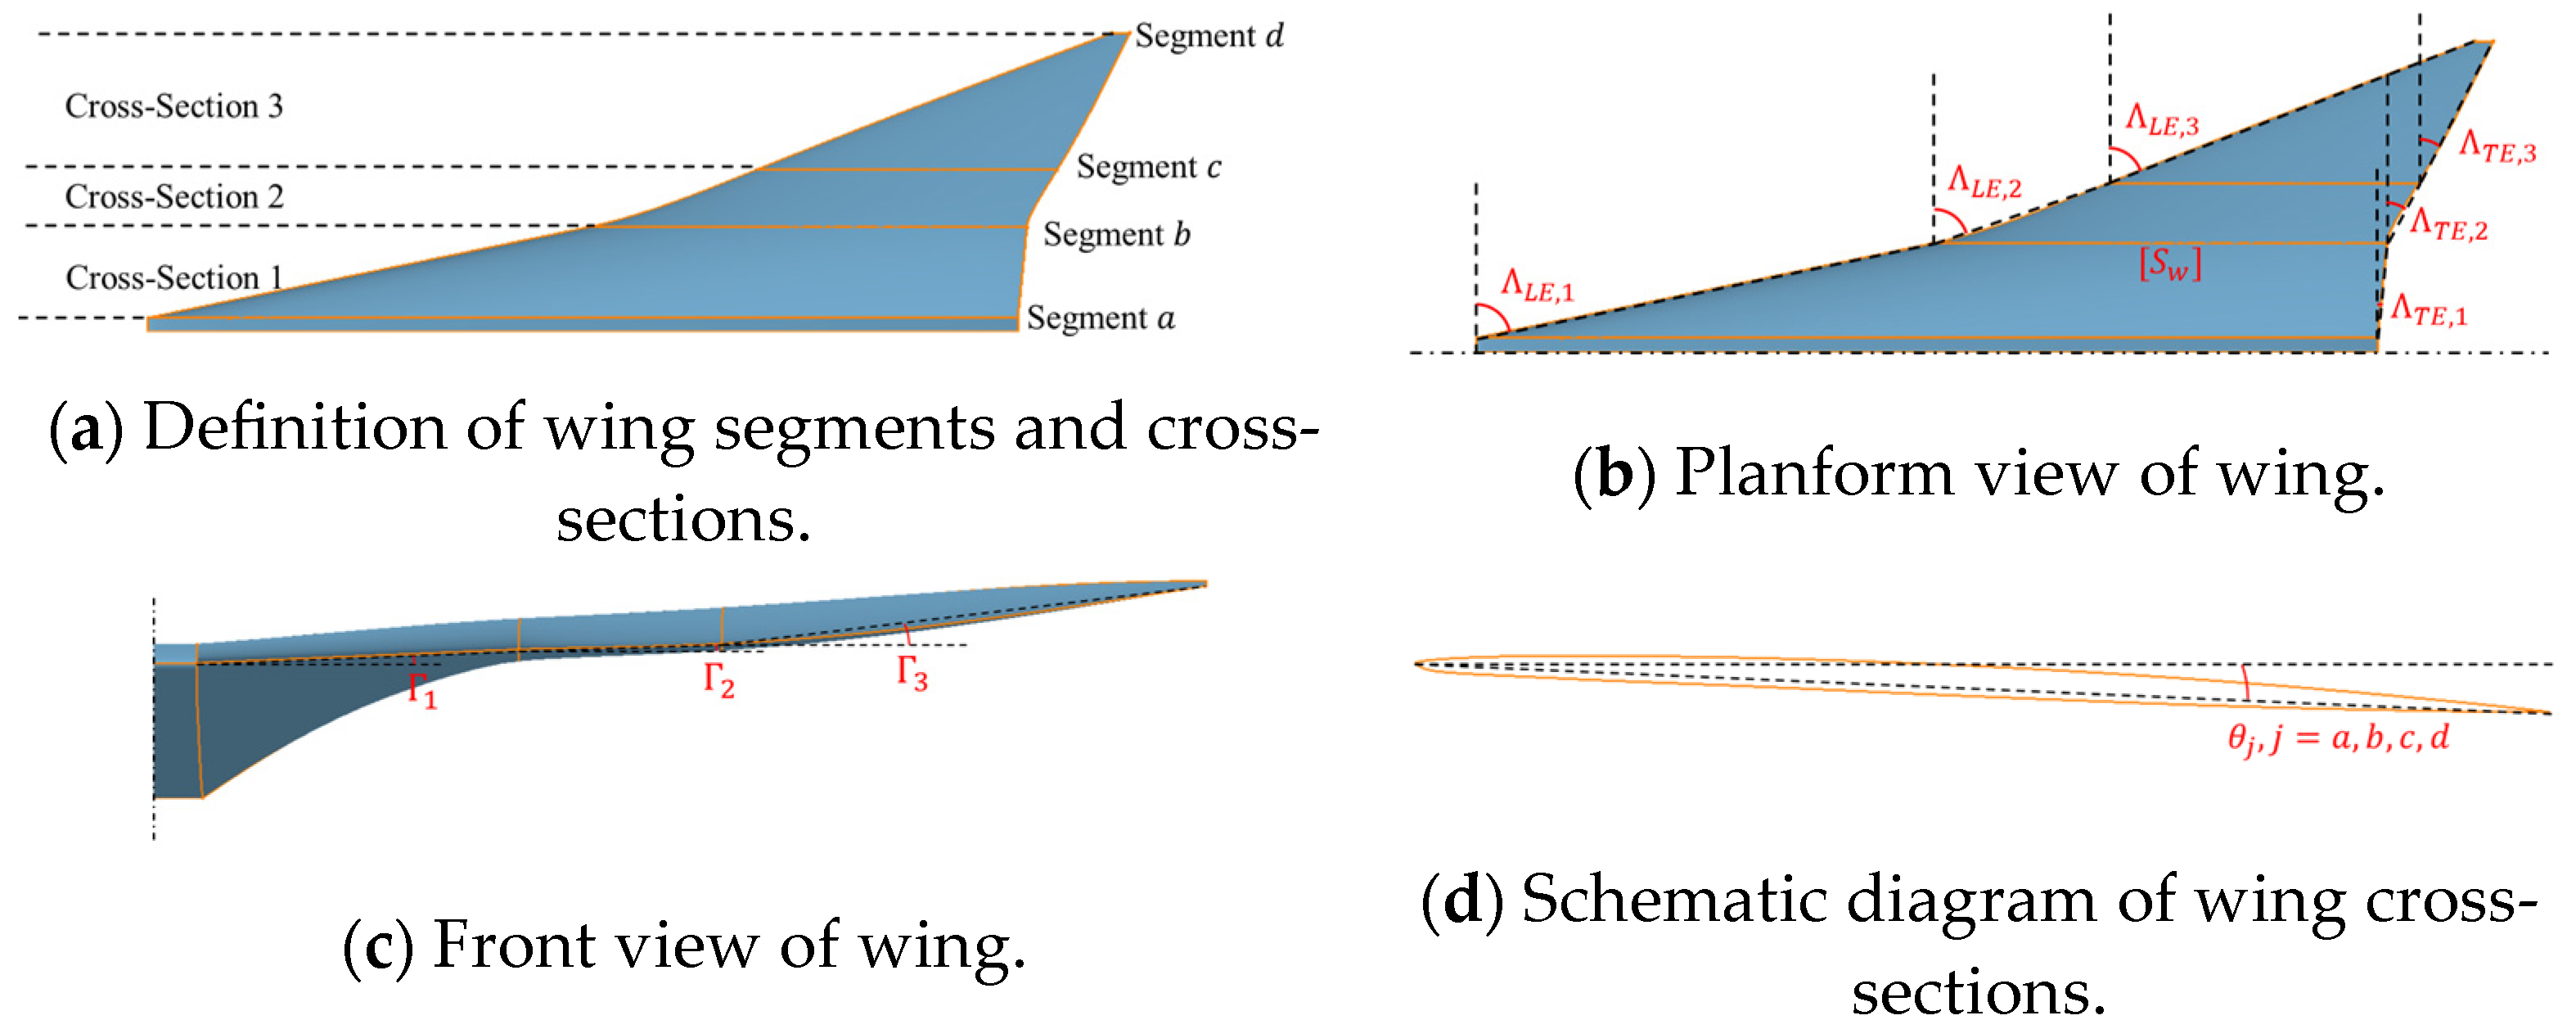
The parametric model of the supersonic civil aircraft is divided into three parts: the wing, the fuselage, and the V-tail. The wing is divided into four spanwise segments. The root segment has a very small span and is integrated within the fuselage volume, and its leading-edge sweep angle and dihedral angle are both 0 ° . The remaining three segments are numbered 1 to 3 from the inside out, with four transverse sections labelled a to d. The plane of symmetry coincides with cross-section a, as shown in Figure 13a. The leading-edge sweep angle Λ L E , i , i = 1 , 2 , 3 and trailing-edge sweep angle Λ T E , i , i = 1 , 2 , 3 of each segment are treated as design variables. The wing projected area S w remains constant. These variables together define the wing planform shape, as shown in Figure 13b. The dihedral angle of each wing section Γ i , i = 1 , 2 , 3 is used as a design variable, as shown in Figure 13c. The airfoil section for all cross-sections adopts that of the wing of baseline configuration at y = 7 m , and the twist angle θ j , j = a , b , c , d is used as a design variable, as shown in Figure 13d.
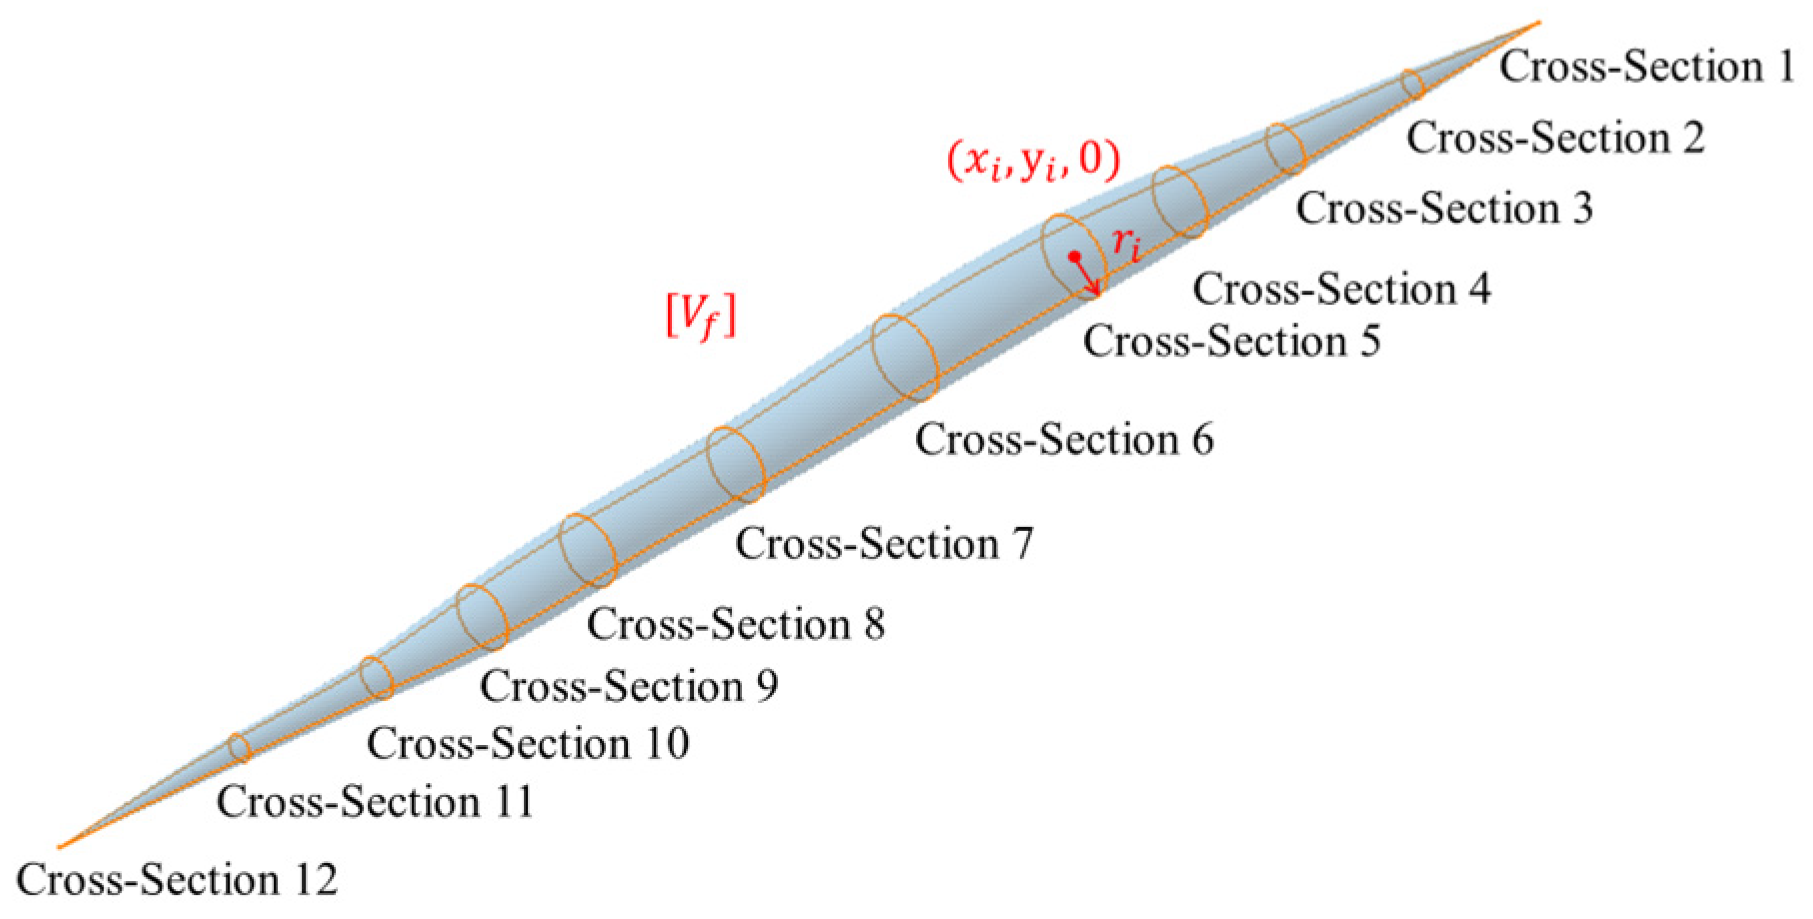
The fuselage is divided into 11 segments from nose to tail, forming 12 longitudinal cross-sections numbered 1 to 12 from front to back. Cross-section 1 is anchored at the coordinate origin ( 0 , 0 , 0 ) . Cross-section 12 is a point with coordinates ( 70 , y 12 , 0 ) , where y 12 is a design variable. The intermediate cross-sections are assumed to be circular, defined by their center coordinates ( x i , y i , 0 ) and radius r i , i = 2 ~ 11 . The vertical offset of the center along the y-axis y i , i = 2 ~ 11 and the radius of each cross-section r i , i = 2 ~ 11 are assigned as design variables, as shown in Figure 14. The area of each cross-section is scaled proportionally to ensure that the fuselage volume V f remains constant.
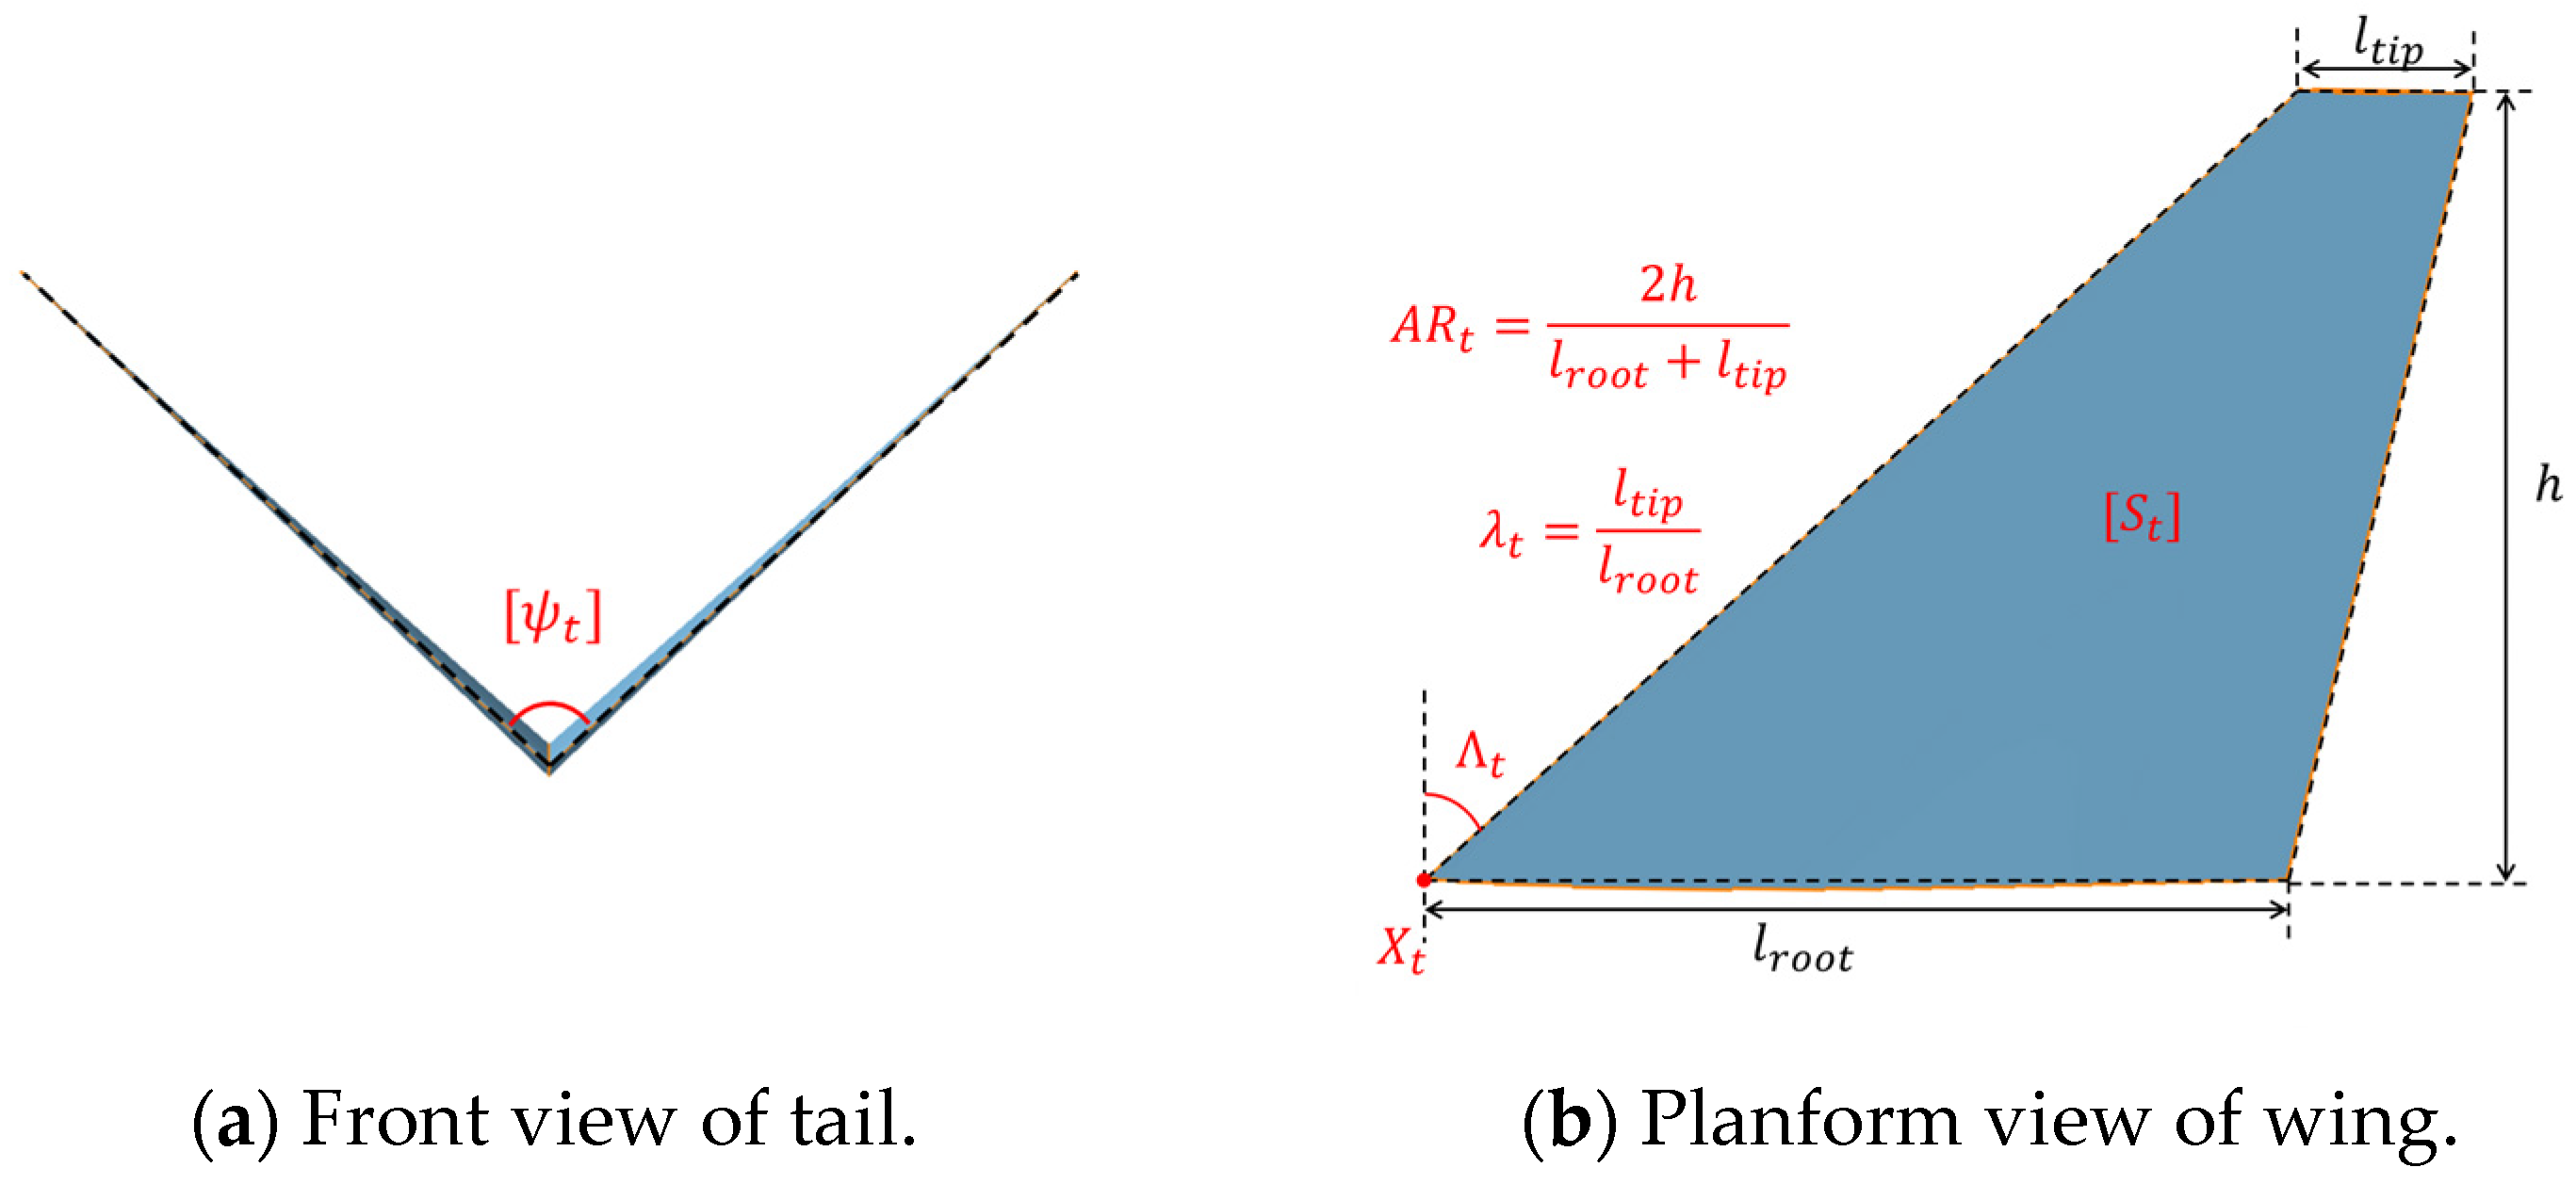
The V-tail is composed of two tail surfaces, and the dihedral angle between them ψ t is held constant, as shown in Figure 15a. Each tail surface possesses a trapezoidal planform, as shown in Figure 15b, and the tail airfoil is the NACA 64008A. The leading-edge coordinates of the tail root X t , the leading-edge sweep angle Λ t , the aspect ratio A R t , and the taper ratio λ t are treated as design variables. The tail area S t remains constant, and these variables collectively define the V-tail geometry.
Table 3 summarizes the optimization objectives, optimization variables, and constraints of this study:

4.2. Baseline Configuration

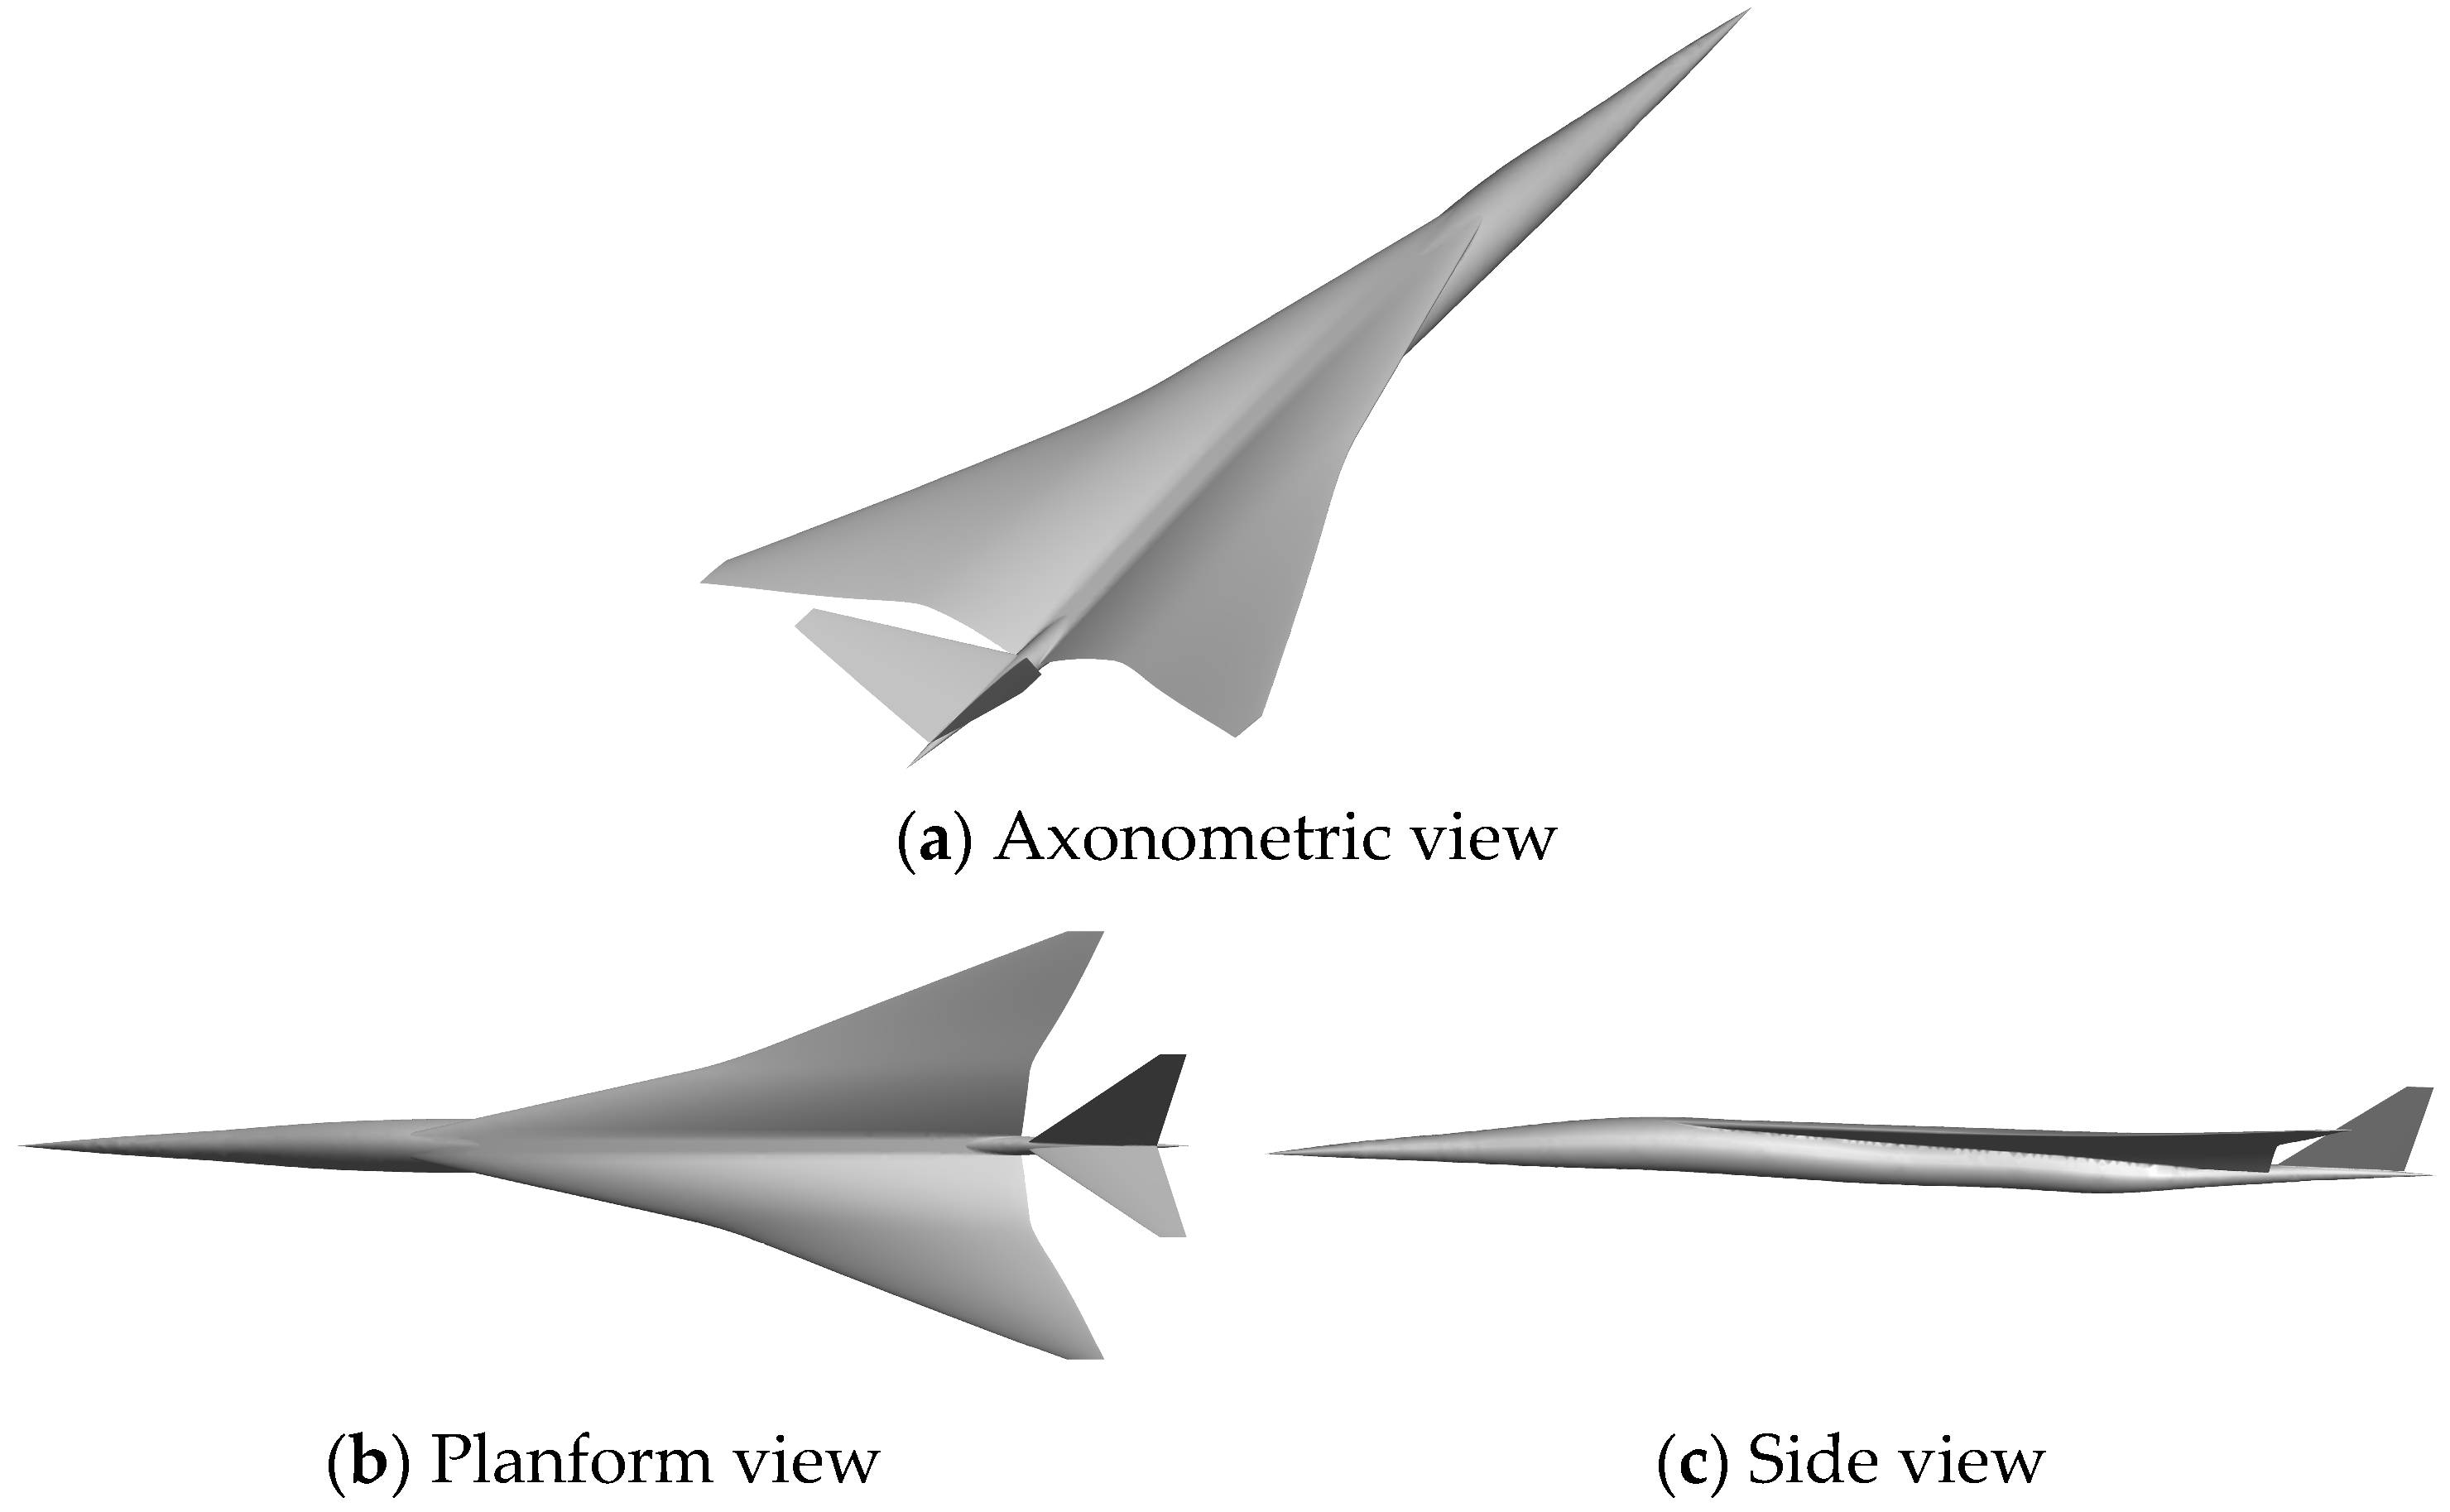
Derived from the “N+2” generation supersonic civil aircraft concept LM1021 [57] designed by Lockheed Martin (Bethesda, MD, USA), the baseline configuration shown in Figure 16 was established via aforementioned parametric shaping, following a simplification process that excluded non-structural components such as nacelles and control surfaces. The resulting baseline features a fuselage length of 70 m, a wingspan of 26.4 m, a swept high-wing configuration, a wing projected area of 225   m 2 , and a V-tail with a single tail area of 36   m 2 .
The LM1021 was designed for a Mach number of 1.6 and a cruise altitude envelope of 14.8   km ~ 16.7   km . All subsequent calculations and optimizations are conducted at a fixed cruise condition: Mach 1.6, an altitude of 15.8   km , and an angle of attack of 2°. At this condition, the cutoff off-track angle is ϕ max = 51 ° . Han et al. [4] pointed out that the measurement position of the near-field overpressure signal affects the far-field aft-shock waveform, and the far-field waveform tends to converge when the measurement position is greater than three times the fuselage length. The near-field signature is extracted at a distance of five times the fuselage length, ensuring full convergence of the pressure signal.
Evaluation by AERO-BOOM shows that the baseline configuration has a lift-to-drag ratio of K b a s e l i n e = 5.61 and a full-carpet sonic boom loudness of F B L b a s e l i n e = 96.87 P L d B .
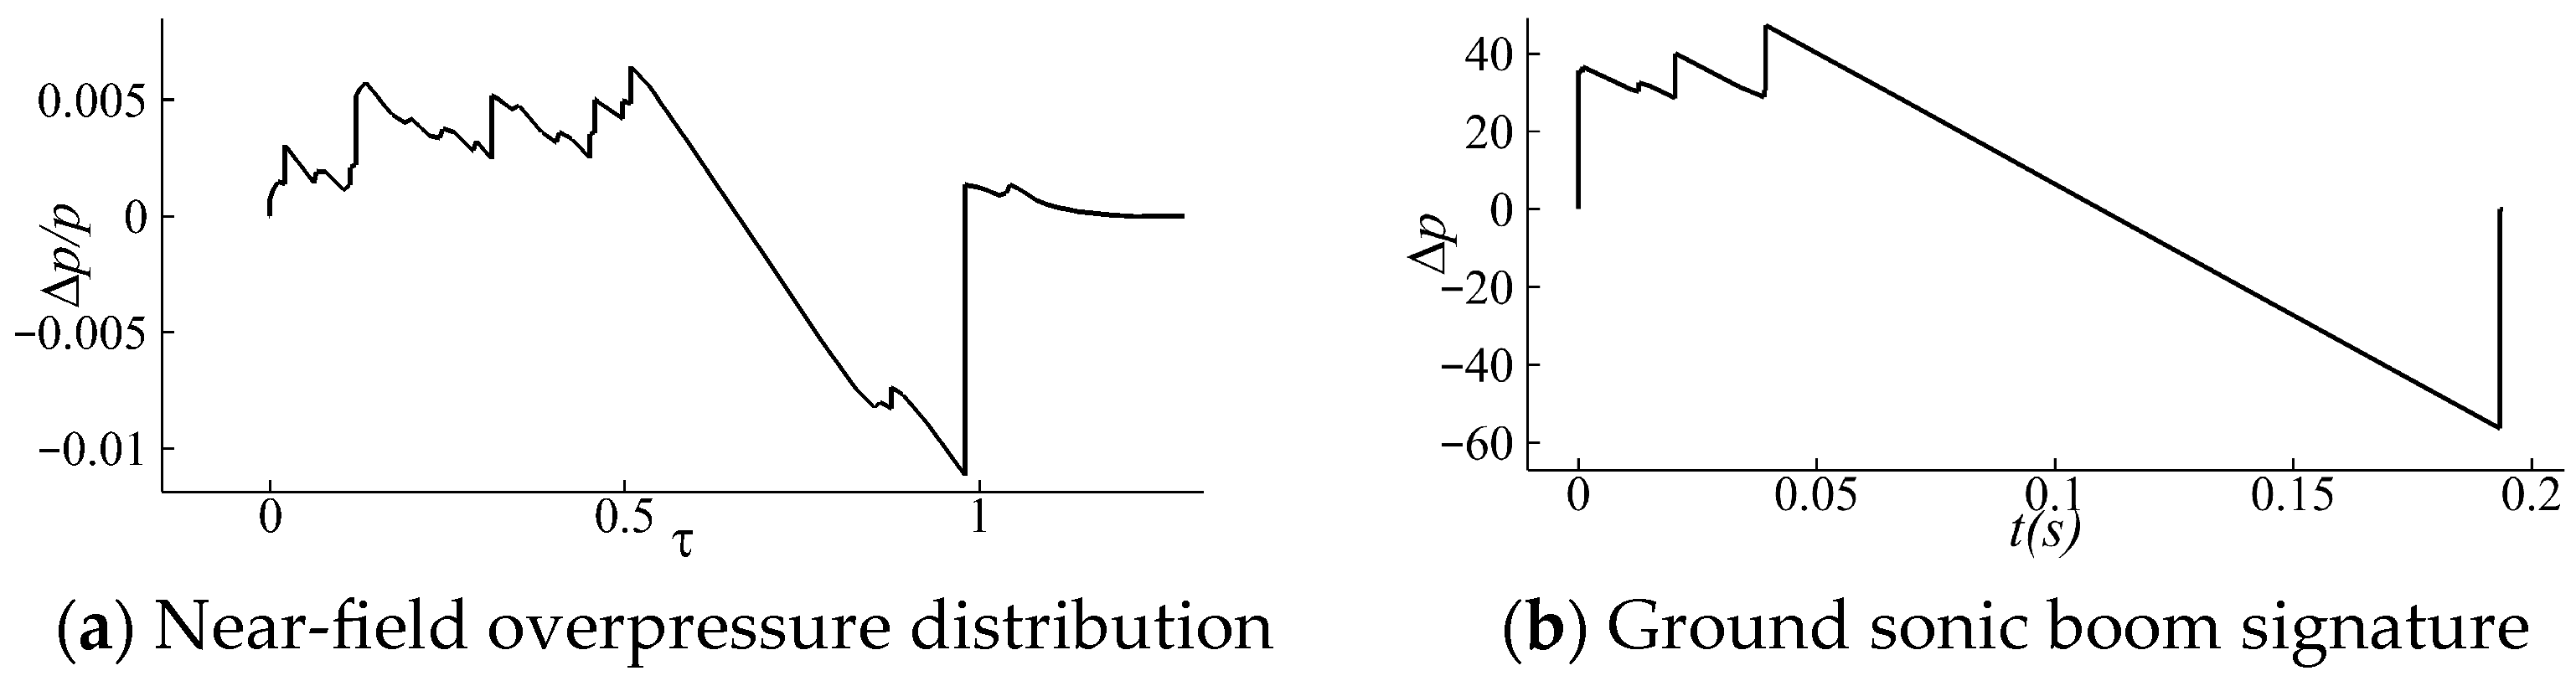
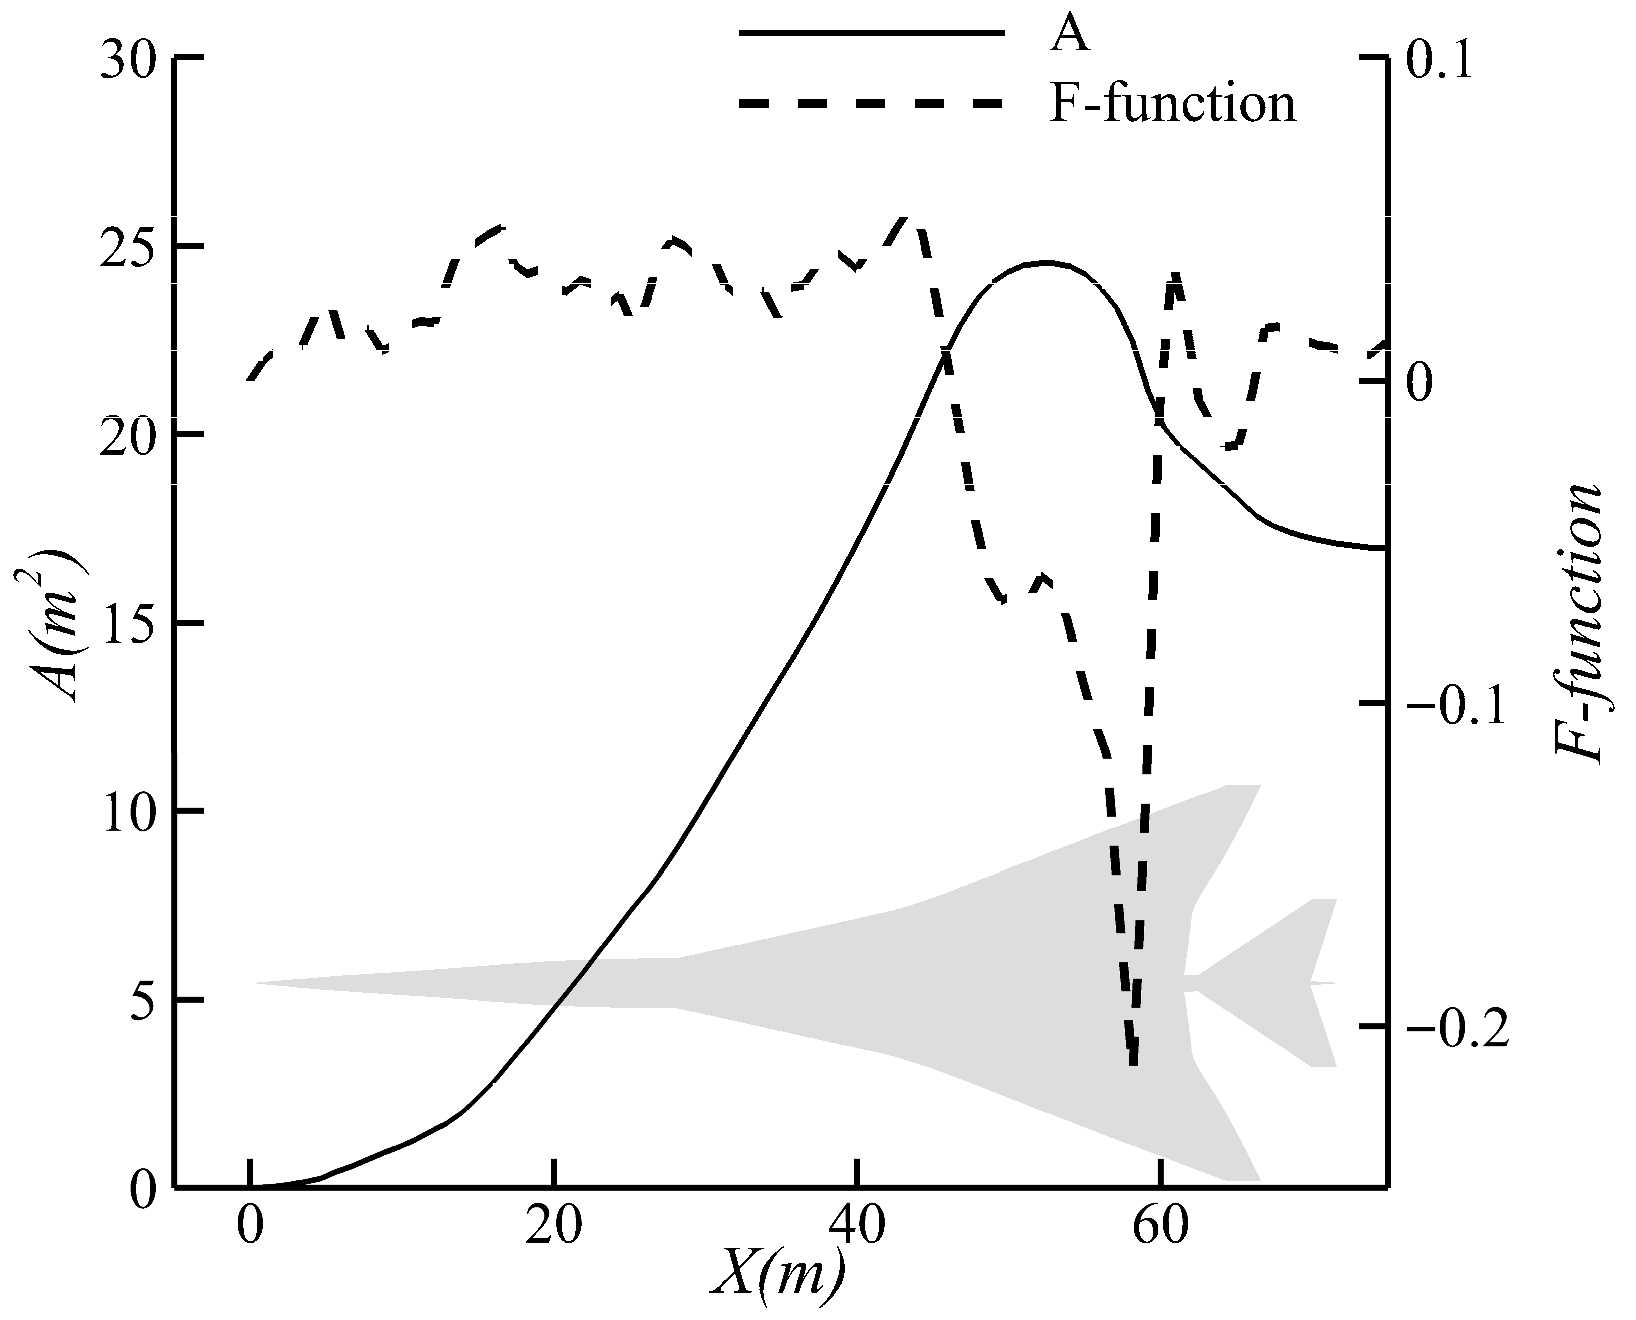
The equivalent area distribution and the Whitham F-function distribution of the baseline configuration in the ϕ = 0 direction is shown in Figure 17. The near-field overpressure distribution and the ground sonic boom signature are shown in Figure 18. The baseline configuration (LM1021), as an “N+2” generation supersonic civil aircraft concept, demonstrates distinctive low-boom design features: the equivalent area curve of the forebody ( X < 40   m ) is approximately parabolic, the F-function is relatively smooth, the near-field leading shock is multi-staged into four discrete weak compressions, and the far-field waveform is not a typical “N-wave” but forms a plateau-shaped leading waveform. These characteristics significantly reduce the perceived loudness.

4.3. Fuselage Optimization

First, the wing and tail were held constant, the optimization was focused exclusively on the fuselage contours. The convergence trajectory and optimization results are shown in Figure 19. A representative solution, designated as Opt-1, was extracted from the Pareto front. Opt-1 has a lift-to-drag ratio of K O p t - 1 = 5.87 , which attains an increment of 0.26 compared to the baseline configuration and an FBL of F B L O p t - 1 = 96.25 PLdB , yielding a reduction of 0.62 PLdB .
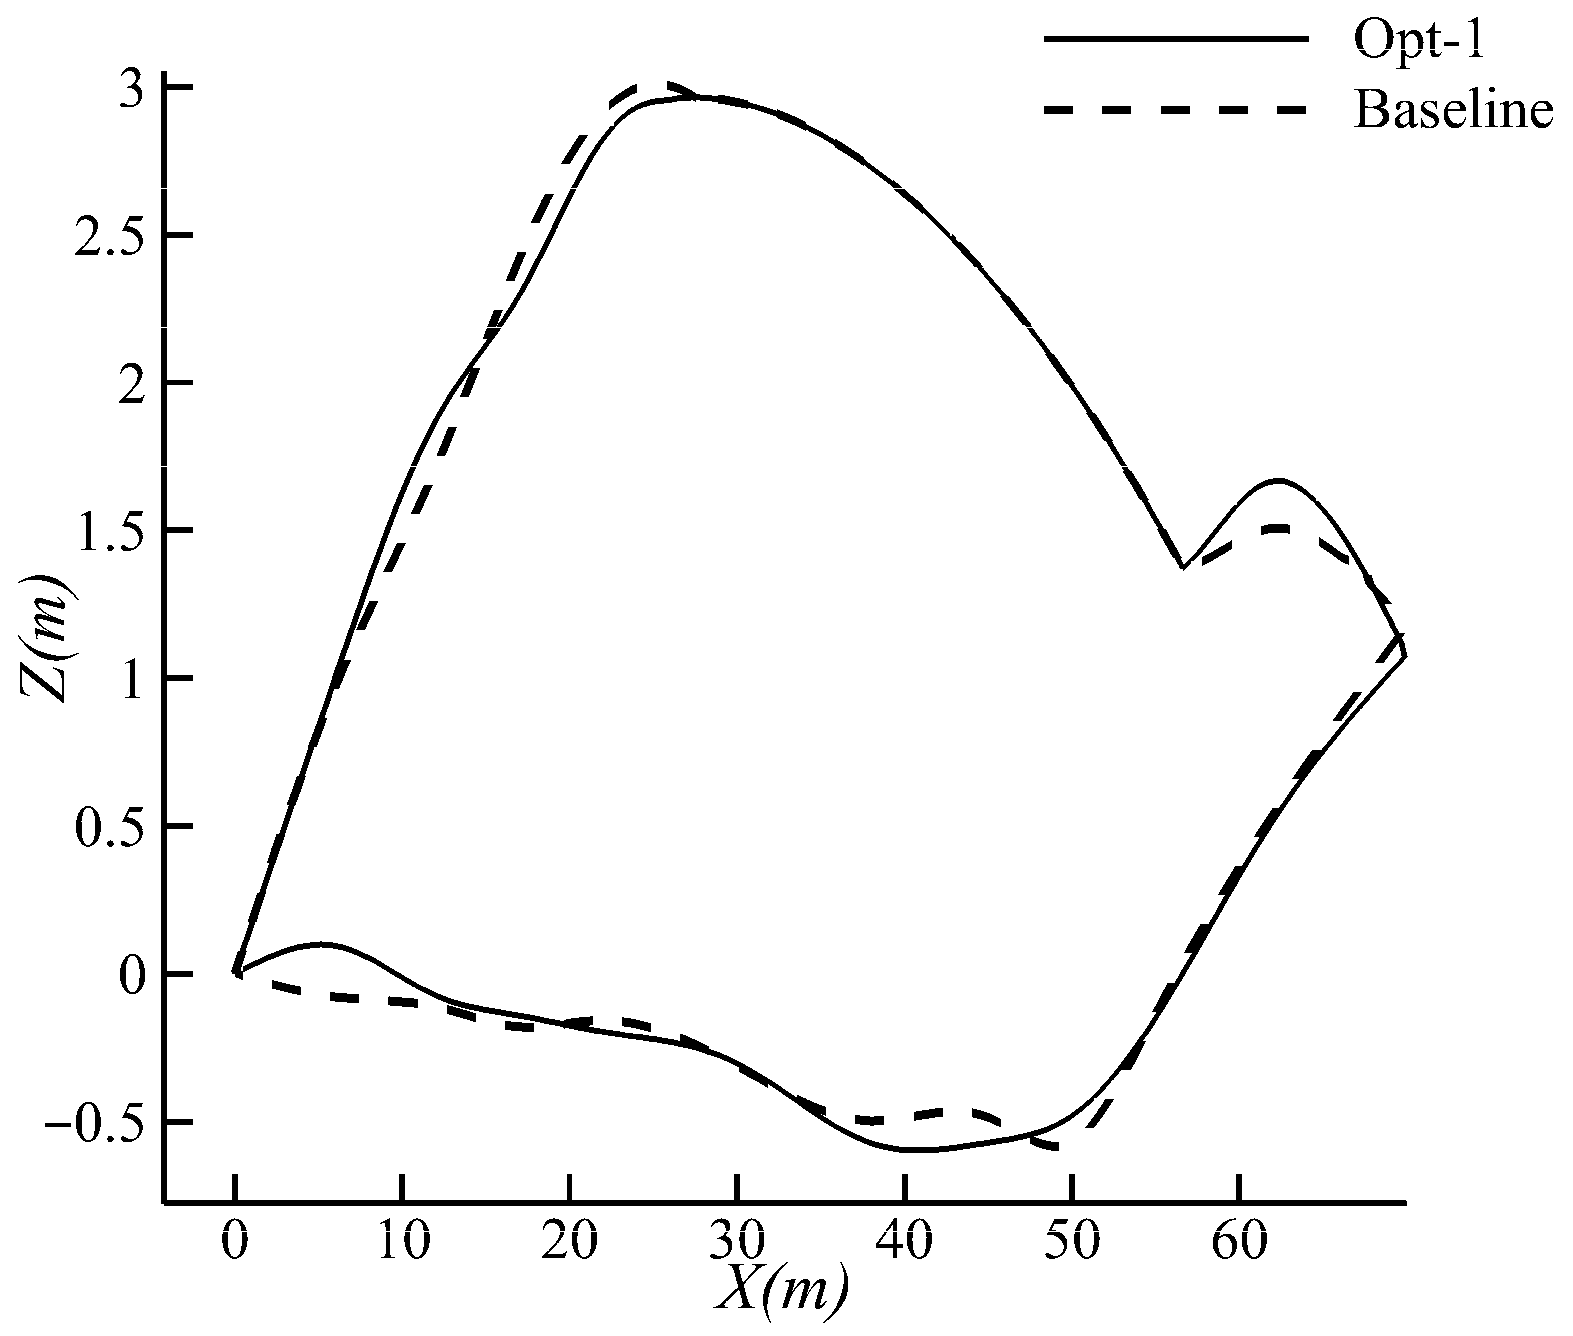
Figure 20 shows a comparison of the longitudinal symmetry-plane shapes of the configurations before and after optimization. Notably, the optimized fuselage exhibits a more pronounced nose-down droop angle, while the mid-fuselage shape is smoother. Liu et al. [32] noted that increasing the nose-down pitch is conducive to mitigating sonic boom loudness, which is aligns well with the optimization results in this study.
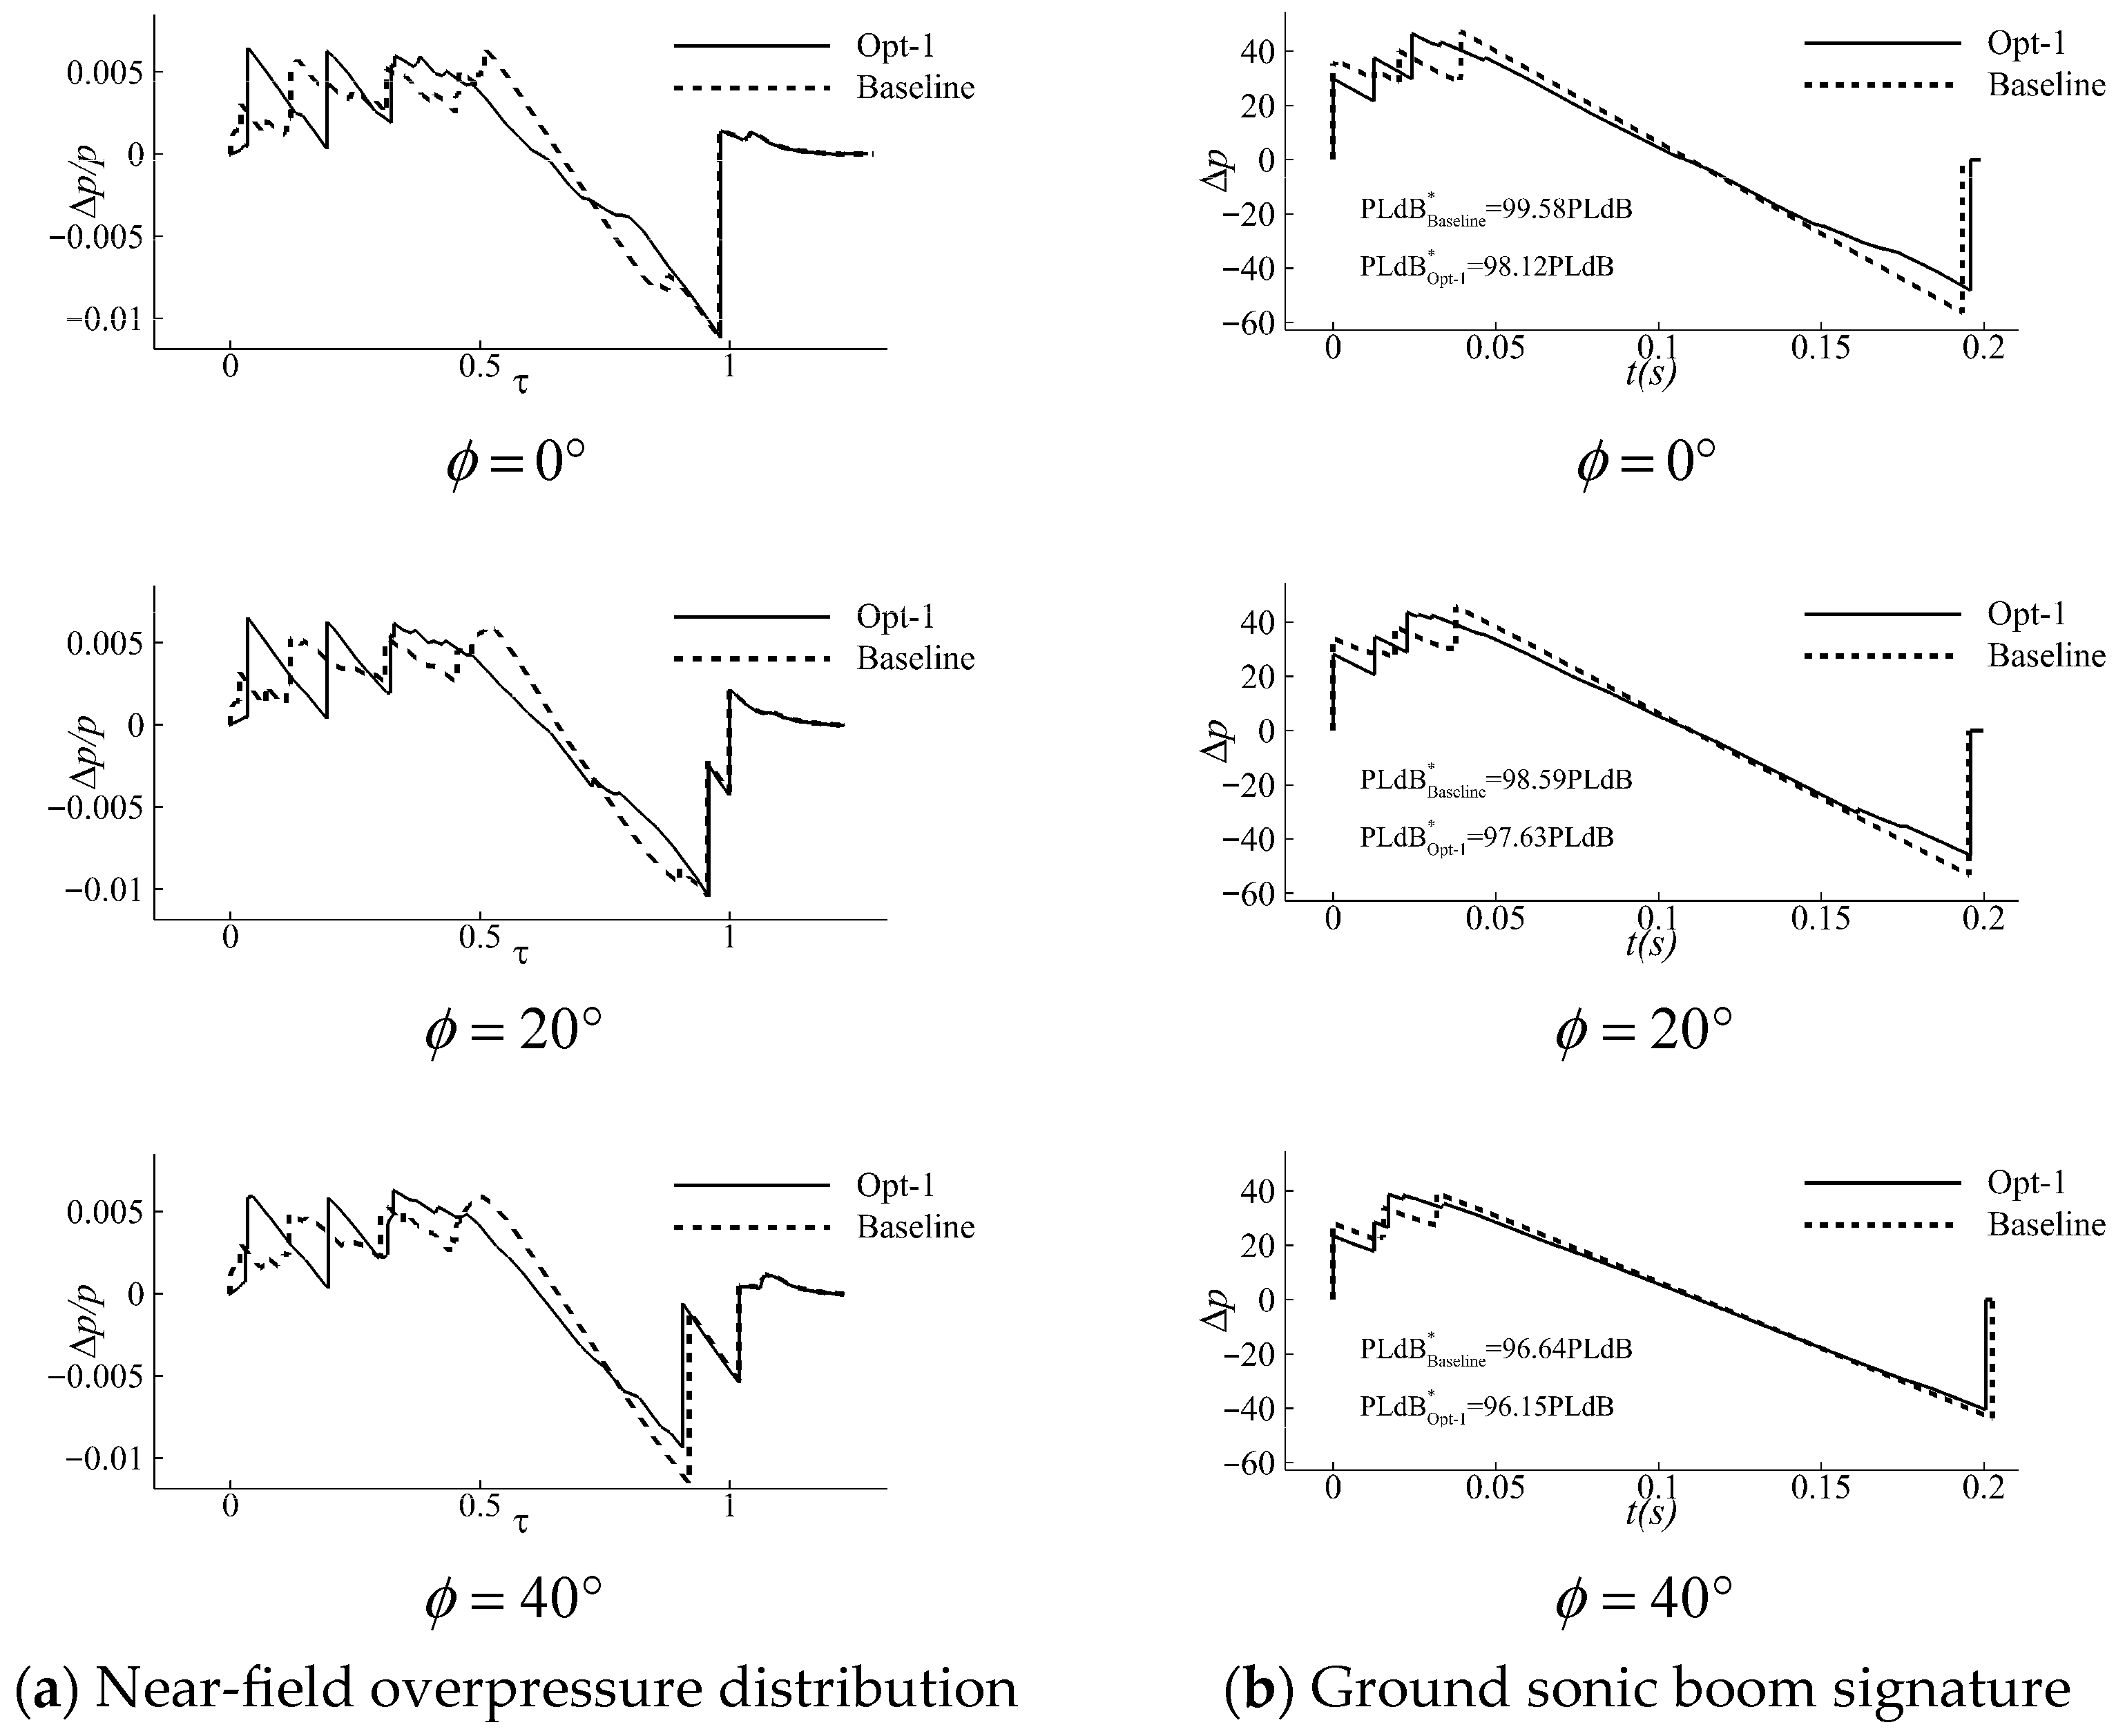
The change in the near-field overpressure signal for each off-track angle exhibit consistent evolutionary trends before and after optimization, as shown in Figure 21a. The forebody of Opt-1 has three weak shocks, one fewer than the baseline configuration, and the shock magnitude has not increased. The baseline configuration exhibits an aft-shock near the ϕ = 0 ° and ϕ = 20 ° directions, while Opt-1 does not. In the ϕ = 40 ° direction, the tail shock strength of Opt-1 is significantly attenuated compared to the baseline configuration.
A comparative analysis of the ground sonic boom signature is shown in Figure 21b. The peak overpressure is reduced at every off-track angle, and the tail shock strength also exhibits a marginal reduction. These factors collectively facilitate the systematic reduction in the PLdB. Furthermore, the sonic boom suppression effect is more pronounced closer to the point directly beneath the flight track (i.e., at smaller ϕ ).

4.4. Overall Aircraft Optimization

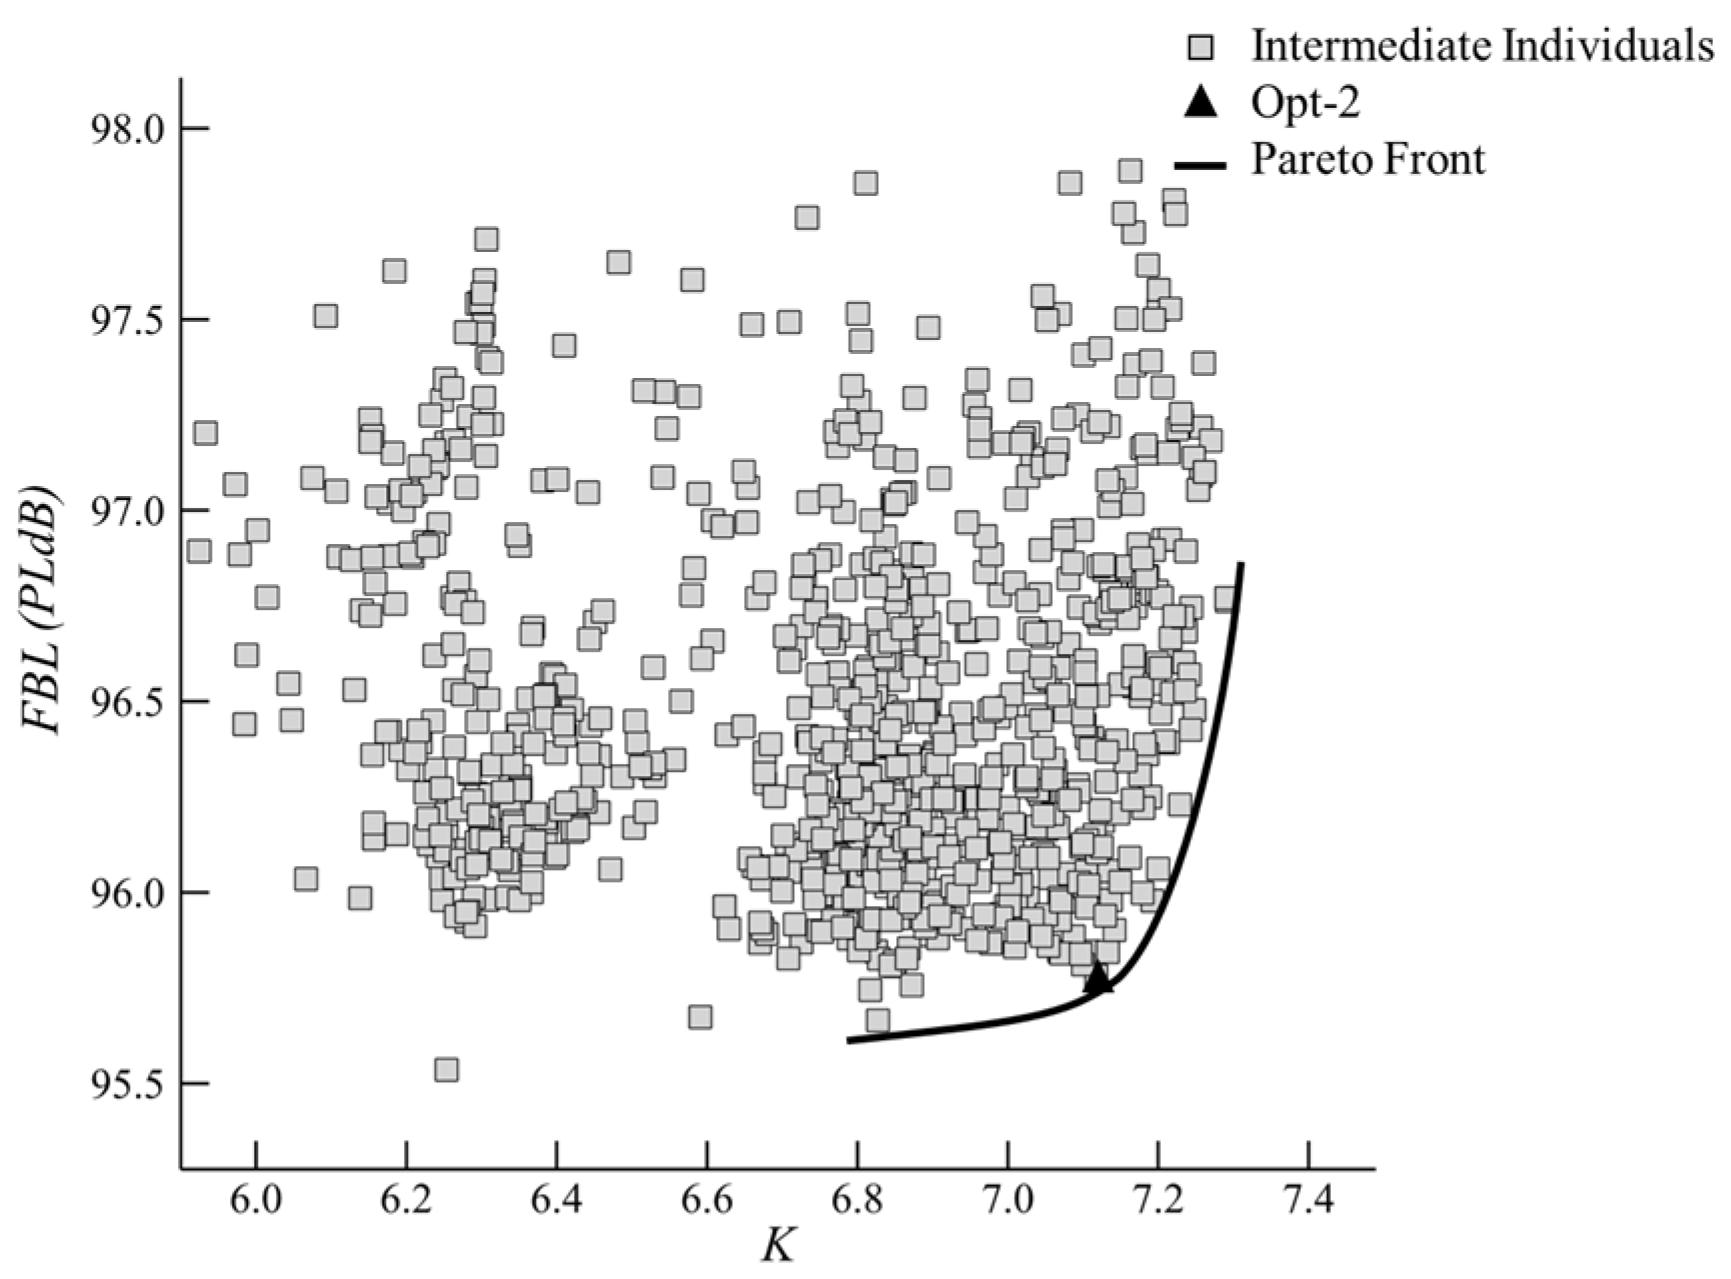
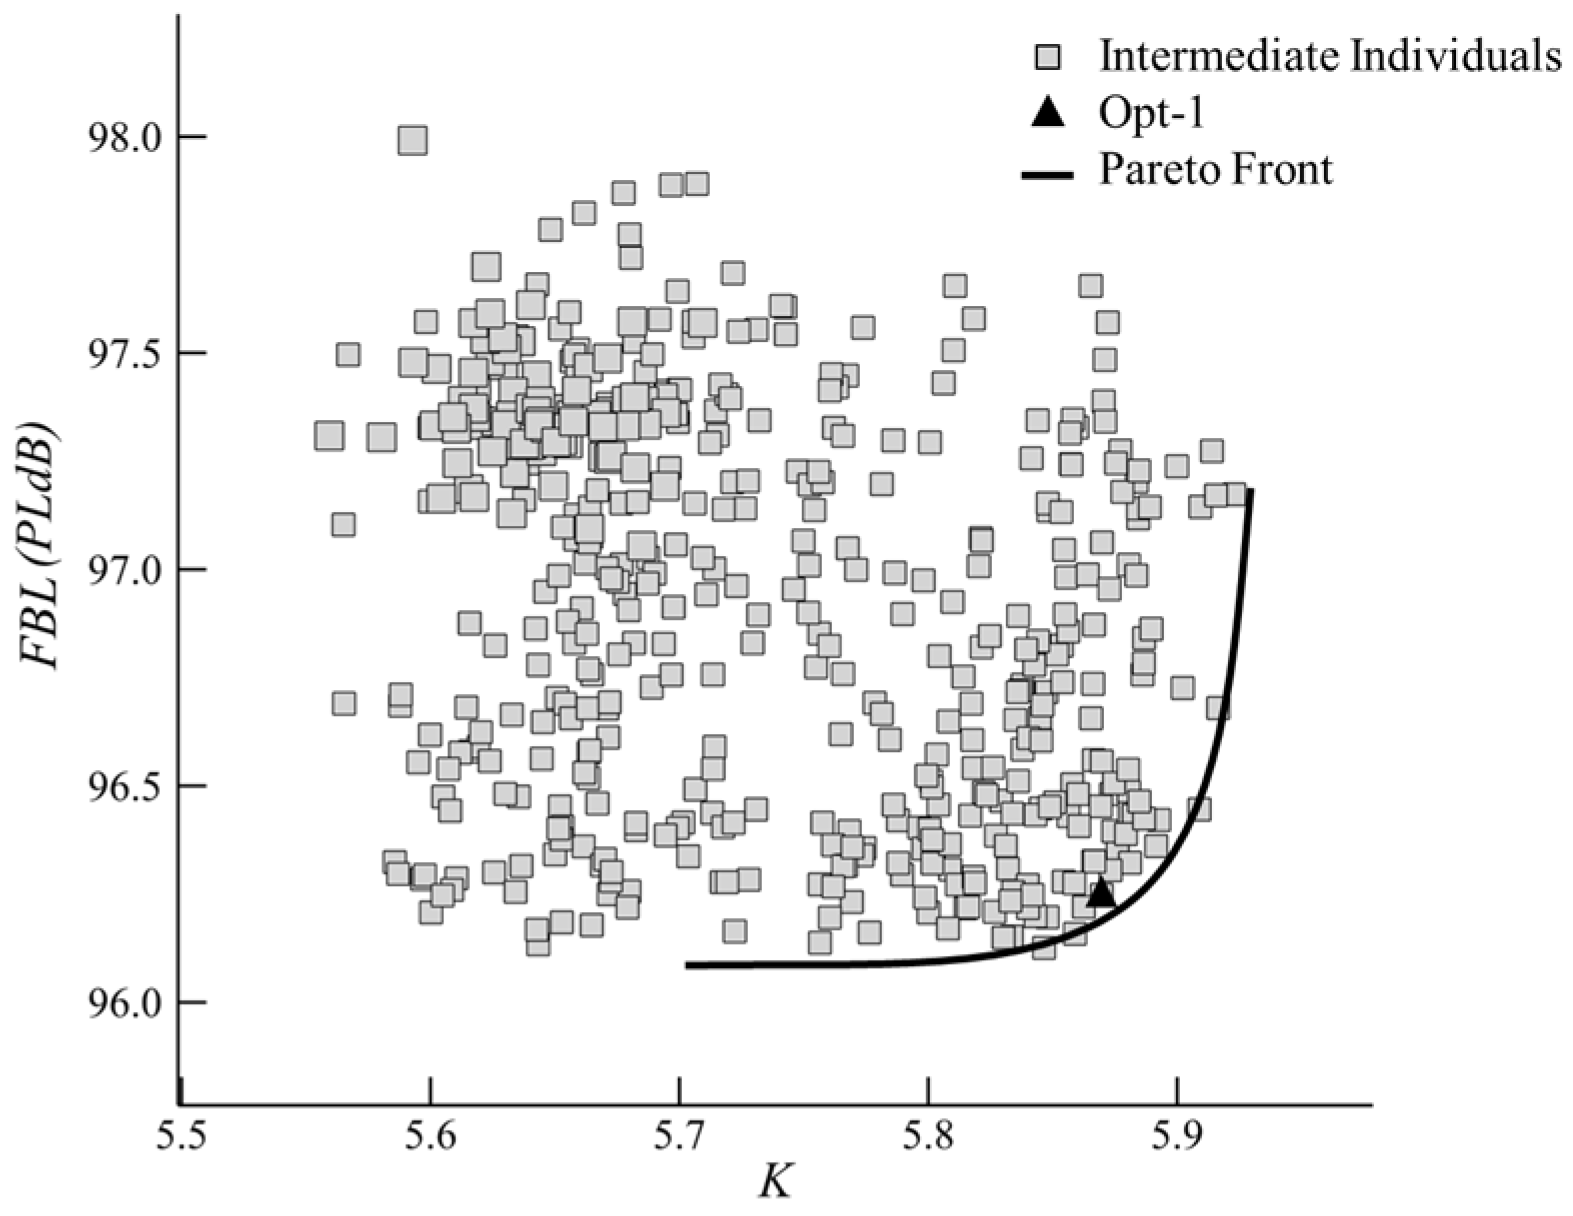
Subsequently, an optimization was then performed simultaneously on the wing, fuselage, and tail. The convergence trajectory and optimization results are shown in Figure 22. A representative solution, designated as Opt-2, was selected from the Pareto front. Opt-2 has a lift-to-drag ratio of K O p t - 2 = 7.12 , which achieves a substantial enhancement of 1.51 compared to the baseline configuration, and an FBL of F B L O p t - 2 = 95.78 PLdB , resulting in a reduction of 1.09 PLdB relative to the baseline.
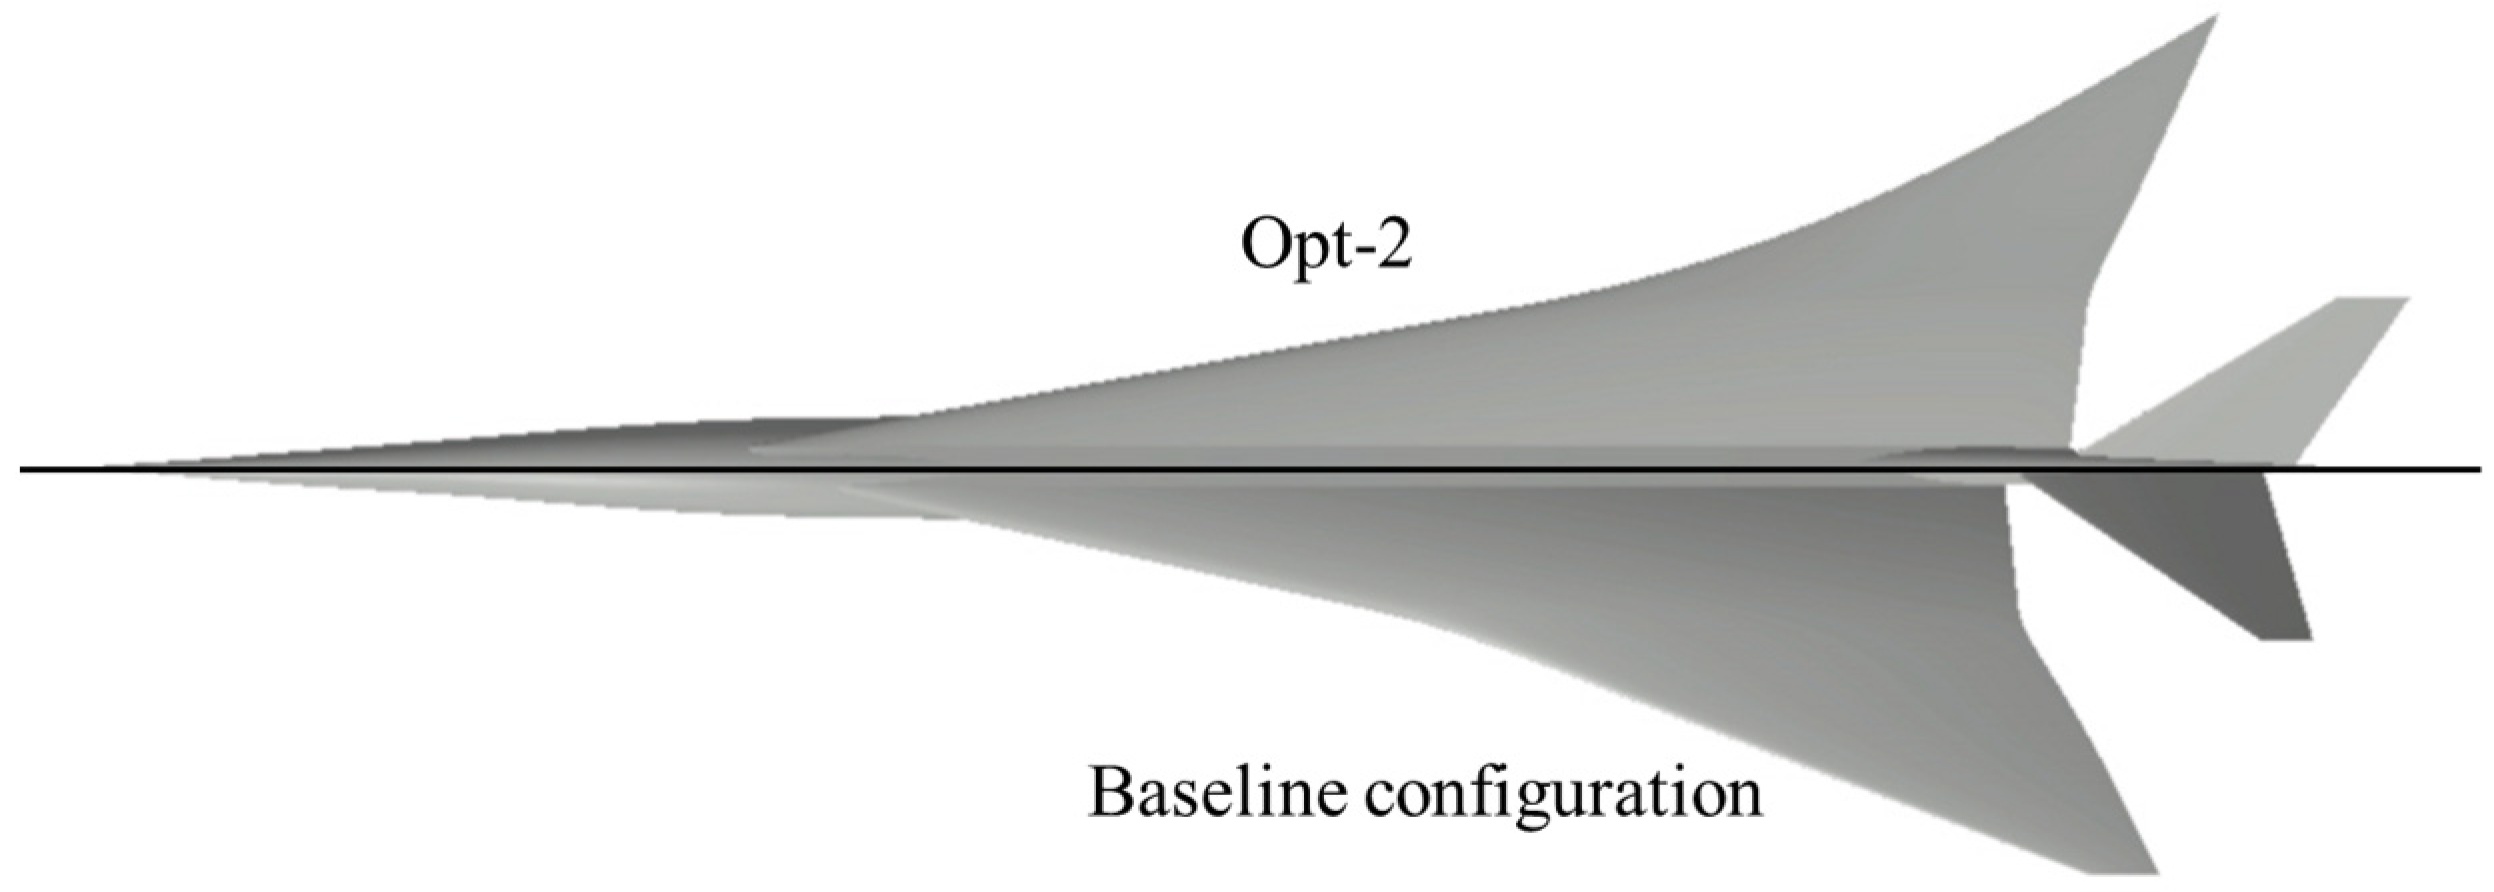
Figure 23 compares the aerodynamic configuration of Opt-2 with the baseline configuration. Opt-2 has a more pronounced global wing sweep and an increased dihedral angle, corroborating the findings of Chen et al. [40] regarding sonic boom suppression by dihedral angle. The tail of Opt-2 is shifted aft along the longitudinal axis and its sweep angle is increased. This effectively augments the equivalent fineness ratio, which helps reduce sonic boom.
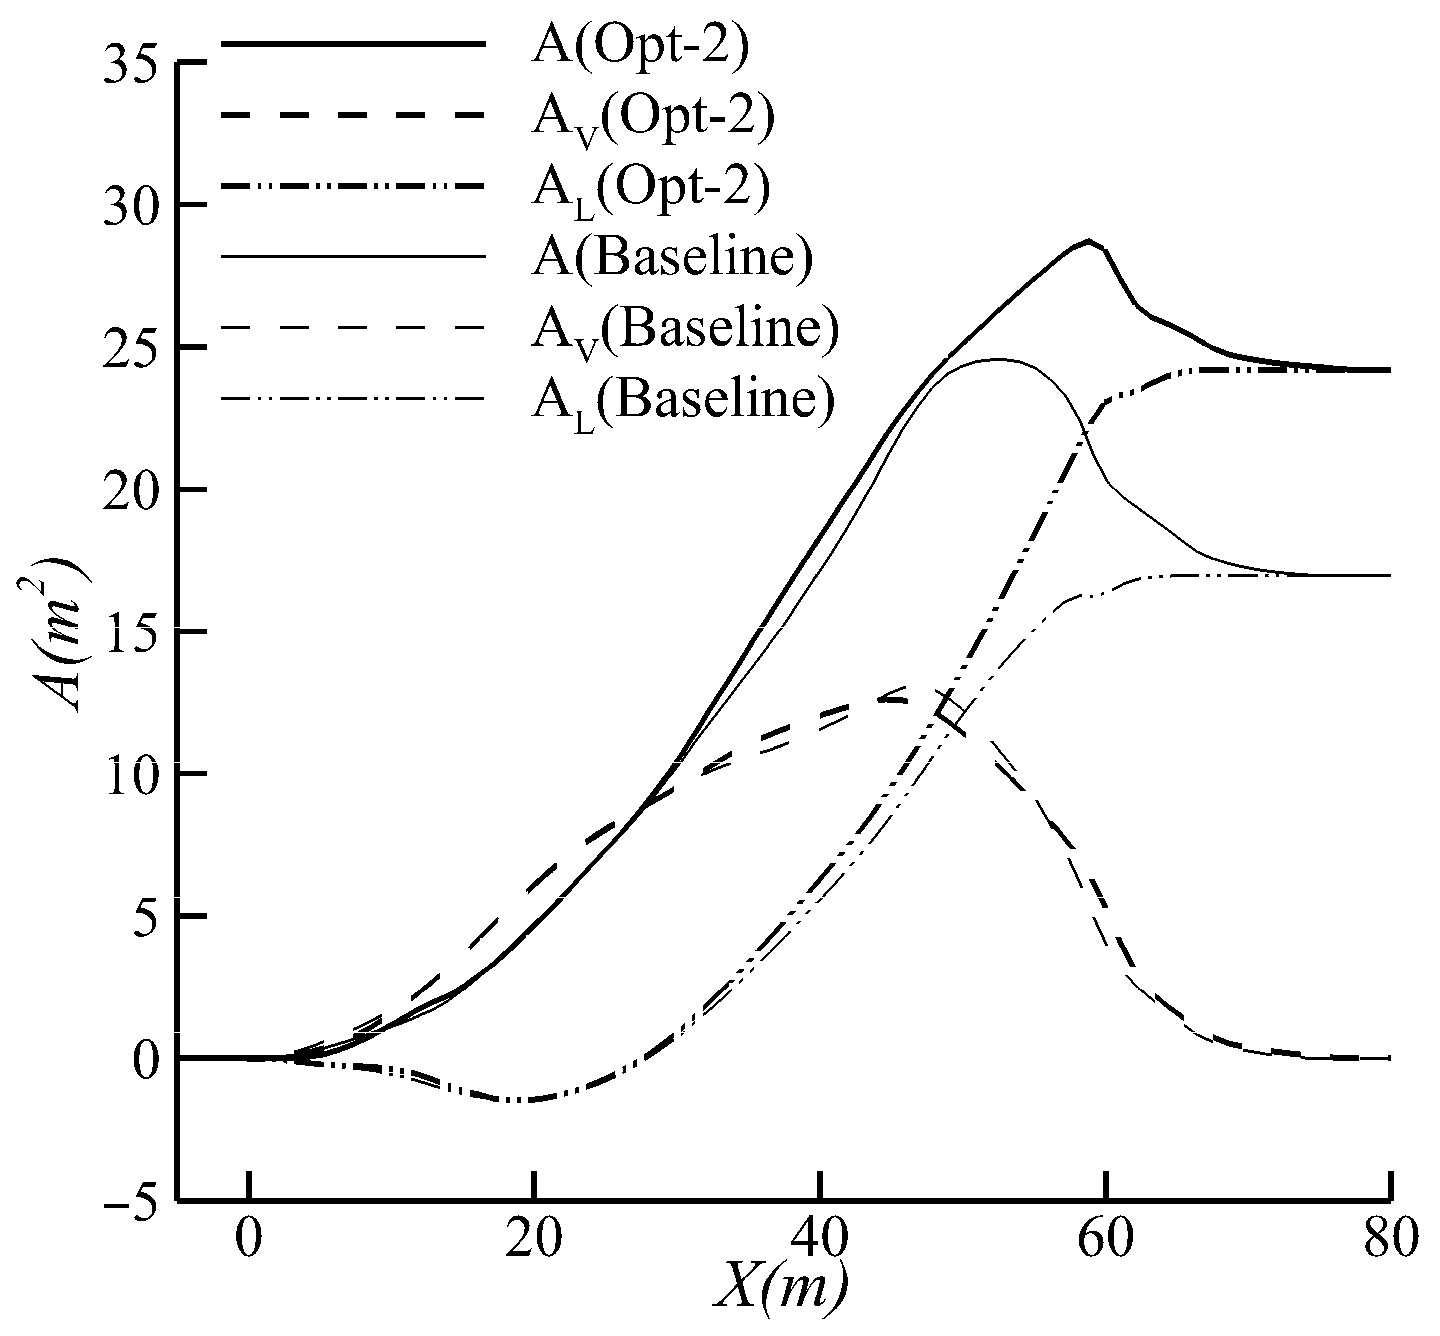
Figure 24 shows the comparison of the equivalent area distributions of Opt-2 and the baseline configuration in the ϕ = 0 ° direction. Due to constraints imposed during optimization of fuselage volume and wing area, the change in the volume component of equivalent area is negligible. The lift component increased significantly after optimization, which is the main reason for the change in the equivalent area distribution. The maximum value of the equivalent area increased from 24.5   m 2 to 28.7   m 2 , and the peak position exhibited a distinct longitudinal rearward shift from 52.0 m to 58.8 m. In addition, the distribution profile became more peaked.
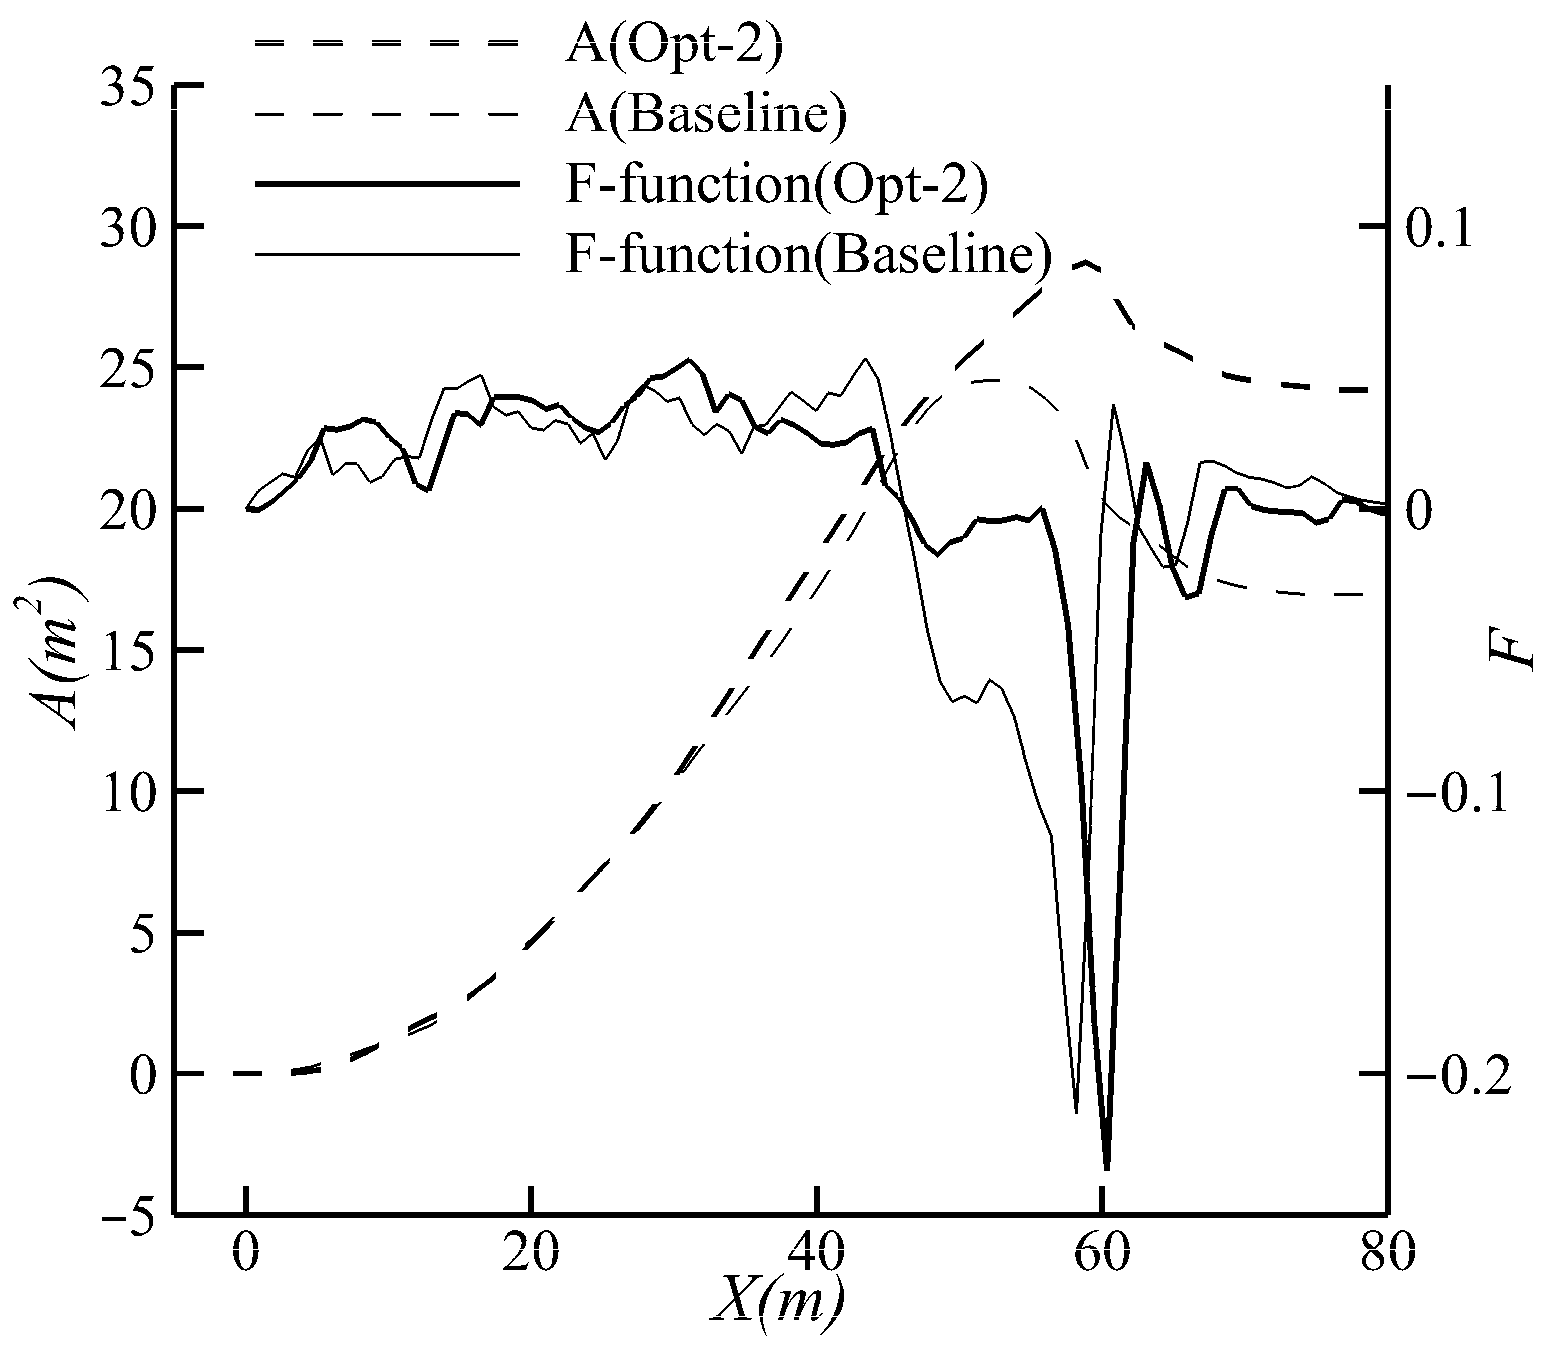
The change in the Whitham F-function in the ϕ = 0 ° direction is shown in Figure 25. A local maximum appears in the F-function near the inflection point of the equivalent area curve. After optimization, the peak shifted rearward and became narrower. Furthermore, the F-function curve of the baseline configuration has a peak near X = 50   m , which is significantly reduced after optimization.
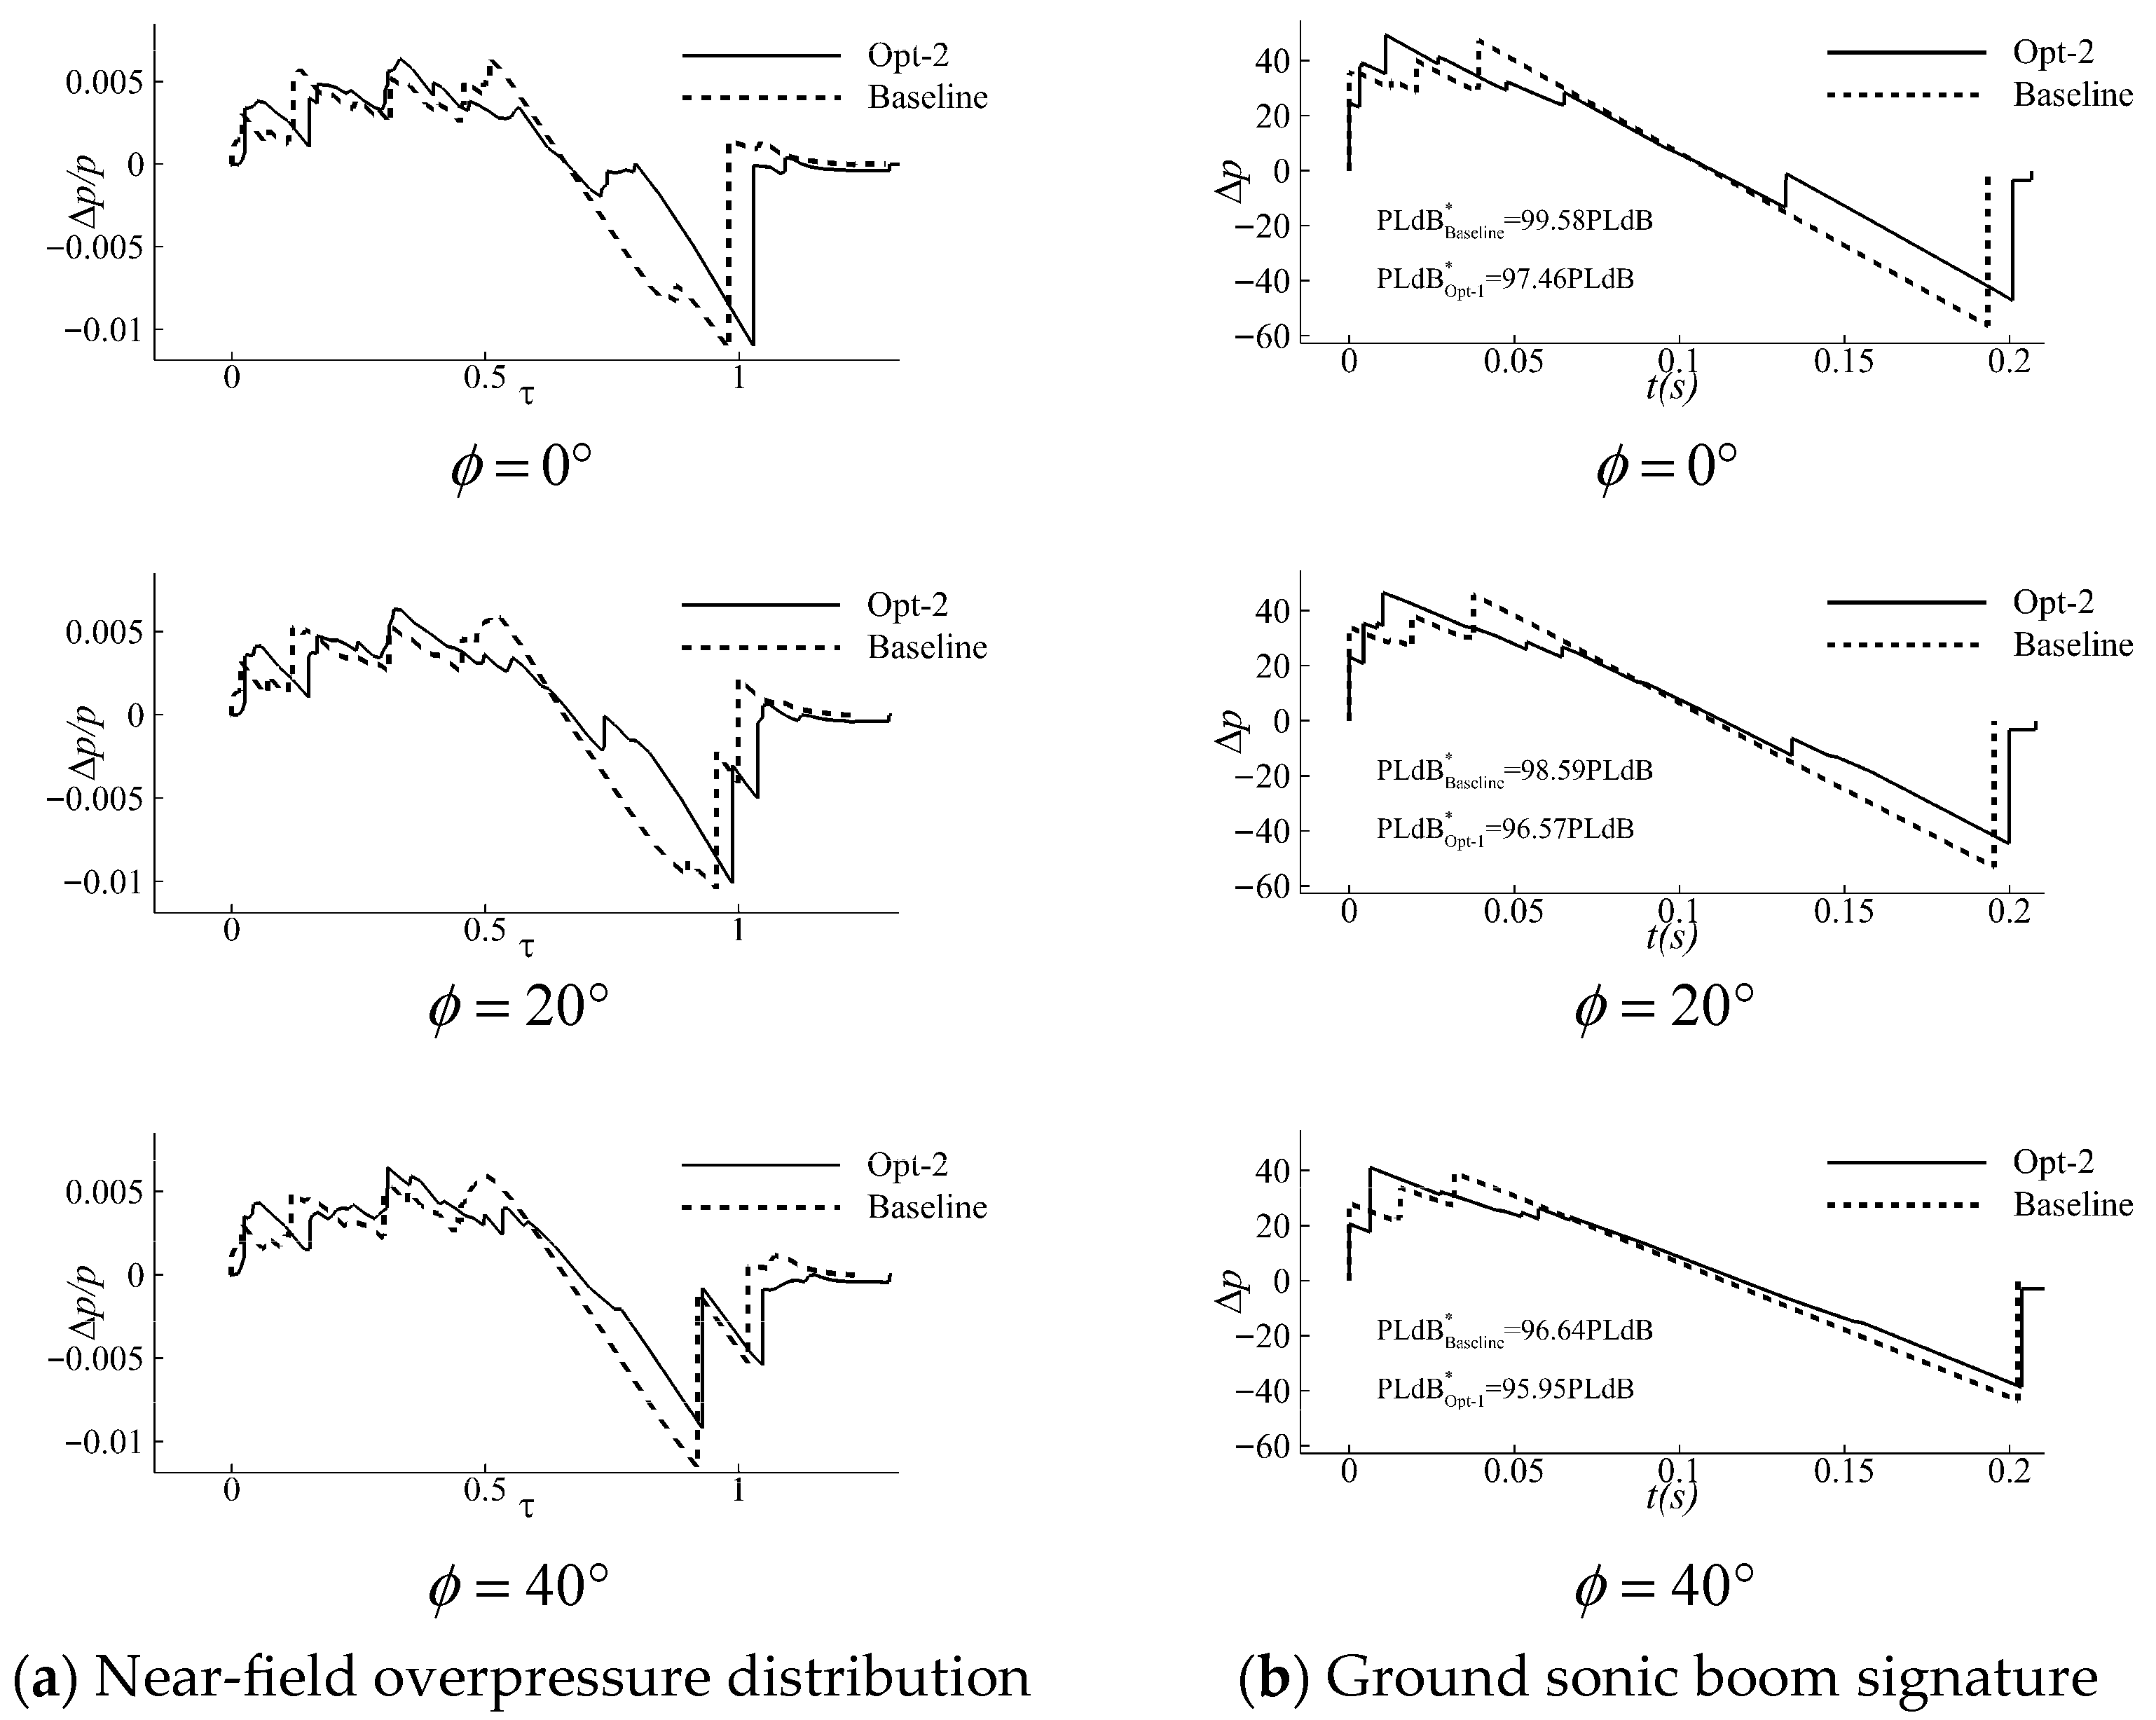
A comparison of the near-field overpressure signals for Opt-2 and the baseline configuration is shown in Figure 26a. Similarly to the fuselage optimization result, the initial four-stage shock system was consolidated into three discrete weak compressions, and the peak overpressure magnitudes were further mitigated. Opt-2 replaced the strong aft-shock of the baseline configuration near τ = 0.9 with a very weak aft-shock near τ = 0.7 .
A comparison of the ground sonic boom signatures is shown in Figure 26b. The strength of the leading shock of Opt-2 is significantly reduced at every off-track angle. In the ϕ = 0 ° and ϕ = 20 ° directions, the strength of the tail shock of Opt-2 is markedly diminished because the weak shock near t = 0.14   s collectively raises the aft-shock body waveform. This shock did not appear in the ϕ = 40 ° direction; however, the trailing shock still exhibits a marginal attenuation.
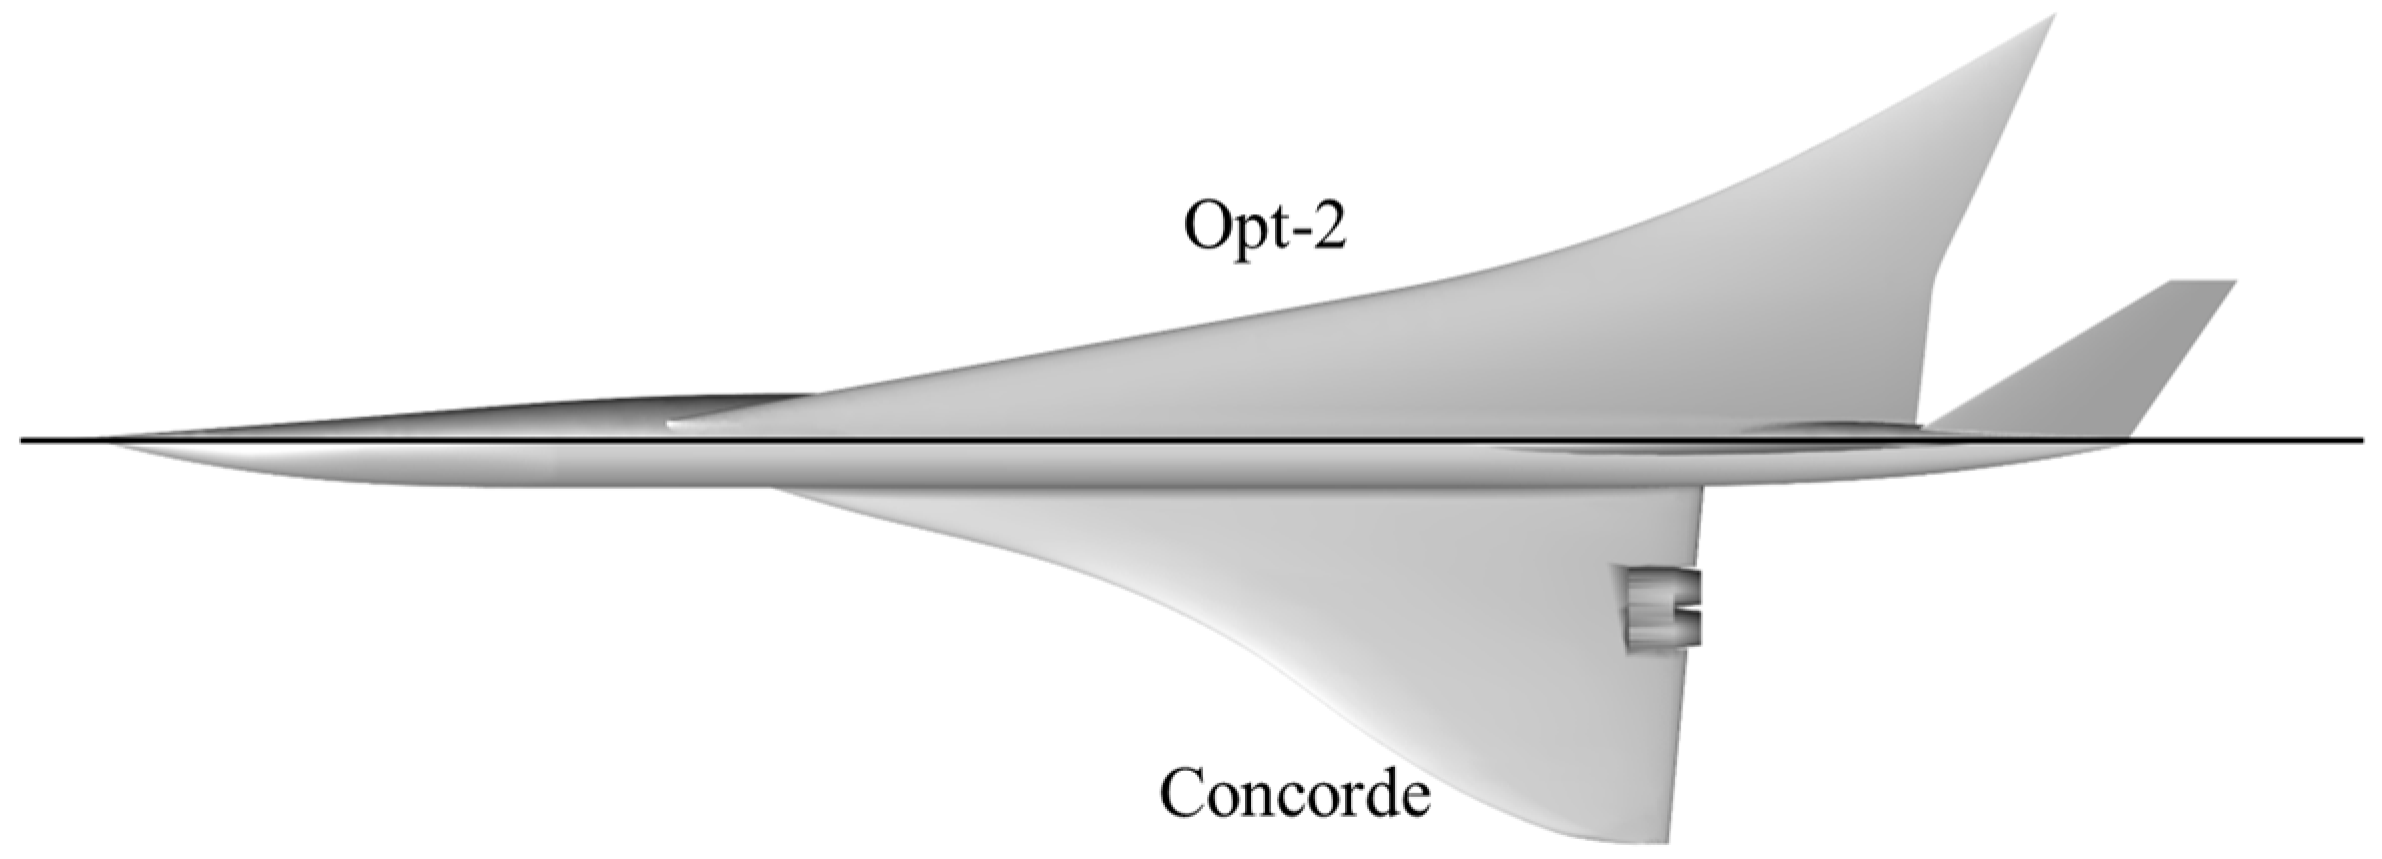
Figure 27 illustrates the geometric evolution from the historical Concorde to the current optimized Opt-2 configuration. While the Concorde design was primarily driven by wave drag minimization (e.g., ogival delta wing and Sears–Haack body theory), the Opt-2 geometry incorporates low-boom shaping principles. Key differences include a significantly higher fineness ratio and a tailored wing-body planform designed to prevent shock coalescence. This transition from ‘performance-only’ to ‘signature-managed’ design ensures that the pressure disturbances are distributed more evenly, effectively reducing the perceived sonic boom loudness at ground level.

5. Conclusions

This study developed an efficient full-carpet sonic boom and aerodynamic prediction software, AERO-BOOM, and established an MDO design platform for full-carpet sonic boom and aerodynamic performance of supersonic civil aircraft. Based on this platform, an optimization study was performed on a supersonic civil aircraft configuration with a V-tail layout, leading to the following conclusions:
  • AERO-BOOM uses the Panel Method to evaluate aerodynamic characteristics of supersonic civil aircraft, applies the Modified Linearized Theory to predict near-field overpressure, uses the WPM to propagate signatures to the ground, and applies Stevens’ Mark VII method to convert the signature into PLdB, which is then averaged to obtain the FBL. The computational fidelity of all modules have been benchmarked against established cases, and the accuracy meets the requirements for the conceptual design stage of supersonic civil aircraft.
  • Based on AERO-BOOM, an MDO design platform for full-carpet sonic boom and aerodynamic performance was established, using the HSADE optimization algorithm combined with RSM, and integrating open-source or commercial tools such as CST modeling and Pointwise. This platform offers significant practical utility for the conceptual design of supersonic civil aircraft.
  • Using the established optimization platform, fuselage optimization and overall aircraft optimization were performed on a supersonic civil aircraft with a V-tail layout, yielding Pareto fronts for both the lift-to-drag ratio and FBL. Compared with the baseline configuration, the representative solution from the fuselage optimization, Opt-1, attained an increment of 0.26 in lift-to-drag ratio and a reduction of 0.62 PLdB in FBL; the representative solution from the overall aircraft optimization, Opt-2, showed an increase of 1.51 in lift-to-drag ratio and a reduction of 1.09 PLdB in FBL. The optimization results demonstrate the efficacy of the full-carpet sonic boom and aerodynamic MDO method developed in this study.
In summary, this study conducted optimization under supersonic cruise conditions using a fixed angle of attack, primarily to demonstrate the feasibility and effectiveness of the current design framework. Despite the positive results, several limitations remain to be addressed. The current optimization involves a simplified treatment of aircraft control characteristics, such as trim and stability, by only constraining the tail volume coefficient to match the baseline. Considering practical mission requirements, future work will incorporate constant-lift optimization and further refine the design framework by integrating stability margins and trim drag into the objective functions. Such advancements will facilitate a robust MDO framework encompassing sonic boom, aerodynamics, and control characteristics.
Furthermore, to control computational cost, this study optimized only the conceptual configuration. Future research should consider incorporating fuselage cross-section shape and wing and tail airfoil sections as design variables for more detailed optimization.
While the current study focuses on the demonstration of the design framework, it is acknowledged that the HSADE optimizer is stochastic. For practical engineering deployment, users are encouraged to conduct multiple optimization runs to assess solution variability and ensure a statistically robust final design.

Author Contributions

Conceptualization, all authors (Y.D., C.W., R.L. and H.C.); methodology, Y.D., C.W. and R.L.; software, Y.D. and R.L.; validation, Y.D.; investigation, Y.D.; writing—original draft preparation, Y.D.; writing—review and editing, Y.D. and H.C.; visualization, Y.D. All authors have read and agreed to the published version of the manuscript.

Funding

This research received no external funding.

Data Availability Statement

All data used during the study appear in the submitted article.

Conflicts of Interest

The authors declare no conflicts of interest.

Abbreviations

AERO-BOOMFull-carpet sonic boom and aerodynamic characteristics prediction software
HSADEHybrid surrogate-aided differential evolution optimization algorithm
FBLFull-carpet sonic boom loudness
WPMWaveform Parameter Method
CFDComputational Fluid Dynamics
MODMultidisciplinary Optimization
JSGDJones–Seebass–George–Darden
MOGAMulti-Objective Genetic Algorithm
ϕ off-track angle
RANSReynolds-Averaged Navier–Stokes
RSMResponse Surface Methodology
PLDBPerceived Loudness in Decibels
C p Surface pressure coefficient
L Lift
D Inviscid drag
K Lift-to-drag ratio
M a Freestream Mach number
γ Ratio of specific heats of air
S Area
F Whitham F-function
A Equivalent area
A V Body component of equivalent area
A L Lift component of equivalent area
y max Coordinate of the sonic boom carpet cutoff point
DWB69° Delta Wing-Body Model
SBPW-1First AIAA Sonic Boom Prediction Workshop
DEDifferential Evolution
Λ Sweep angle
Γ Dihedral angle
θ Twist angle
r Radius of cross-section
V f Fuselage volume
X t Leading-edge coordinates of the tail root
A R Aspect ratio
λ Taper ratio

References

  1. Zhang, L.; Song, W.; Han, Z.; Qian, Z.; Song, B. Recent Progress of Sonic Boom Generation, Propagation, and Mitigation Mechanism. Acta Aeronaut. Astronaut. Sin. Chin. 2022, 43, 025649. [Google Scholar] [CrossRef]
  2. Li, J.; Chen, Q.; Wang, W.; Han, Z.; Tan, Y.; Ding, Y.; Xie, L.; Qiao, J.; Song, K.; Ai, J. Design of Low Sonic Boom High Efficiency Layout for Advanced Supersonic Civil Aircraft. Acta Aeronaut. Astronaut. Sin. Chin. 2024, 45, 629613. [Google Scholar] [CrossRef]
  3. Shan, C.; Gong, T.; Yi, L.; Yang, H.; Long, Y. High-Efficiency and High-Reliability Sonic Boom/Aerodynamic Multidisciplinary Optimization Method for Supersonic Civil Aircraft. Acta Aeronaut. Astronaut. Sin. Chin. 2024, 45, 51–68. [Google Scholar] [CrossRef]
  4. Han, Z.; Qiang, Z.; Qiao, J. Sonic Boom Prediction and Low-Boom Design Method; Science Press: Beijing, China, 2022. [Google Scholar]
  5. Liu, B.; Gao, B.; Pan, R. Economic Research on Major Supersonic Civil Aircrafts and Its Implications. In Proceedings of the 6th China Aeronautical Science and Technology Conference (CASTC 2023), Wuzhen, China, 26–27 September 2023; pp. 58–64. (In Chinese) [Google Scholar]
  6. U.S. Supersonic Commercial Aircraft: Assessing NASA’s High Speed Research Program; National Academies Press: Washington, DC, USA, 1997; p. 5848. ISBN 978-0-309-05878-0.
  7. Bonavolontà, G.; Lawson, C.; Riaz, A. Review of Sonic Boom Prediction and Reduction Methods for Next Generation of Supersonic Aircraft. Aerospace 2023, 10, 917. [Google Scholar] [CrossRef] [Scilit]
  8. Rötger, T.; Eyers, C.; Fusaro, R. A Review of the Current Regulatory Framework for Supersonic Civil Aircraft: Noise and Emissions Regulations. Aerospace 2024, 11, 19. [Google Scholar] [CrossRef] [Scilit]
  9. Morgenstern, J.; Norstrud, N.; Stelmack, M.; Skoch, C. Final Report for the Advanced Concept Studies for Supersonic Commercial Transports Entering Service in the 2030 to 2035 Period, N+3 Supersonic Program; NASA: Washington, DC, USA, 2010. [Google Scholar]
  10. Whitham, G.B. The Flow Pattern of a Supersonic Projectile. Commun. Pure Appl. Math. 1952, 5, 301–348. [Google Scholar] [CrossRef] [Scilit]
  11. Walkden, F. The Shock Pattern of a Wing-Body Combination, Far from the Flight Path. Aeronaut. Q. 1958, 9, 164–194. [Google Scholar] [CrossRef] [Scilit]
  12. Carlson, H.W. Simplified Sonic-Boom Prediction; NASA: Washington, DC, USA, 1978. [Google Scholar]
  13. Thomas, C.L. Extrapolation of Sonic Boom Pressure Signatures by the Waveform Parameter Method; NASA: Washington, DC, USA, 1972. [Google Scholar]
  14. Cheung, S.H.; Edwards, T.A.; Lawrence, S.L. Application of CFD to Sonic Boom near and Mid Flow-Field Prediction. In Proceedings of the 13th Aeroacoustics Conference, Tallahassee, FL, USA, 22–24 October 1990. [Google Scholar]
  15. Siclari, M.J.; Darden, C.M. An Euler Code Prediction of near Field to Midfield Sonic Boom Pressure Signatures. J. Aircr. 1993, 30, 911–917. [Google Scholar] [CrossRef] [Scilit]
  16. Aftosmis, M.; Nemec, M.; Cliff, S. Adjoint-Based Low-Boom Design with Cart3D (Invited). In Proceedings of the 29th AIAA Applied Aerodynamics Conference; American Institute of Aeronautics and Astronautics: Reno, NV, USA, 2012. [Google Scholar]
  17. Park, M.A.; Morgenstern, J.M. Summary and Statistical Analysis of the First AIAA Sonic Boom Prediction Workshop. J. Aircr. 2016, 53, 578–598. [Google Scholar] [CrossRef] [Scilit]
  18. Park, M.A.; Aftosmis, M.J.; Campbell, R.L.; Carter, M.B.; Cliff, S.E.; Bangert, L.S. Summary of the 2008 NASA Fundamental Aeronautics Program Sonic Boom Prediction Workshop. J. Aircr. 2014, 51, 987–1001. [Google Scholar] [CrossRef] [Scilit]
  19. Alonso, J.; Jameson, A.; Kroo, I. Advanced Algorithms for Design and Optimization of Quiet Supersonic Platforms. In Proceedings of the 40th AIAA Aerospace Sciences Meeting & Exhibit, Reno, NV, USA, 14–17 January 2002; American Institute of Aeronautics and Astronautics: Reston, VA, USA. [Google Scholar]
  20. Meredith, K.; Dahlin, J.; Graham, D.; Malone, M.; Haering, E.; Page, J.; Plotkin, K. Computational Fluid Dynamics Comparison and Flight Test Measurement of F-5E Off-Body Pressures. In Proceedings of the 43rd AIAA Aerospace Sciences Meeting and Exhibit, Reno, NV, USA, 10–13 January 2005; American Institute of Aeronautics and Astronautics: Reston, VA, USA. [Google Scholar]
  21. Laflin, K.; Klausmeyer, S.; Chaffin, M. A Hybrid Computational Fluid Dynamics Procedure for Sonic Boom Prediction. In Proceedings of the 24th AIAA Applied Aerodynamics Conference, San Francisco, CA, USA, 5–8 June 2006; American Institute of Aeronautics and Astronautics: Reston, VA, USA. [Google Scholar]
  22. Park, M.A.; Nemec, M. Nearfield Summary and Statistical Analysis of the Second AIAA Sonic Boom Prediction Workshop. J. Aircr. 2019, 56, 851–875. [Google Scholar] [CrossRef] [Scilit]
  23. Graziani, S.; Petrosino, F.; Jäschke, J.; Glorioso, A.; Fusaro, R.; Viola, N. Evaluation of Sonic Boom Shock Wave Generation with CFD Methods. Aerospace 2024, 11, 484. [Google Scholar] [CrossRef] [Scilit]
  24. Cleveland, R.O. Propagation of Sonic Booms Through a Real, Stratified Atmosphere; The University of Texas at Austin: Austin, TX, USA, 1995. [Google Scholar]
  25. Zhao, J.; Gu, L.; Ma, H. A Rapid Approach to Convective Aeroheating Prediction of Hypersonic Vehicles. Sci. China Technol. Sci. 2013, 56, 2010–2024. [Google Scholar] [CrossRef] [Scilit]
  26. An, X.; Kang, W.; Li, G.; Xu, M. Hypersonic Vehicle Aerodynamics; Northwestern Polytechnical University Press: Xian, China, 2022. [Google Scholar]
  27. Huang, T.; He, G.; Wang, Q. Calculation of Aerodynamic Characteristics of Hypersonic Vehicles Based on the Surface Element Method. Adv. Aerosp. Sci. Technol. 2022, 7, 112–122. [Google Scholar] [CrossRef]
  28. Li, P.; Gao, Z. An Engineering Method of Aerothermodynamic Environments Prediction for Complex Reentry Configurations. In Proceedings of the AIAA SPACE 2014 Conference and Exposition, San Diego, CA, USA, 4–7 August 2014; American Institute of Aeronautics and Astronautics: Reston, VA, USA. [Google Scholar]
  29. Darden, C.M. Sonic-Boom Minimization with Nose-Bluntness Relaxation; National Aeronautics and Space Administration, Scientific and Technical Information Office: Springfield, VA, USA, 1979. [Google Scholar]
  30. Feng, X.; Li, Z.; Song, B. Research of Low Boom and Low Drag Supersonic Aircraft Design. Chin. J. Aeronaut. 2014, 27, 531–541. [Google Scholar] [CrossRef] [Scilit]
  31. Yang, C.; Tan, Y.; Wang, W.; Zhao, Y.; Yu, X. Multidisciplinary Optimization with Low-Boom Design for Supersonic Civil Aircraft Conceptual Design. Acta Aeronaut. Astronaut. Sin. Chin. 2025, 46, 115–134. [Google Scholar] [CrossRef]
  32. Liu, S.; Bai, J.; Yu, P.; Chen, B.; Zhou, B. Aerodynamic Optimization Design on Supersonic Transports Considering Sonic Boom Intensity. Northwest. Polytech. Univ. Chin. 2020, 38, 271–278. [Google Scholar] [CrossRef] [Scilit]
  33. Liu, G.; Huang, J.; Zhou, Z.; Chen, Z.; Gao, Z.; Zhong, S.; Xiao, H. Investigation of Supersonic Low Sonic Boom Aerodynamic Configuration Design. Acta Aerodyn. Sin. Chin. 2020, 38, 858–865. [Google Scholar] [CrossRef]
  34. Chan, M.K.-Y. Supersonic Aircraft Optimization for Minimizing Drag and Sonic Boom. Ph.D. Thesis, Stanford University, Stanford, CA, USA, 2003. [Google Scholar]
  35. Ordaz, I.; Li, W. Integration of Off-Track Sonic Boom Analysis for Supersonic Aircraft Conceptual Design. J. Aircr. 2014, 51, 23–28. [Google Scholar] [CrossRef] [Scilit]
  36. Nayani, S. Evaluation of Grid Modification Methods for On- and Off-Track Sonic Boom Analysis. In Proceedings of the 51st AIAA Aerospace Sciences Meeting including the New Horizons Forum and Aerospace Exposition, Grapevine, TX, USA, 7–10 January 2013; American Institute of Aeronautics and Astronautics: Reston, VA, USA. [Google Scholar]
  37. Ordaz, I.; Wintzer, M.; Rallabhandi, S.K. Full-Carpet Design of a Low-Boom Demonstrator Concept. In Proceedings of the 33rd AIAA Applied Aerodynamics Conference, Dallas, TX, USA, 22–26 June 2015; American Institute of Aeronautics and Astronautics: Reston, VA, USA. [Google Scholar]
  38. Kirz, J. Surrogate Based Shape Optimization of a Low Boom Fuselage Wing Configuration. In AIAA Aviation 2019 Forum; American Institute of Aeronautics and Astronautics: Reno, NV, USA, 2019. [Google Scholar]
  39. Anderson, G.R.; Aftosmis, M.J.; Nemec, M. Cart3D Simulations for the Second AIAA Sonic Boom Prediction Workshop. J. Aircr. 2019, 56, 896–911. [Google Scholar] [CrossRef] [Scilit]
  40. Chen, Q.; Han, Z.; Yang, H.; Ding, Y.; Qiao, J.; Zheng, K.; Song, W. Research on the Effect of Wing Dihedral on Full-Carpet Sonic Boom. Aerodyn. Res. Exp. Chin. 2024, 2, 50–58. [Google Scholar] [CrossRef]
  41. Chen, Q.; Han, Z.; Zhang, K.; Qiao, J.; Ding, Y.; Song, W. A Full-Carpet Design Optimization Method for Low-Boom Supersonic Civil Aircraft Configuration. Acta Aeronaut. Astronaut. Sin. Chin. 2025, 46, 324–339. [Google Scholar] [CrossRef]
  42. Deng, K.; Chen, H. A Hybrid Aerodynamic Optimization Algorithm Based on Differential Evolution and RBF Response Surface. In Proceedings of the 17th AIAA/ISSMO Multidisciplinary Analysis and Optimization Conference, Washington, DC, USA, 13–17 June 2016. [Google Scholar] [CrossRef] [Scilit]
  43. Stevens, S.S. Perceived Level of Noise by Mark VII and Decibels (E). J. Acoust. Soc. Am. 1972, 51, 575–601. [Google Scholar] [CrossRef] [Scilit]
  44. Zhang, B.; Yang, T.; Ma, Y.; Feng, Z.; Ge, J. Fast Computation of Hypersonic Gliding Lifting Body Aerodynamic Based on Configuration Parameters. In Proceedings of the 2015 7th International Conference on Intelligent Human-Machine Systems and Cybernetics; IEEE: New York, NY, USA, 2015; Volume 2, pp. 194–197. [Google Scholar]
  45. Anderson, J.D., Jr. Hypersonic and High-Temperature Gas Dynamics, 2nd ed.; American Institute of Aeronautics and Astronautics: Reston, VA, USA, 2006; ISBN 978-1-56347-780-5. [Google Scholar]
  46. Gentry, A.E.; Smyth, D.N.; Oliver, W.R. The Mark IV Supersonic-Hypersonic Arbitrary-Body Program. Volume II. Program Formulation; Defense Technical Information Center: Fort Belvoir, VA, USA, 1973. [Google Scholar]
  47. Flaherty, J. Evaluation of USSAERO and HABP Computer Codes for Aerodynamic Predictions for Slender Bodies; Defense Technical Information Center: Fort Belvoir, VA, USA, 1981. [Google Scholar]
  48. BopngMa/Waveform-Parameter-Method: The Code Was First Published as a Reference Code in NASA TN D-6832. The Code Is Re-Present Here for Academic Exchange Only. All Rights Are Reserved to the Original Authors. Available online: https://github.com/BopngMa/Waveform-Parameter-Method (accessed on 25 November 2024).
  49. Usuaero/PyLdB: Calculates the Perceived Loudness of a Pressure Signature. Available online: https://github.com/usuaero/PyLdB (accessed on 25 November 2024).
  50. Cliff, S.E.; Durston, D.A.; Elmiligui, A.A.; Walker, E.L.; Carter, M.B. Experimental and Computational Sonic Boom Assessment of Lockheed-Martin N+2 Low Boom Models; NASA: Washington, DC, USA, 2015. [Google Scholar]
  51. Aftosmis, M.J.; Nemec, M. Cart3D Simulations for the First AIAA Sonic Boom Prediction Workshop. In Proceedings of the 52nd Aerospace Sciences Meeting, National Harbor, MD, USA, 13–17 January 2014; American Institute of Aeronautics and Astronautics: Reston, VA, USA. [Google Scholar]
  52. Hunton, L.W.; Hicks, R.M.; Mendoza, J.P. Some Effects of Wing Planform on Sonic Boom; NASA: Washington, DC, USA, 1973. [Google Scholar]
  53. Zhang, Y.; Fang, X.; Chen, H.; Fu, S.; Duan, Z.; Zhang, Y. Supercritical Natural Laminar Flow Airfoil Optimization for Regional Aircraft Wing Design. Aerosp. Sci. Technol. 2015, 43, 152–164. [Google Scholar] [CrossRef] [Scilit]
  54. Ji, Q.; Zhang, Y.; Chen, H.; Ye, J. Aerodynamic Optimization of a High-Lift System with Adaptive Dropped Hinge Flap. Chin. J. Aeronaut. 2022, 35, 191–208. [Google Scholar] [CrossRef] [Scilit]
  55. Li, R.; Deng, K.; Zhang, Y.; Chen, H. Pressure Distribution Guided Supercritical Wing Optimization. Chin. J. Aeronaut. 2018, 31, 1842–1854. [Google Scholar] [CrossRef] [Scilit]
  56. LI, R. Swayli94/Cst-Modeling3d 2024. 2 November 2024. Available online: https://github.com/swayli94/cst-modeling3d (accessed on 11 January 2026).
  57. Cliff, S.E.; Durston, D.; Chan, W.M.; Elmiligui, A.A.; Moini-Yekta, S.; Sozer, E.; Jensen, J.C. Computational and Experimental Assessment of Models for the First AIAA Sonic Boom Prediction Workshop. In Proceedings of the 52nd Aerospace Sciences Meeting, National Harbor, MD, USA, 13–17 January 2014; American Institute of Aeronautics and Astronautics: Reston, VA, USA. [Google Scholar]
Figure 1. Flow chart of AERO-BOOM.
Aerospace 13 00096 g001
Figure 2. Definition of off-track angle.
Aerospace 13 00096 g002
Figure 3. Surface pressure coefficient contour for a supersonic aircraft program.
Aerospace 13 00096 g003
Figure 4. SEEB-ALR Model.
Aerospace 13 00096 g004
Figure 5. Comparison of AERO-BOOM near-field result with SBPW-1 submission result and experimental result.
Aerospace 13 00096 g005
Figure 6. Comparison of AERO-BOOM far-field result with sBOOM result.
Aerospace 13 00096 g006
Figure 7. DWB.
Figure 7. DWB.
Aerospace 13 00096 g007
Figure 9. Equivalent area distribution of DWB with 4.74° angle of attack.
Aerospace 13 00096 g009
Figure 10. Comparison of AERO-BOOM near-field result with a submission result and experimental result.
Aerospace 13 00096 g010
Figure 11. Framework of a HSADE-based full-carpet sonic boom/aerodynamic Multidisciplinary Optimization platform for supersonic civil aircraft.
Aerospace 13 00096 g011
Figure 12. Subprocess of “Evaluating Individual Fitness”.
Aerospace 13 00096 g012
Figure 13. Parameterization model for the wing layout (variables within square brackets are constraints).
Aerospace 13 00096 g013
Figure 14. Parameterization model for the fuselage layout (variables within square brackets are constraints).
Aerospace 13 00096 g014
Figure 15. Parameterization model for the tail layout (variables within square brackets are constraints).
Aerospace 13 00096 g015
Figure 16. Baseline configuration.
Aerospace 13 00096 g016
Figure 17. Equivalent area and F-function distribution of baseline configuration on ϕ = 0 °
Aerospace 13 00096 g017
Figure 18. Under-track ( ϕ = 0 ° ) sonic boom characteristics of baseline configuration.
Aerospace 13 00096 g018
Figure 19. Trajectory and Pareto front of fuselage optimization.
Aerospace 13 00096 g019
Figure 20. Comparison of symmetry-plane shapes before and after fuselage optimization.
Aerospace 13 00096 g020
Figure 21. Comparison of sonic boom characteristics before and after fuselage optimization.
Aerospace 13 00096 g021
Figure 22. Trajectory and Pareto front of overall aircraft optimization.
Aerospace 13 00096 g022
Figure 23. Comparison of aerodynamic configurations before and after overall aircraft optimization.
Aerospace 13 00096 g023
Figure 24. Comparison of equivalent area distributions on ϕ = 0 ° before and after overall aircraft optimization.
Aerospace 13 00096 g024
Figure 25. Comparison of F-function distribution on ϕ = 0 ° before and after overall aircraft optimization.
Aerospace 13 00096 g025
Figure 26. Comparison of sonic boom characteristics before and after overall aircraft optimization.
Aerospace 13 00096 g026
Figure 27. Comparison of the optimized geometry (Opt-2) and the historical Concorde configuration (normalized by fuselage length).
Aerospace 13 00096 g027
Table 1. The benchmark cases in this study.
Benchmark ModelMach NumberAngle of Attack/°Target of Validation
SEEB-ALR1.60Near-Field Overpressure Distribution Calculation Module
Ground Sonic Boom Signature Calculation Module
Ground Sonic Boom Loudness Calculation Module
DWB 11.70Near-Field Overpressure Distribution Calculation Module
(Multi-Off-Track Angle)
DWB1.684.74Aerodynamic Force Prediction Module
Near-Field Overpressure Distribution Calculation Module
1 69° Delta Wing-Body Model.
Table 2. Aerodynamic prediction results.
Data SourcesLift CoefficientLift-to-Drag Ratio
Wind-Tunnel [18]0.15
CFD0.15416.58
AERO-BOOM0.15876.03
Table 3. Optimization objectives, optimization variables, and constraints.
PartsOptimization
Variables
ConstraintsOptimization
Objectives
WingLeading-Edge Sweep Angle
Trailing-Edge Sweep Angle
Dihedral Angle
Twist Angle
Projected Area
Wingtip Chord ≮ 0
Lift-To-Drag Ratio
Full-Carpet Sonic Boom Loudness
FuselageCross-Section Center Y-Coordinate
Cross-Section Radius
Nose CoordinateVolumeLength
TailLeading-Edge Coordinates of Root
Leading-Edge Sweep Angle
Aspect Ratio
Taper Ratio
Dihedral AngleArea
Quantity3872
Disclaimer/Publisher’s Note: The statements, opinions and data contained in all publications are solely those of the individual author(s) and contributor(s) and not of MDPI and/or the editor(s). MDPI and/or the editor(s) disclaim responsibility for any injury to people or property resulting from any ideas, methods, instructions or products referred to in the content.