1. Introduction
With the progressive implementation of remote tower technology in civil aviation operations, the working paradigm of air traffic controllers (ATCOs) is shifting from traditional physical towers to highly virtualized, information-intensive remote environments. This transformation not only redefines the controller’s operational workspace, but also alters how traffic information is perceived and processed through human–machine interfaces. Within a remote tower setting, controllers are required to monitor virtual tower views composed of high-resolution multi-channel surveillance displays for extended periods, relying on electronic flight strips, radar systems, and voice communications to manage arriving and departing aircraft with precision [
1,
2]. These workspaces are typically enclosed and lit primarily by artificial lighting, lacking the natural light variation that aids visual comfort. The combination of prolonged screen exposure and high cognitive demands makes controllers particularly vulnerable to visual fatigue, manifesting as reduced accommodative function, diminished attention, and slowed responses—factors that could compromise operational stability and aviation safety [
3].
Visual fatigue refers to a functional decline in the visual system resulting from sustained and intense visual tasks, often caused by prolonged strain on the eye-brain system and associated physiological or psychological stressors [
4,
5]. Existing assessment methods are generally categorized into subjective evaluations and objective measurements, targeting individual perception and physiological responses, respectively. Subjective methods rely on standardized questionnaires to quantify perceived fatigue following specific tasks. Commonly used instruments include the Visual Fatigue Questionnaire (VFQ), Subjective Symptoms Questionnaire (SSQ), and scenario-specific visual discomfort scales [
6,
7,
8,
9,
10]. For example, Auffret et al. found that both short- and long-term screen exposure significantly exacerbates subjective visual fatigue symptoms through self-report measures [
11]. Although subjective questionnaires are easy to administer and effectively capture the participants’ personal experiences, they are inherently prone to cognitive biases and self-perception errors, which limit their objectivity.
Objective assessments quantify visual fatigue through a variety of physiological markers including visual function tests, biosignal monitoring, and neural activity analysis. Ophthalmologic parameters such as contrast sensitivity, near point of accommodation (NPA), near point of convergence (NPC), and tear film breakup time (TBUT) are commonly used to evaluate structural and functional changes in the visual system. These features reflect a person’s visual discrimination ability, ocular flexibility, binocular coordination, and ocular surface health, offering robust objective evidence of visual fatigue [
10,
12,
13]. For example, Rossi et al. systematically evaluated visual fatigue in video terminal operators using contrast sensitivity and related measures [
13]. In eye-tracking (ET) metrics, blink frequency, pupil diameter, saccade velocity, and fixation duration are widely adopted to assess the task intensity and fatigue levels [
14]. For instance, Wang et al. developed a real-time visual fatigue assessment model based on unobtrusive eye-tracking and blink features [
15]. Electroencephalography (EEG) also provides critical neurophysiological insights into visual fatigue. Indicators such as the theta-to-beta ratio (θ/β), power spectral entropy, and regional power dynamics have been shown to correlate with declining alertness and increasing cognitive load [
16,
17,
18]. For example, Lee et al. found that visual stimulation under 2D/3D, AR, and VR conditions elicited distinct patterns of delta, theta, and alpha wave activity in the frontal, occipital, and parietal cortices [
19]. Additionally, electrocardiogram (ECG) and electrodermal activity (EDA) are frequently used to evaluate autonomic nervous system responses and arousal states under fatigue. ECG-derived heart rate variability (HRV) indicators such as LF, HF, and RMSSD, along with skin conductance level (SCL) and skin conductance responses (SCRs), have been proven to be effective in identifying fatigue-related changes [
4,
20,
21]. For example, Wang et al. employed EEG-ECG multimodal fusion to improve real-time fatigue detection in driving scenarios, while Sameri et al. validated the utility of EDA in monitoring cybersickness and visual fatigue in VR environments [
22,
23].
Several modeling approaches have been proposed to enhance fatigue state recognition accuracy and generalizability. Yuan et al. developed a dynamic Bayesian network (DBN)-based visual fatigue model, which improved the inference performance but showed limitations in handling static or segmented task scenarios [
24]. Tian et al. introduced a fusion model (DSF) based on entropy-CRITIC weighting to evaluate visual fatigue in SSVEP-based BCI systems [
25]. Despite its interpretability, the system’s application was confined to BCI environments. Shi et al. built a deep learning model (AtLSMMs) incorporating display spectral characteristics and EEG time-series data, achieving three-class fatigue classification with promising accuracy, though generalization across participants remained limited [
26]. Lu et al. proposed a weakly supervised graph convolutional network (WSGCN-VD) to handle noisy labels in EEG-based visual discomfort detection, but the model’s complexity and lack of interpretability hinder practical deployment [
27].
To date, research on visual fatigue has made meaningful progress in multimodal modeling and feature integration. However, key challenges remain in model interpretability, individual adaptability, and context-specific validation. Meanwhile, existing frameworks, such as ICAO’s Fatigue Risk Management System (FRMS) and Eurocontrol’s Human Performance guidelines, primarily emphasize organizational and scheduling controls—such as duty time limitations and rest periods—rather than real-time physiological monitoring and individualized fatigue recognition [
28,
29,
30,
31]. While these frameworks provide essential safety foundations, they are not tailored to emerging digital ATC environments, where visual-cognitive demands evolve rapidly and are highly context-sensitive.
Particularly, the unique characteristics of remote tower environments—virtualized visual displays, artificial lighting, and sustained demand for situational awareness—may lead to fatigue mechanisms that differ significantly from those in conventional towers or other fatigue-prone settings [
3]. As remote towers are designed to maintain or exceed the safety levels of traditional towers, it is imperative to investigate the physiological manifestations and recognition mechanisms of controller visual fatigue in this setting.
The main contributions of this paper are as follows:
A comprehensive multimodal data acquisition framework was established, incorporating subjective questionnaires, ophthalmologic parameters, and physiological recordings (ET, EEG, ECG, EDA), to systematically evaluate visual fatigue during apron control tasks in the remote tower environment;
A two-stage recognition model based on LightGBM and multilayer perceptron (MLP) was proposed, balancing feature interpretability with nonlinear modeling capacity to improve the prediction accuracy;
Based on feature importance rankings and model outcomes, the physiological patterns of remote tower controllers under visual fatigue were analyzed, providing a scientific basis for human factor monitoring and intervention in remote tower environments.
2. Experiment
2.1. Participants
A total of 36 qualified participants were recruited for this study. All participants were undergraduate students majoring in air traffic control at the College of Air Traffic Management, Civil Aviation Flight University of China who had completed training for ATC positions and passed the relevant competency assessments. All participants met the Class I medical certification requirements issued by the Civil Aviation Administration of China. The mean age was 22.2 years (SD = 0.94), with binocular uncorrected visual acuity of LogMAR ≤ 0.0 and no history of ophthalmologic disorders.
The experimental protocol strictly adhered to the ethical principles of the Declaration of Helsinki. Participation was entirely voluntary, and the participants were informed of their right to withdraw at any stage. All data were anonymized to ensure confidentiality and participant safety.
2.2. Experimental Scenario
The experiment was conducted using the Tower Client simulator, a high-fidelity remote tower simulation platform capable of rendering high-resolution visual environments, processing live traffic data streams, and supporting interactive scheduling tasks. The simulator allowed the experimenters to configure detailed traffic scenarios via an instructor interface. Controllers operated the system using remote tower displays, executing voice instructions, electronic flight strip management, and taxi route planning tasks.
To enhance ecological validity, the simulation was conducted in a fully enclosed control room with constant artificial lighting to replicate the visual load typical of real remote tower environments. To simulate realistic air-ground communication, the experimenters acted as pilots from a physically isolated room using a simulated radio system for real-time verbal interaction with the participants.
The virtual airport environment, referred to as “Hansha Airport”, was modeled after Wuhan Tianhe International Airport (ZHHH) and Changsha Huanghua International Airport (ZGHA), capturing representative features of apron control scenarios. The experiment simulated real apron operations including aircraft arrival, taxiing, stand allocation, and departure scheduling. A fixed flight schedule was adopted, with traffic volume maintained within a relatively stable range. Multiple trial runs were conducted prior to formal data collection to validate the scenario’s stability and timing. The traffic configuration is shown in
Table 1.
2.3. Procedure
Participants were instructed to avoid consuming stimulants (e.g., coffee, strong tea) 24 h prior to the experiment and to maintain a minimum of 7 h of sleep the night before to ensure that they entered the experiment free from fatigue.
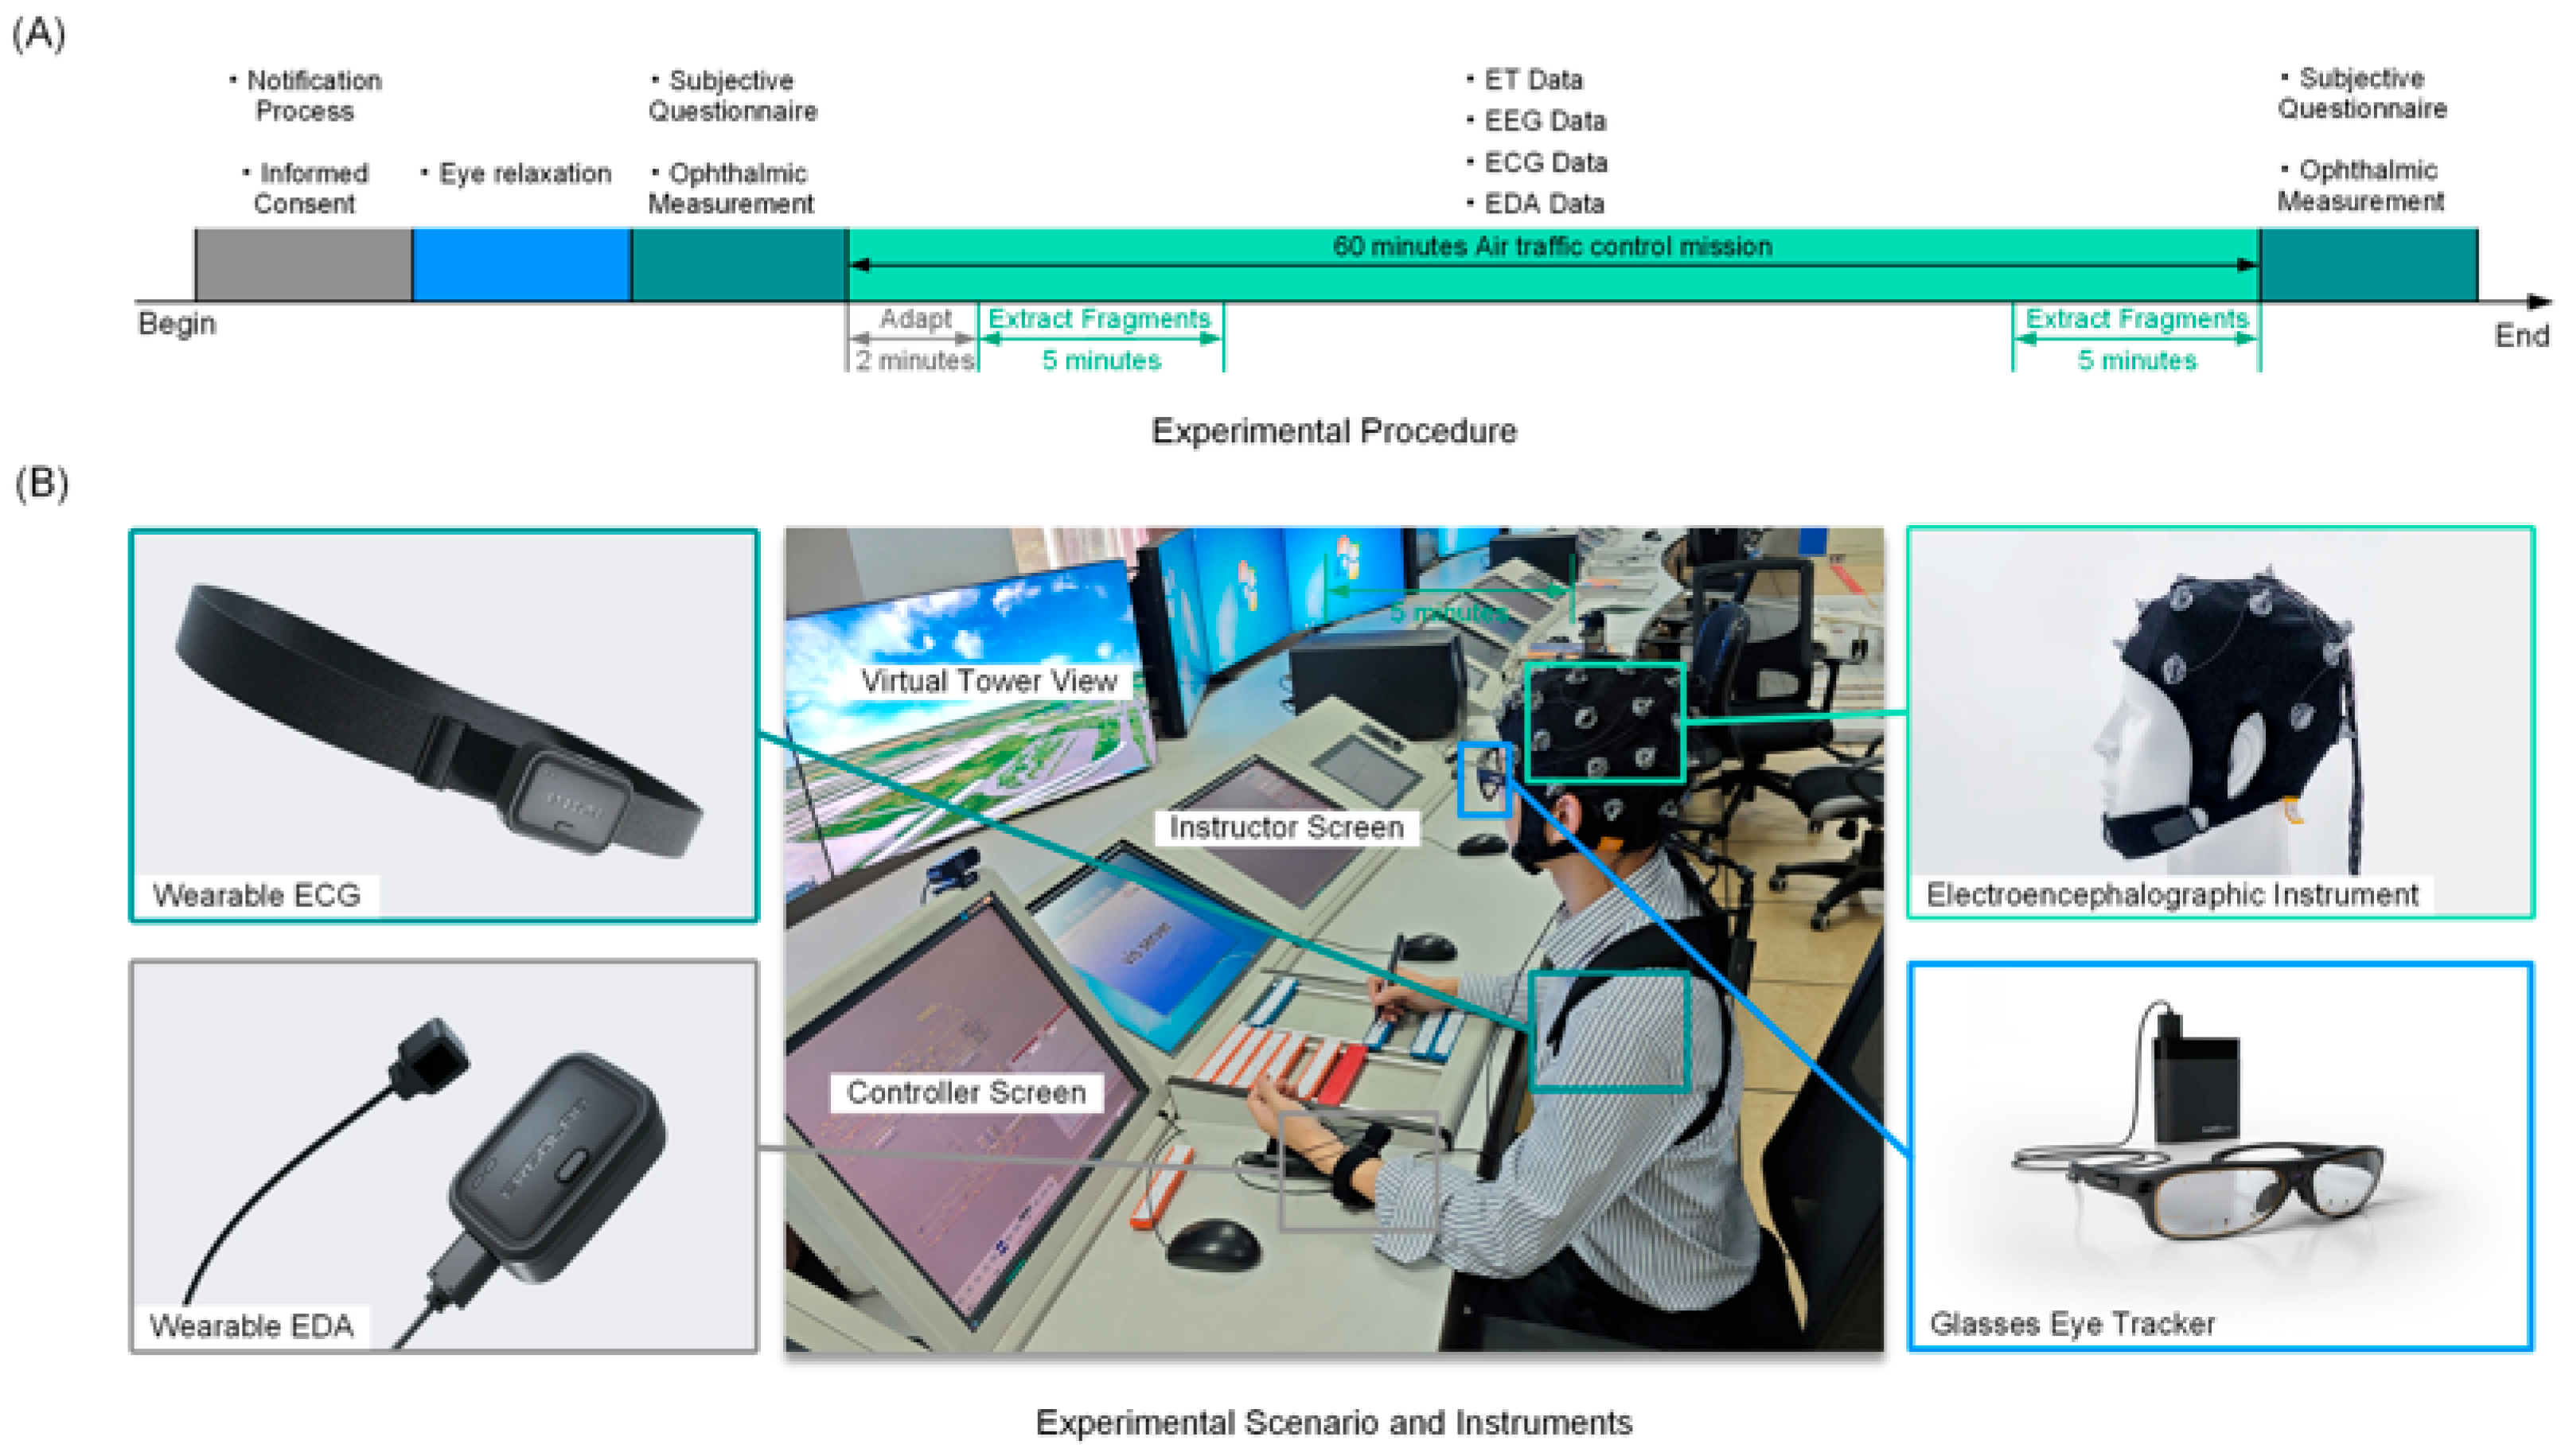
Before the formal task, each participant received a detailed briefing from an experimenter outlining the procedure, safety considerations, and possible risks. Participants were required to provide informed consent after fully understanding the purpose and protocol of the study. A 5-min pre-task visual relaxation period was conducted to eliminate the baseline visual strain. Subsequently, participants completed a standardized visual fatigue questionnaire to assess the baseline subjective fatigue, followed by a set of ophthalmologic assessments including visual acuity, accommodation response, NPA, NPC, contrast sensitivity, and TBUT.
Following the preparation phase, participants entered a 60-min apron control simulation. During this task, ET, EEG, EEG and EDA data were continuously recorded in real-time. After completing the task, participants immediately underwent a second ophthalmologic assessment and filled out the visual fatigue questionnaire again to capture the post-task changes in both the subjective and objective fatigue indicators. Each participant completed two sessions scheduled at different times to allow for sufficient visual recovery and ensure data independence. The full experimental flow is illustrated in
Figure 1A.
2.4. Data Collection
Eye-tracking data were recorded at 100 Hz using Tobii Pro Glasses 3 (Tobii AB, Stockholm, Sweden). ECG signals were acquired with the ErgoLAB biosensing wearable device (Kingfa, Guangzhou, China) at a sampling rate of 512 Hz. EEG data were collected using the ErgoLAB Portable EEG system (32 channels, 512 Hz, Kingfa, China), and EDA signals were obtained using an ErgoLAB wireless EDA sensor (bilateral hand electrodes, 512 Hz, Kingfa, China). The data acquisition devices and experimental setup are shown in
Figure 1B.
In addition to physiological signals, participants completed a subjective fatigue questionnaire at the start and end of each session. The questionnaire was developed based on the established visual fatigue literature and clinical ophthalmologic standards, targeting symptoms such as eye discomfort, blurred vision, accommodation difficulties, attention issues, and emotional responses [
20]. The Remote Tower Visual Fatigue Questionnaire (RTVF-Q) includes 12 items across six domains. Each item is rated for frequency and severity (0–5 scale), with total scores ranging from 0 to 120, where higher scores indicate greater fatigue. A sample of the RTVF-Q is presented in
Table 2.
Objective visual function assessments were also conducted before and after each task. Six key ophthalmologic parameters were measured: best-corrected distance visual acuity (Snellen E-chart), NPC (via RAF rule), NPA (via accommodative rule), accommodation response time (via CV-7800 autorefractor, Ming Sing Optical R&D, Ningbo, China), contrast sensitivity (Pelli–Robson chart under standard lighting), and TBUT (via fluorescein strips, Jingming, Shenzhen, China, and slit-lamp microscope OVS-2, WBO, Guangzhou, China). These indicators, combined with the questionnaire scores, formed the basis for labeling the fatigue states during model training.
During each 60-min session, multimodal data were segmented from two periods: minutes 2–7 after task onset and the final 5 min of the task. The first two minutes were excluded to allow the participants to acclimate and to avoid data distortion caused by the initial cognitive and physiological transitions. Each data segment was paired with corresponding subjective questionnaire scores and objective visual function indicators to comprehensively characterize the fatigue states.
3. Visual Fatigue Modeling
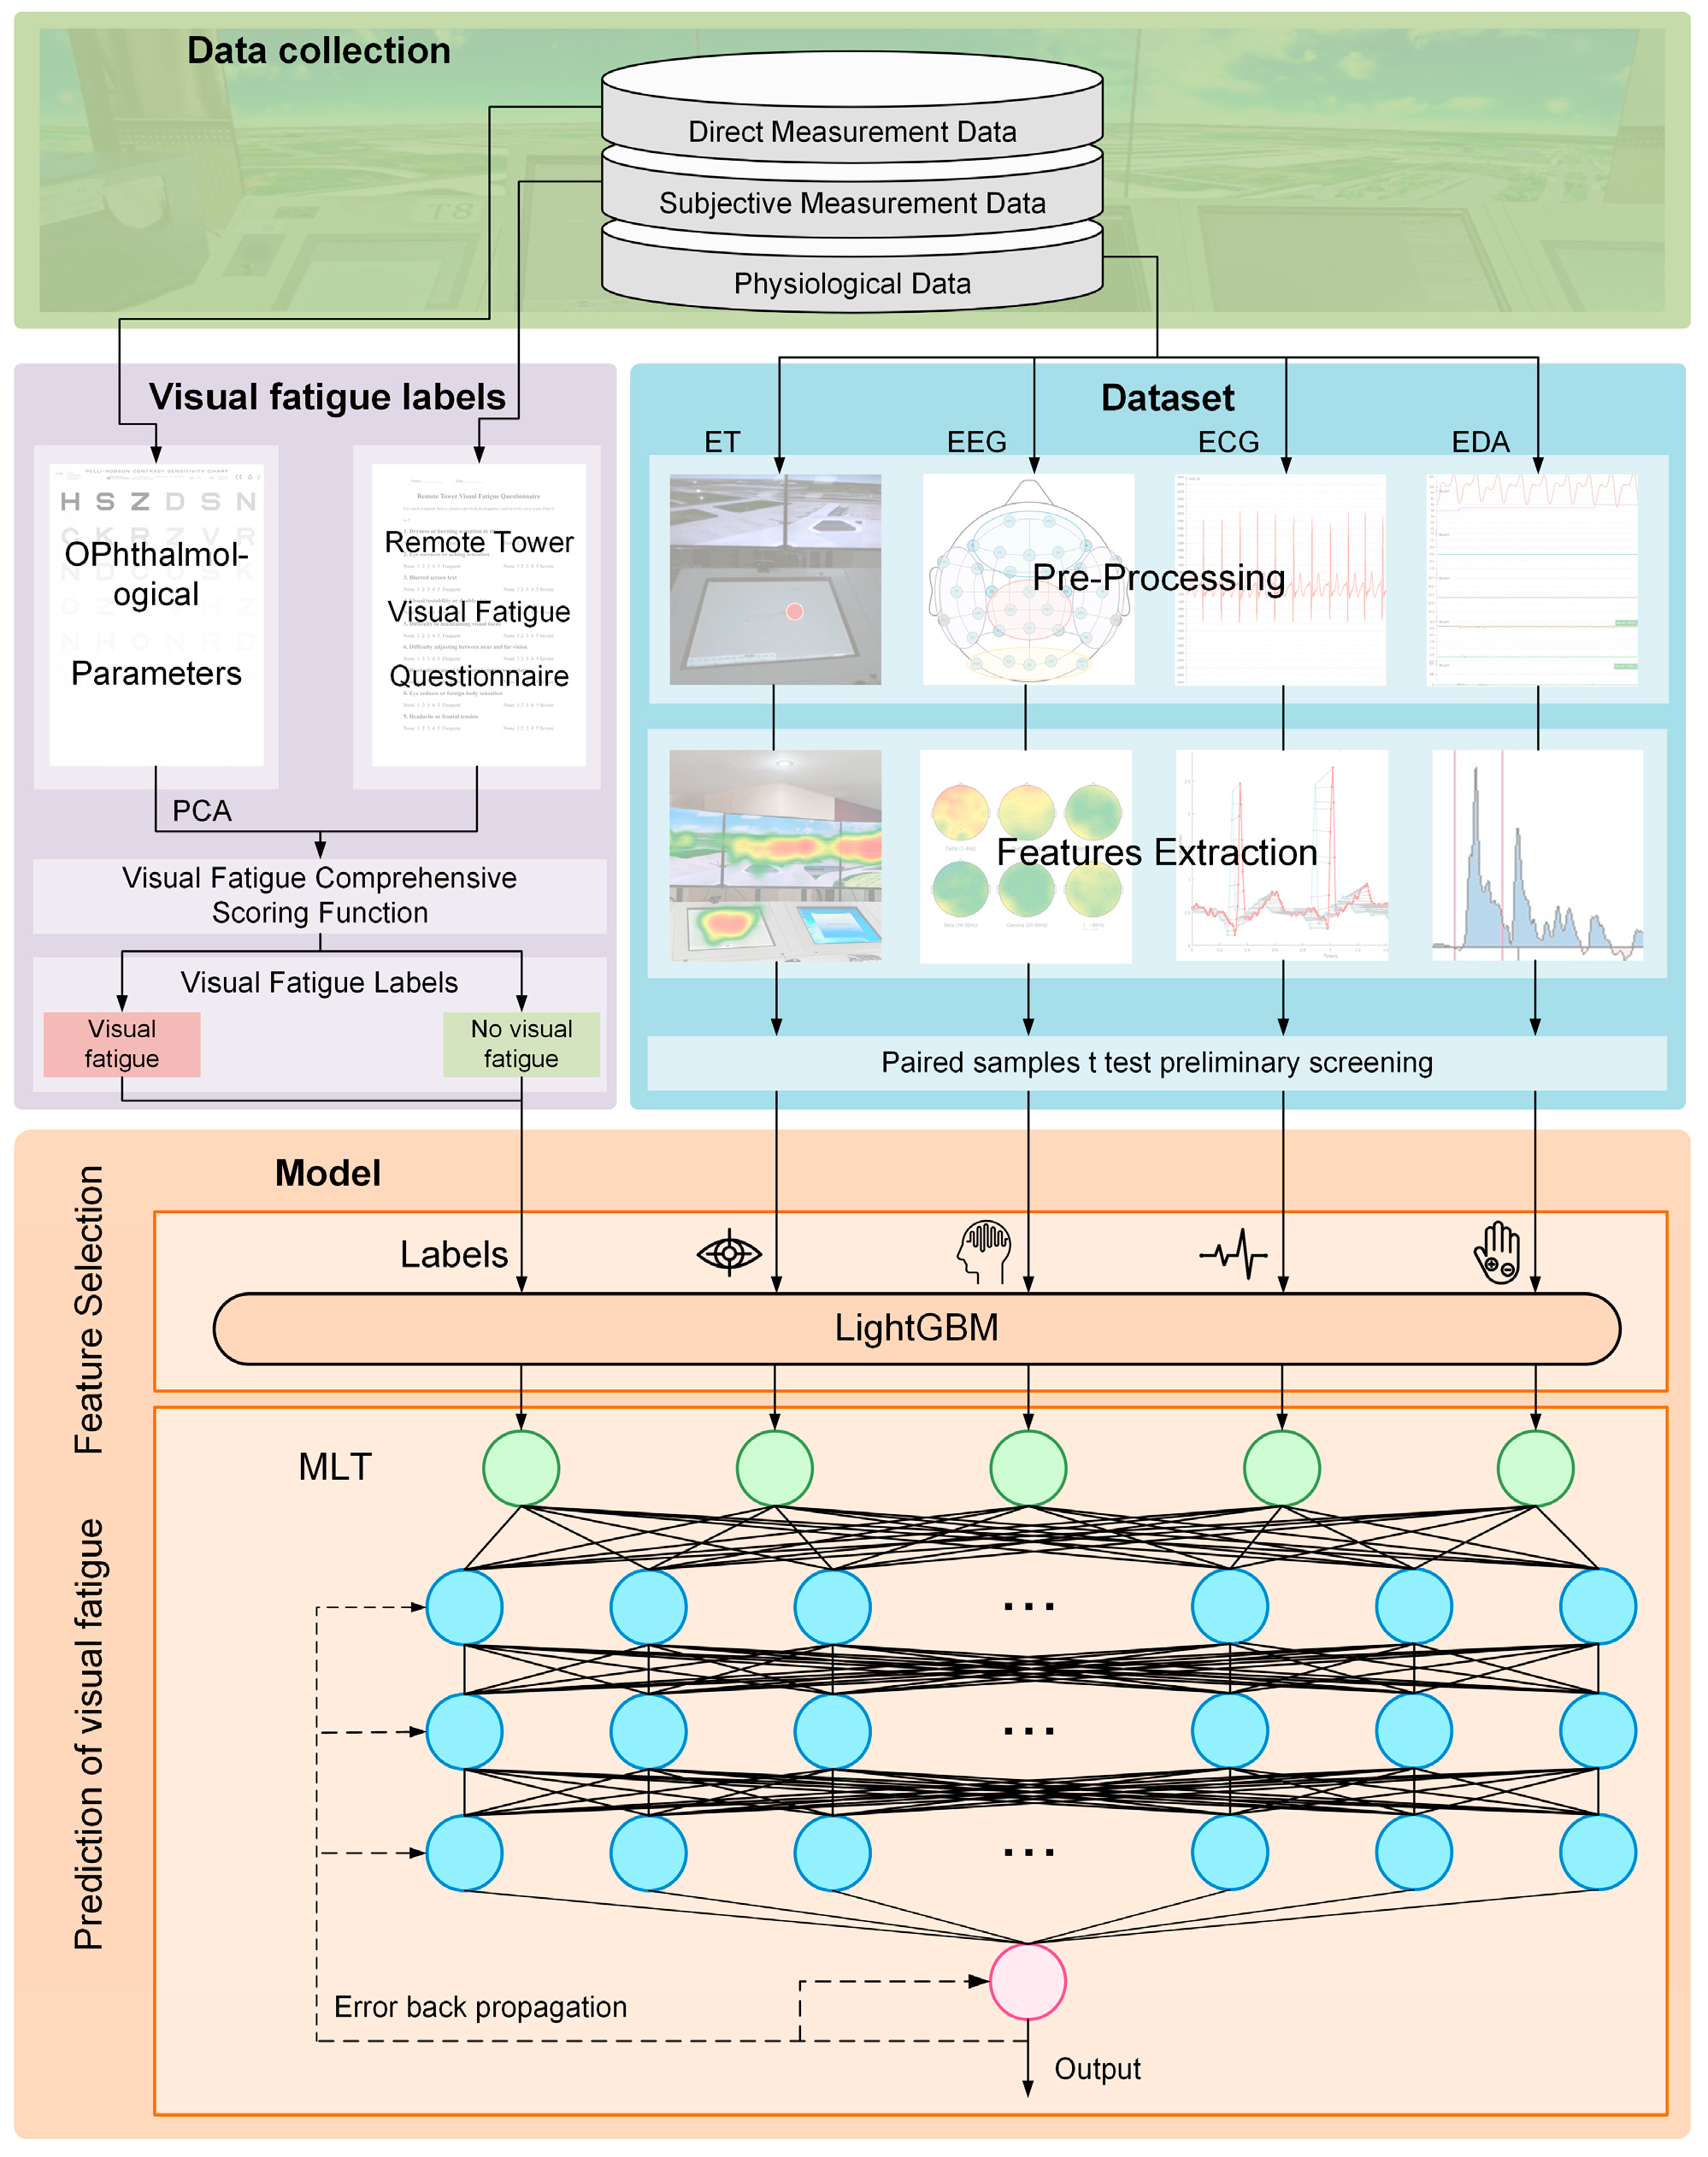
To explore the physiological mechanisms and recognition strategies of visual fatigue among remote tower air traffic controllers, this study developed a multimodal modeling framework based on physiological signals. The overall process consists of dataset construction with fatigue labels and a two-stage recognition model using multimodal inputs.
In the initial stage, eye-tracking, EEG, ECG, and EDA signals were preprocessed and statistically analyzed to select features exhibiting significant differences before and after the task. Fatigue labels were generated by integrating subjective questionnaire scores and objective ophthalmologic parameters. A LightGBM model was then used to assess the feature importance and perform further selection. The most relevant features were subsequently fed into a multilayer perceptron (MLP) for classification. The complete modeling framework is illustrated in
Figure 2.
3.1. Dataset Construction
3.1.1. Data Preprocessing and Feature Selection
All physiological signals underwent preprocessing based on established protocols in the literature, with adjustments made according to observations during the current experimental procedures to ensure data quality and stability [
32,
33,
34,
35,
36].
Eye-tracking signals were processed using the ErgoLAB platform V1.0.7. A moving median filter was applied, and gaps less than 75 ms were linearly interpolated. Fixations were identified with a minimum duration of 60 ms, and adjacent fixations shorter than 75 ms or with angular distances less than 0.5° were merged. Saccades were detected using a velocity threshold of 2 pixels/ms with a duration range of 10–200 ms. Pupil diameter data were rescaled and interpolated. Blinks were identified using a duration threshold of 70–350 ms.
EEG, ECG, and EDA signals were processed using MATLAB R2024a and relevant toolbox extensions. EEG signals were processed using EEGLAB (v2024.0.0) [
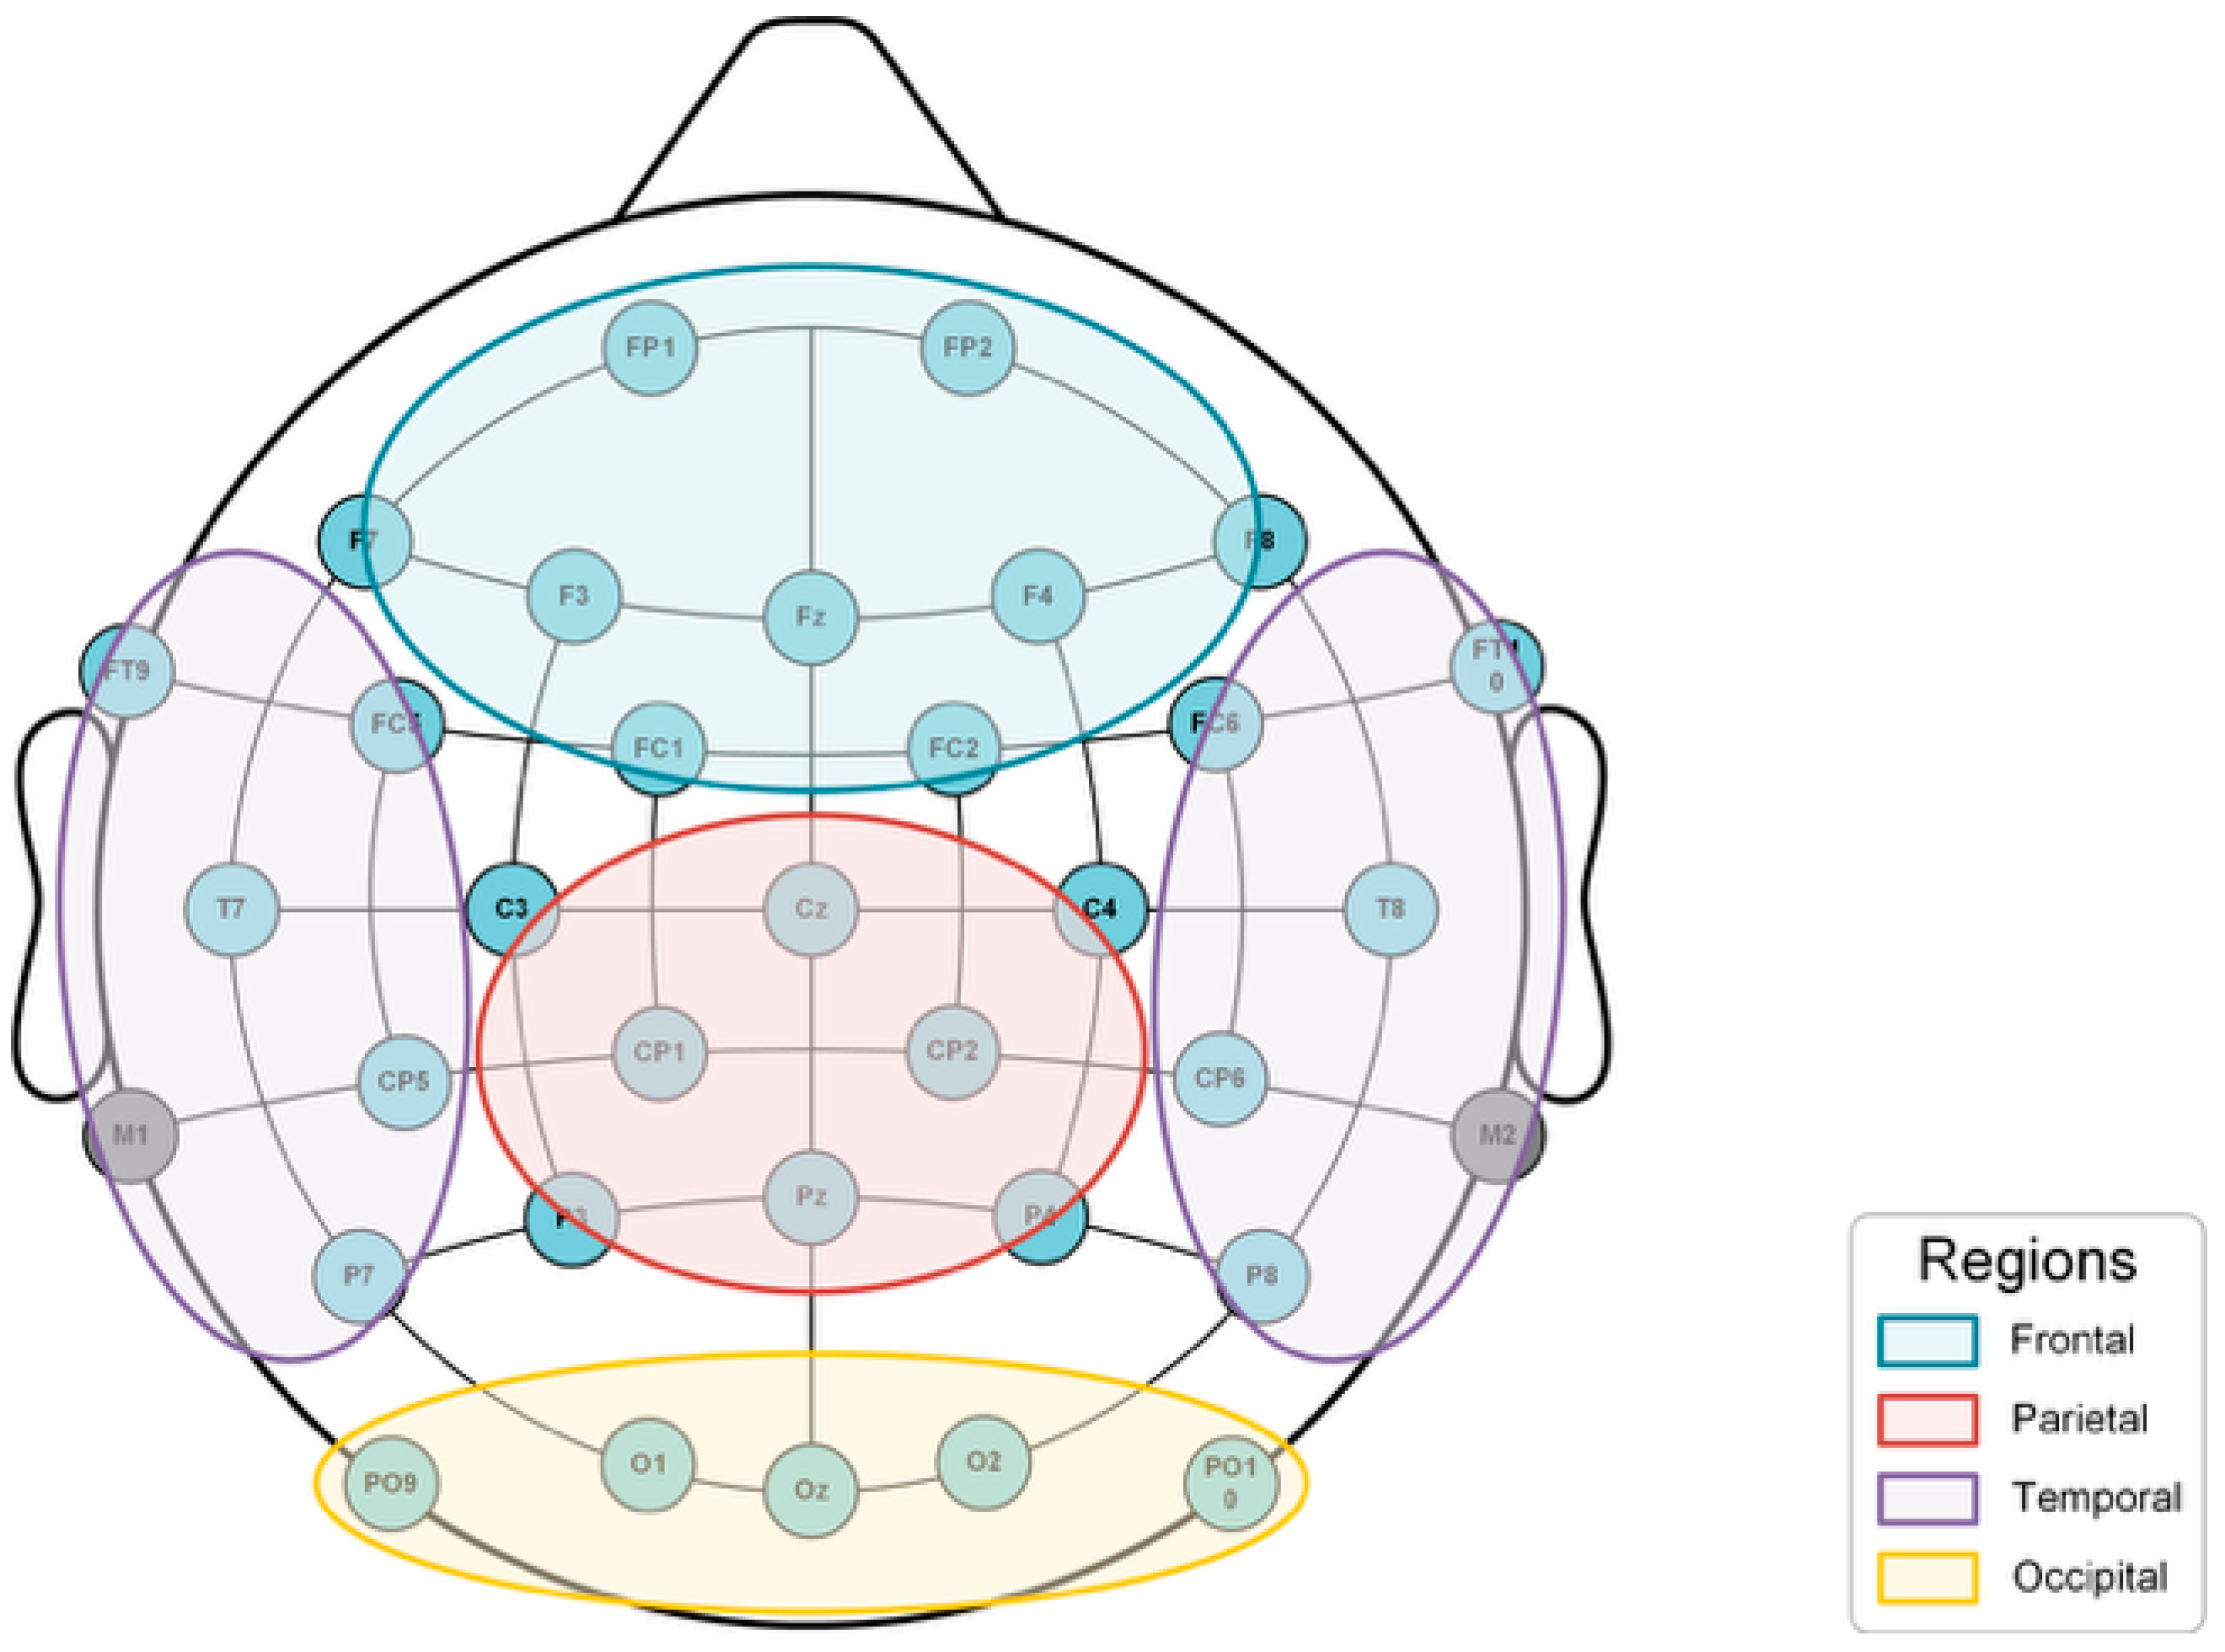
37]. Data were re-referenced to the average of M1 and M2 electrodes and filtered with a 0.1–30 Hz bandpass filter to remove drift and high-frequency noise. Independent component analysis (ICA) was performed to remove ocular and muscle artifacts. EEG was recorded with a 32-channel system based on the international 10–20 system to achieve high spatial resolution. Electrodes were grouped into four functional brain regions: frontal, parietal, occipital, and temporal, enabling region-specific feature extraction [
38]. Fast Fourier transform (FFT) was used to compute the relative power in the delta (δ), theta (θ), alpha (α), and beta (β) bands. The average of each region’s electrodes was used to represent that region’s neural activity. Additional features included spectral entropy and power band ratios such as θ/β, (α + θ)/β, α/β, and (α + θ)/(α + β). The electrode layout and regional mapping are shown in
Figure 3.
Raw ECG and EDA signals were filtered using adaptive bandpass filtering and Bior4.4 wavelet denoising. ECG R-peaks were detected using HEPLAB (v1.0.0), with a heart rate limit of 120 bpm and detection threshold at 70%. From the RR intervals, time-domain HRV features were extracted, and FFT was applied to obtain the frequency-domain indices [
39]. EDA signals were processed using LEDALAB (v3.2.5) to separate the SCL and SCR components [
40].
After preprocessing, paired sample
t-tests were conducted to evaluate whether each feature differed significantly before and after the task. The significance level was set at α = 0.05. Features showing statistically significant differences (
p < 0.05) were retained as candidate variables for subsequent modeling.
Table 3 summarizes the significant features identified through statistical testing, listing the direction of change for each feature before and after the task as well as the corresponding t-values and
p-values. These results serve to verify the discriminative power of each feature as an input variable for modeling.
A total of 26 features across multiple physiological domains exhibited significant changes before and after the task. These were selected as the initial input variables for the subsequent machine learning models.
3.1.2. Fatigue Label Construction
To construct reliable fatigue labels, visual fatigue was defined as a multidimensional state involving both physiological changes and subjective perception. A combined labeling strategy was used.
For objective indicators, six ophthalmologic parameters were selected (visual acuity, NPA, NPC, accommodation response time, contrast sensitivity, TBUT). Each was normalized using a linear mapping, where 0 indicates no fatigue and 1 indicates severe fatigue. Thresholds for normalization were based on the clinical literature and experimental observations [
12,
41,
42]. To avoid scaling and redundancy issues, a principal component analysis (PCA) was applied to assign weights to these features. The final weights are shown in
Table 4.
For the subjective dimension, the RTVF-Q questionnaire was used to obtain the controllers’ perceived level of visual fatigue. The total score of the scale was normalized and denoted as , representing the intensity of each individual’s self-reported fatigue experience during the task. To reflect the important role of subjective perception in fatigue determination, and to account for both the sensitivity of the questionnaire and the inherent variability of self-assessment, the present study assigned a weight of to the subjective dimension.
To justify the inclusion and weighting of subjective data, we conducted a Pearson correlation analysis between the total RTVF-Q scores and each of the six objective ophthalmologic indicators. The results revealed moderate to strong positive correlations in most cases (r values ranging from 0.41 to 0.67, p < 0.05), suggesting that the subjective assessments were meaningfully aligned with the physiological changes associated with visual fatigue. These findings support the integration of both subjective and objective components in fatigue labeling. The adopted weighting scheme thus reflects the dual nature of visual fatigue as a psychophysiological state and enhances the robustness of fatigue annotation.
The final visual fatigue composite score function, denoted as
, was constructed to characterize the overall visual fatigue level associated with each segment of data and is defined as follows:
The overall rating , with larger values indicating a more severe visual fatigue state.
Furthermore, to classify the visual fatigue state of remote tower controllers in a scientifically grounded manner, the present study utilized the composite score
as the basis for classification. A discrimination threshold
was defined to determine the fatigue status: if
, the controller is considered to be in a state of visual fatigue.
Combining the characteristics of remote tower tasks—which are prone to inducing early-onset fatigue—with the established definitions of subjective and objective fatigue thresholds, the final threshold was determined by referencing the distribution of subjective and objective scores along with the median of . The threshold was set at and used to classify fatigue and non-fatigue states. This binary visual fatigue label was then added to the standardized multimodal feature dataset, resulting in a final high-dimensional feature sample set with fatigue state annotations. Among the samples, fatigued and non-fatigued instances accounted for 47.9% and 52.1%, respectively, maintaining an overall balance between positive and negative classes.
3.2. LightGBM-MLP Recognition Model
This study proposed a two-stage recognition model integrating LightGBM and MLP to predict visual fatigue states in a remote tower context. The model aims to combine interpretability in feature selection with the nonlinear modeling power of neural networks. Both stages were implemented in Python 3.6.0 and executed on a Windows 11 workstation with an i9-12900K CPU and 64 GB RAM.
In the first stage, LightGBM was used to rank the importance of 26 features. LightGBM is a GBDT-based ensemble method that constructs trees sequentially to minimize residuals and global loss. The objective function is as follows:
where
is the loss function,
is the binary visual fatigue status label derived from the composite score, and
is the predicted value.
is a regularization term used to constrain model complexity, and
denotes the first
decision trees.
To comprehensively evaluate feature importance, this study considered two metrics provided by LightGBM: the “Split” index based on split frequency, and the “Gain” index based on information gain. These two indices respectively reflect the frequency with which a feature is used and its contribution to model performance. Specifically, Split represents the total number of times a feature is used for node splitting across all trees; a higher Split value indicates that the feature is frequently utilized in the modeling process. Gain, on the other hand, represents the total information gain obtained when a feature is used to split nodes; a higher Gain value implies that the feature has a more direct and critical impact on the model’s predictive performance. Split and Gain were ranked and normalized independently. Features appearing in the intersection set of the two rankings were assigned an overall importance score (OIS) to facilitate quantitative selection. The calculation of OIS is defined as follows:
Among these, the denotes the composite importance score of feature , where and represent the number of splits and the total information gain associated with feature , respectively. The denominator corresponds to the sum of each metric across all features, used for normalization. The parameter is introduced to adjust the relative weights of Split and Gain. In this study, was set to 0.5 to balance the general usage frequency and the information contribution of features during the selection process. This design aimed to avoid the bias introduced by relying on a single metric and to enhance both the robustness of feature selection and the interpretability of the model.
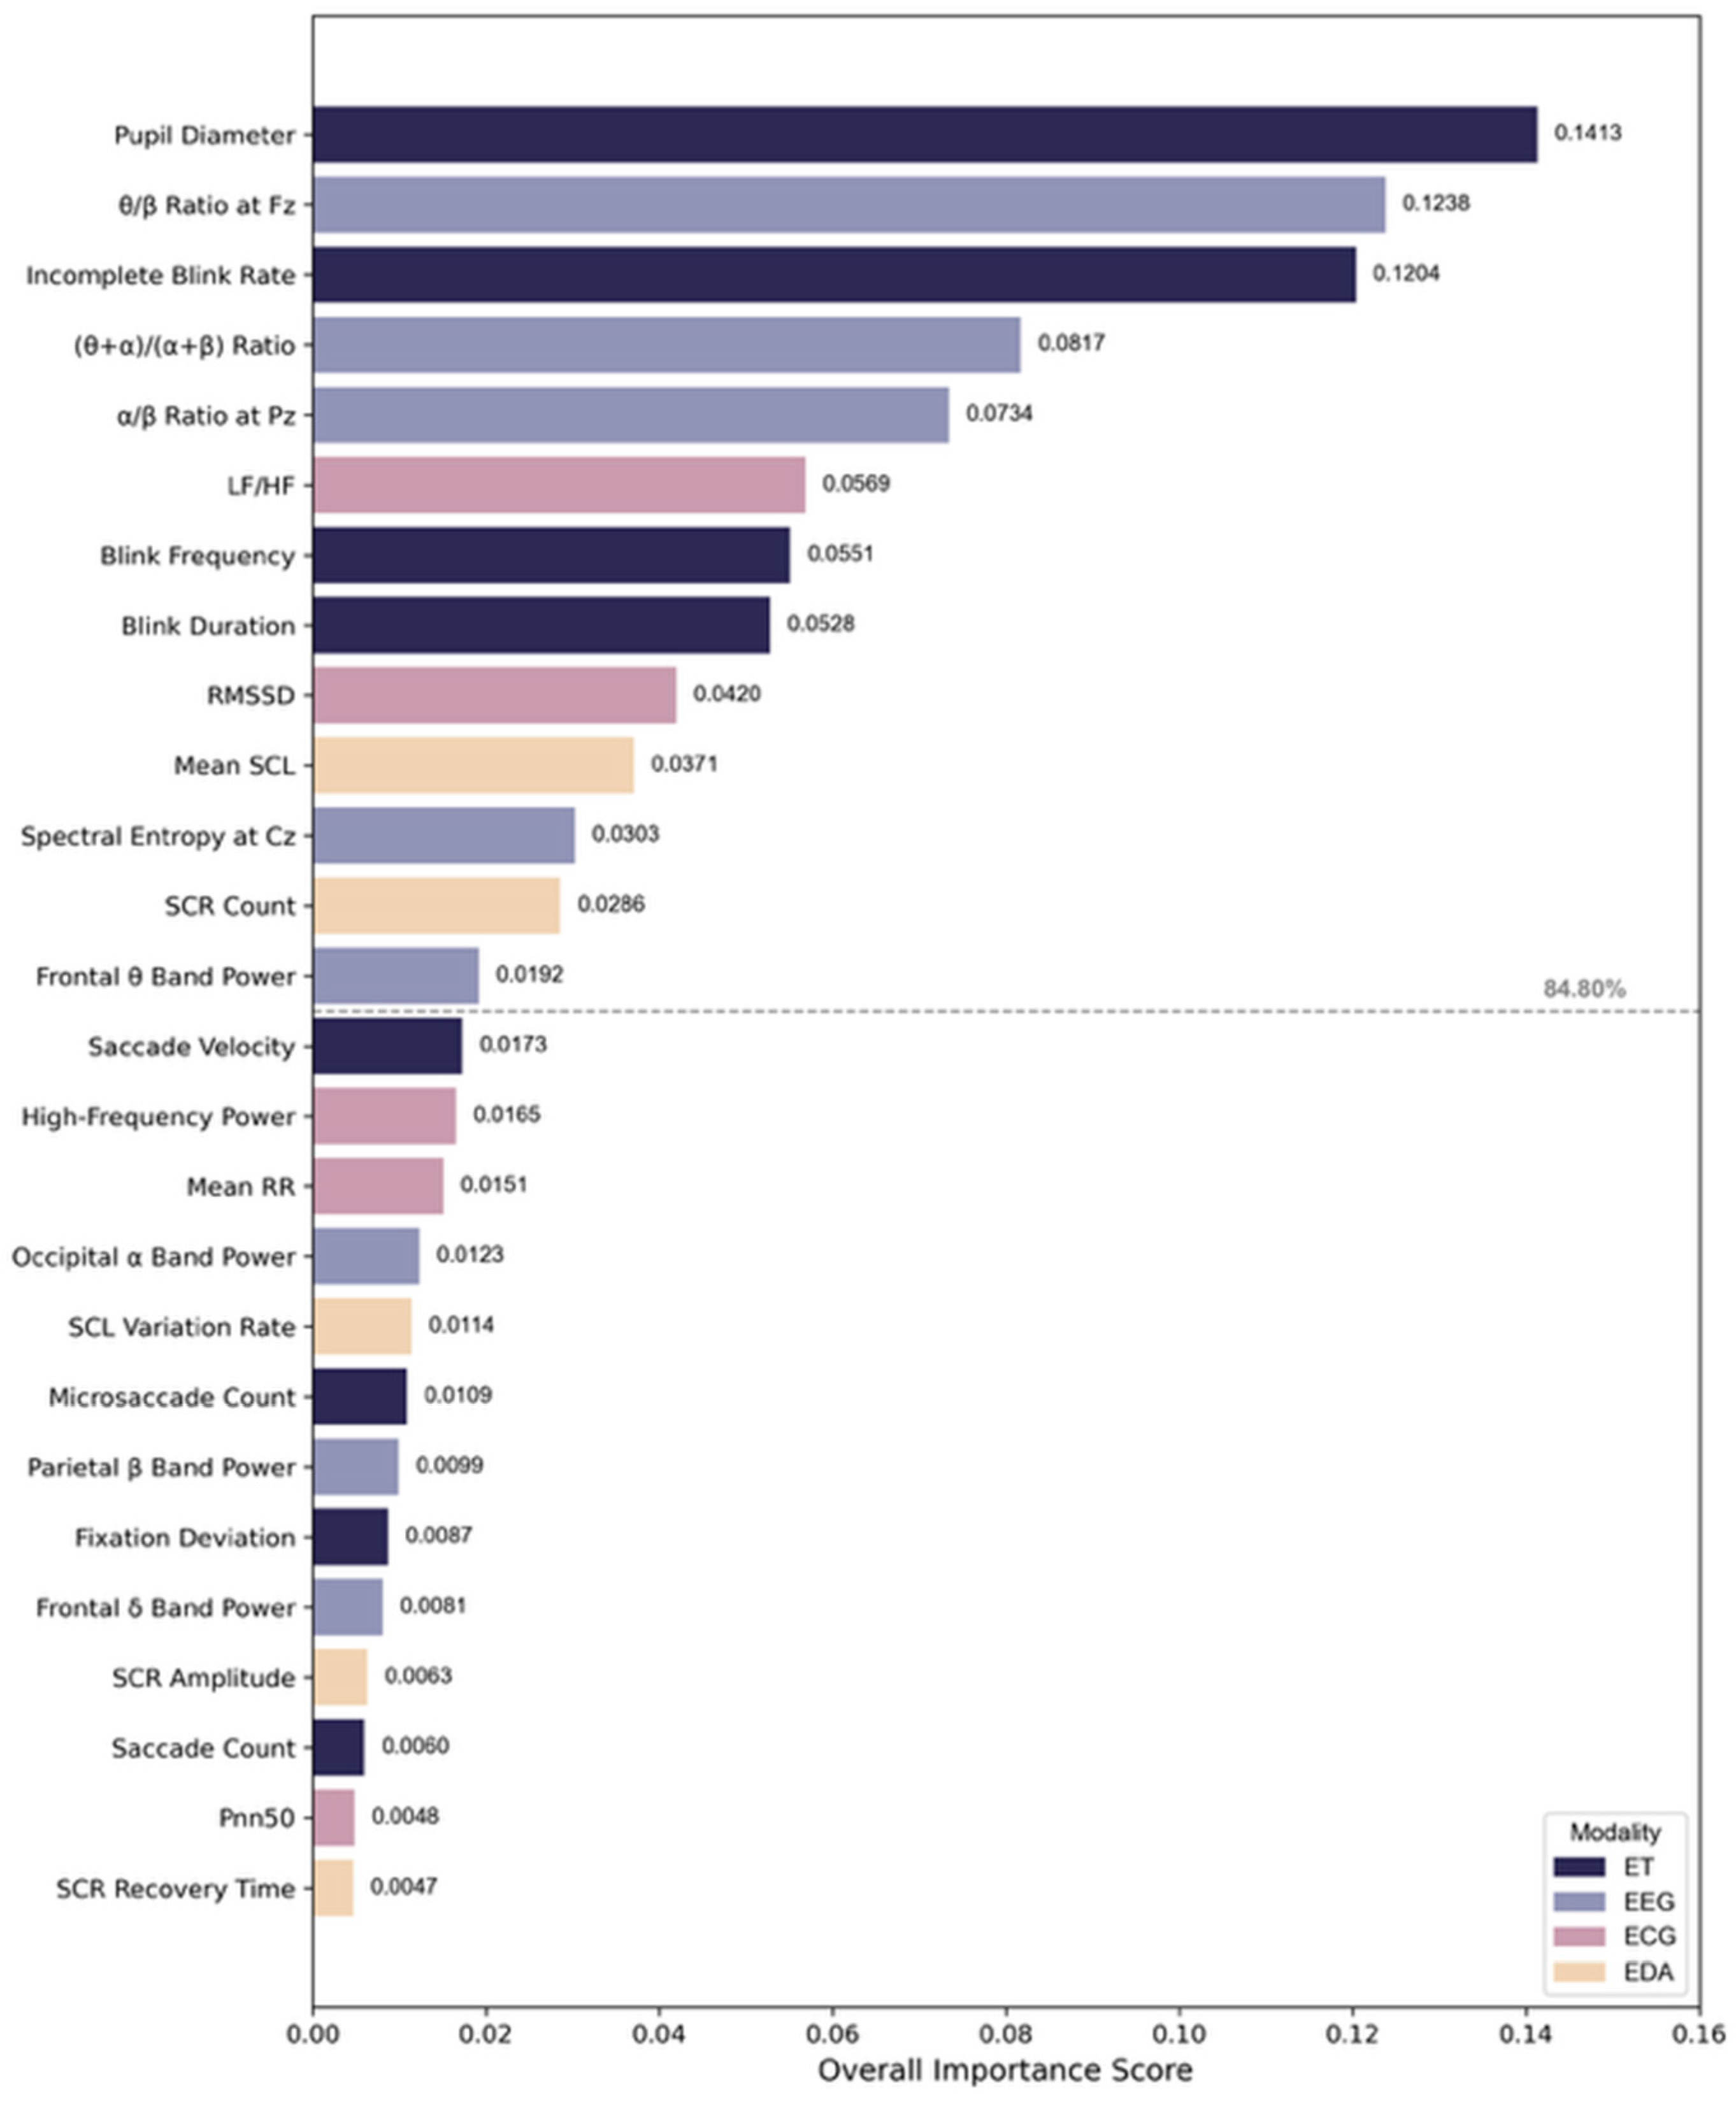
Finally, the top 12 features, which together accounted for 84.80% of the total OIS, were selected based on the comprehensive importance ranking and used as the input feature set for subsequent model training, as illustrated in
Figure 4:
In the second stage, the key features selected in the first stage were input into an MLP model. Through a fully connected multi-layer architecture, the MLP was used to capture high-level interactions among features from different modalities, ultimately yielding the classification output for the visual fatigue states. As a typical feedforward neural network, the MLP is well-suited for modeling complex nonlinear mappings from structured input data. It consists of an input layer, multiple hidden layers, and an output layer, with full connectivity between adjacent layers.
The forward propagation process of the MLP can be expressed as follows:
Among them, denotes the activation output of the l-th layer, while and represent the weight matrix and bias term, respectively. is the activation function, and is the final predicted output. Through iterative training, the MLP is capable of automatically learning higher-order nonlinear interactions from the structured input features, effectively capturing synergistic patterns and potential correlations across different modalities.
Furthermore, to achieve optimal model performance and generalization capability, a systematic hyperparameter tuning process was conducted. Based on the structural characteristics of the model and theoretical considerations, the initial value ranges of key hyperparameters were first determined. Subsequently, a tree-structured Parzen estimator (TPE)-based Bayesian optimization algorithm, combined with fivefold cross-validation, was used to efficiently search the hyperparameter space. The final network architecture comprised three hidden layers with 24, 48, and 24 neurons, respectively. The ReLU function was selected as the activation function, and the dropout rate was set to 0.22. The initial learning rate was fixed at 0.01, and the maximum number of training epochs was set to 500. To further mitigate overfitting and enhance training efficiency, an early stopping mechanism was introduced: training was terminated if no significant improvement was observed on the validation set for 30 consecutive epochs, with the best-performing model parameters retained.
3.3. Model Performance Evaluation
To comprehensively evaluate the performance of the proposed multimodal visual fatigue recognition model, a 12-fold cross-validation strategy was adopted. Specifically, the dataset was divided into 12 groups, each consisting of data from 3 participants. Each group was used once as the validation set, while the remaining groups served as the training set.
Balanced accuracy (BA) and F1 score were selected as the primary performance metrics. Balanced accuracy accounts for class imbalance and is calculated as:
In this context, and represent the number of correctly predicted fatigue and non-fatigue samples, respectively. refers to the number of fatigue samples incorrectly classified as non-fatigue, while refers to the number of non-fatigue samples misclassified as fatigue.
The F1 score is used as a comprehensive measure that balances the model’s Precision and Recall, and is calculated as:
with:
Precision indicates the proportion of samples predicted by the model as “fatigued” that are actually fatigued, while Recall denotes the proportion of all true fatigue samples that were correctly identified. The F1 score represents the harmonic mean of Precision and Recall, and is particularly suitable for evaluating the model’s ability to recognize critical classes under imbalanced sample conditions.
Table 5 presents the classification performance of the proposed model under different combinations of physiological modalities. A clear upward trend was observed as more modalities were integrated. When using eye-tracking (ET) features alone, the model achieved a moderate performance (mean BA = 0.67, F1 = 0.66), indicating limited discriminative capacity with oculomotor data alone. The addition of EEG features led to a substantial performance boost (mean BA = 0.78, F1 = 0.77), underscoring the contribution of neurophysiological indicators in capturing cognitive fatigue states. Incorporating ECG data further enhanced the classification accuracy (mean BA = 0.86, F1 = 0.84), likely due to its reflection of autonomic regulatory changes under fatigue. The inclusion of EDA features yielded the best results (mean BA = 0.92, F1 = 0.90), highlighting the added value of arousal-level signals. In several folds, the model even achieved perfect scores (BA = 1, F1 = 1), demonstrating the strong synergistic effect of multimodal fusion. These findings reinforce the effectiveness of the proposed approach and support the use of integrated physiological data in visual fatigue modeling.
The results demonstrate that the LightGBM-MLP multimodal model developed in this study achieved a relatively high accuracy and stable performance in the context of remote tower operations. The findings also confirm the complementary and integrative advantages of multi-source physiological features in visual fatigue recognition. It is worth noting that although numerous studies have focused on visual fatigue recognition in other high-risk scenarios, systematic modeling in the emerging but critical field of remote tower air traffic management remains in its early stages. This study achieved relatively accurate fatigue recognition in this specific setting, providing both a methodological foundation and a performance reference for future research in the field.
4. Discussion
In this study, twelve high-importance features were identified based on LightGBM feature importance analysis, spanning four modalities: ET, EEG, ECG, and EDA. These features were then used to accurately classify the visual fatigue states. Collectively, they reflect multidimensional physiological changes that occur in remote tower controllers during apron control tasks, offering quantitative evidence for understanding the underlying mechanisms of visual fatigue.
In the eye-tracking modality, pupil diameter emerged as the most important feature and was significantly reduced under fatigue, suggesting impaired pupillary adjustment and decreased visual alertness. The increase in incomplete blink rate and blink frequency with fatigue indicates weakened eyelid muscle control and ocular dryness, manifesting as overt signs of discomfort. Additionally, prolonged blink duration reflects delayed eye closure movements and reduced motor responsiveness. Together, these changes outline the evolution of visual system fatigue under prolonged visual load and are consistent with prior research findings [
14].
In the EEG modality, increases in the θ/β ratio at Fz, α/β ratio at Pz, and overall (θ + α)/(α + β) ratio under fatigue reflect a dominance of low-frequency activity, alongside reduced frontal executive function and posterior spatial awareness. These patterns align with the theoretical expectation of diminished cognitive resource allocation during fatigue [
17,
43]. Furthermore, the decline in power spectral entropy at Cz suggests reduced spectral complexity and monotonous brain activity, indicating impaired adaptability of the neural system to continuous task demands [
44].
ECG and EDA serve as indicators of autonomic nervous system activity and arousal levels. In the ECG modality, an increase in the LF/HF ratio and a decrease in RMSSD reflect heightened sympathetic dominance and weakened parasympathetic regulation [
20]. In the EDA modality, reduced SCL and fewer SCRs point to lowered physiological arousal under fatigue [
45]. These observations suggest that the high cognitive and perceptual demands of remote tower operations may contribute to persistent autonomic tension and reduced heart rate variability during the progression of visual fatigue.
Overall, these features span four physiological systems—ocular activity, cortical electrical activity, autonomic regulation, and physiological arousal—forming a multimodal profile of visual fatigue in remote tower controllers. The findings confirm that visual fatigue is not solely a function of ocular strain, but is accompanied by broader physiological changes. This underscores the necessity and effectiveness of employing a multimodal fusion approach for fatigue recognition in this context.
It is also important to recognize that remote tower environments differ from conventional tower settings in several ways that may influence the fatigue dynamics. While traditional towers provide controllers with direct line-of-sight to the airfield, natural lighting, and real-world depth cues, remote towers depend on mediated displays and artificial illumination. These conditions may lead to a greater reliance on screen-based scanning, limited peripheral awareness, and prolonged accommodation demands. As such, visual fatigue in remote towers may occur more rapidly or manifest differently than in traditional towers, highlighting the importance of specialized models like the one proposed in this study.
It should also be noted that all participants in this study were professionally trained ATC students. Although they possessed adequate task capabilities, differences may exist between them and experienced controllers in terms of operational strategies, stress tolerance, and cognitive resilience. Future studies should therefore expand the sample to include in-service controllers to enhance the applicability and generalizability of the findings. Moreover, individual differences across age groups in visual sensitivity and neural regulation should be further considered to improve model adaptability and robustness.
5. Conclusions
This study focused on air traffic control tasks in remote tower environments and developed a visual fatigue recognition method based on multimodal physiological signals. The effectiveness and feasibility of using multimodal data for visual fatigue modeling were systematically validated. A high-fidelity remote tower simulation environment was constructed to collect multi-channel physiological signals including ET, EEG, ECG, and EDA. Fatigue state labels were generated by combining subjective visual fatigue questionnaires with objective ophthalmologic parameters, resulting in a high-confidence dataset.
Based on this, a two-stage recognition model integrating LightGBM and MLP was proposed and implemented. Under 12-fold cross-validation, the model achieved strong performance (Balanced Accuracy = 0.92, F1 = 0.90). The results further indicate that visual fatigue in remote tower environments involves coordinated changes across multiple systems including ocular activity, cortical neural activity, autonomic regulation, and physiological arousal.
In summary, this study provides both a theoretical foundation and a technical approach for visual fatigue recognition in remote tower settings, and establishes a practical basis for future developments in human factor evaluation, fatigue prediction, and dynamic intervention mechanisms. In future applications, the proposed model could be integrated into remote tower systems to support real-time fatigue mitigation—for example, through adaptive interface adjustments, feedback prompts to controllers when fatigue thresholds are detected, or seamless integration into existing tower management and safety assurance platforms. These capabilities would enable proactive fatigue management and promote sustainable operator performance. Future work may incorporate dynamic task load and individual variability to expand the model’s applicability across diverse tasks and populations and to advance the engineering deployment and intelligent development of human factor monitoring in remote tower systems.


