Abstract
The anticipated growth of the aviation industry has driven regulators to establish stringent targets for achieving net-zero greenhouse gas emissions, which are challenging to meet with conventional aircraft configurations. The strut-braced wing configuration has emerged as a promising alternative for improving aerodynamic efficiency. This study investigates the aerodynamic performance of such a configuration using a high-fidelity computational fluid dynamics analysis, conducted in two phases. The first phase involves a parametric study examining the effects of two key parameters: the length and the tilt angle of the strut’s elbow. The reference configuration is based on the strut braced wing configuration from the Platform for Aircraft Drag Reduction Innovation workshop. Building on the insights from the parametric study, the second phase involves an optimization of the strut’s geometry, focusing on minimizing aerodynamic drag. The results demonstrate an 11.5% reduction in the drag coefficient while maintaining the same lift coefficient, primarily attributed to a decrease in shockwave interactions within the strut–wing gap. These findings, combined with the parametric study, provide valuable insights into the influence of strut geometric parameters on drag minimization, highlighting their potential role in advancing sustainable aircraft design.
1. Introduction
The demand for the aviation industry is projected to grow substantially in the near future, driven by global demographic trends and the industry’s pivotal role in facilitating global connectivity [1]. However, aviation regulators have emphasized the necessity of sustainability, efficiency, and innovation to meet stringent objectives, as highlighted by future programs such as NASA’s N+3 initiative in the United States and the European FlightPath 2050 strategy. The former focuses on the development of next-generation disruptive aircraft configurations, including double-fuselage designs with cantilever wing configurations, strut-braced wing configurations, and hybrid wing-body configurations. These designs are categorized into two primary baselines: the D-series, a single-aisle, narrow-body class that corresponds to the Boeing 737-800, and the H-series, wide-body long-haul aircraft comparable to the Boeing 777-200LR [2]. Similarly, the European FlightPath 2050 initiative aims to establish a sustainable and efficient aviation system for Europe by 2050, adopting a systems-level approach that integrates infrastructure, regulations, and advanced technologies [3]. Both initiatives underline the importance of disruptive aircraft configurations as a prerequisite for achieving their stringent goals.
One approach to achieve these goals is by increasing the aspect ratio of the aircraft to minimize carbon emissions through reduced induced drag [4]. As demonstrated by the evolution of aircraft design, the aviation industry has already adopted this approach [5,6]. The aspect ratio of aircraft wings has steadily increased over time, from the Boeing 747 (1969) with an aspect ratio of 7.0 to the Boeing 787 (2011) with 9.59, and the Airbus A330, which has an aspect ratio of 10.06. Aircraft like the Boeing 777 and Airbus A340 introduced aspect ratios of around 9.0 to improve lift-to-drag ratios, while the Boeing 787 and Airbus A350 further increased aspect ratios to approximately 9.8. The latest models, such as the Boeing 777X, have an aspect ratio of 11.0, underlying the ongoing research in this type of approach.
However, this approach must also account for the aero-structural interaction between structural flexibility and aerodynamic loads when assessing aircraft performance, which in turn limits the maximum wingspan [7,8]. To address the limitations imposed by conventional cantilever-wing configurations, the strut-braced wing (SBW) configuration, proposed in the 1950s for transonic aircraft, has resurfaced as a viable research option today due to advancements in materials science [9,10].
One of the earliest examples of the truss-braced wing concept was the Hurel-Dubois HD-31, a prototype developed in 1953 by the French manufacturer Hurel-Dubois. Intended as a 36-passenger transport aircraft, the HD-31 featured a high-aspect-ratio wing (AR = 20.2) supported by lifting struts, a 148-foot wingspan, and high-lift flaps. The design aimed to reduce induced drag while keeping airframe weight low [11].
A variation of this concept, the truss-braced wing (TBW) configuration, was proposed to further enhance structural stability. This design offers structural benefits by reducing buckling modes of both wing and strut, but it may have considerable aerodynamic trade-offs due to the formation of a complex aerodynamic region bounded by the wing, strut, and trusses [12].
In 1975, Dr. Werner Pfenninger proposed a new TBW (truss-braced wing) configuration designed to reduce structural weight and improve aerodynamic efficiency, notably by increasing the lift-to-drag ratio (L/D) and promoting natural laminar flow. His design featured a structural truss supporting a reduced chord wing to enable greater laminar flow, thereby addressing the structural demands of a high-aspect-ratio configuration. The TBW concept garnered research interest due to its potential for significantly enhancing aerodynamic performance [11].
Recent programs, such as Subsonic Ultra-Green Aircraft Research (SUGAR) [13,14] and NASA’s X Program [15], have revitalized interest in unconventional aircraft configurations, notably the truss-braced wing. The SUGAR program, initiated in 2008, explored innovative designs and identified the truss-braced wing (TBW) and strut-braced wing (SBW) as a highly promising concept. Through comprehensive aero-structural analyses and wind tunnel testing, the feasibility of this configuration was validated. Subsequent phases further advanced the design, evaluating its aerodynamic and structural benefits at higher Mach numbers (up to 0.80) and incorporating high-lift systems alongside structural refinements. Currently, the research has progressed to enhanced wind tunnel testing, with ongoing investigations into buffet conditions and icing effects [15].
In parallel, NASA’s X Program includes the development of the X-66 configuration, a collaborative effort with Boeing to construct and test a near full-scale demonstrator. This initiative aims to validate the real-world advantages of the truss-braced wing design, addressing both economic and environmental performance metrics while refining associated design methodologies.
Studies conducted by the Multidisciplinary Analysis and Design (MAD) Center at Virginia Polytechnic Institute and State University (Virginia Tech) [16] have developed research methodologies that facilitate the integration of aero-structural behavior into conceptual-level aircraft design. These methodologies have been subsequently utilized by NASA in relevant studies [13].
However, the flow physics around such configurations require high-fidelity CFD analysis for a deeper understanding. As demonstrated in [17,18,19,20], the complex flow behavior near the wing–strut junction poses challenges, making reliance on low-fidelity models potentially unrealistic. To address these challenges, the open workshop PADRI (Platform for Aircraft Drag Reduction Innovation) [21] was established to explore optimization and flow control methodologies aimed at minimizing shockwave interference drag in the strut–wing junction region under cruise conditions.
This paper extends the analysis introduced in [22] and aims to evaluate the impact of strut geometry on wing and overall aircraft performance through high-fidelity CFD analysis, using the PADRI configuration as the baseline. Initially, a parametric study of the strut geometry is conducted to investigate the effects of the tilt angle and elbow length, while keeping the strut’s chordwise and spanwise attachment points on the wing fixed, consistent with the baseline configuration. This analysis examines how these parameters influence shockwave interactions between the wing and the strut. Furthermore, the parametric study explores the variations of these effects with changes in the angle of attack. Subsequently, the study compares the influence of these geometric parameters on overall performance to the outcomes of a two-dimensional aerodynamic shape optimization of the strut’s airfoil and its local incidence, using the PADRI configuration as the baseline. The 2D optimization approach was chosen to reduce computational cost and complexity, allowing for more efficient exploration of the strut’s airfoil geometry. However, this method has its limitations, primarily the inability to capture three-dimensional flow effects such as wingspan influences and flow interactions that occur in the full 3D configuration. The wing airfoil geometry was intentionally excluded from the optimization since the focus of this study is on understanding how variations in the strut geometry affect the overall aerodynamic characteristics, while maintaining the baseline wing geometry.
2. Methodology
The numerical setup employed in this study can be divided into two main categories. The first category focuses on a parametric study aimed at analyzing the aerodynamic characteristics of the PADRI configuration. Initially, a mesh convergence study was conducted to determine an appropriate grid size. The results were also compared with the data presented in [23] and the final grid was selected accordingly. Subsequently, a geometrical parameterization of the strut was developed to investigate the influence of the geometrical shape of the curved transition zone located near the strut–wing intersection. This analysis aims to quantify the impact of the strut’s geometry on the overall aerodynamic performance.
The second category involves an optimization process for the strut’s airfoil geometry using the gradient-based optimization algorithm. The optimization variables included the class–shape transformation (CST) parameters defining the airfoil geometry and the local incidence angle of the strut’s airfoil. Notably, this optimization process did not modify the geometry of the curved transition zone, as the objective was to evaluate whether the optimization could yield significantly improved results compared to those obtained from the parametric study, where the curved transition zone geometry was modified. Additionally, it is important to note that the geometry of the linear portion of the strut is represented by a uniform airfoil shape and a constant local incidence angle along its span.
2.1. Geometry Description
The PADRI geometry served as the reference for both the parametric study and the optimization process. This configuration, also utilized in [23], is widely regarded as a benchmark for such analyses. The PADRI geometry comprises three primary components: the fuselage, wing, and strut, as illustrated in Figure 1.
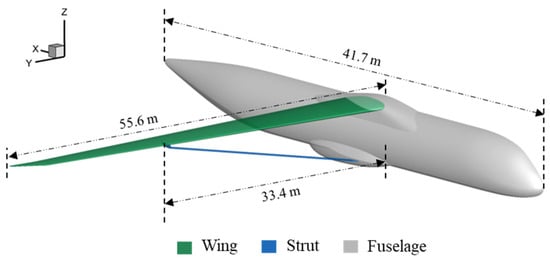
Figure 1.
Geometrical representation of the SBW configuration.
Table 1 presents the key geometric characteristics of the configuration, highlighting the critical parameters associated with the wing, strut, and fuselage [23]. As the PADRI geometry was specifically designed within the framework of the PADRI workshop to emphasize strut–wing interference, it holds particular relevance for the parametric and optimization studies conducted in this research.

Table 1.
Geometric characteristics of the PADRI configuration [23].
The parametric study involves modifying the curved transition zone using two parameters: the length of the linear zone L that intersects the wing and the tilt angle θ associated with this linear zone. In the reference geometry, the values correspond to L = 0.32 m and θ = 70°. The geometrical representation of these parameters is shown in Figure 2.

Figure 2.
Length parameter variation (a) and tilt parameter variation (b).
The parametric study involved the analysis of 8 cases across 4 angles of attack, resulting in a total of 28 cases. These cases were selected based on the baseline configuration. Initially, the length parameter L was varied while maintaining a constant tilt angle θ, and the effects were evaluated at four different angles of attack to quantify the influence of the length parameter. Subsequently, starting from the baseline configuration, the tilt angle θ was varied, and its effects were assessed at four different angles of attack. Additional analyses were also conducted on selected off-design geometries representing other combinations of the length parameter and elbow angle, which showed minimal differences. For example, a case with an elbow angle of 50° and length parameter of 0.42 at 1° angle of attack yielded 228.1 drag counts, compared to 228.5 drag counts for the same elbow angle but length parameter of 0.32. Similar minimal variations were observed in other combinations, leading us to conclude that expanding the parametric study further would be computationally expensive without substantial added insight. A numerical simulation matrix summarizing the study is presented in Table 2.

Table 2.
Computational simulation framework.
The optimization process utilized a two-dimensional CFD numerical simulation approach applied to a 2D section extracted from the PADRI configuration at Y = 16.4 m, as shown in Figure 3. This focused on optimizing the strut’s airfoil geometry in the region where shockwave interactions between the strut and the wing are most intense while maintaining the computational cost for the evaluation of the objective function at minimum.
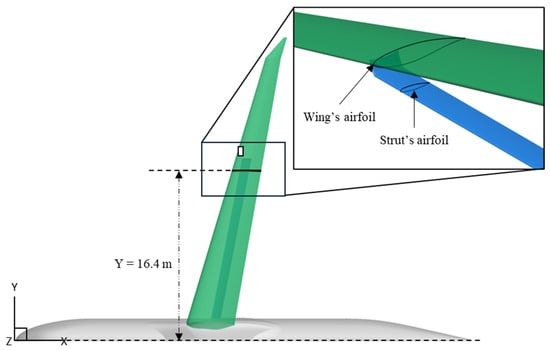
Figure 3.
Cross section view of the geometry used in the optimization process.
For the optimization process, a MATLAB R2020a code was developed to reconstruct the strut’s airfoil geometry using the class–shape transformation (CST) parameterization method [24]. This method defines the airfoil’s upper and lower surfaces as the product of two functions: the class function and the shape function. By varying the coefficients and , the method can produce airfoils with different trailing edge thicknesses, as shown in Equation (1) as follows:
The class function as defined in Equation (2) defines the type of airfoil being generated, establishing the class characteristics based on the and coefficients. In this case, a rounded leading edge and a sharp trailing edge were desired, so the coefficients were set to = 0.5 and = 1, respectively.
The shape function, as defined in Equation (3), modifies the airfoil geometry within the selected class. It incorporates the Bernstein polynomial, which ensures that the sum of the terms forming the Bernstein polynomial of any order is always equal to 1. The geometric adjustments for the upper and lower surfaces are controlled by the parameters within the shape function, enabling the exploration of a large design space.
Figure 4 presents the graphical interface of the MATLAB code used for the fitting process. The code takes as input the coordinates of the reference airfoil, the number of CST parameters for both the upper and lower surfaces, and the number of points. It then displays the fitted airfoil alongside the reference airfoil, and beneath the plot, it shows the absolute error between the two airfoils for both the upper and lower surfaces.
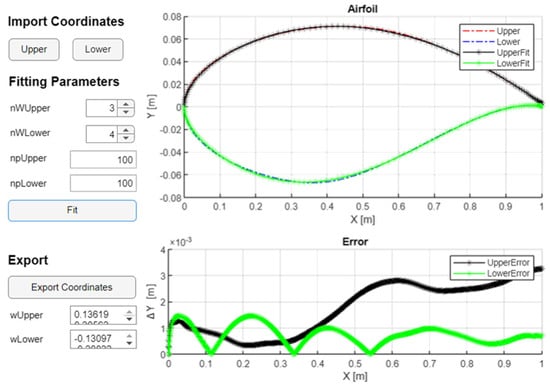
Figure 4.
Graphical interface of the MATLAB code designed for the fitting process.
2.2. Computational Grid
The computational grid generation utilized two different meshing programs optimal for each study: parametric or optimization study. In both cases, the grid was designed based on the flow conditions specified in the PADRI workshop: M = 0.72, Re = 7.1 × 10⁶, a cruise altitude of 30,000 ft, with a pressure of 30,089 Pa, a temperature of 228 K, and an angle of attack of α = 1°. Given the use of the k-ω SST turbulence model, the height of the first cell size was calculated corresponding to y+ = 1. Three grids, coarse, medium, and fine, were generated to evaluate mesh convergence. The medium grid was selected as the optimal balance between accuracy and computational efficiency for the parametric study.
Additionally, the results were compared with those from [23], which utilized structured multiblock grids with an overset technique and the Spalart–Allmaras turbulence model. Although this introduces methodological differences, including grid topology and solver characteristics, the comparisons still offer meaningful validation. The literature results were obtained at the same angle of attack α = 1° as the present grid refinement cases. Table 3 summarizes the mesh convergence analysis, where Δs refers to the height of the first cell adjacent to the wall, and the percentage error is calculated with respect to the finest grid solution. While the refinement study did not extend beyond the finest grid level (13.5 million cells), the differences in aerodynamic coefficients between the medium and fine grids were minimal. Given the significant computational cost associated with the parametric study, we consider this level of grid refinement to represent a practical and acceptable compromise. The inclusion of literature results, despite being based on a structured grid, is intended to provide transparent context regarding differences in grid resolution between structured and unstructured approaches.

Table 3.
Grid convergency study.
For the parametric study, the grid generation for the entire configuration used ANSA CAE. The surface mesh illustrated in Figure 5 was divided into four primary regions: fuselage, wing, strut, and curved transition zone. The element type was set to quadrilateral for all regions. The wing and fuselage were meshed with a maximum element size of 250 mm and a growth ratio of 1.2. The strut and curved transition zone shared a growth ratio of 1.15, with maximum element sizes of 50 mm and 10 mm, respectively. A consistent minimum element size of 1 mm was maintained across all regions. Anisotropic meshing features were incorporated for the trailing and leading edges of the wing and strut, supported by guiding curves to ensure anisotropy on their upper and lower surfaces. These adjustments optimized the grid size while maintaining high mesh quality and geometric accuracy.
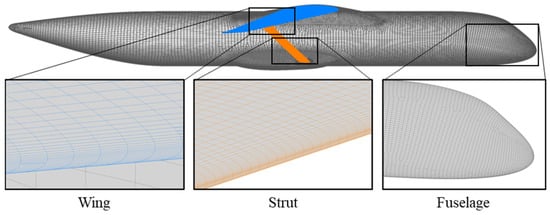
Figure 5.
Surface mesh used for the volume grid generation.
For the volume grid, the boundary layer region was discretized using prismatic, hexahedral-dominant layers generated with an inflation algorithm. The first cell size was set to 0.008 mm, with a growth ratio of 1.2, and a total of 51 layers were defined to accurately capture boundary layer flow region. For the remaining volume mesh, the Hexa Interior option was utilized, incorporating four buffer zones to ensure smooth transitions between the boundary layer and the core mesh. The final volume mesh, including the hexahedral grid and boundary layer region, is illustrated in Figure 6.
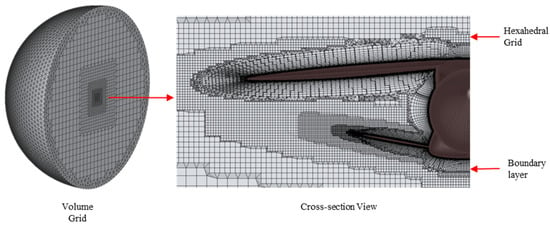
Figure 6.
Volume grid.
For the optimization process, ANSYS 2021 Meshing was selected as the optimal tool to streamline the coupling of geometry, grid generation, and numerical simulation. Due to the identical operating conditions, the first cell height and the number of layers in the inflation region were kept consistent with the 3D configuration. However, the growth ratio was adjusted: 1.2 for the wing and 1.1 for the strut due to the chord length differences. The dominant cell type for the mesh was set to triangular. For the strut and wing surfaces, a grid size of 3.5 mm was applied, with curvature refinement enabled to reduce the element size to 1.5 mm in regions requiring higher grid resolution. For the trailing edge of the wing and strut, a size of 5 divisions was selected, as the trailing edge thickness remained unchanged throughout the optimization process. The global growth size for the entire domain was set to 1.05, ensuring accurate capture of shockwave interactions, with a maximum cell size of 6 m. The resulting mesh in the domain is presented in Figure 7.
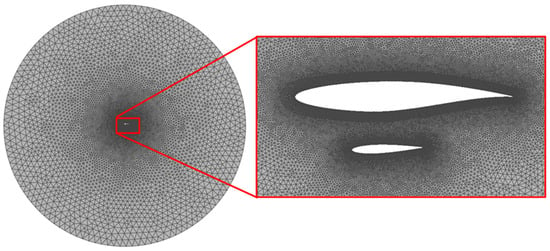
Figure 7.
Computational grid used in the optimization process.
2.3. Solver Description
The numerical simulations were conducted using the ANSYS Fluent CFD solver, employing the Reynolds-Averaged Navier–Stokes (RANS) equations coupled with the k-ω SST turbulence model. To address the excessive turbulent energy generation near the stagnation point, a common issue in two-equation turbulence models, a production limiter was applied to the turbulence production term. Additionally, the energy equation was included in the simulations to account for thermal effects.
Material properties for air were defined as follows: the ideal-gas law was utilized for compressible flow, specific heat was approximated using a piecewise polynomial profile, and kinetic theory was applied for thermal conductivity. Viscosity was determined based on Sutherland’s law, ensuring accurate modeling of air properties under the given flow conditions.
The pressure far-field boundary condition was applied, where the static pressure, Mach number, temperature, and flow direction were adjusted according to the flow conditions. The turbulent intensity was set to 5%, with a turbulent viscosity ratio of 10. For the 3D simulation, a symmetry boundary condition was used, as the simulations were conducted for varying angles of attack only, with no sideslip angle considered.
The density-based solver was selected with an implicit formulation, where the unknown value in each cell is computed using a relationship between the current and neighboring cells. This approach results in the implicit linearization of each equation in the coupled set of governing equations with respect to all the dependent variables. The flux type chosen was Roe-FDS, and the gradient calculation method was the least squares cell-based method. Flow variables, turbulent kinetic energy, and specific dissipation rate were solved using a second-order upwind scheme for improved accuracy. To accelerate solution convergence, ANSYS Solution Steering was employed in two stages. The first stage focused on smoothly transitioning from first-order to second-order accuracy, while the second stage aimed to enhance convergence by adjusting the CFL (Courant–Friedrichs–Lewy) number appropriately.
In the parametric study, flow convergence was monitored by tracking the residual histogram until it reached a plateau. Additionally, the axial and normal forces were observed until they either stabilized or exhibited quasi-steady-state behavior, characterized by oscillations around a fixed value with constant amplitude and pattern. For the 2D case used in the optimization process, convergence was automatically monitored through a MATLAB script. The script tracked the axial and normal forces, ensuring they remained within a plateau. The mean value of the last 500 iterations was required to be below 10−2 for the normal force and 10−3 for the axial force. A maximum of 5000 iterations was set to ensure that any unsteady cases were eliminated. If the mean value of the last 500 iterations continued to fluctuate beyond this limit, the airfoil configuration is eliminated.
2.4. Optimization Process
The optimization process was conducted for a 2D section extracted as presented in section A using MATLAB’s gradient-based optimization function fmincon. The default ‘interior-point’ algorithm was employed with constraints, as it efficiently transforms constrained optimization problems into a sequence of unconstrained problems by incorporating barrier functions or penalty terms into the objective function. The gradient of the objective function was calculated using a forward finite difference method. The convergence tolerance for both the function value and changes in variables was set to 10−4. The optimization objective was to minimize the drag coefficient while ensuring that the airfoil area remains at least 90% of the reference strut’s airfoil area. The decision to use only the drag coefficient as the objective function, without imposing constraints on the lift coefficient, was made to allow greater flexibility in varying the local incidence of the strut’s airfoil. This approach was based on the premise that the strut contributes significantly less to the overall lift compared to the wing. As such, prioritizing drag reduction at the expense of a relative decrease in lift was considered more beneficial for improving the overall aerodynamic performance. The mathematical formulation of this optimization problem is expressed in Equation (4) as follows:
The optimization variables are the CST parameters for the upper and lower surfaces of the strut’s airfoil, with three parameters assigned to each surface, as well as the local incidence of the strut’s airfoil. This results in a total of seven design variables defined for the optimization problem. The logical framework for evaluating the objective function is presented in Figure 8. A MATLAB script was used to generate the strut’s airfoil coordinates based on the CST parametrization method. These coordinates were exported to ANSYS Design Modeler, where a JScript was employed to create the computational domain. Subsequently, the domain was meshed as described in Section B and exported to ANSYS Fluent for aerodynamic analysis, as outlined in Section C. The lift and drag coefficients were extracted from Fluent and integrated into the optimization loop to guide subsequent iterations.
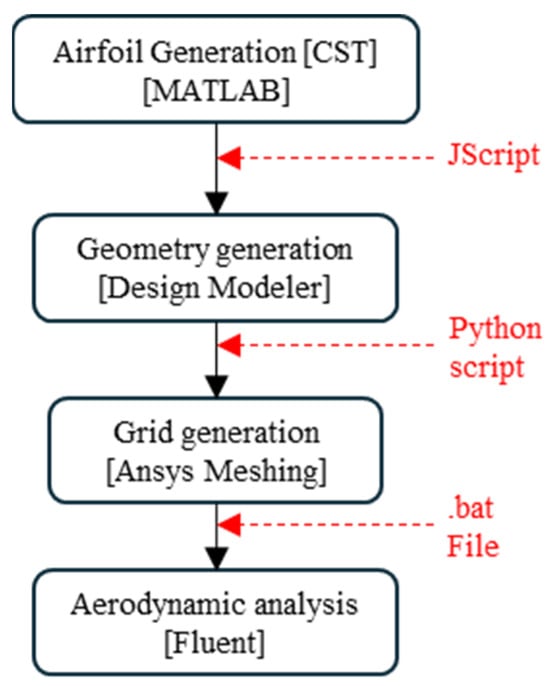
Figure 8.
Logical scheme objective function evaluation automation.
3. Results
The results are divided into two sections: parametric and optimization results. The former begins with a quantitative analysis, presenting the variation of drag and lift coefficients as functions of incidence across all the evaluated cases. This is followed by qualitative representations used to investigate the influence of individual parameters on the shockwave interaction region. Furthermore, the findings illustrate how these effects vary with changes in the angle of attack through pressure distributions representations on both wing and strut surfaces.
The optimization results begin with a geometric comparison between the optimized and reference airfoil, alongside the convergence histogram of the entire optimization process. This is followed by quantitative results, where a comparison is made between the analysis of the entire optimized configuration and the results from the parametric study. The qualitative results then demonstrate how the supersonic region is affected by the optimization process. Pressure coefficient distribution comparisons between the optimized and PADRI configurations are presented across three representative cross-sectional planes and along the lower surface of the wing, demonstrating how the optimized configuration minimizes shockwave interactions and improves the aerodynamic characteristics of the strut-braced wing configuration.
3.1. Parametric Study
The first parameter analyzed is the length parameter L. The variations in lift and drag coefficients are presented in Figure 9 and Figure 10. A quasi-linear relationship is observed between the drag coefficient and the length parameter, with an increase in the latter leading to a reduction in drag. Furthermore, it was observed that the sensitivity of this parameter diminishes as the angle of attack increases. For α = 1°, the reference flow configuration, the drag coefficient decreases from 230 drag counts to 221, indicating a reduction of approximately 4%. Looking at the variation of the drag coefficient with respect to the angle of attack reveals that at α = 0°, the drag reduction is 6%, while at α = 3°, the reduction decreases to 2.2%. In the case of the lift coefficient, the length parameter exhibits minimal influence, with only marginal changes observed at α = 0° and α = 3°. This behavior can be attributed to the fact that variations in the length parameter primarily affect the intensity of shockwave interactions, which have a more significant impact on the overall drag than on lift. However, a subtle change in lift coefficient behavior can be observed at 0° and 3° angles of attack. As the length parameter increases, there is a slight but noticeable rise in lift coefficient. This trend may be attributed to stronger shockwave interactions at 0°, where the shock intensity is highest. These interactions alter the pressure coefficient distribution on the wing and strut, leading to a reduction in lift. At 3°, a similar but much less pronounced effect is observed, with the difference in lift coefficient remaining under 1%. This reduced influence is consistent with the overall trend of diminishing sensitivity to the length parameter as the angle of attack increases.
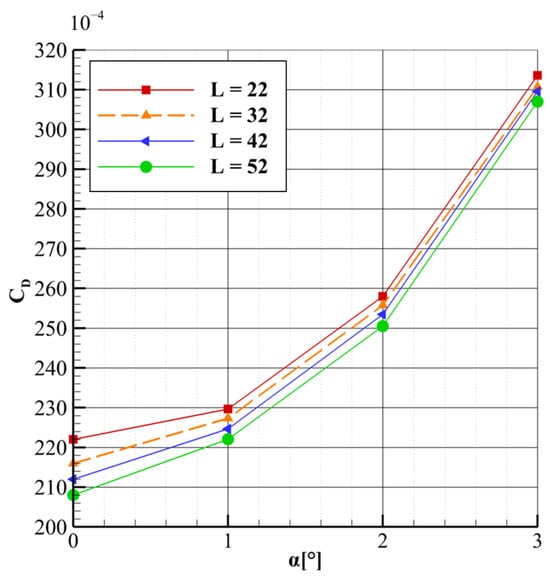
Figure 9.
CD vs. α for different lengths L at θ = 70°.
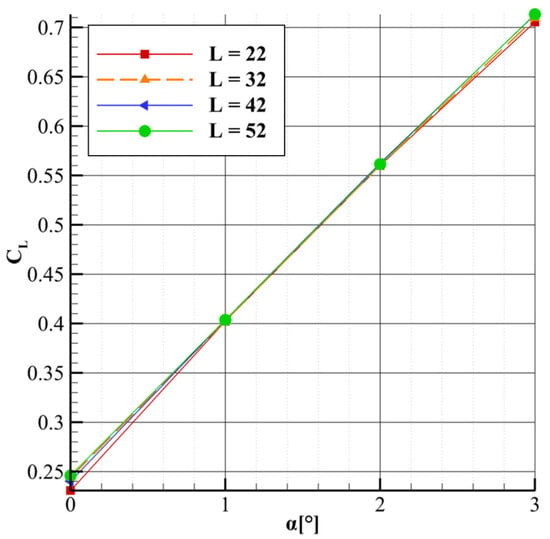
Figure 10.
CL vs. α for different lengths L at θ = 70°.
Figure 11 shows that as the length parameter increases, the lift-to-drag ratio improves, with the curves maintaining a quasi-parallel trend. In addition, the sensitivity of the lift-to-drag ratio to the length parameter increases slightly with higher lift coefficients. For instance, at lower CL values, the variation in CL/CD due to changes in length is small, whereas at higher CL values, the sensitivity becomes more pronounced. This suggests that the aerodynamic benefits of increasing the strut length become more significant at higher lift coefficients. A similar quasi-parallel trend is seen in Figure 12, which plots CL versus CD. As with the drag versus angle of attack curve, the influence of the length parameter on lift becomes less pronounced at higher lift coefficients, though the reduction in lift is less substantial than the corresponding decrease in drag.
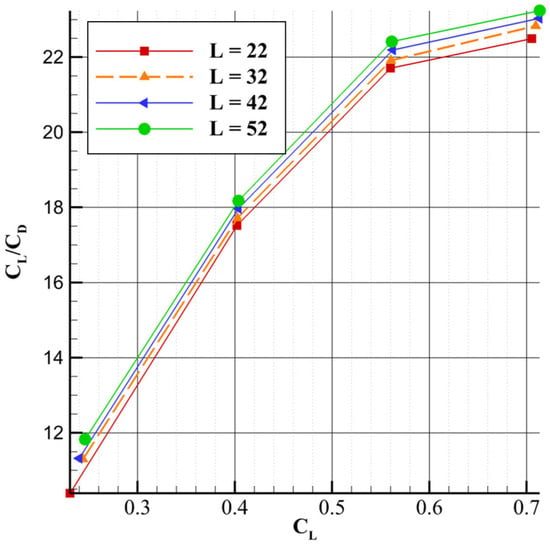
Figure 11.
CL/CD vs. CL for different lengths L at θ = 70°.
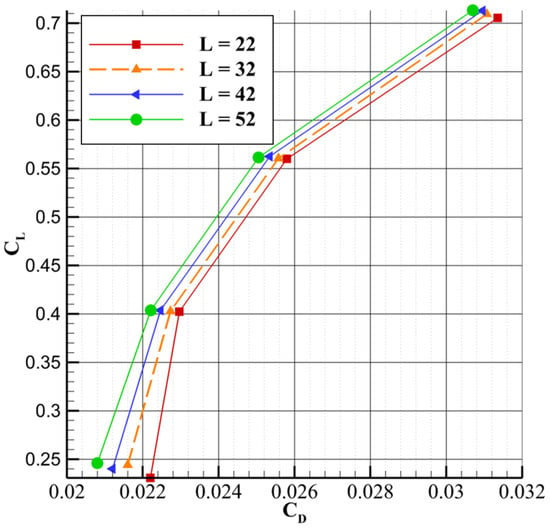
Figure 12.
CL vs. CD for different lengths L at θ = 70°.
For a better understanding of the influence of the length parameter L, shockwave iso-surface visualizations are presented in Figure 13, using the method proposed by Lovely and Haimes [25], an approach similar to the one used in [23]. This approach is based on the principle that an oblique shockwave can be interpreted as a normal shockwave superimposed on a uniform flow, thus the flow properties in the direction normal to the shock satisfy the governing relations of normal shocks.
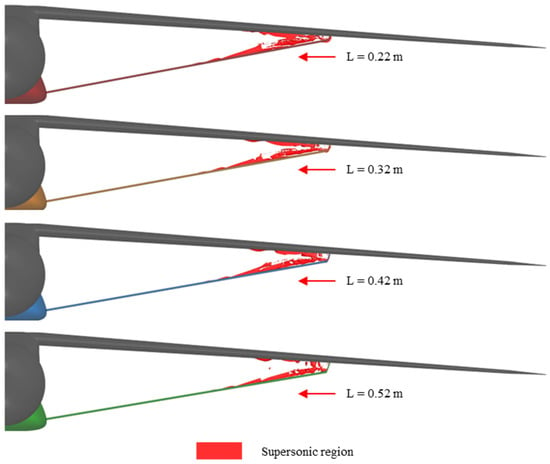
Figure 13.
Supersonic region variation with respect to the length parameter for fixed θ = 70° at α = 1°.
Equation (5) describes the iso-surface, where Ma represents the Mach number vector aligned with the local flow velocity V, a denotes the local speed of sound, and the local pressure gradient.
Figure 13 illustrates the variation in the supersonic region with length parameter L, while maintaining a fixed twist angle θ = 70° at α = 1°. An iso-surface value of 1.1 was chosen for the visualization. As can be seen, increasing L results in a reduction in the dimensions of the supersonic region. This aligns with the quantitative results presented earlier, which show a reduction in the drag coefficient, attributed to the minimization of the shockwave-induced drag. Notably, when L = 0.22 m, a shockwave forms on the lower surface of the strut elbow, but this region disappears as L increases. Furthermore, parameter L has a more significant influence on the lower surface of the wing, where the supersonic region diminishes with increasing L. This behavior can be explained by the larger gap between the wing and the strut, which reduces fluid acceleration. A similar effect is observed on the strut, where the location of the first appearance of the shockwave shifts further in the y-direction.
Figure 14 illustrates the variation in pressure coefficient distribution with respect to the angle of attack for the reference case. As the angle of attack increases, the spanwise extent of the shockwave appears to decrease. This behavior may be attributed to changes in the pressure distribution caused by altered flow conditions. At higher angles of attack, the pressure gradient along the flow direction on the lower surface of the wing becomes less steep, reducing both the strength and spanwise influence of the shockwave. This likely occurs because the flow acceleration on the inner surface of the wing begins to diminish, leading to an overall deceleration of the flow through the channel formed between the wing and strut.
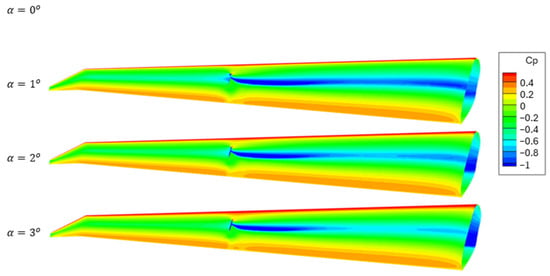
Figure 14.
Pressure coefficient distribution with respect to angle of attack for L = 0.32 m and θ = 70°.
The results from the parametric study of the tilt angle θ = 70° indicate that neither the drag coefficient nor the lift coefficient is significantly affected, as can be seen in Figure 15 and Figure 16. This suggests that the predominant influence arises from the fluid acceleration caused by the size of the gap between the wing and strut, rather than the tilt of the elbow geometry.
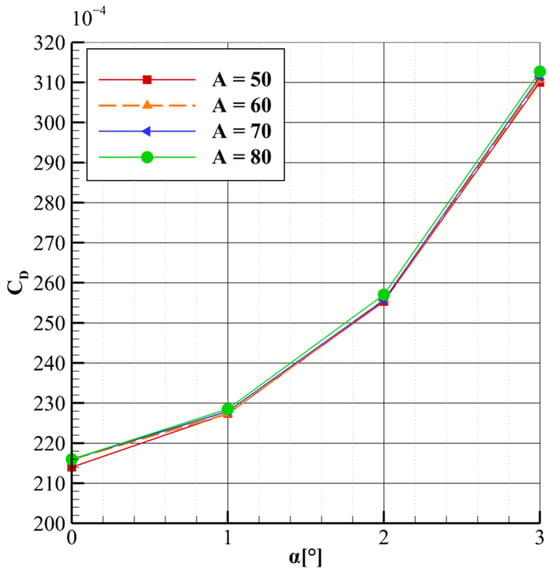
Figure 15.
CD vs. α for different tilt angles θ at L = 0.32 m.
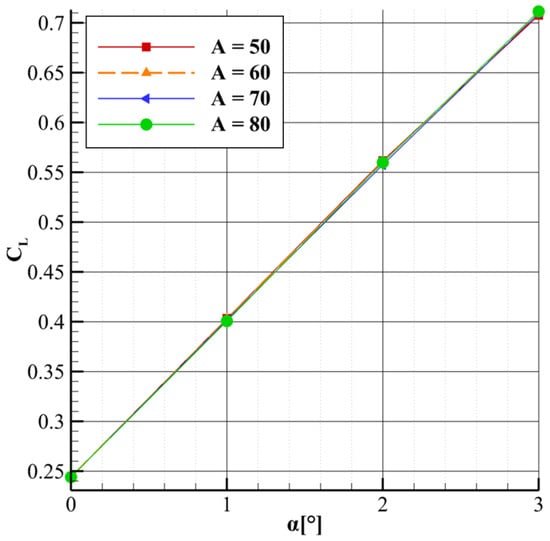
Figure 16.
CL vs. α for different tilt angles θ at L = 0.32 m.
The parametric study reveals that an important factor influencing the strut’s impact is the angle of attack, indicating that a lower local incidence of the strut may result in a reduced drag coefficient. We observed that fluid acceleration is strongly influenced by the size of the flow channel formed between the strut and the wing. A larger area reduces fluid acceleration, thereby minimizing shockwave intensity and interactions. Additionally, we hypothesized that adjusting the local incidence of the strut’s airfoil could further influence the flow channel shape, offering another means to control fluid acceleration and reduce shockwave interactions. This made the optimization process incorporate the local incidence of the strut as an optimization variable to evaluate its effect on the aerodynamic characteristics.
3.2. Optimization Study
The optimization results for the strut’s airfoil cross-section at Y = 16.4 m are presented below. Figure 17 compares the optimized airfoil with the reference design. The optimized airfoil shows significant geometry modifications at the leading edge of the strut’s lower surface, allowing an increase in acceleration along it.
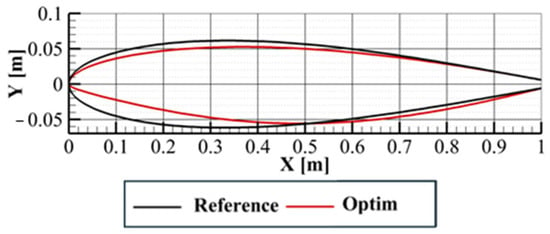
Figure 17.
Geometry comparison between the optimum and reference geometry.
The optimization process resulted also in a new incidence angle of α = −2.31°. This highlights the importance of reducing the flow acceleration within the strut–wing gap in order to minimize shockwave-induced drag, as demonstrated by the parametric study results presented earlier. The negative angle of attack effectively reduces the velocity on the upper surface of the strut, thereby minimizing the shockwave intensity.
Figure 18 presents the convergence histogram of the optimization process. The drag coefficient, which was used as the objective function, was reduced by nearly 28% while reaching the minimum surface area constraint. Although the lift coefficient also decreased by 24%, the larger reduction in drag led to a 4.5% improvement in the lift-to-drag ratio. This outcome may result in a slight reduction in overall lift for the aircraft. The improvement is primarily attributed to the optimized local incidence angle of the strut, which helped reduce flow acceleration within the strut–wing channel. It is important to note that this optimization was performed in two dimensions, and therefore, three-dimensional effects such as spanwise flow and the strut elbow geometry were not accounted for. Thus, the fully optimized aircraft configuration, which incorporates the modified strut geometry, was analyzed and compared with the reference configuration. In the optimized configuration, the strut geometry was generated using the same airfoil and a constant local incidence along the entire span.
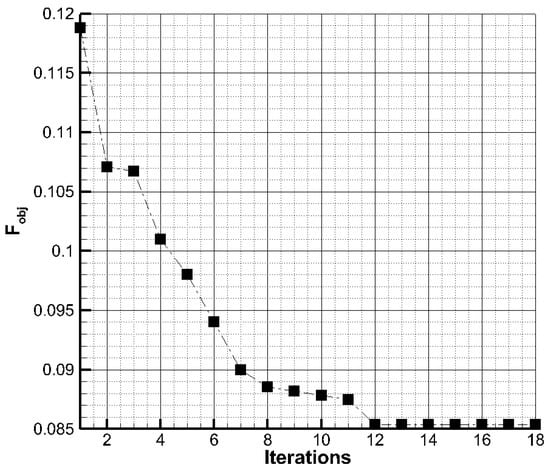
Figure 18.
Convergency histogram of the optimization process.
Figure 19 and Figure 20 show the lift and drag coefficients variation with angle of attack for the optimized configuration, compared to the results from the parametric study. As observed, the quasi-linear trend of the strut remains as in the parametric study, but the drag coefficient reduction is more pronounced. Particularly, for the reference flow conditions, the drag coefficient is reduced by 14%, as indicated by the orange dashed line representing the reference geometry. However, this drag reduction comes at the cost of a 10% decrease in the lift coefficient, due to the negative local incidence of the strut. To mitigate this trade-off, the angle of attack of the entire configuration was adjusted to match the lift coefficient of the reference geometry. The new angle of attack was determined to be α = 1.3°, resulting in an 11.5% reduction in drag compared to the reference geometry. This significant drag reduction demonstrates the utility of the insights gained from the parametric study, particularly regarding the importance of flow acceleration within the strut–wing gap, in suggesting the inclusion of the strut local incidence as an optimization variable. Furthermore, although the optimization was conducted in 2D, neglecting spanwise effects and the strut’s elbow geometry, the primary factor contributing to the drag reduction was found to be flow acceleration reduction.
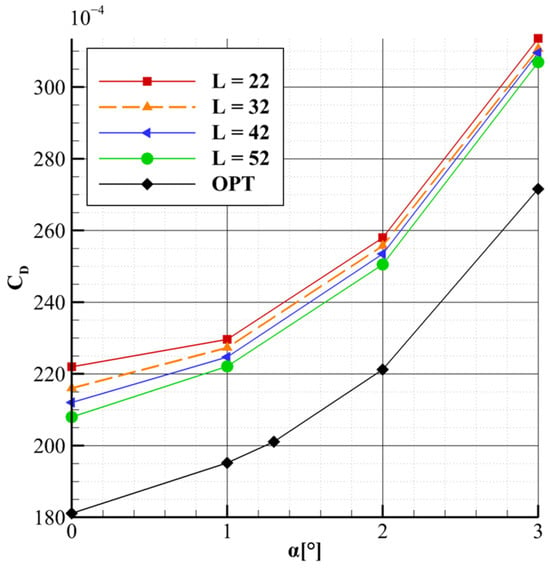
Figure 19.
CD vs. α for the optimized configuration compared to the parametric study results.
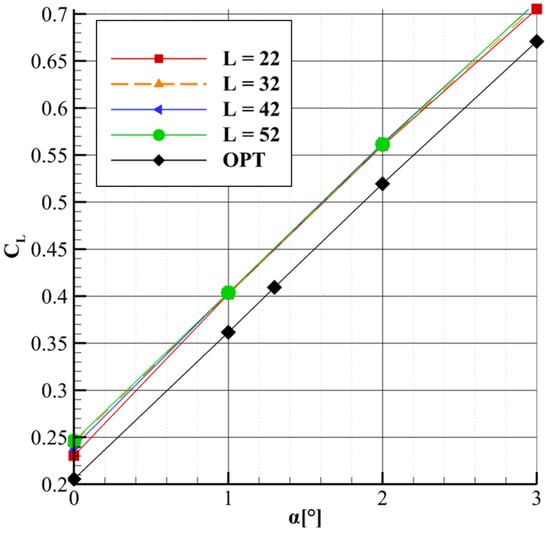
Figure 20.
CL vs. α for the optimized configuration compared to the parametric study results.
Figure 21 compares the lift-to-drag ratio of the optimized configuration to those from the parametric studies. At the same lift coefficient corresponding to the α = 1° case in the parametric study, the optimized configuration shows a 16.2% increase in the lift-to-drag ratio, while maintaining the quasi-linear trend observed in the original configurations. In Figure 22, the drag coefficient is consistently lower for the optimized case at equivalent lift values, with the curve appearing quasi-offset from the others, highlighting the drag reduction achieved through optimization. To better represent the effect of the optimized configuration, Figure 23 shows the supersonic region using an approach similar to [23], consistent with the representation used in the parametric study and compared against the reference geometry. The reduction in the supersonic region is substantial, with a noticeable mitigation of the supersonic flow across the entire strut geometry, except near the elbow region. A similar effect is observed on the lower surface of the wing. In the strut’s elbow region, a slight increase in shockwave region size is observed, indicating a clear influence of the strut elbow geometry and spanwise effects on the flow.
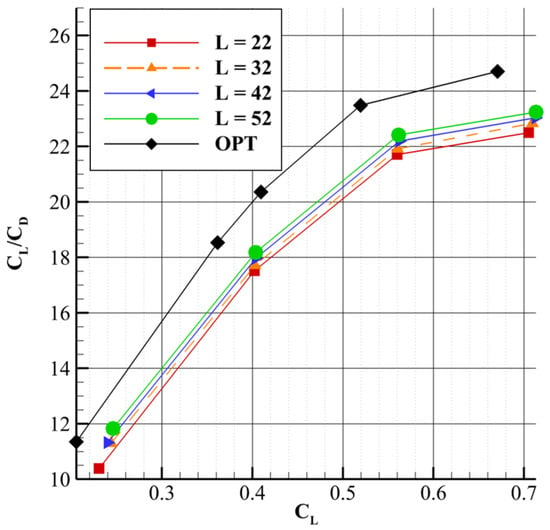
Figure 21.
CL/CD vs. CL for the optimized configuration compared to the parametric study results.
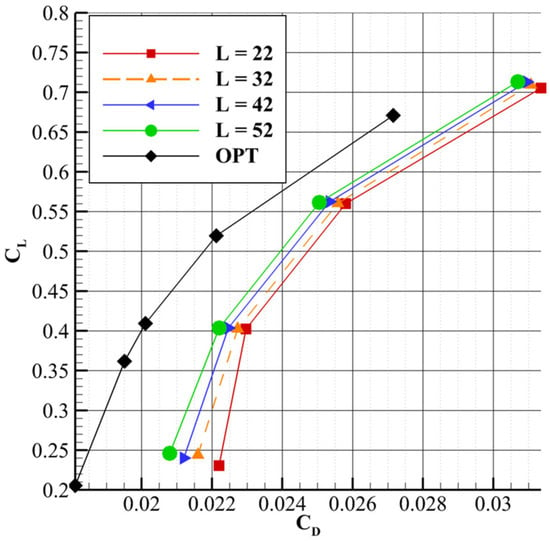
Figure 22.
CL vs. CD for the optimized configuration compared to the parametric study results.

Figure 23.
Shockwave region comparison between the optimized and reference geometry.
Figure 24 compares the pressure coefficient distribution on the lower surface of the wing between the optimized configuration and the reference geometry at the same angle of attack and their corresponding lift coefficients. The reduction in shockwave intensity is significant, with a decrease across the entire wing, except near the strut’s elbow. This comparison also highlights the importance of the optimized strut airfoil geometry in mitigating the effects of shockwave interactions within the strut–wing gap. The optimized geometry leads to a weaker shock on the lower surface of the wing, which contributes to the overall drag reduction. Additionally, the results emphasize the potential for further optimization, particularly in the elbow region where the spanwise and elbow geometry effects are taken into consideration, to achieve even greater performance improvements.

Figure 24.
Pressure coefficient distribution on the lower surface of the wing for the optimized and reference geometries.
To further investigate these effects, three representative regions were selected, as shown in Figure 25, an approach similar to that adopted in [23], to analyze how the pressure coefficient distribution changes with respect to the spanwise position within the strut–wing gap. The selected regions are as follows: the first is the region where the 2D optimization was performed at Y = 16.4 m, the second is near the end of the supersonic region at Y = 15 m, and the last is located further away at Y = 14 m from the supersonic region but still within the aerodynamic interaction zone between the strut and wing.

Figure 25.
Cross-section locations used for further flow field visualizations.
The pressure coefficient distribution across the three analyzed sections illustrated in Figure 26 clearly demonstrates a reduction in the intensity of shockwave interactions between the optimized and reference geometries. This effect becomes more pronounced as the sections move further from the strut’s elbow, consistent with the shockwave region results presented earlier. Additionally, the optimized airfoil shows a delayed shockwave on the upper surface compared to the reference geometry, notably visible in the Y = 15 m section. At Y = 14 m, the reduction in shockwave interactions is more pronounced, mitigating the supersonic region and confirming the decrease in flow acceleration. In the region near the strut’s elbow at Y = 16.4 m, however, a more intense shockwave is observed, likely due to spanwise flow effects and the presence of the elbow geometry, which were not captured in the 2D optimization process. These findings underscore that the overall drag reduction is primarily attributed to the optimization of the strut–wing gap, where 3D effects are not considered. This suggests that further improvements could be achieved by addressing the strut elbow region as well as the wing’s geometry in that region in a full 3D optimization framework.
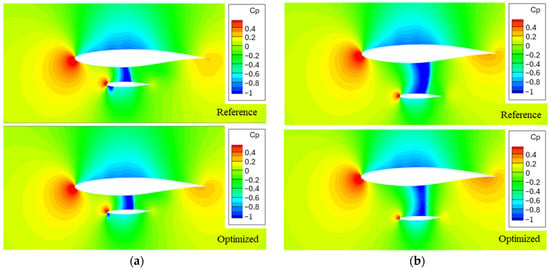
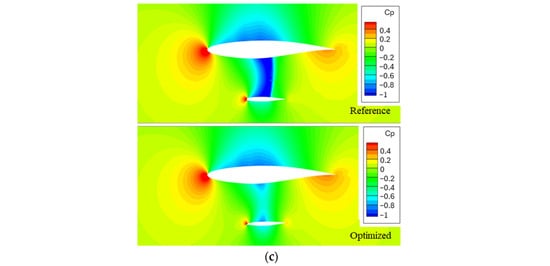
Figure 26.
Pressure coefficient distribution for the three analyzed cross-sections (a) Y = 16.4 m, (b) Y = 15 m, (c) Y = 14 m.
4. Conclusions
The results presented in this paper highlight the importance of exploring the impact of strut geometry on the strut-braced wing configuration. Findings from the parametric study emphasize the significance of the strut–wing gap size and provide valuable insights regarding the influence of the length parameter L compared to the tilt angle θ. While the drag variation from the parametric study of the length parameter was minimal, only 4%, it contributed to a better understanding of the role of flow acceleration in the strut–wing region. This insight led to the inclusion of the strut’s local incidence as an optimization variable, alongside the airfoil shape. Even in the 2D optimization, this proved beneficial, resulting in a substantial drag reduction.
In the 3D configuration, the drag reduction was lower due to the neglect of 3D effects, such as spanwise flow and the elbow geometry, in the optimization process. However, these effects were consistent, leading to a 14% drag reduction compared to the reference geometry. Despite this, the negative local incidence of the strut’s geometry resulted in a 10% reduction in the lift coefficient. To mitigate this, the incidence angle was adjusted to α = 1.3°, matching the lift coefficient with the reference geometry and achieving a 11.5% drag reduction.
The shockwave region visualizations using iso-surfaces clearly show a reduction in size, with a slight increase near the strut’s elbow. This was also shown in the pressure coefficient distributions across three representative sections, suggesting that further optimization considering 3D effects near the strut’s elbow could lead to additional drag minimization.
This paper demonstrates the dominant effect of the strut’s local incidence on the shockwave induced drag, showing that optimizing the strut can significantly improve the aerodynamic characteristics. Further benefits were also observed from the geometry optimization of the strut’s airfoil. The parametric study indicated that, while improvements in overall drag could be achieved, the length parameter L and tilt angle θ are less critical than the strut’s local incidence in minimizing shockwave-induced drag.
Author Contributions
Conceptualization, M.-V.H., D.-E.C. and I.B.; methodology, M.-V.H., M.-V.P. and I.B.; software, M.-V.H. and M.-V.P.; validation, D.-E.C. and M.-V.P.; formal analysis, M.-V.H. and D.-E.C.; resources, M.-V.P.; data curation, M.-V.H.; writing—original draft preparation, M.-V.H.; writing—review and editing, M.-V.P., D.-E.C. and I.B; visualization, M.-V.H.; supervision D.-E.C. and M.-V.P.; project administration, M.-V.H., and funding acquisition, M.-V.P. All authors have read and agreed to the published version of the manuscript.
Funding
This research was funded by the Romanian Ministry of Research, Innovation and Digitalization through the Core Program “Advanced research for increasing competitiveness and enhancing design, analysis, and expertise capabilities specific to the aerospace field—AEROEXPERT 2023–2026”, grant number [PN 23 17 01 01] named Development of design, analysis, and optimization capabilities for environmentally friendly aircraft.
Data Availability Statement
The data presented in this study are available on request from the corresponding author.
Acknowledgments
This work represents a relevant part of the first author’s PhD thesis, titled “Contributions to aerodynamic optimization of a strut braced wing aircraft configuration”. This work was presented as Conference Paper AIAA 2025-2709 at AIAA SciTech Forum, Orlando, FL, 6–10 January 2025.
Conflicts of Interest
The authors declare no conflicts of interest.
Abbreviations
The following abbreviations are used in this manuscript:
| CFD | Computational fluid dynamics |
| CST | Class–shape transformation |
| Fobj | Objective function |
| RANS | Reynolds-averaged Navier–Stokes |
| SST | Shear stress transport |
References
- Dy, B.; Meeran, A.; Agarwal, A.; Joyce, S. A new world of airports: Forecasting 2050 aviation networks towards sustainable adaptation. In Proceedings of the 26th Air Transport Research Society World Conference, Kobe, Japan, 1–4 July 2023. [Google Scholar]
- Greitzer, E.M.; Bonnefoy, P.A.; De la Rosa Blanco, E.; Dorbian, C.S.; Drela, M.; Hall, D.K.; Hansman, R.J.; Hileman, J.I.; Liebeck, R.H.; Lovegren, J.; et al. N+3 Aircraft Concept Designs and Trade Studies, Final Report; NASA CR-216794/VOL1; NASA: Washington, DC, USA, 2010. [Google Scholar]
- Flightpath 2050 Europe’s Vision for Aviation; KI-31-11-098-EN; European Commission: Luxembourg, 2011; Available online: https://www.arcs.aero/sites/default/files/downloads/Bericht_Flightpath_2050.pdf (accessed on 20 June 2024).
- Green, J.E. Laminar Flow Control-Back to the Future? In Proceedings of the 38th Fluid Dynamics Conference and Exhibit, AIAA, Seattle, DC, USA, 23–26 June 2008. [Google Scholar] [CrossRef]
- Kretov, A.; Tiniakov, D. Evaluation of the Mass and Aerodynamic Efficiency of a High Aspect Ratio Wing for Prospective Passenger Aircraft. Aerospace 2022, 9, 497. [Google Scholar] [CrossRef]
- Kilimtzidis, S.; Kostopoulos, V. Multidisciplinary structural optimization of novel high-aspect ratio composite aircraft wings. Struct. Multidiscip. Optim. 2023, 66, 150. [Google Scholar] [CrossRef]
- Kenway, G.K.W.; Martins, J.R.R.A. Multipoint high-fidelity aerostructural optimization of a transport aircraft configuration. J. Aircr. 2014, 51, 144–160. [Google Scholar] [CrossRef]
- Martins, J.R.R.A.; Kennedy, G.; Kenway, G.K. High Aspect Ratio Wing Design: Optimal Aerostructural Tradeoffs for the Next Generation of Materials. In Proceedings of the 52nd Aerospace Sciences Meeting, AIAA, National Harbor, MD, USA, 13–17 January 2014. [Google Scholar] [CrossRef]
- Gur, O.; Bhatia, M.; Schetz, J.A.; Manson, W.H.; Kapania, R.K.; Mavris, D.N. Design Optimization of a Truss-Braced-Wing Transonic Transport Aircraft. J. Aircr. 2010, 47, 1907–1917. [Google Scholar] [CrossRef]
- Gern, F.H.; Ko, A.; Grossman, B.; Haftka, R.; Kapania, R.; Mason, W.; Schetz, J. Transport Weight Reduction Through MDO: The Strut-Braced Wing Transonic Transport. In Proceedings of the 35th AIAA Fluid Dynamics Conference and Exhibit, AIAA, Toronto, ON, Canada, 6–9 June 2005. [Google Scholar] [CrossRef]
- Wells, D.P. Wing Configuration Impact on Design Optimums for a Subsonic Passenger Transport; NASA Langley Research Center: Hampton, VA, USA, 2014. [Google Scholar]
- Coggin, J.M.; Kapania, R.K.; Schetz, J.A.; Vijakumari, H.; Zhao, W. Nonlinear Aeroelastic Analysis of a Truss Based Wing Aircraft. In Proceedings of the 55th AIAA/ASME/ASCE/AHS/ASC Structures, Structural Dynamics, and Materials Conference, AIAA, National Harbor, MD, USA, 13–17 January 2014. [Google Scholar] [CrossRef]
- Harrison, N.A.; Hoffman, K.; Lazzara, D.S.; Reichenbach, E.Y.; Sclafani, A.J.; Droney, K. Subsonic Ultra Green Aircraft Research: Phase IV Final Report—Volume I Mach 0.80 Transonic Truss-Braced Wing High Speed Design Report; NASA CR-20220016017; NASA Langley Research Center: Hampton, VA, USA, 2023; Volume 1. [Google Scholar]
- Bradley, M.K.; Droney, C.K. Subsonic Ultra Green Aircraft Research Phase II: N+4 Advanced Concept Development; NASA CR-2012-217556; NASA Langley Research Center: Hampton, VA, USA, 2012. [Google Scholar]
- Wells, D.P.; Gatlin, G.M.; June, J.C.; Marien, T.V. NASA Transonic Truss-Braced Wing Studies. Document ID-20240007120. In Proceedings of the 34th Congress of the International Council of the Aeronautical Sciences, Florence, Italy, 9–13 September 2024. [Google Scholar]
- Grasmeyer, J.M.; Naghshineh-Pour, A.; Tetrault, P.A.; Grossman, B.; Haftka, R.; Kapania, R.; Mason, W.; Schetz, J.A. Multidisciplinary Design Optimization of a Strut-Braced Wing Aircraft with Tip-Mounted Engines; MAD Center Report 98-01-01; Virginia Tech: Blacksburg, VA, USA, 1998. [Google Scholar]
- Xiong, J.; Fugate, J.; Nguyen, N.T. Jig Twist Optimization of Mach 0.745 Transonic Truss-Braced Wing Aircraft and High-Fidelity CFD Validation. In Proceedings of the AIAA Scitech 2020 Forum, AIAA, Virtual Event, 6–10 January 2020. [Google Scholar] [CrossRef]
- Xiong, J.; Nguyen, N. Steady and Unsteady Simulations of Transonic Truss-Braced Wing Aircraft for Flight Dynamic Stability Analysis. In Proceedings of the AIAA Aviation Forum, AIAA, Virtual Event, 27 June–1 July 2022. [Google Scholar] [CrossRef]
- Xiong, J.; Nguyen, N.; Fugate, J. Study of Mach 0. In In 8 Transonic Truss-Braced Wing Aircraft Wing-Strut Interference Effects. In Proceedings of the AIAA Scitech 2021 Forum, AIAA, Virtual Event, 11–21 January 2021. [Google Scholar] [CrossRef]
- Jones, B.; Nagy, P.; Minisci, E.; Fossati, M. A Geometric Sensitivity Study for the Aerodynamics of a Strut-Braced Airframe. Aerosp. Sci. Technol. 2023, 142, 108638. [Google Scholar] [CrossRef]
- Kenway, G.; Housman, J.; Kiris, C. NASA Ames Research Center Contributions to the PADRI Workshop; NASA Technical Memorandum ARC-E-DAA-TN49604; NASA: Moffett Field, CA, USA, 2017. Available online: https://ntrs.nasa.gov/citations/20190028817 (accessed on 28 March 2025).
- Hothazie, M.-V.; Crunțeanu, D.-E.; Pricop, M.-V.; Bunescu, I. Exploring the Impact of Strut Geometry on Strut-Braced Wing Configurations. In Proceedings of the Conference Paper AIAA 2025-2709 at AIAA SciTech Forum, Orlando, FL, USA, 6–10 January 2025. [Google Scholar]
- Secco, N.R.; Martins, J.R.R.A. RANS-Based Aerodynamic Shape Optimization of a Strut-Braced Wing with Overset Meshes. J. Aircr. 2019, 56, 217–227. [Google Scholar] [CrossRef]
- Kulfan, B.M. A Universal Parametric Geometry Representation Method—‘CST’. In Proceedings of the 45th AIAA Aerospace Sciences Meeting and Exhibit, AIAA, Reno, Nevada, 8–11 January 2006. [Google Scholar] [CrossRef]
- Wu, Z.; Xu, Y.; Wang, W.; Hu, R. Review of Shock Wave Detection Method in CFD Post-Processing. Chin. J. Aeronaut. 2013, 26, 501–513. [Google Scholar] [CrossRef]
Disclaimer/Publisher’s Note: The statements, opinions and data contained in all publications are solely those of the individual author(s) and contributor(s) and not of MDPI and/or the editor(s). MDPI and/or the editor(s) disclaim responsibility for any injury to people or property resulting from any ideas, methods, instructions or products referred to in the content. |
© 2025 by the authors. Licensee MDPI, Basel, Switzerland. This article is an open access article distributed under the terms and conditions of the Creative Commons Attribution (CC BY) license (https://creativecommons.org/licenses/by/4.0/).