Abstract
In order to determine the installation position of the front fin on the example rocket forebody, an optimized method based on a comprehensive evaluation indicator and variable step search is presented. The comprehensive indicator consists of four weight coefficients, two lateral aerodynamic forces and two aerodynamic moments. The computational fluid dynamics method based on a shear stress transport turbulence model is established to analyze the flow field characteristics of the forebody. The results indicate that under equal weight coefficients, the presented search algorithm can provide an optimized solution for the front fin to achieve the minimum value of the comprehensive evaluation indicator. When the range of the current wing movement changes or the weight coefficient distribution changes, this search algorithm can still provide the optimal solution and some feasible solutions. Under the given conditions, there is a difference between the optimal solution of the aerodynamic force priority and that of the aerodynamic moment priority. For the case of the aerodynamic moment priority, the mean level of the pressure coefficient corresponding to the optimal solution on the given observation plane is low. The presented method is effective in learning the appropriate installation position of the rocket’s front fins.
1. Introduction
With the continuous development of space exploration, rockets are playing an increasingly important role in launching orbital stations, artificial satellites, and planetary probes. In order to improve the stability of rockets during straight flight, tail wings and front fins are usually installed around the vehicle body [1,2,3]. In recent years, topics related to flow field calculations, aerodynamic analysis, and aerodynamic heating of rocket fins have received much attention.
Tail wings with movable fins, attitude tuning nozzles, and grid wings are devices that help change the flight direction of the rocket. Meteorological rockets are an important means of in situ detection in near space, which can be used to detect the temperature, pressure, density, wind speed, direction, and other parameters of the middle atmosphere [4]. With the accelerated development of human society, more and more meteorological satellites, communication satellites, and remote sensing satellites are being launched, where some rockets adopt the design of grille rudders and small fins, as in Figure 1. Based on three turbulence models, standard k-ε, realizable k-ε, and shear stress transport (SST) k-ω, numerical research on backward step turbulence has been carried out [5]. The computational fluid dynamics (CFD) method based on the SST k-ω turbulence model is established, and the forebody contour of the hypersonic axisymmetric vehicle is optimized [6]. The new baseline model is designed to provide relevant results and compare them with the original k-ω model results [7]. In order to meet the rapidly changing market demand and reduce the impact on the environment, a multidisciplinary framework approach is presented to design the next generation of launch vehicles [8]. The current status and development direction of SST k-ω turbulence models have been discussed [9]. The SST k-ω turbulence model is used to assist in simulating the tunnel flow field [10]. High-quality fine structured grids are adopted to handle the flow field space, and the CFD method based on the SST k-ω turbulence model is established [11]. The temperature field of the exhaust system is simulated using the CFD method based on the standard k-ε model [12]. Based on the Reynolds-averaged Navier–Stokes (RANS) equation, a CFD method based on the SST k-ω turbulence model has been established [13]. During rocket flight at high Mach numbers, the complex turbulence caused by the front fin remains a challenge, and the forces and moments caused in the lateral direction can bring adverse factors to rocket flight.
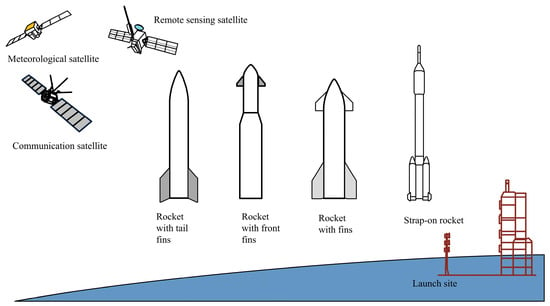
Figure 1.
Schematic of different rocket shapes in terms of different launch missions.
Two turbulence models are adopted, where the standard k-ε model requires less computational power, while the SST k-ω turbulence model facilitates the study of physical phenomena [14]. High-precision unstructured grids are used to process surface features [15]. The thermal performance characteristics of sinusoidal channels have been studied, and the dynamic structure of the fluid has been examined [16]. Based on the SST model and the renormalization group (RNG) model, the two-dimensional axisymmetric model of the ejector has been designed [17]. In order to represent the fluid volume on a tetrahedral mesh, an implicit surface defined by a symbolic distance function is adopted [18]. The research on paraffin-based hybrid propulsion systems has become more mature, and a Mars ascent vehicle propelled by European hybrid vehicles has been designed [19]. For narrow geometric edge features, grid density increase technology is adopted [20]. The safety zone around the rocket flight path is discussed, and the velocity of debris falling, flight path angle, and angle of attack are simulated [21]. The wall temperature of the steam superheater tube is investigated using the established CFD method [22]. Parameter knowledge is introduced into the process of local and global search, and a pigeon swarm algorithm is established [23]. A simulated annealing algorithm is improved to address the proposed challenges [24]. Based on the simulation results of the CFD method, the optimization algorithm based on the Taguchi methods is established to obtain the global optimal solution [25]. The search strategy of a particle swarm optimization (PSO) algorithm is introduced, and the characteristics of a simulated annealing and genetic algorithm are analyzed [26]. Considering factors such as the drag, ram recovery, and basic flight performance [27], the aerodynamic characteristics of the S-shaped tube inlet were evaluated by using the established CFD method. The tail wings are installed at the rear of the rocket body or aircraft, providing stability for the machine during flight [28,29,30]. The numerical simulation of methane oxygen-rich flames with non-premixed fuels is conducted, and the turbulent mixing combustion of gas propellants in rocket engines is discussed [31]. A machine learning algorithm based on hyperspectral data has been presented to analyze the differences in targets [32]. An observation algorithm was established to simulate the real-time scene and characterize the ionospheric response to the example rocket [33]. The aerodynamic differences between rockets with straight and curved wings have been discussed [34]. The large eddy simulation method is established, and the three-dimensional unsteady supersonic plume flow field of the rocket engine is analyzed [35]. A genetic algorithm combined with the CFD method is used to optimize the airfoil of the example blade [36,37]. The CFD method based on a sliding grid is used to simulate the unsteady behavior of the rotor [38]. The front fin at different positions on the rocket front body will cause different aerodynamic forces and moments in the lateral direction.
Under the combined action of inertial force and air resistance, small disturbances will be rapidly amplified, causing a change in the rocket attitude, while the front fin will provide a force in the opposite direction, to improve the stability of the rocket. This paper focuses on the two aerodynamic forces and two aerodynamic moments of the rocket forebody in the lateral direction and attempts to construct a comprehensive evaluation indicator. Afterwards, this paper tries to establish a four-particle search algorithm based on a variable step size to learn the comprehensive performance of precursors under different conditions. This research is of engineering value for the aerodynamic analysis and optimized design of the front fins of a rocket forebody.
The structure of this paper is arranged as follows: the search algorithm and CFD method are presented in Section 2; the model and flow field construction of the rocket forebody are described in Section 3; the relevant aerodynamic analysis and optimization results are discussed in Section 4; and finally, a conclusion of the entire text is provided.
2. Research Method
The research methods here mainly include three parts: comprehensive evaluation indicators, variable step search, and flow field calculation. The schematic of the lateral aerodynamic analysis of the forebody with front fins is shown in Figure 2, where Ma represents the Mach number of flight. Fy is the aerodynamic force in the positive direction along the y-axis. My is the aerodynamic torque in the positive direction around the y-axis. Fz means the aerodynamic force in the positive direction along the z-axis. Mz is the aerodynamic torque in the positive direction around the z-axis. The front fin is set to be installed in different positions that move along the x-axis direction.
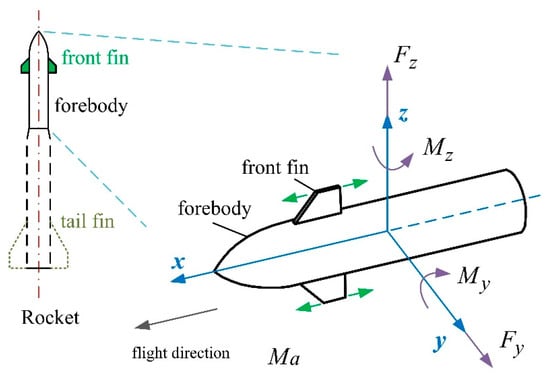
Figure 2.
Schematic diagram of lateral aerodynamic analysis of rocket forebody.
The flowchart for optimizing the position of the front fin of an example rocket is shown in Figure 3, where P1~P4 represent these four search particles. Xf represents the distance the front fin moves along the x-axis. Before setting the particle position, the mesh and flow field calculations of the initial model need to be fully debugged to ensure that the preliminary calculation results meet the requirements. Subsequently, based on the variable step operator, the positions and search speeds of particles 1 and 2 can be determined. On this basis, the current optimal solution could be obtained. Then, the positions and search speeds of particles 3 and 4 can be calculated. After a comprehensive evaluation of the aerodynamics/moment, the optimal solution for the front fin position can be determined. After completing all loops, the optimization results can be output.
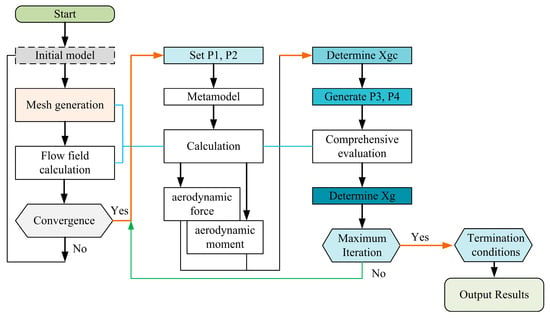
Figure 3.
Method flowchart of position optimization for the front fin.
2.1. Comprehensive Evaluation Indicator
The front fin at different installation positions will have an impact on the aerodynamic characteristics of the front body [1,6], as shown in Figure 4, where R0 is the radius of the circular section at the bottom of the forebody. X0 and Z0 are used to mark the initial position of the front fin. Xfr is the distance from the origin of the coordinate axes to the far-right point of forebody, where the value of Xfr is 1.8 m.
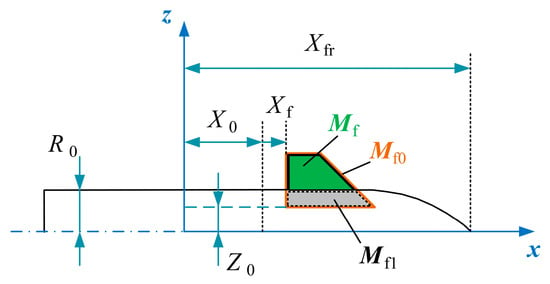
Figure 4.
The installation position of the front fin.
Considering the curved contour of the front body head [6], the model of the front fin can be generated as follows when establishing the model:
where Mf represents the model of the front fin, Mf0 represents the original model of the front fin used for cropping, and Mf1 is the cropped model.
Under a given front fin model, the comprehensive evaluation indicator for the lateral aerodynamic characteristics of the front body can be written in the following form:
where Ice is the comprehensive evaluation indicator. Cw1~Cw4 represent the weight coefficients, and the additional numerical subscripts are used to distinguish different coefficients. Specifically, if Cw does not have a numerical index attached, it means that these four weight coefficients are equal. Fs1 and Fs2 represent the dimensionless indicators of the aerodynamic forces. Ms1 and Ms2 represent the dimensionless indicators of the aerodynamic moments. Considering the lateral aerodynamic characteristics,
where Fr1 and Fr2 represent two reference values for the aerodynamic forces. Mr1 and Mr2 represent two reference values for the aerodynamic moments. Considering the different units of force and moment, various aerodynamic indicators need to be dimensionless. For the weight coefficients:
When it is necessary to improve the aerodynamic resistance or other performance of the front fin [6,25], the aerodynamic indicators and weight coefficients can be appropriately adjusted.
2.2. Variable Step Search
The four-particle search algorithm (FSA) is established to determine the installation position of the front fin under a given requirement, where the variable step size is used to distinguish different search speeds:
where Sv is the variable step, and the additional numerical subscripts are used to distinguish different particles. Cs represents a coefficient of the step size. Xm and Xn represent the upper and lower boundaries of the position range, respectively. Ng is the number of iterations. Rs is a random number, and Or is an operator used to generate true random numbers. For the particles 1 and 2:
where Vp is the search speed of the particle. Vn represents the minimum search speed. Vm represents the maximum search speed [26]. Rp1 is a random number. Cp2 is a coefficient. Then, the positions of particles 1 and 2 can be updated as follows:
where Xp represents the position of the particle. Ncg represents the number of current generations. Noting that the speed and position of each particle should not exceed the allowed boundary value, when the boundary value is exceeded, it should be handled according to the boundary value.
The optimization objective could be written in the following form:
where Fn represents the minimum fitness. Mrf represents the model of the rocket forebody. The relevant equality constraints can be represented as
where Cft represents the chord length at the top of the front fin. Cfb represents the chord length at the bottom of Mf0. Hf0 represents the height of Mf0, where the example size value of the front fin is given in Section 4.1. The sequence numbers i and j are used to distinguish any two individuals during the search process. The inequality constraint can be written as
where CD represents the drag coefficient, and CD0 is the limiting value of the drag coefficient. Equation constraints specify that the specific size of the target remains constant throughout the calculation process, while the inequality constraint stipulates that the performance indicators must not exceed the limit value during the optimization process.
Based on the comprehensive evaluation indicators of particle 1 and particle 2, the current optimal solution can be obtained as
where Xgc means the current optimal solution. X* is used to mark the position when obtaining the minimum fitness. For the particles 3 and 4,
where Rv3 represents a random number. Cv3 and Cp4 represent coefficients. Then, the position of particle 3 can be calculated as follows:
where Rx3 and Rx4 are both random numbers, noting that the random numbers in the search algorithm are generated according to the true random operator (Or).
Then, the optimal solution could be updated in the following form:
where Xg is the optimal solution. It can be observed that particles 1 and 2 are always responsible for global search, while particles 3 and 4 are responsible for optimal search. The overall idea of the calculation method is as follows: generating the initial particle position and velocity using variable step size technology, then calculating the flow field characteristics corresponding to these positions using CFD, evaluating different particles through comprehensive indicators, updating the particle position and velocity, and then proceeding to the next stage of the calculation.
The presented search algorithm has been validated, as shown in Figure 5, where the comparative data come from the results of the PSO algorithm. For the FSA scheme, P1 to P4 represent four search particles, respectively, where the optimal solution for Xf is equal to 0.18 m, at which point the comprehensive evaluation indicator reaches the minimum value of 0.0378, noting that for the variable step size settings, Cs1 = 0.1, Cs2 = 1.8, Cs4 = 2.5, and Cs4 = 0.5. For the PSO results, the optimal Xf value is equal to 0.1781 m, where the comprehensive evaluation indicator is 0.0397, noting that pop0 represents the initial population and pop represents the updated population. The distribution of the entire Xf individual exhibits two regions of minimum values, while there are still some feasible solutions for Xf near the optimal solution. The characteristic of the presented four-particle search is that the first two particles are responsible for global search, while the last two particles are responsible for local and global optimal search. These results indicate that the presented method is feasible and accurate for determining the optimal position of the front fin.
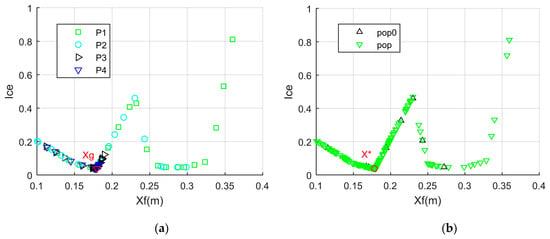
Figure 5.
Validation of the search algorithm, Cw = 0.25, Xn = 0.1 m, Xm = 0.36 m. (a) FSA results. (b) PSO results.
2.3. Flow Field Calculation
The CFD method based on RANS equations is established to analyze the flow field characteristics of the forebody. The turbulence solver adopts the SST k-ω turbulence model [3,14], where the relevant transport equations could be written as follows:
where ρ is the fluid density. k is the turbulent kinetic energy. ω is the dissipation rate. μt is the turbulent viscosity. t is the time. k is the turbulent kinetic energy. u means the component of the velocity vector in the x-axis direction. Gk means the generation term of the turbulent kinetic energy caused by the average velocity gradient. Yk and Yω refer to the dissipation of k and ω, respectively. Gω is the production of dissipation rate ω. Sk and Sω represent the source of k and ω, respectively. For the variables σk and σω:
where F1 is the blending function. For the eddy viscosity:
where α* is the damping coefficient. S is the strain rate magnitude, noting that a1 is the experimental constant and a1 = 0.31. μ is the dynamic viscosity. yw is the distance of the node to the wall. This turbulence model is widely used in adverse pressure gradient and separation fluid problems.
In addition, the pressure coefficient and resistance coefficient are calculated as follows:
where Cp is the pressure coefficient. Ps is the static pressure. u∞ is the freestream velocity. ρ∞ is the freestream density. D is the drag. Aref represents the reference area, which can be taken as the cross-sectional area of the rocket cylinder as a reference.
The presented CFD method has been validated, as shown in Figure 6, where the comparison data come from the flow field calculation results based on the Spalatrt–Allmaras (SA) turbulence model. It can be found that in the range of 1.113 m~1.698 m, the pressure coefficient shows a sharp increasing trend with the increase in the observation coordinates. The two curves are similar in shape, fluctuation range, and mean level, while there is a difference in the peak values of the two curves. The SA turbulence model is a typical one-equation model that exhibits good performance in wall bound flow, and the SST k-ω turbulence model has good credibility in large curvature flow and separated flow. These results indicate that the presented CFD method is feasible for simulating the flow field characteristics of the forebody.
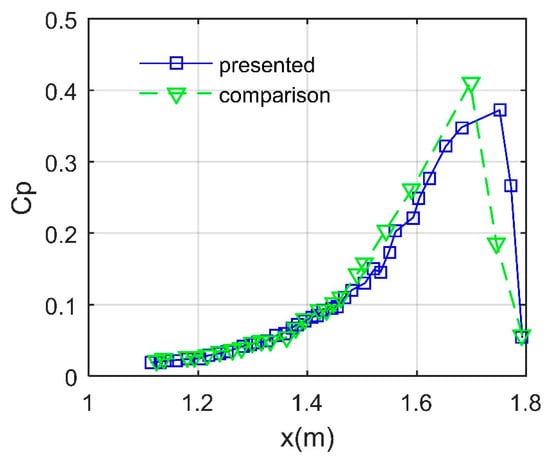
Figure 6.
Verification of the CFD method, forebody upper surface, y = 0 m, Ma = 5.56, Xf = 0.1 m.
3. Model Establishment and Grid
This section mainly includes the establishment process of the rocket forebody model and the demonstration of the flow field mesh generation. The model of the rocket precursor is established, as shown in Figure 7, where the top and bottom chord lengths of the original front fin model have been marked. The two front fins are symmetrically distributed about the xy plane, with the tip of the front body pointing in the positive direction of the x-axis. The relevant parameter settings of the FSA method are shown in Table A1 (Appendix A), where the search algorithm is used to determine the distance between the front fin and the yz plane under the given conditions. The main geometric dimensions of the forebody are shown in Table A2, where Lft represents the length of the forebody. The side of the original front fin model appears as a trapezoid, and as the installation position of the front fin moves, the subtracted part of the original front fin model also changes.
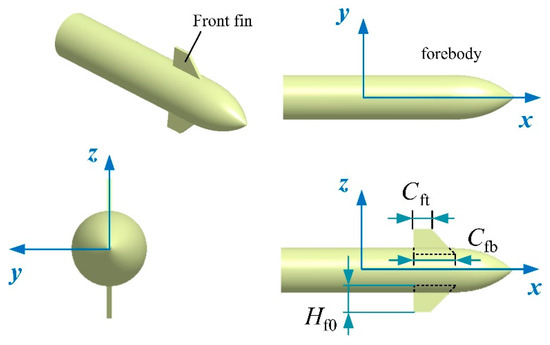
Figure 7.
Establishment of the rocket forebody model.
The flow field construction of the forebody with front fins is shown in Figure 8, where the sketch of the outer boundary of the flow field is designed as a cylinder. The radius of the circular cross-section of the flow field is 1.8 m, and the length of the flow field is 4 m. High-precision unstructured grids are adopted to handle the forebody surface and flow field space, where the technology of increasing the grid density has been adopted to improve the grid quality of small areas such as the edges of the front fins. Unstructured grids are grids without regular topological relationships, which have a high degree of automation and can effectively handle complex geometric shapes. Grid independence testing is performed under three grid conditions: 3.67 million (coarse), 6.21 million (medium), and 11.29 million (fine), as shown in Table 1. For the case of coarse mesh, the static pressure at observation point x = 1.1127 m is 2. 5163 × 103 Pa. With the continuous improvement in the grid quality, the indicators at the observation points tend to stabilize. After comparing the flow field calculation results under different grid numbers, the grid condition (fine) is determined. The inlet of the flow field is set as a pressure far field with a pressure of 3000 Pa and a temperature of 220 K. The Mach number of the incoming flow in the far field is set at 5.56. The wall of the precursor is set as a non-sliding boundary condition, and the fluid in the flow field space is regarded as ideal gas.
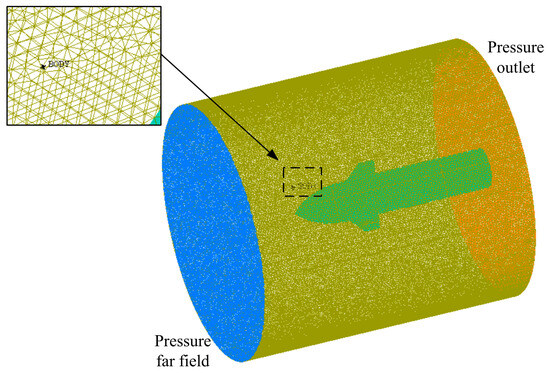
Figure 8.
Flow field construction of the forebody.

Table 1.
Independence analysis of flow field grid, section y = 0 m, Ma = 5.56, Xf = 0.1 m.
4. Results and Discussion
Based on the comprehensive evaluation indicators, the discussion of the results here mainly includes three parts: the case where the four weight coefficients of the comprehensive evaluation indicators are equal, the case where the weight coefficient of the aerodynamic force is greater than that of the aerodynamic torque, and the case where the weight coefficient of the aerodynamic torque is greater than that of the aerodynamic force.
4.1. Equal Weight Coefficients
Considering the case where all four weight coefficients are equal to 0.25 as shown in Figure 9, where for the restrictions on the movement of the front fins, Xn = 0.182 m and Xm = 0.36 m, due to changes in the range of movement, the optimal solution determined by the FSA also changed although the four weight coefficients remained at 0.25. Under the current conditions, the optimal solution for the front fin is Xf = 0.275 m, and the comprehensive evaluation indicator is equal to 0.0472, noting that Cft (1) = 0.21 m, Cfb (1) = 0.5 m, and Hf0 (1) = 0.3 m. In the current range, the comprehensive evaluation indicator shows a trend of first increasing, then decreasing, and then stabilizing before increasing as the value of Xf increases. These results indicate that the variable step and FSA method can provide the optimal position for the front fin to meet the given requirements under different movement ranges.
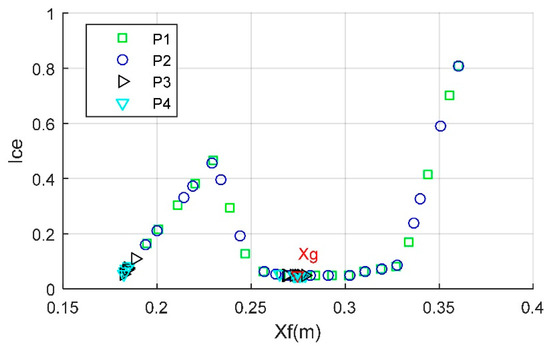
Figure 9.
Comprehensive evaluation indicator, Cw = 0.25, Xf ∊ [0.182, 0.36] m.
When Xf = 0.36 m, the pressure coefficient of the leading edge of the upper front fin is shown in Figure 10, where both observation planes are parallel to the xz plane. For the case of y = 0 m, the pressure coefficient generally shows a trend of first increasing and then decreasing with the increase in the x value, where the maximum pressure coefficient is 3.724 appearing at x = 1.179 m, and the minimum pressure coefficient is only 0.2536 at x = 1.312 m. Under the current flight conditions, there is a significant high-pressure zone on the leading edge of the front fin. For the case of y = 0.01 m, the maximum pressure coefficient is 3.787 appearing at x = 1.193 m, and the minimum pressure coefficient is 0.072. The peak value and mean level of the pressure coefficient on the two observation sections are similar, while there are some differences in the local characteristics.
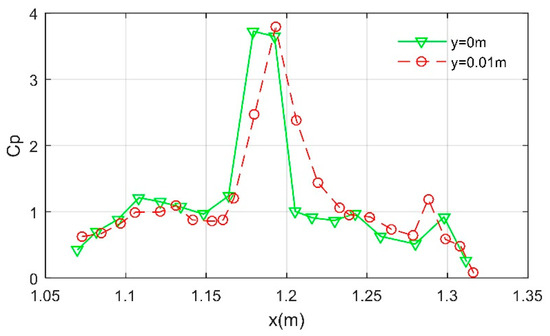
Figure 10.
Pressure coefficient of the leading surface of the upper front fin, Xf = 0.36 m.
Figure 11 presents the velocity vector distribution on the given observation plane, noting that there is a clear low-speed zone near the trailing edge of the front fin. Because of the combined effects of the forward flow, upward impact of the leading surface airflow, and the slope of the leading edge of the front fin, a green plume area is dragged out from the top of the front fin. In the area near the head wall of the forebody, there are some light green and green vectors distributed. It should be noted that near the middle of the leading edge of the front fin, red, yellow, and green velocity vectors appear, while this is also the area where the pressure coefficient has a large value. For the area near the trailing edge of the front fin, the vectors here are mainly presented in blue, cyan, and green. These results indicate that the established CFD method can effectively capture the flow field characteristics of the rocket forebody with front fins.
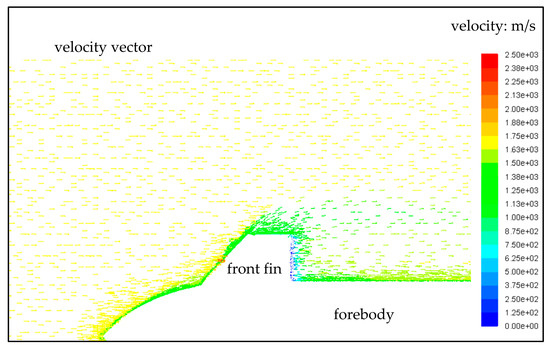
Figure 11.
Visualization results of velocity vector analysis on the y = 0 m observation plane, unit: m/s, Xf = 0.36 m.
4.2. Aerodynamic Force Priority
When the weight coefficient of the aerodynamic torque is set to a very small value, the performance of the comprehensive evaluation indicator is shown in Figure 12, where Cw2 = 0.97, Cw3 = Cw4 = 0.005. It can be seen that most levels of the comprehensive indicator are low within the given range, indicating the existence of many feasible solutions that reflect the priority aerodynamic forces (Fs2, z-direction) of the forebody. After FSA processing, it is known that the optimal solution under the current conditions is Xg = 0.1503 m, and the comprehensive evaluation indicator at this time is equal to 0.0102. When Xf = 0.3287 m, the comprehensive evaluation indicator is as low as 0.1986. As the Xf value increases, the front fin moves towards the front body head, and more stabilizer surfaces leak out from the root of the front fin. Examining some cases in the middle of the moving range, it can be seen that the comprehensive indicator is equal to 0.0877 when Xf = 0.2286 m. These results suggest that the appropriate installation position of the front fin can effectively reduce this priority aerodynamic performance.
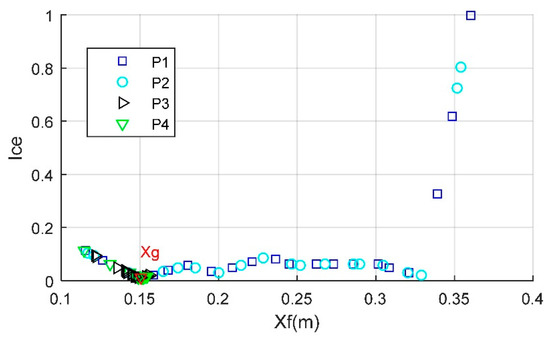
Figure 12.
Comprehensive evaluation indicator, Cw1 = 0.02, Cw2 = 0.97, Cw3 = 0.005, Xn = 0.1 m, Xm = 0.36 m.
Considering the pressure coefficient of the forebody upper surface when the optimal solution is Xg = 0.1503 m, as shown in Figure 13, where a new observation plane (y = 0.1 m) is established, it could be found that the pressure coefficient of the two curves is similar within the range of 1.106 m~1.398 m of the observation coordinates, because the wall curvature corresponding to the two curves within this range is almost the same. As the observation coordinates continue to increase to 1.618 m, the pressure coefficient of the red triangle is significantly higher than that of the other curve. When x = 1.532 m, the pressure coefficient of the blue dashed line is equal to 0.1359, while that of the red solid line exceeds 0.171. For the observation plane y = 0.1 m, the contour curvature and height of the head surface on the front body have changed compared with the observation plane y = 0 m, which changes the local fluctuation of the pressure coefficient. These results indicate that the established CFD method can effectively investigate the forebody flow field characteristics corresponding to the optimized solution.
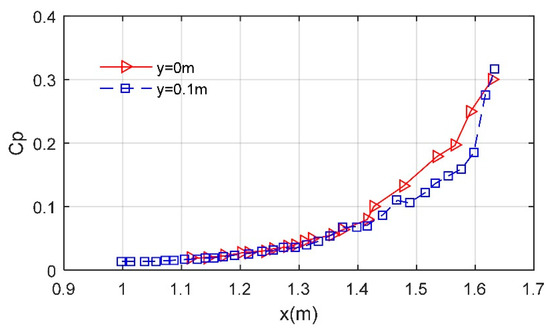
Figure 13.
Pressure coefficient of the forebody upper surface, Xg = 0.1503 m.
Figure 14 shows the particle path on the observation plane z = −0.35 m and wall surface where the front fin position is set to the optimal solution Xg = 0.1503 m. It can be observed that the path lines on both sides of the front fin appear as backward and tilted backward. The line sweeping over the top of the front fin extends outward in an arc-shaped shape in the vertical direction. On the observation section, the particle path lines in the area intersected with the front fin exhibit a trend of inclined backward motion. The path lines near the tail of the forebody mostly exhibit a backward extension state. These results indicate that the presented CFD method is feasible for analyzing particle paths in flow fields.
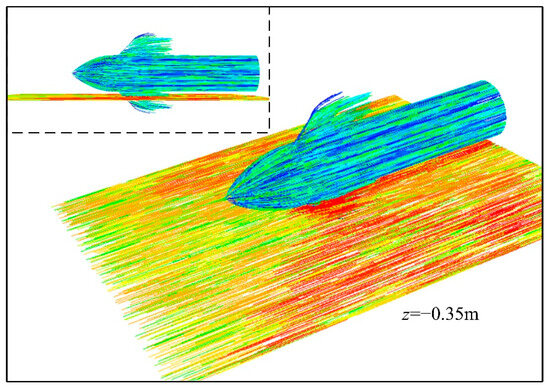
Figure 14.
Visualization results of particle path analysis on plane z = −0.35 m and forebody surface, Xg = 0.1503 m.
4.3. Aerodynamic Moment Priority
The weight coefficients of two aerodynamic forces are set to a minimum value of Cw1 = Cw2 = 0.005, as shown in Figure 15, where the weight coefficient of an aerodynamic torque dominates the influence. It can be observed that the data point distribution of the comprehensive evaluation indicator shows a pattern of high in the middle and low on both sides. Under the current conditions, the optimal solution determined by the FSA is Xg = 0.1798 m, where the comprehensive indicator is equal to 0.0195. Due to the fact that the stabilizer of the front fin is parallel to the xz plane, the front fin can provide a certain recovery torque for the front body in the z-direction when encountering disturbances. Therefore, the target performance can also be set according to the maximum value of the comprehensive indicator during the optimization process under specific needs. These results indicate that the variable step combined with the FSA can provide the optimal solution for the comprehensive evaluation indicator of the aerodynamic torque priority.
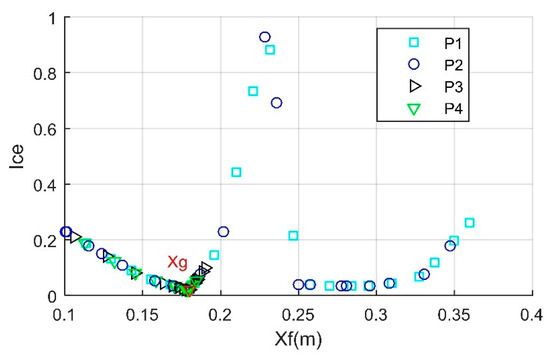
Figure 15.
Comprehensive evaluation indicator, Cw1 = 0.005, Cw3 = 0.02, Cw4 = 0.97, Xn = 0.1 m, Xm = 0.36 m.
When Xf = 0.1 m, the comprehensive evaluation indicator is equal to 0.2307 under Cw1 = 0.005, Cw3 = 0.02, and Cw4 = 0.97, where the Mach number distribution on observation plane y = 0 m is shown in Figure 16. It could be clearly observed that a large area of green Mach number distribution appears in the flow field area outside and behind the front fin tip. Behind this green plume, a long, dim orange area appears and extends to the rear exit. In the flow field area behind the trailing edge of the front fin, the color of the Mach number cloud image gradually changes from blue to green, and then to yellow and orange. A small number of red areas appear in the middle area of the leading edge of the lower fin, where the yellow and orange airflow rushing out from the head of the precursor merges with the airflow flowing towards the leading edge and quickly escapes towards the outside. These results indicate that the established CFD method is feasible for analyzing the Mach number distribution of the flow field.
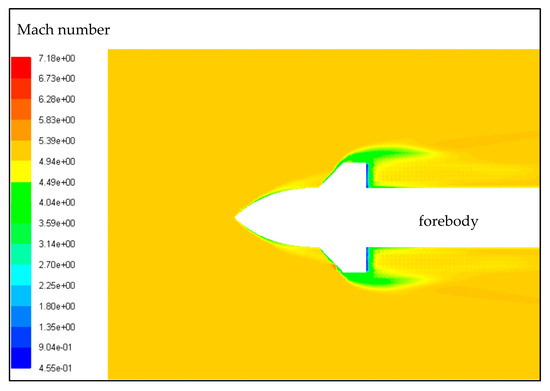
Figure 16.
Visualization results of Mach number distribution on observation plane y = 0 m, Xf = 0.1 m.
Considering the distribution of Mach numbers on different observation planes, as shown in Figure 17, two observation planes (z = 0 m and z = 0.35 m) parallel to the xy plane have been established. For the case of z = 0.35 m, a small amount of green and yellow features appears in the flow field area in front of the front fin section. Near the middle of the trailing edge of the front fin, a small amount of blue and light blue features appears in this flow field area, and because of the obstruction of the front fin wall, the airflow velocity here is extremely low. Observing along the trailing edge of the front fin towards the rear of the flow field, a narrow area could be observed, with colors transitioning from green to yellow and light orange. On both sides of this narrow yellow band, a large area of dim orange extends backward. When z = 0 m, the Mach number distribution around the forebody on the observation plane can be captured. In the area near the wall of the forebody head, a thin layer of green and light green characteristic appears. On both sides of the forebody, several layers of yellow, light yellow, light orange, orange, and deep orange features appear and scatter towards the rear.
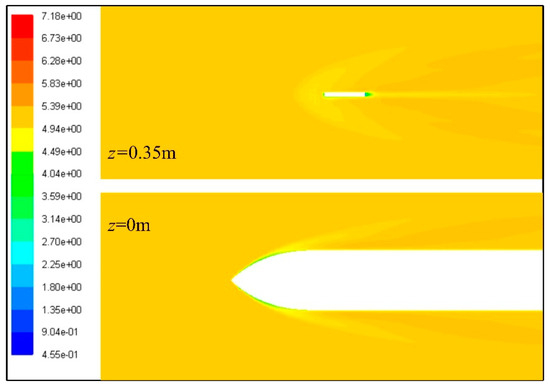
Figure 17.
Visualization results of Mach number distribution on observation planes z = 0 m and z = 0.35 m, Xf = 0.1 m.
When Xf = 0.36 m, the comprehensive evaluation indicator is equal to 0.2597 under the conditions of Cw1 = 0.005, Cw3 = 0.02, and Cw4 = 0.97, where the comparison of the pressure coefficient at different front fin positions is provided in Figure 18, noting that Cob is the chord length of the front fin on the observation section and Xct represents the distance from the observation point on the front fin surface to the trailing edge point of the observation chord. It can be found that the pressure coefficient at the observation point is increased when it is close to the leading edge. When the forebody flies at a high Mach number, the gas in the front is suddenly compressed by the wall (front fin leading edge and front body head), forming a concentrated strong disturbance. When Xct < 0.648, the two curves of Xf = 0.1 m and Xg = 0.1798 m are similar, while the curve of Xf = 0.36 m has a significantly greater pressure coefficient. At Xct = 0.7872, the pressure coefficient of the red curve is as low as 0.0235, that of the cyan triangle curve is 0.03, while that of the blue curve exceeds 0.0625. For the case of Xf = 0.36 m, the pressure coefficient reaches 0.115 when Xct = 0.9527. Under the current observation conditions, the chord position of the sharp rising section of the pressure coefficient curve moves backward as the forward-moving distance of the front fin increases.
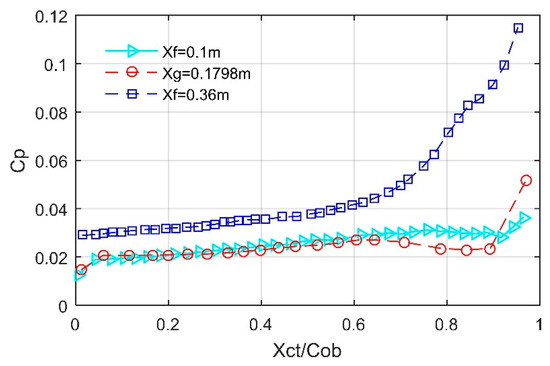
Figure 18.
Comparison of pressure coefficient at different Xf, observation plane z = 0.35 m and y > 0 m.
5. Conclusions
Based on the established simulation method, the flow field characteristics of the rocket forebody are analyzed. The installation position of the front fin under different conditions is investigated through the variable step search algorithm. According to these analyses and discussions, the following conclusions can be drawn in this paper:
- (1)
- Under the condition of equal weight coefficients, the presented search algorithm can provide the optimal solution for the front fin position to achieve the minimum value of the comprehensive evaluation indicator. The difference between the optimized solution for the front fin position and the initial value can reach half of the installation interval;
- (2)
- When prioritizing the influence of a lateral aerodynamic force, the distribution of data points in the comprehensive evaluation indicator changes, and the optimal solution for the front fin position also changes accordingly. After optimization, the position of the front fin is close to the front end of the forebody, and the aerodynamic force indicator along the wingspan is significantly weakened;
- (3)
- For the situation where the aerodynamic moment is prioritized, the data point distribution of the comprehensive evaluation indicator shows a state of high in the middle and low on both sides, where the pressure coefficient corresponding to the optimal solution on the sample observation section is kept at a low level.
In future research work, the proposed comprehensive evaluation indicators can be appropriately modified as needed. Based on the established framework and research methods, technical support can be provided for reducing the aerodynamic drag and designing the shape of the rocket front fin.
Author Contributions
Conceptualization and methodology, Z.Z. and J.H.; software, formal analysis, and validation, Z.Z.; investigation and visualization, Z.Z. and J.H.; writing—original draft preparation, Z.Z.; writing—review and editing, Z.Z.; funding acquisition, Z.Z. All authors have read and agreed to the published version of the manuscript.
Funding
This research was supported by the project funded by China Postdoctoral Science Foundation (Grant Nos. BX20200035, 2020M680005).
Data Availability Statement
The original contributions presented in the study are included in the article, further inquiries can be directed to the corresponding author.
Conflicts of Interest
The authors declare no conflicts of interest.
Appendix A

Table A1.
Parameter settings for the search algorithm.
Table A1.
Parameter settings for the search algorithm.
| Parameter | Cs1 | Cp2 | Cx2 | Cv3 | Cp4 |
|---|---|---|---|---|---|
| Value | 0.1 | 0.3 | 0.5 | 0.2 | 0.1 |

Table A2.
Geometric dimensions of rocket forebody.
Table A2.
Geometric dimensions of rocket forebody.
| Parameter | Z0 (m) | R0 (m) | Hf0 (m) | Lft (m) | X0 (m) |
|---|---|---|---|---|---|
| Value | 0.2 | 0.27 | 0.3 | 2.8 | 0.5 |
References
- Yin, J.; Lei, J.; Jiang, S.; Yin, X. The aerodynamic characteristics and its estimation method of finned missile experiencing spin-deformation coupling motion. Aerosp. Sci. Technol. 2021, 115, 106806. [Google Scholar] [CrossRef]
- Alsaidi, S.B.; Huh, J.; Selim, M.Y.E. Combustion of Date Stone and Jojoba Solid Waste in a Hybrid Rocket-like Combustion Chamber. Aerospace 2024, 11, 181. [Google Scholar] [CrossRef]
- Huang, H.; Sun, T.; Zhang, G.; Sun, L.; Zong, Z. Modeling and computation of turbulent slot jet impingement heat transfer using RANS method with special emphasis on the developed SST turbulence model. Int. J. Heat Mass Transf. 2018, 126, 589–602. [Google Scholar] [CrossRef]
- Song, Y.; He, Y.; Leng, H. Analysis of Atmospheric Elements in Near Space Based on Meteorological-Rocket Soundings over the East China Sea. Remote Sens. 2024, 16, 402. [Google Scholar] [CrossRef]
- Jehad, D.G.; Hashim, G.A.; Zarzoor, A.K.; Azwadi, C.N. Numerical study of turbulent flow over backward-facing step with different turbulence models. J. Adv. Res. Des. 2015, 4, 20–27. [Google Scholar]
- Chen, J.; Fan, X.; Xiong, B.; Wang, Y. Design methodology of the hypersonic axisymmetric forebody. Acta Astronaut. 2020, 175, 179–184. [Google Scholar] [CrossRef]
- Menter, F. Zonal two equation kw turbulence models for aerodynamic flows. In Proceedings of the 23rd Fluid Dynamics, Plasmadynamics, and Lasers Conference, AIAA 93-2906, Orlando, FL, USA, 6–9 July 1993. [Google Scholar]
- Musso, G.; Figueiras, I.; Goubel, H.; Gonçalves, A.; Costa, A.L.; Ferreira, B.; Azeitona, L.; Barata, S.; Souza, A.; Afonso, F.; et al. A Multidisciplinary Optimization Framework for Ecodesign of Reusable Microsatellite Launchers. Aerospace 2024, 11, 126. [Google Scholar] [CrossRef]
- Menter, F.R.; Kuntz, M.; Langtry, R. Ten years of industrial experience with the SST turbulence model. Turbul. Heat Mass Transf. 2003, 4, 625–632. [Google Scholar]
- He, K.; Gao, G.-J.; Wang, J.-B.; Fu, M.; Miao, X.-J.; Zhang, J. Performance of a turbine driven by train-induced wind in a tunnel. Tunn. Undergr. Space Technol. 2018, 82, 416–427. [Google Scholar] [CrossRef]
- Zhou, L.; Bai, L.; Li, W.; Shi, W.; Wang, C. PIV validation of different turbulence models used for numerical simulation of a centrifugal pump diffuser. Eng. Comput. 2018, 35, 2–17. [Google Scholar] [CrossRef]
- Zhou, Z.; Huang, J. Mixed design of radar/infrared stealth for advanced fighter intake and exhaust system. Aerosp. Sci. Technol. 2021, 110, 106490. [Google Scholar] [CrossRef]
- Paul, A.R.; Jain, A.; Alam, F. Drag reduction of a passenger car using flow control techniques. Int. J. Automot. Technol. 2019, 20, 397–410. [Google Scholar] [CrossRef]
- Adanta, D.; Fattah, I.M.R.; Muhammad, N.M. Comparison of standard k-epsilon and sst k-omega turbulence model for breastshot waterwheel simulation. J. Mech. Sci. Eng. 2020, 7, 039–044. [Google Scholar] [CrossRef]
- Zhou, Z.; Huang, J. Y-type quadrotor radar cross-section analysis. Aircr. Eng. Aerosp. Technol. 2023, 95, 535–545. [Google Scholar] [CrossRef]
- Kurtulmuş, N.; Zontul, H.; Sahin, B. Heat transfer and flow characteristics in a sinusoidally curved converging-diverging channel. Int. J. Therm. Sci. 2020, 148, 106163. [Google Scholar] [CrossRef]
- Wang, X.; Xu, S.; Xing, C. Numerical and experimental investigation on an ejector designed for an 80 kW polymer electrolyte membrane fuel cell stack. J. Power Sources 2019, 415, 25–32. [Google Scholar] [CrossRef]
- Zeriadtke, J.E.; Martin, J.; Wartemann, V. Hybrid Rocket Engine Burnback Simulations Using Implicit Geometry Descriptions. Aerospace 2024, 11, 103. [Google Scholar] [CrossRef]
- Renault, M.; Lappas, V. Design of a Mars Ascent Vehicle Using HyImpulse’s Hybrid Propulsion. Aerospace 2023, 10, 1030. [Google Scholar] [CrossRef]
- Zhou, Z.; Huang, J. Numerical investigations on radar cross-section of helicopter rotor with varying blade pitch. Aerosp. Sci. Technol. 2022, 123, 107452. [Google Scholar] [CrossRef]
- Campos, L.M.B.C.; Silva, M.J.S. On the Size of the Safety Area around the Launch Trajectory of a Rocket. Aerospace 2023, 10, 760. [Google Scholar] [CrossRef]
- Granda, M.; Trojan, M.; Taler, D. CFD analysis of steam superheater operation in steady and transient state. Energy 2020, 199, 117423. [Google Scholar] [CrossRef]
- Shan, X.; Wang, Y.; Ji, Z. Energy efficiency optimization for discrete workshop based on parametric knowledge pigeon swarm algorithm. J. Syst. Simul. 2017, 29, 2140. [Google Scholar]
- Fathollahi-Fard, A.M.; Govindan, K.; Hajiaghaei-Keshteli, M.; Ahmadi, A. A green home health care supply chain: New modified simulated annealing algorithms. J. Clean. Prod. 2019, 240, 118200. [Google Scholar] [CrossRef]
- Hassanpour, M.; Azadani, L.N. Aerodynamic optimization of the configuration of a pair of vertical axis wind turbines. Energy Convers. Manag. 2021, 238, 114069. [Google Scholar] [CrossRef]
- Jahandideh-Tehrani, M.; Bozorg-Haddad, O.; Loáiciga, H.A. Application of particle swarm optimization to water management: An introduction and overview. Environ. Monit. Assess. 2020, 192, 281. [Google Scholar] [CrossRef] [PubMed]
- Saheby, E.B.; Hays, A.P.; Xing, S. Aerodynamic design and evaluation of an open-nose supersonic drone. Proc. Inst. Mech. Eng. Part G J. Aerosp. Eng. 2022, 236, 3387–3410. [Google Scholar] [CrossRef]
- Nicolosi, F.; Ciliberti, D.; Della Vecchia, P.; Corcione, S.; Cusati, V. A comprehensive review of vertical tail design. Aircr. Eng. Aerosp. Technol. 2017, 89, 547–557. [Google Scholar] [CrossRef]
- Moëns, F. A Fast Aerodynamic Model for Aircraft Multidisciplinary Design and Optimization Process. Aerospace 2023, 10, 7. [Google Scholar] [CrossRef]
- Lee, B. Vertical tail buffeting of fighter aircraft. Prog. Aerosp. Sci. 2000, 36, 193–279. [Google Scholar] [CrossRef]
- Martinez-Sanchis, D.; Sternin, A.; Haidn, O.; Tajmar, M. Combustion Regimes in Turbulent Non-Premixed Flames for Space Propulsion. Aerospace 2023, 10, 671. [Google Scholar] [CrossRef]
- Pane, C.; Manganiello, G.; Nicastro, N.; Carotenuto, F. Early Detection of Wild Rocket Tracheofusariosis Using Hyperspectral Image-Based Machine Learning. Remote Sens. 2022, 14, 84. [Google Scholar] [CrossRef]
- Savastano, G.; Komjathy, A.; Shume, E.; Vergados, P.; Ravanelli, M.; Verkhoglyadova, O.; Meng, X.; Crespi, M. Advantages of Geostationary Satellites for Ionospheric Anomaly Studies: Ionospheric Plasma Depletion Following a Rocket Launch. Remote Sens. 2019, 11, 1734. [Google Scholar] [CrossRef]
- Barokah, A.D.N.; Ubaidillah; Lenggana, B.W.; Wibawa, L.A.N.; Turnip, A.; Joelianto, E.; Le Hoa, N. A Comparative Analysis of Aerodynamic Performance: Straight Fin and Curved Fin Rockets using Computational Fluid Dynamics (CFD). J. Adv. Res. Fluid Mech. Therm. Sci. 2024, 115, 1–18. [Google Scholar] [CrossRef]
- Sun, A.; Niu, Q.; Dong, S. Spectral feature extraction of rocket exhaust plume using spectral proper orthogonal decomposition. Phys. Fluids 2024, 36, 035172. [Google Scholar] [CrossRef]
- Akram, M.T.; Kim, M.H. CFD analysis and shape optimization of airfoils using class shape transformation and genetic algorithm—Part I. Appl. Sci. 2021, 11, 3791. [Google Scholar] [CrossRef]
- Akram, M.T.; Kim, M.H. Aerodynamic shape optimization of NREL S809 airfoil for wind turbine blades using reynolds-averaged navier stokes model—Part II. Appl. Sci. 2021, 11, 2211. [Google Scholar] [CrossRef]
- Ali, Q.S.; Kim, M.-H. Unsteady aerodynamic performance analysis of an airborne wind turbine under load varying conditions at high altitude. Energy Convers. Manag. 2020, 210, 112696. [Google Scholar] [CrossRef]
Disclaimer/Publisher’s Note: The statements, opinions and data contained in all publications are solely those of the individual author(s) and contributor(s) and not of MDPI and/or the editor(s). MDPI and/or the editor(s) disclaim responsibility for any injury to people or property resulting from any ideas, methods, instructions or products referred to in the content. |
© 2024 by the authors. Licensee MDPI, Basel, Switzerland. This article is an open access article distributed under the terms and conditions of the Creative Commons Attribution (CC BY) license (https://creativecommons.org/licenses/by/4.0/).