Abstract
Aircraft secondary flow systems are small-flow circulation devices that are used for thermal and cold management, flow control, and energy generation on aircraft. The aerodynamic characteristics of main-flow-based inlets have been widely studied, but the secondary-flow-based small inlets, jets, and blowing and suction devices have seldom been studied. Two types of secondary flow systems embedded in a supersonic aircraft wing, a ram-air intake and a submerged intake, are researched here. Firstly, wind tunnel tests under subsonic, transonic, and supersonic conditions are carried out to test the total pressure recovery and total pressure distortion. Secondly, numerical simulations are used to analyze the flow characteristics in the secondary flow systems. The numerical results are validated with experimental data. The calculating errors of the total pressure recovery on the ram-air and submerged secondary flow systems are 8% and 10%, respectively. The simulation results demonstrate that the total pressure distortion tends to grow while the total pressure recovery drops with the increasing Mach number. As the Mach number increases from 0.4 to 2, the total pressure recovery of the ram-air secondary flow system decreases by 68% and 71% for the submerged system. Moreover, the total pressure distortion of the ram-air and submerged secondary flow systems is increased by 19.7 times and 8.3 times, respectively. Thirdly, a detailed flow mechanism is studied based on the simulation method. It is found that the flow separation at the front part of the tube is induced by adverse pressure gradients, which primarily determine the total pressure recovery at the outlet. The three-dimensional vortex in the tube is mainly caused by the change in cross-sectional shape, which influences the total pressure distortion.
1. Introduction
For aircraft, air inlet systems play a critical role in capturing, compressing, and steering airflow [1]. Air inlet systems are divided into main-flow-based type and secondary-flow-based type depending on the mode of capturing flow. The main-flow-based inlet serves as a crucial link between the propulsion system and the aircraft, which can significantly influence the engine’s efficiency and flight performance [2,3,4,5,6]. For instance, a 1% total pressure loss at the inlet of a turbofan engine can result in a 1.2 to 1.5% reduction in thrust [7].
Considering electromagnetic stealth capabilities, the tube of intake is always designed as an S-shape profile since the air inlet system is a prominent source of radar scattering [8]. Lots of wind tunnel tests were conducted on the design of S-shaped inlets [9,10,11,12,13,14]. However, it is difficult and expensive to obtain the optimal inlet shape through wind tunnel tests. Lee et al. [15] summarized analytical functions to describe the centerline shapes and area distribution of the inlet. Subsequently, Yu [16] integrated parabolic and linear shapes to design an intake system for capturing airflow. Lee and Kim [17] proposed an optimization method for subsonic S-shaped inlets based on aerodynamic sensitivity analysis.
As for the flow field characteristics of an S-shaped inlet, Mayer et al. [18] investigated flow characteristics and highlighted the impact of the centerline curvature on total pressure recovery and distortion. Anabtawi et al. [19] compared the flow characteristics of tubes with various centerline offsets and lengths and discovered that the centerline offset influenced the pressure gradient and boundary layer. Brear et al. [20] used both experiment and simulation methods to study the separation flow in S-shaped inlets, which found the phenomenon of owl-face flow patterns. The large eddy simulation (LES) method was implemented to study the flow within S-shaped inlets by Ming [21]. They demonstrated that severe changes in tube curvature led to larger total pressure distortion and more vortices.
Secondary flow systems refer to low-energy inlets located in the wing, fuselage, engine, and nozzle of aircraft. These systems are used for flow control, thermal management, and energy generation. Taleghani et al. [22,23,24] enhanced the high-lift performance on a two-dimensional supercritical airfoil using the modulated pulse jet of different generation strategies. In addition, they studied the effects of parameters and installation locations of the dielectric barrier discharge plasma actuator on the surface flow field of airfoils and obtained some interesting conclusions [25,26,27]. Sheikholeslam et al. used the lattice Boltzmann method to study the effects of different parameters such as acoustic wave frequency, amplitude, and direction of the wave on the water removal [28,29]. Soheila Abdolahipour used a pulsed jet at the chord-based Reynolds number of 1 × 10⁶ on a cross-section of airfoil by numerical simulation, revealing that utilizing a low actuation frequency range maximizes lift, while a high frequency range minimizes drag [30]. Su et al. [31] proposed a secondary flow circulation concept and demonstrated the possibility of adaptive passive control through numerical methods. Harouni [32] applied an ejector-pump-based system of fluidic actuators to manage the diffuser secondary flows directly. They proved that secondary flow systems could reduce engine-face total pressure distortion. Kumar [33] investigated the secondary flow characteristics and the associated vacuum generation caused by an increase in the primary pressure ramping in zero-secondary flow ejectors. They found that the secondary flow dynamics and the vacuum generation processes in rectangular and round ejectors show a close resemblance. Zhang et al. [34], Abdollahzadeh et al. [35], and Ma et al. [36] analyzed the effect of the secondary flow velocity on the characteristics of the nozzle flow. They indicated that the secondary system has a certain degree of influence on the main-flow field. Aiming at resolving the inlet’s decreasing mass flow ratio and increasing spillage drag at low Mach numbers, Cheng et al. [37] introduced a novel inlet featuring localized secondary flow recirculation, which could manage the location of forebody shock waves effectively, enhancing inlet capture capability.
In summary, the design and the flow characteristic analysis of main-flow-based inlets have been widely researched through simulation or experiments. However, studies on secondary flow systems installed within the wing are very few. The airflow in the tube of secondary flow systems drives the turbine to rotate and generate electricity, which improves the flying distance. In addition to that, the circulation of airflow increases the heat exchange of the airframe and reduces the internal temperature. Therefore, the analysis of flow field characteristics and mechanisms under subsonic and supersonic conditions is crucial for research into the secondary flow systems.
In this paper, ram-air and submerged secondary flow systems are researched using wind tunnel experiments and numerical simulation methods. Flow field and vortex characteristics in these two types of secondary flow systems under the conditions of subsonic, transonic, and supersonic inflows are analyzed. In addition, two performance indicators, the total pressure recovery and the total pressure distortion, are discussed.
2. Geometrical Models and Performance Indicator Definitions
The secondary flow systems are mounted in a wing. Two secondary flow models are designed: a ram-air system with an external intake cover and a submerged system. Key design parameters of the secondary flow systems include the leading edge sweep angle, the area distribution of the cross-section, and the curvature of the central line.
2.1. Geometrical Models
The wing uses the NACA0006 (National Advisory Committee for Aeronautics, Washington, DC, USA) profile and has a root-to-tip ratio of 3:2. Two sharp leading edges are connected with a semi-circle of R = 3 mm, as depicted in Figure 1.
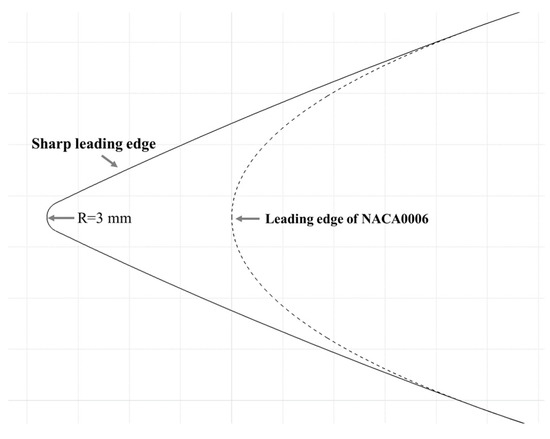
Figure 1.
Geometry of wing leading edge.
The main structures of the secondary flow systems are shown in Figure 2: (a) the ram-air secondary flow system, (b) the submerged secondary flow system. The ram-air secondary flow system is distinguished by additional lip covers at its intake and outlet, intended to maximize airflow capture and facilitate the discharge of internal airflow. However, the submerged secondary flow system is embedded inside the wing and does not have a lip cover.
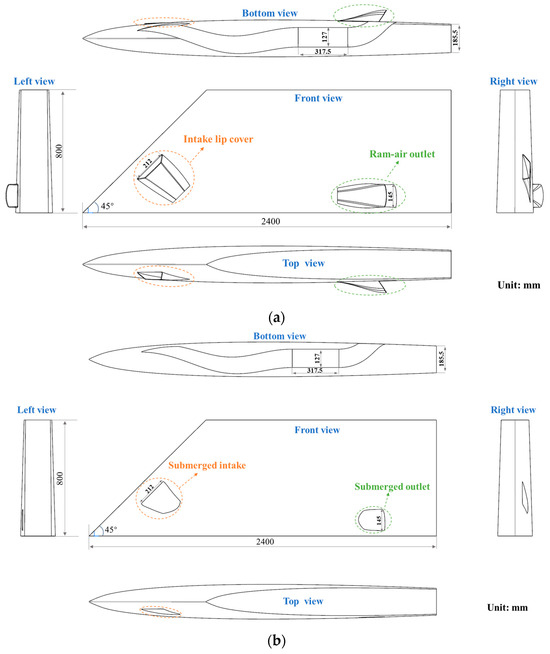
Figure 2.
Geometrical models of the secondary flow systems: (a) ram-air secondary flow system, (b) submerged secondary flow system (length unit is mm).
2.2. Parameterization
An analytical function is used to represent area distributions which control the streamwise pressure gradient imposed upon the flow (and thereby the flow separation) whose mathematical representations is as follows:
where and are the areas of the diffuser entrance and exit, and is the length of a flow tube, respectively. According to the literature [1], the best performance of the flow tube is produced by the opposite change law between the centerline and area distribution. Considering that the curvature change of the centerline of the front side pipeline is greater than that of the rear side, we set the area distribution change in the forward tube to be gentle. Therefore, the area distribution between #2 and #1 in Figure 3 of [15] is designed, as shown in Equation (1) and Figure 3.
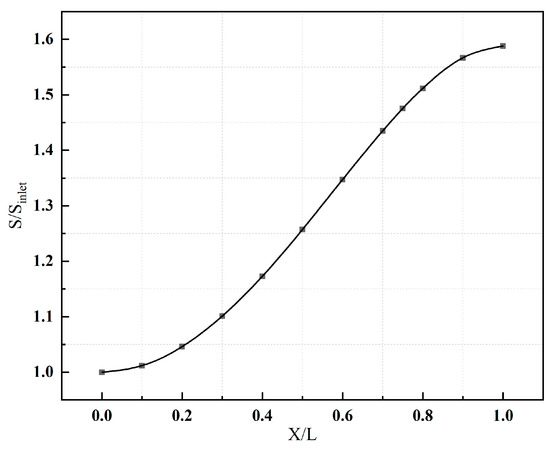
Figure 3.
The area distribution of secondary flow systems.
Bezier curves are used to design the centerline of the flow tube. The model coordinate system is shown in Figure 4. The maximum offset of centerlines is set as and , respectively, as shown in Figure 4.
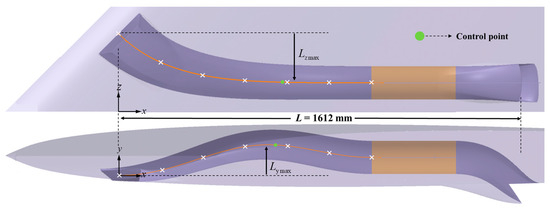
Figure 4.
Parameters of the centerline.
The flow tube is connected to a cylindrical segment. The length of the cylindrical segment () is 2.5 times the section diameter (). To accurately measure the total pressure recovery coefficient within the secondary flow system, the monitoring surface is located three-quarters of the way along the length of the cylindrical tube, which minimizes the impact of the upstream and downstream on the total pressure distribution, as illustrated in Figure 5.
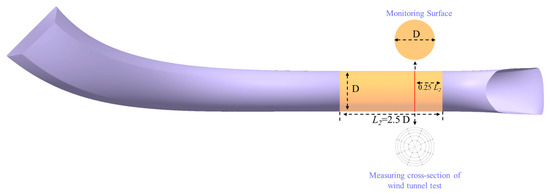
Figure 5.
Schematic diagram of the cylindrical tube and the monitoring surface.
Performance indicators include the total pressure recovery () and the total pressure distortion coefficient () as defined by Berrier et al. [38]. represents the degree of total pressure recovery within the tube. At the same time, quantifies the total pressure distribution in cross-sections. These two indicators at the monitoring surface are used to measure the performance of the secondary flow system. is defined in Equations (2) and (3). is defined in Equation (4).
where denotes the average total pressure on the monitoring surface. i is the total measurement point number. is the pressure at measuring point i, and represents the inflow’s total pressure.
3. Methods
Section 3.1 outlines the experimental methods, detailing the dimensions of the wind tunnel test section, the support system, the total pressure rake specifications, and the wind tunnel operating conditions. In Section 3.2, the computational simulation methods are introduced, including the turbulence models, boundary conditions, and so on. Four meshes with different cells were designed to validate the grid independence, and a suitable mesh was obtained to carry out numerical simulation calculations.
3.1. Experiment
The experiments were carried out at the FL-2 wind tunnel of the AVIC Aerodynamics Research Institute (Shenyang, China), in which the features rectangular test section measures 1.2 m × 1.2 m dimensions. The Reynolds numbers of the wind tunnel ranges from 5.85 × 10⁵ and 1.75 × 10⁶, in which the reference length is the width of the test section, 1.2 m. The wind tunnel model is a 50% scale model of the original model in Figure 2. Detailed test conditions of the wind tunnel are provided in Table 1.

Table 1.
Wind tunnel test conditions.
The test models of ram-air and submerged secondary flow systems in Figure 6a,b are the wind tunnel models which were supported by a tail sting, referring to Taleghani et al. [39,40], as depicted in Figure 6c. A total pressure rake was situated at the measuring cross-section, which was overlapped with the monitoring surface, as illustrated in Figure 5. This rake comprised eight array brackets. Each of them had five total pressure probes, as demonstrated in Table 2 and Figure 7.
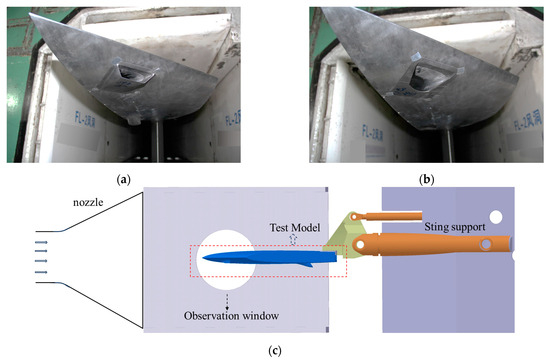
Figure 6.
Test models of secondary flow systems installation on the wind tunnel test section: (a) ram-air secondary flow system, (b) submerged secondary flow system, (c) test model installation on the wind tunnel test section.

Table 2.
The relative positions of the measurement points.
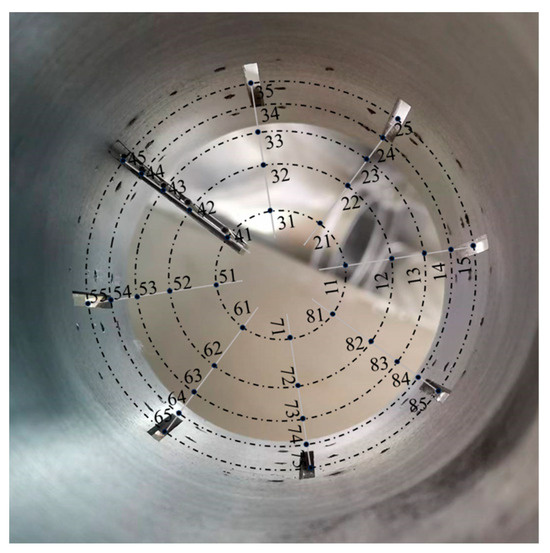
Figure 7.
Locations of measuring points at the total pressure rake.
To obtain steady pressure information, forty probes of the total pressure rake were connected to the PSI 9000 Digital Multi-Channel Pressure Scanner Measurement System produced by the PSI company (Olathe, KS, USA). The pressure scanner has ±0.03% FS DTC system accuracy, and the sampling rate reach was set to 50,000 CH/s in the test.
3.2. Numerical Simulation
3.2.1. Numerical Methods
Reynolds-averaged Navier–Stokes (RANS) equations are used to simulate the flow field within the secondary flow systems of subsonic and supersonic conditions in a three-dimensional compressible environment, and are then solved by the commercial CFD software Fluent 2023 R1. The CFD simulation is executed by using the finite volume technique.
Roe flux-difference splitting (Roe-FDS) is selected as the convective flux type. The flow field simulations are carried out using the density-based solver. In spatial discretization methods, the second-order upwind scheme is used for the flow term, turbulent kinetic energy term, and specific dissipation rate term. The one-equation Spalart–Allmaras turbulence model [41] is employed to model the turbulent velocity profile. It has been widely used in engineering applications because it is less computationally expensive and more robust than the multi-equation models [42]. The piecewise polynomial method is selected to compute specific heat, whereas viscosity is solved using Sutherland’s formula. To obtain accurate numerical results near the wall, the majority of the y+ values are approximately 1. When the residuals reach their minimum values after falling by more than three orders of magnitude, and the difference between the computed inflow and the outflow mass flux of the flow tube is below 0.001 kg/s, the solutions are considered to have converged.
In the following numerical simulations, three-dimensional unstructured triangle meshes of simulation calculation models were generated. The boundary conditions included non-slip wall conditions at the wing and tube and far-field pressure, which are given in Figure 8. The incoming flow Mach numbers were set as 0.4, 0.8, 1.1, 1.5, and 2.0, and the angle of attack was fixed at 0°.
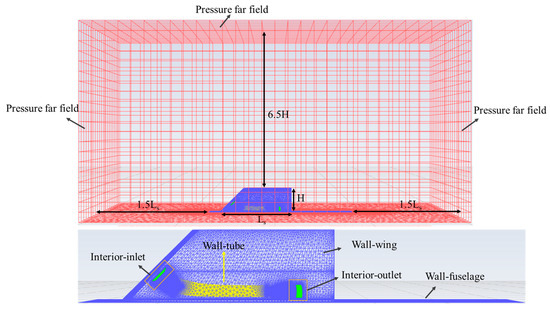
Figure 8.
Calculating mesh and boundary conditions.
3.2.2. Grid Independence Verification
To decrease the numerical errors induced by the grids, a grid independence verification was conducted before the actual application. Four meshes with cells of 0.9 million (grid 1), 1.8 million (grid 2), 3.6 million (grid 3), and 7.2 million (grid 4) were designed.
The simulated results of total pressure recovery () and total pressure distortion () of four grids were compared, as shown in Table 3. Considering efficiency and accuracy, grid 3 was selected for all the subsequent numerical simulations.

Table 3.
Calculation results of four grids.
4. Result and Discussion
This section examines the total pressure recovery and distortion coefficient results from both wind tunnel experiments and numerical simulations. By comparison of the test results with those from simulations, the reliability of both methods is validated. Following that, the flow characteristics and mechanisms within two types of secondary flow systems, ranging from subsonic to supersonic speeds, are analyzed using numerical simulation methods.
4.1. Analysis of Experimental Results
The total pressure recovery and total pressure distortion obtained from wind tunnel tests are presented in Table 4 and Table 5.

Table 4.
Experimental results of the ram-air secondary flow system.

Table 5.
Experimental results of the submerged secondary flow system.
Table 5 demonstrates that, as the Mach number increases, the decreases, and the increases for both types of secondary flow systems. Notably, the in the submerged system decreases at Mach number 1.5 but rises again at Mach number 2.0, which is attributed to the development of vortex flow and separated flow.
4.2. Analysis of Simulation Results
4.2.1. Analysis of Total Pressure Recovery ()
Figure 9 shows the total pressure recovery as a function of incoming Mach numbers for the two types of secondary flow systems. The comparison reveals the highest errors between simulation and experimental results to be 8% for the ram-air system and 10% for the submerged system, respectively. This demonstrates that the simulation method can accurately predict the in secondary flow systems. From Mach numbers 0.4 to 2, the of the ram-air system decreases by 68%, and the submerged system decreases by 71%, highlighting a strong correlation between separated flow, swirling flow, and frictional loss in the flow tube [43,44]. More detailed analyses of flow characteristics and mechanisms are discussed in the subsequent segment.
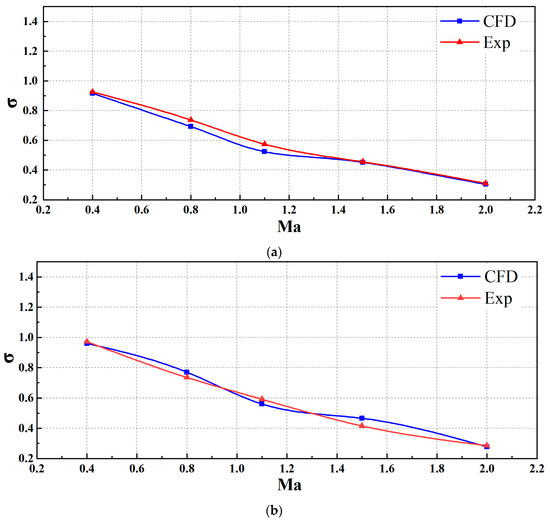
Figure 9.
Comparison of experimental and simulation total pressure recovery: (a) ram-air secondary flow system, (b) submerged secondary flow system.
4.2.2. Analysis of Total Pressure Distortion ()
Figure 10 illustrates the trends in total pressure distortion () with varying incoming Mach numbers for the two types of secondary flow systems. The simulated data exhibit an increasing trend in with rising Mach numbers, which is consistent with the experimental results. As the Mach number increases from 0.4 to 2, the of the ram-air and submerged secondary flow systems is increased by 19.7 times and 8.3 times, respectively. However, discrepancies arise in the predicted values for the ram-air system at supersonic speeds, where the simulated values exceed the experimental ones. These relative errors become more pronounced at Mach number 2. According to Equations (2) and (3), is highly sensitive to local flow field pressure, which may explain the inaccuracies in the simulation predictions. Similar studies on S-shaped inlets by Berens et al. [45] and Lima et al. [46] have also reported analogous inaccuracies.
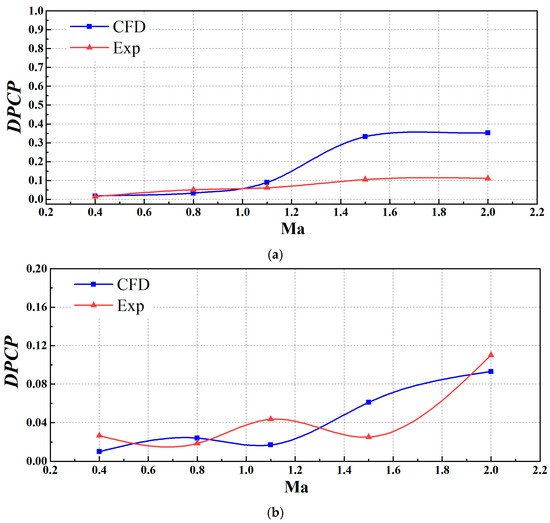
Figure 10.
Comparison of experimental and simulation total pressure distortion coefficients: (a) ram-air secondary flow system, (b) submerged secondary flow system.
4.3. Flow Characteristics Analysis in the Ram-Air Secondary Flow System
4.3.1. Flow Characteristics on the Wing
Figure 11 presents the pressure coefficient distributions across the ram-air secondary flow systems at inflow Mach numbers ranging from 0.4 to 2.0. Predominantly, the leading edge, the intake cowl lip, and the windward of the outlet cowl lip exhibit positive pressure, while the negative pressure is observed on the leeward of intake and outlet cowls. The pressure coefficient distributions remain relatively unchanged at subsonic inflow. However, at transonic and supersonic speeds, the region of positive pressure expands along the flow direction, while the extent of the negative pressure region shrinks.
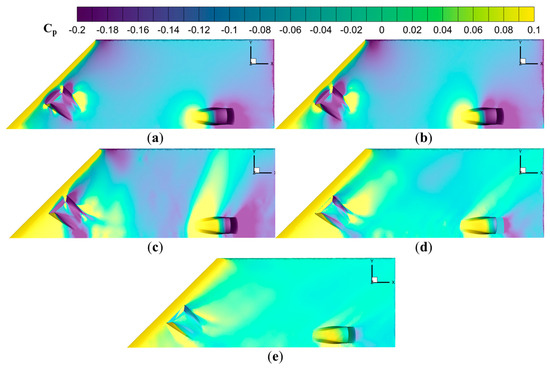
Figure 11.
Pressure coefficient distributions on the wing surface of the ram-air secondary flow systems at (a) Mach number 0.4, (b) Mach number 0.8, (c) Mach number 1.1, (d) Mach number 1.5, (e) Mach number 2.0.
4.3.2. Flow Characteristics at the Intake
Figure 12 illustrates the streamlines within the intake. Region A is positioned at the intake cowl lip. When the incoming Mach number exceeds 1.0, the airflow in Region A is compressed, forming shock waves that induce significant lateral and adverse pressure gradients. Region B marks the intake’s concave area, where the air expands. The flow in Region B is more prone to separate under the effects of pressure gradients in Regions A and B.
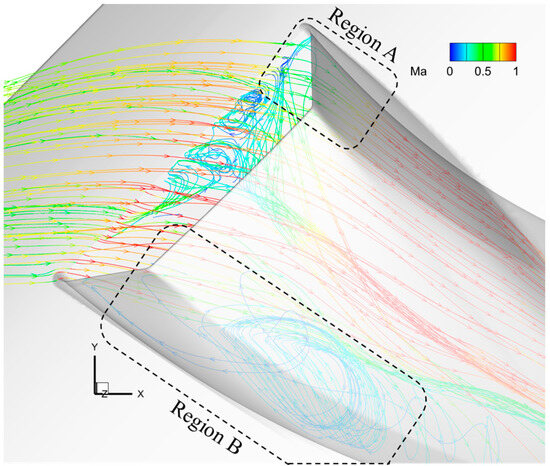
Figure 12.
Intake streamlines of the ram-air secondary flow system.
4.3.3. Flow Characteristics in the Tube
For a comprehensive analysis of flow characteristics and mechanisms within the ram-air secondary flow system, the tube flow field was discretized. As shown in Figure 13, eight equidistant slices were selected, with a distance of 2a between each slice. In addition, a slice was added between the two slices with larger curvature on the tube surface, with a distance of a.

Figure 13.
Schematic illustration of the analyzed cross-sections in the tube of the ram-air secondary flow system (named Slice 1, Slice 2, etc.).
The total pressure recovery along the tube within the secondary flow systems is shown in Figure 14. The change amplitude of the total pressure recovery within the forward section (from Slices 1 to 3) of the tube is larger than the mid and aft section (from Slices 3 to 9), which is related to the separation regions at the intake of the tube.
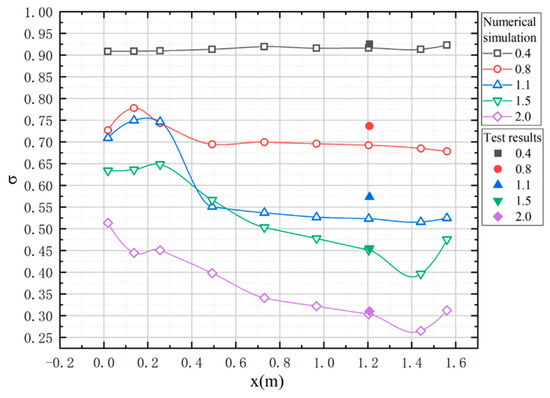
Figure 14.
The curve of pressure changes along the tube of the ram-air secondary flow system.
Figure 15 presents the streamlines inside the tube and the contours of the nine Slices, as well as the transversal streamlines at each Slice separately. From Slices 1 to 3, the large curvature of the tube surface easily induces flow separation, as shown in Table 6. The in the separation region is significantly lower than those in other parts of the tube, primarily due to wall friction resistance. The flow within the forward section (from Slices 1 to 3) of the tube is characterized mainly by streamwise vortices, while the mid-tube (from Slices 3 to 6) flow exhibits three-dimensional vortices. The aft section (from Slices 6 to 8) displays predominantly spanwise vortices. The three-dimensional vortices spiral downstream along the streamline, which transitions airflow within the tube from the streamwise vortex to the spanwise vortex. As the Mach number increases, the separation position at the intake of the ram-air secondary flow system changes insignificantly, as shown in Table 5, but the spanwise area decreases distinctly.
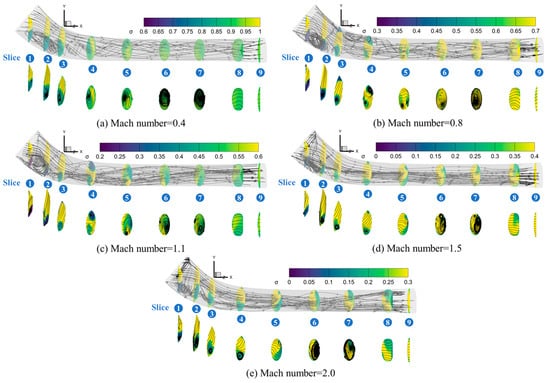
Figure 15.
The streamlines inside the tube and the total pressure recovery distributions of nine flow field Slices in the ram-air secondary flow tube at (a) Mach number 0.4, (b) Mach number 0.8, (c) Mach number 1.1, (d) Mach number 1.5, (e) Mach number 2.0.

Table 6.
The position of separation regions at the intake within the ram-air secondary flow system.
At Mach number 0.4, the internal flow field of the tube exhibits stability, as indicated by smaller separation regions at Slices 1 and 2 and at the top of Slices 3 and 4. This stability can be attributed to factors such as low internal airflow velocity, minimal flow compression, and reduced adverse pressure gradients. As the Mach number increases to 0.8, the pressure gradient amplifies, increasing the region of separation flow. At Mach number 1.1, the extent of flow separation at the intake is similar to the field at Mach number 0.8. From Mach numbers 0.9 and 1.1, the airflow accelerates from Slices 1 to 3, diminishing the adverse pressure gradients and consequently reducing the separation regions. At Mach numbers 1.5 and 2, complex incident and reflected shock waves occur at Slice 1, which contributes to smaller total pressure recovery ().
4.4. Flow Characteristics Analysis in the Submerged Secondary Flow System
4.4.1. Flow Characteristics on the Wing
Figure 16 illustrates the pressure coefficient distributions within the submerged secondary flow systems. Positive pressure consistently appears near the leading edge, the intake apex, and the upstream of the outlet, contrasting with negative pressure regions in the concave section of the intake and the downstream of the outlet. The configuration and extent of these pressure regions are predominantly shaped by the incoming flow parameters and flow field dynamics. Notably, under the subsonic conditions, the shapes and extents of the negative pressure areas exhibit minimal change. However, as the flow transitions to transonic and supersonic speeds, the positive pressure regions elongate along the flow direction while the negative pressure areas progressively contract, reflecting an increased positive pressure on the wing surface alongside intensified air compression.
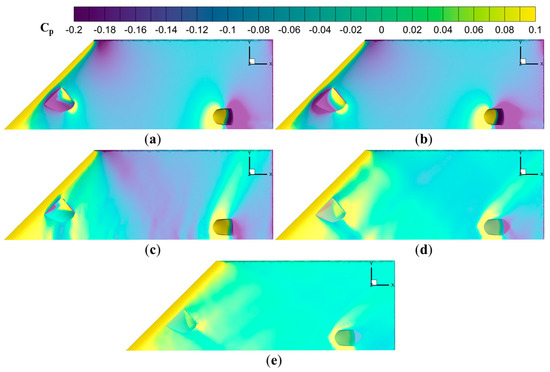
Figure 16.
Pressure coefficient distribution on the wing surfaces of the submerged secondary flow system at (a) Mach number 0.4, (b) Mach number 0.8, (c) Mach number 1.1, (d) Mach number 1.5, (e) Mach number 2.0.
4.4.2. Flow Characteristics at the Intake
Flow streamlines at the intake of the submerged secondary flow system are depicted in Figure 17, highlighting the three-dimensional characteristics of airflow capture. In Region C, an angle between the intake lip and incoming flow direction results in compression, deceleration, and redirection of airflow at the top of the tube intake. Region D features a concave cavity flow along the wing surface, and the negative pressure area at the intake induces the entrainment and vortex formation to capture the inflow.
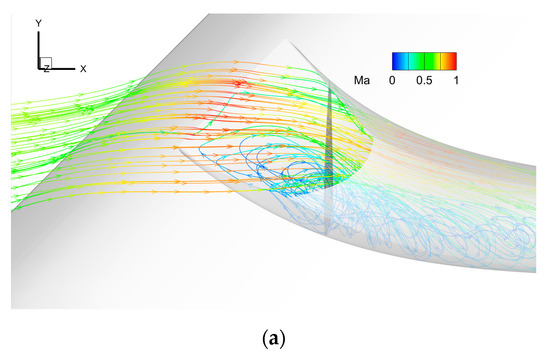
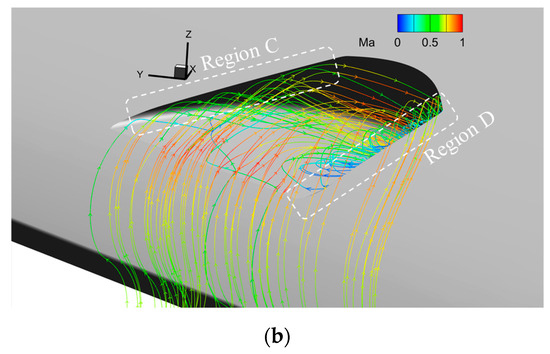
Figure 17.
Flow streamlines at the intake of the submerged secondary flow system: (a) vertical z-axis direction view, (b) isometric view.
4.4.3. Flow Characteristics in the Tube
For comprehensive analysis of flow characteristics and mechanisms within the submerged secondary flow system, the tube flow field was discretized similarly to the ram-air secondary flow system, as shown in Figure 18.

Figure 18.
Schematic illustration of the analyzed cross-sections in the tube of the submerged secondary flow system (named Slice 1, Slice 2, etc.).
The total pressure recovery along the tube within the secondary flow systems is shown in Figure 19. The change amplitude of the total pressure recovery within the forward section (from Slices 1 to 4) of the tube is larger than in the mid and aft section (from Slices 4 to 9), which is related to the separation regions at the intake of the tube.
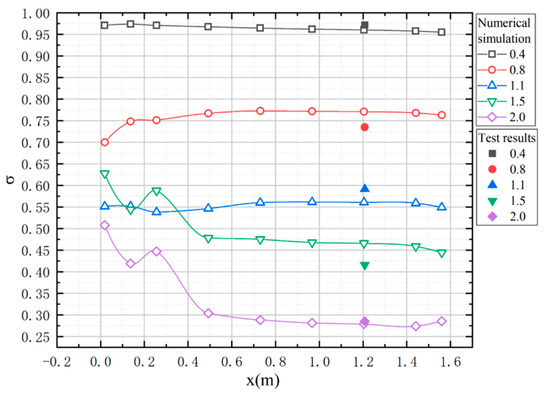
Figure 19.
The curve of pressure changes along the tube of the submerged secondary flow system.
The flow tube of the submerged secondary flow system is integrated into the wing surface, with the intake and outlet edges tangent to the wing surface. Guided by the tube’s curved surface and influenced by the pressure gradient, two distinct vortices form within the tube: the streamwise vortex and the spanwise vortex (Figure 20). The streamlines at the bottom of Slices 1 to 4 reveal the coexistence vortices in the separation regions, as shown in Table 7. Predominantly, the streamwise and spanwise vortices merge under the induction of the tube surface, forming three-dimensional vortices in the mid-tube (from Slices 4 to 7). The three-dimensional vortices spiral downstream along the streamline, which transitions airflow within the tube from the streamwise vortex to the spanwise vortex (from Slices 4 to 7). Compared with the upstream field, these three-dimensional vortices tend to improve the and mitigate cross-sectional pressure distortion. It is observed that the internal pressure gradient, vortex characteristics, and values of and exhibit different behaviors under varying Mach number conditions. As the Mach number increases, the streamwise length of the intake separation region within the submerged secondary flow system increases under the subsonic inflow conditions, then reaches its maximum in the supersonic range. After that, it decreases under the supersonic speeds, as shown in Table 7.
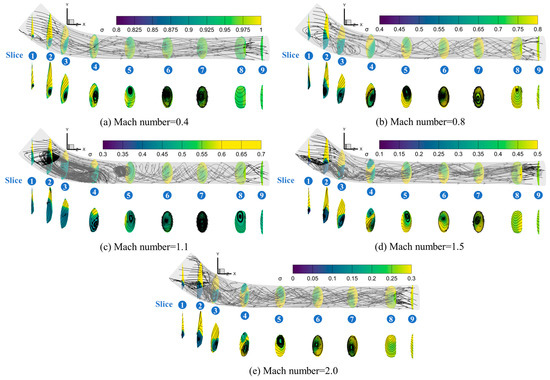
Figure 20.
The streamlines inside the tube and the total pressure recovery distributions of nine flow field Slices in the submerged secondary flow tube at (a) Mach number 0.4, (b) Mach number 0.8, (c) Mach number 1.1, (d) Mach number 1.5, (e) Mach number 2.0.

Table 7.
The position of separation regions at the intake within the submerged secondary flow system.
At Mach number 0.4, the flow velocity inside the tube is relatively low. The tube induces the spanwise vortices from the bottom to the middle, and eventually to the apex. Pressure distortion reaches its minimum when the spanwise vortex encompasses the entire cross-section. At Mach numbers 0.8 and 1.1, the compressive effect of the transonic flow become more pronounced compared to the subsonic flow, increasing the likelihood of flow separation near Slices 1 to 3. The separation regions emerge at the tube’s intake, occupying considerable portions of the tube. The spanwise vortices at Mach 0.8 extend earlier (Slice 5), explaining the reduced observed at this Mach number, as indicated in Table 5.
At Mach number 1.5, in addition to the separation regions at the bottom of Slices 1 to 3, smaller spanwise vortices appear at the top of Slices 3 to 4. The vortex pair comprises a larger vortex induced by the tube’s intake and a smaller one induced by curvature, which are led to a spanwise vortex due to the influence of three-dimensional vortices. At Mach number 2, the top vortex is smaller, likely a result of the increased flow rate and lateral pressure gradient within the tube. Mach 2 represents the peak velocity among the operating conditions, resulting in the most significant flow compression effect and shock wave, which intrinsically leads to the lowest total pressure recovery in the tube.
5. Conclusions
Two types of secondary flow systems, a ram-air system and a submerged system, were designed. Wind tunnel tests were conducted under subsonic and supersonic conditions to obtain the performance of the secondary flow system. In addition, numerical simulation was used to analyze the secondary flow systems, which found that the incoming Mach numbers and vortices within the tube have significant impacts on the performance of these systems. The main conclusions are as follows:
- (1)
- It demonstrates that the simulation method can accurately predict the total pressure recoveries, contrasting with experimental results. The relative errors are 8% for the ram-air system and 10% for the submerged system between calculation and experimental results, respectively.
- (2)
- The experiment and simulation results indicate that the total pressure recovery decreases and the total pressure distortion increases with the increase in Mach numbers. As the Mach number increases from 0.4 to 2, the total pressure recovery of the ram-air secondary flow system decreases by 68% and 71% for the submerged system, respectively. Moreover, the total pressure distortion of the ram-air and submerged secondary flow systems is increased by 19.7 times and 8.3 times, respectively.
- (3)
- There are two primary flow characteristics in the secondary flow system. Firstly, the separations in the tube are primarily impacted by adverse pressure gradients. The flow separation at the intake mainly affects the total pressure recovery. Secondly, the three-dimensional vortices in the center of the tube are caused by the transition of the cross-section shape. The strength of three-dimensional vortices modifies the total pressure distribution over the cross-section and influences the total pressure distortion at the outlet.
This work focuses on the internal flow characteristics within two types of secondary flow systems and the influence of Mach numbers on these systems. It offers methods for numerical simulation of and experiments on the secondary flow systems embedded in a supersonic wing. The current work paves the way for the design and application of secondary flow systems in aircraft. Future research can focus on the multi-objective optimization of secondary flow systems.
Author Contributions
Conceptualization, S.Z. and Z.L.; formal analysis, S.Z. and Z.L.; funding acquisition, J.L.; investigation, S.Z., Z.G., and S.M.; methodology, S.Z., J.L., and L.Z.; project administration, J.L.; resources, J.L.; software, L.Z. and D.P.; supervision, J.L. and L.Z.; validation, S.Z.; writing—original draft, S.Z.; writing—review and editing, L.Z. All authors have read and agreed to the published version of the manuscript.
Funding
This research was funded by specialized research projects of Huanjiang Laboratory. The APC was funded by Zhejiang University.
Data Availability Statement
The data that support the findings of this study are available from the corresponding author upon reasonable request.
Acknowledgments
This research was supported by the 1912 project of China, the National Natural Science Foundation of China (no. U2241274), and the specialized research projects of Huanjiang Laboratory.
Conflicts of Interest
The authors declare no conflicts of interest.
Nomenclature
| the maximum centerline offset of the y–x plane | |
| the maximum centerline offset of the z–x plane | |
| the length of the cylinder tube | |
| the monitor number | |
| the average total pressure measured by the monitor | |
| the total pressure of the inflow | |
| total pressure distortion coefficient | |
| total pressure recovery |
References
- Sziroczak, D.; Smith, H. A review of design issues specific to hypersonic flight vehicles. Prog. Aerosp. Sci. 2016, 84, 1–28. [Google Scholar] [CrossRef]
- Ferri, A. Review of scramjet propulsion technology. J. Aircraft 1968, 5, 3–10. [Google Scholar] [CrossRef]
- Anderson, B. Factors which influence the analysis and design of ejector nozzles. In Proceedings of the 10th Aerospace Sciences Meeting, San Diego, CA, USA, 17–19 January 1972; p. 46. [Google Scholar] [CrossRef][Green Version]
- Collie, W.; Burgun, R.; Heinzen, S.; Hall, C., Jr.; Chokani, N. Advanced propulsion system design and integration for a turbojet powered unmanned aerial vehicle. In Proceedings of the 41st Aerospace Sciences Meeting and Exhibit, Reno, NV, USA, 6–9 January 2003; p. 415. [Google Scholar] [CrossRef]
- Heiser, W.H. Ejector thrust augmentation. J. Propuls. Power 2010, 26, 1325–1330. [Google Scholar] [CrossRef]
- Li, N.; Chang, J.; Jiang, C.; Yu, D.; Bao, W.; Song, Y.; Jiao, X. Unstart/restart hysteresis characteristics analysis of an over–under TBCC inlet caused by backpressure and splitter. Aerosp. Sci. Technol. 2018, 72, 418–425. [Google Scholar] [CrossRef]
- Seddon, J.; Goldsmith, E.L. Intake Aerodynamics; American Institute of Aeronautics and Astronautics: Reston, VA, USA, 1985. [Google Scholar]
- Frank, J.L.; Taylor, R.A. Comparison of Drag, Pressure Recovery, and Surface Pressure of a Scoop-Type Inlet and an NACA Submerged Inlet at Transonic Speeds; National Advisory Committee for Aeronautics: Washington, DC, USA, 1951. Available online: https://ntrs.nasa.gov/citations/19930086824 (accessed on 23 July 2023).
- Mossman, E.A.; Randall, L.M. An Experimental Investigation of the Design Variables for NACA Submerged Duct Entrances; National Advisory Committee for Aeronautics: Washington, DC, USA, 1948. Available online: https://ntrs.nasa.gov/citations/19930093809 (accessed on 23 July 2023).
- Martin, N.J.; Holzhauser, C.A. An Experimental Investigation at Large Scale of Several Configurations of an NACA Submerged Air Intake; National Advisory Committee for Aeronautics: Washington, DC, USA, 1948. Available online: https://ntrs.nasa.gov/citations/19930085452 (accessed on 23 July 2023).
- Taylor, R.A. Some Effects of Side-Wall Modifications on the Drag and Pressure Recovery of an NACA Submerged Inlet at Transonic Speeds; National Advisory Committee for Aeronautics: Washington, DC, USA, 1952. Available online: https://ntrs.nasa.gov/citations/19930087954 (accessed on 10 September 2023).
- Tan, H.J.; Guo, R.W. Design and wind tunnel study of a top-mounted diverter less inlet. Chin. J. Aeronaut. 2004, 17, 72–78. [Google Scholar] [CrossRef]
- Sun, S.; Guo, R.; Wu, Y. Characterization and Performance Enhancement of Submerged Inlet with Flush-Mounted Planar Side Entrance. J. Propuls. Power 2012, 23, 987–995. [Google Scholar] [CrossRef]
- Xie, W.; Yang, S.; Zeng, C.; Liao, K.; Ding, R.; Zhang, L.; Guo, S. Effects of forebody boundary layer on the performance of a submerged inlet. Aeronaut. J. 2021, 125, 1260–1281. [Google Scholar] [CrossRef]
- Lee, C.; Boedicker, C. Subsonic diffuser design and performance for advanced fighter aircraft. In Proceedings of the Aircraft Design Systems and Operations Meeting, Colorado Springs, CO, USA, 14–16 October 1985. [Google Scholar] [CrossRef]
- Yu, A.Y. A Study of the Design Method and an Investigation of the Aerodynamic Performance for a Submerged Inlet under a Stealthy Shaped Fuselage; Nanjing University of Aeronautics and Astronautics: Nanjing, China, 2003. [Google Scholar]
- Lee, B.J.; Kim, C. Automated design methodology of turbulent internal flow using discrete adjoint formulation. Aerosp. Sci. Technol. 2007, 11, 63–173. [Google Scholar] [CrossRef]
- Mayer, D.; Anderson, B.; Johnson, T. 3D subsonic diffuser design and analysis. In Proceedings of the 34th AIAA/ASME/SAE/ASEE Joint Propulsion Conference and Exhibit, Cleveland, OH, USA, 13–15 July 1998; p. 3418. [Google Scholar] [CrossRef]
- Anabtawi, A.; Blackwelder, R.; Lissaman, P.; Liebeck, R. An experimental study of vortex generators in boundary layer ingesting diffusers with a centerline offset. In Proceedings of the 35th Joint Propulsion Conference and Exhibit, Los Angeles, CA, USA, 20–24 June 1999; p. 2110. [Google Scholar] [CrossRef]
- Brear, M.J.; Warfield, Z.; Mangus, J.F.; Braddom, S.; Paduano, J.D.; Philhower, J.S. Flow separation within the engine inlet of an uninhabited combat air vehicle (UCAV). J. Fluids Eng. 2004, 126, 266–272. [Google Scholar] [CrossRef]
- Ming, L.; Wu, Y.; Yang, Z.; Zhu, Z.; Ouyang, H.; Li, L. Large eddy simulation investigation of S-shaped intake distortion and swirl characteristics. Aerosp. Sci. Technol. 2023, 141, 108578. [Google Scholar] [CrossRef]
- Abdolahipour, S.; Mani, M.; Taleghani, A.S. Parametric study of a frequency-modulated pulse jet by measurements of flow characteristics. Phys. Scr. 2021, 96, 125012. [Google Scholar] [CrossRef]
- Abdolahipour, S.; Mani, M.; Shams Taleghani, A. Experimental investigation of flow control on a high-lift wing using modulated pulse jet vortex generator. J. Aerosp. Eng. 2022, 35, 05022001. [Google Scholar] [CrossRef]
- Abdolahipour, S.; Mani, M.; Shams Taleghani, A. Pressure improvement on a supercritical high-lift wing using simple and modulated pulse jet vortex generator. Flow Turbul. Combust. 2022, 109, 65–100. [Google Scholar] [CrossRef]
- Mohammadi, M.; Taleghani, A.S. Active flow control by dielectric barrier discharge to increase stall angle of a NACA0012 airfoil. Arab. J. Sci. Eng. 2014, 39, 2363–2370. [Google Scholar] [CrossRef]
- Taleghani, A.S.; Shadaram, A.; Mirzaei, M. Effects of duty cycles of the plasma actuators on improvement of pressure distribution above a NLF0414 airfoil. IEEE Trans. Plasma Sci. 2012, 40, 1434–1440. [Google Scholar] [CrossRef]
- Taleghani, A.S.; Shadaram, A.; Mirzaei, M.; Abdolahipour, S. Parametric study of a plasma actuator at unsteady actuation by measurements of the induced flow velocity for flow control. J. Braz. Soc. Mech. Sci. Eng. 2018, 40, 173. [Google Scholar] [CrossRef]
- Noori, M.S.; Taleghani, A.S.; Rahni, M.T. Surface acoustic waves as control actuator for drop removal from solid surface. Fluid Dyn. Res. 2021, 53, 045503. [Google Scholar] [CrossRef]
- Rahni, M.T.; Taleghani, A.S.; Sheikholeslam, M.; Ahmadi, G. Computational simulation of water removal from a flat plate, using surface acoustic waves. Wave Motion 2022, 111, 102867. [Google Scholar] [CrossRef]
- Abdolahipour, S. Effects of low and high frequency actuation on aerodynamic performance of a supercritical airfoil. Front. Mech. Eng. 2023, 9, 1290074. [Google Scholar] [CrossRef]
- Su, W.Y.; Zhang, Y.; Jin, Z.G. Adaptive passive control on hypersonic inlet boundary layer separation. J. Propuls. Technol. 2011, 32, 455–460. [Google Scholar] [CrossRef]
- Harouni, A.G. Flow control of a boundary layer ingesting serpentine diffuser via blowing and suction. Aerosp. Sci. Technol. 2014, 39, 472–480. [Google Scholar] [CrossRef]
- Kumar, R.A.; Rajesh, G. Physics of vacuum generation in zero-secondary flow ejectors. Phys. Fluid 2018, 30, 066102. [Google Scholar] [CrossRef]
- Zhang, K.Y.; Zhang, R.X.; Xu, H. Investigation of single expansion ram-airp nozzle. J. Propuls. Technol. 2001, 22, 380–382. [Google Scholar]
- Abdollahzadeh, M.; Rodrigues, F.; Pascoa, J.; Oliveira, P. Numerical design and analysis of a multi-DBD actuator configuration for the experimental testing of ACHEON nozzle model. Aerosp. Sci. Technol. 2015, 41, 259–273. [Google Scholar] [CrossRef]
- Ma, S.; Tan, J.; Zhang, Z.; Zhu, W.; Jiang, H. Influence of secondary flow ejection on the performance of conformal asymmetric nozzle. J. Natl. Univ. Def. Technol. 2018, 40, 44–51. [Google Scholar] [CrossRef]
- Cheng, D.; Zhang, Y.; Gao, W.; Xue, Y. Investigation of a Variable Axisymmetric Inlet with Local Secondary Flow Recirculation. J. Propuls. Technol. 2019, 40, 2003–2011. [Google Scholar]
- NASA/TP-2005-213766; Berrier, B.L.; Carter, M.B.; Allan, B.G. High Reynolds Number Investigation of a Flush-Mounted, S-Duct Inlet with Large Amounts of Boundary Layer Ingestion. National Advisory Committee for Aeronautics: Washington, DC, USA, 2005. Available online: https://ntrs.nasa.gov/api/citations/20050229940/downloads/20050229940.pdf (accessed on 18 November 2023).
- Shams Taleghani, A.; Ghajar, A. Aerodynamic characteristics of a delta wing aircraft underground effect. Front. Mech. Eng. 2024, 10, 1355711. [Google Scholar] [CrossRef]
- Shams Taleghani, A.; Ghajar, A.; Masdari, M. Experimental study of ground effect on horizontal tail effectiveness of a conceptual advanced jet trainer. J. Aerosp. Eng. 2020, 33, 05020001. [Google Scholar] [CrossRef]
- Spalart, P.; Allmaras, S.A. one-equation turbulence model for aerodynamic flows. In Proceedings of the 30th Aerospace Sciences Meeting and Exhibit, Reno, NV, USA, 6–9 January 1992; p. 439. [Google Scholar] [CrossRef]
- Li, W.; Liu, Y. Numerical investigation of corner separation flow using Spalart-Allmaras model with various modifications. Aerosp. Sci. Technol. 2022, 127, 107682. [Google Scholar] [CrossRef]
- Babcock, D.A.; Tobaldini Neto, L.; Davis, Z.S. Summary of the 4th Propulsion Aerodynamics Workshop: S-duct Results. In Proceedings of the AIAA Propulsion and Energy 2019 Forum, Indianapolis, IN, USA, 19–22 August 2019; p. 3845. [Google Scholar] [CrossRef]
- Kennedy, S.; Robinson, T.; Spence, S.; Richardson, J. Computational Investigation of Inlet Distortion at High Angles of Attack. J. Aircr. 2014, 51, 361–376. [Google Scholar] [CrossRef]
- Berens, T.M.; Delot, A.-L.; Chevalier, M.; van Muijden, J. Numerical simulations for high offset intake diffuser flows. In Proceedings of the 52nd Aerospace Sciences Meeting, National Harbor, MD, USA, 13–17 January 2014; p. 0371. [Google Scholar] [CrossRef][Green Version]
- Moura Lima, L.S.; Batista de Jesus, A.; Huebner, R. Analysis of Geometric Features and Mesh Parameters on the 3rd PAW S-duct Case. In Proceedings of the 53rd AIAA/SAE/ASEE Joint Propulsion Conference, Atlanta, GA, USA, 10–12 July 2017; p. 4910. Available online: https://arc.aiaa.org/doi/pdf/10.2514/6.2017-4910 (accessed on 9 March 2024).
Disclaimer/Publisher’s Note: The statements, opinions and data contained in all publications are solely those of the individual author(s) and contributor(s) and not of MDPI and/or the editor(s). MDPI and/or the editor(s) disclaim responsibility for any injury to people or property resulting from any ideas, methods, instructions or products referred to in the content. |
© 2024 by the authors. Licensee MDPI, Basel, Switzerland. This article is an open access article distributed under the terms and conditions of the Creative Commons Attribution (CC BY) license (https://creativecommons.org/licenses/by/4.0/).