Article

The Design and Performance Analysis of a 15 g/mol Helium–Xenon Mixture Centrifugal Compressor

1
Naval Architecture & Ocean Engineering College, Dalian Maritime University, Dalian 116026, China
2
Pakistan Navy Engineering College, Karachi, National University of Sciences and Technology, Islamabad 44000, Pakistan
*
Author to whom correspondence should be addressed.
Aerospace 2024, 11(11), 869; https://doi.org/10.3390/aerospace11110869
Submission received: 6 August 2024 / Revised: 11 October 2024 / Accepted: 22 October 2024 / Published: 23 October 2024
(This article belongs to the Special Issue Aerodynamic and Multidisciplinary Design Optimization)

Abstract

One of the primary parts of a closed Brayton cycle that uses a helium–xenon mixture as the working medium is a centrifugal compressor. Nowadays, there has been minimal research on the theoretical underpinnings and design procedures of a helium–xenon mixture centrifugal compressors, and the internal flow mechanisms remain poorly understood. In this study, we present a redesign of the 15 g/mol helium–xenon centrifugal compressor originally developed by Bruno M, utilizing a helium–xenon mixture as the working fluid to enhance compressor performance and facilitate an in-depth analysis of the internal flow dynamics. The findings indicate a significant expansion of the stable operating range of the redesigned compressor under identical outlet conditions, with a 33.27% increase in flow margin and substantial improvements in the pressure ratio. Furthermore, under consistent inlet conditions, at an operational flow rate of 0.8657 kg/s, the redesigned compressor exhibits a pressure ratio that is 2.11% greater than that of the original design, along with a variable efficiency increase of 1.1%.

1. Introduction

The development of closed Brayton cycle engines began in the 1930s. Scientists initially arrived at several research discoveries in theory [1,2]. The closed Brayton cycle, revered for its immense potential, finds extensive applications in various domains such as space exploration, hypersonic flight, and nuclear energy [3,4,5]. The closed Brayton cycle system can accommodate many heat sources, including fossil and nuclear fuels [6,7,8]. Furthermore, owing to its closed-cycle operation, the closed Brayton cycle inherently exhibits low emissions, rendering it particularly advantageous in addressing contemporary environmental challenges [9].
Helium’s exceptional transport properties render it an ideal working fluid for the closed Brayton cycle. Its specific heat capacity, which is quintuple that of air, increases particular work for the helium cycle, thereby increasing the compression difficulty. At the same time, the isentropic exponent of helium is also more significant than that of air, and its pressure ratio is smaller under the same temperature rise [10]. To leverage helium’s superior transport performance while addressing the issue of low-pressure ratios in helium compressors, a mixture of helium and xenon has emerged as a viable alternative for the working fluid in closed Brayton cycle systems [11]. Tournier, J-M [12] found that, under a specific mixing ratio, the performance of a helium–xenon binary mixture surpasses that of pure gases of equivalent quality. Mohamed S. [13] compared the thermal conductivity, Prandtl number, contraction coefficient, dynamic viscosity, standardized pressure loss, and other physical properties of helium–xenon binary mixtures across various mixing ratios. The study concluded that a helium–xenon mixture with a molecular weight of 40 g/mol exhibits a heat transfer coefficient comparable to pure helium. At the same time, the aerodynamic load of the impeller is only 10% of that associated with pure helium. Conversely, a helium–xenon mixture with a molecular weight of 15 g/mol demonstrates a heat transfer coefficient 7% higher than pure helium, with an aerodynamic load amounting to the impeller to 27% of pure helium. Adil Malik [14] investigated the physical properties of helium–xenon mixtures with molecular weights not exceeding 40 g/mol and made it clear that mixtures with varying molecular weights are suited for distinct application scenarios.
For low-power closed Brayton cycle systems, the radial flow compressor offers significant advantages in size and weight. In 2007, Gallo [15] developed a closed Brayton cycle power system utilizing a helium–xenon mixture with an average molecular weight of 40 g/mol as the working medium for space exploration. The centrifugal compressor is designed in detail, and the design value is in good agreement with the experimental value of NASA [16,17,18]. Zhang Shuwei [19] investigated the impact of splitter blade length and circumferential positioning on the performance of helium–xenon compressors. The study concluded that optimal performance is achieved when the splitter blade length is 70% of the primary blade length and the circumferential position is 40% within the flow channel. Wang Guojie [20] conducted a comprehensive investigation into the impact of tip clearance shape on the aerodynamic performance of helium–xenon centrifugal compressors. The study revealed that an increase in tip clearance height negatively affects the efficiency of the compressor, particularly in proximity to surge and design conditions. Additionally, altering the radial clearance alone was observed to expand the range of blockage flow. Liu Xuezheng [21] designed the impeller and diffuser for a helium–xenon centrifugal compressor, utilizing a 40 g/mol helium–xenon mixture as the working fluid. The study examined the effects of the impeller relative speed ratio and diffuser wall expansion angle on the performance of the compressor stage and the characteristics of the internal flow field. Yuan Z [22] discussed the independent or comprehensive effects of the Euler number (Eu), Reynolds number (Re), and inflow velocity on the flow similarity based on flat plate flow. He investigated the impact of various working fluids, namely, helium–xenon mixtures, helium, argon, and air, on the performance metrics of a radial turbine and found that the flow rates of these fluids are similar under the same conditions and the flow loss is only a function of the fluid properties.
Current research on helium–xenon centrifugal compressors predominantly focuses on mixtures with a 40 g/mol molar weight. This emphasis is primarily attributed to influential studies conducted by NASA in the 1960s, which identified that a space-closed Brayton cycle utilizing a helium–xenon mixture of 40 g/mol achieves the highest power density. With advances in technology, the rim speed of impellers has steadily improved, highlighting the advantages of using a helium–xenon mixture with a molar weight of 15 g/mol. This study employs a helium–xenon gas mixture with a 15 g/mol molar mass as the working medium. In the context of the 40.8 kWe closed Brayton cycle system (BRU) developed by Gallo [23], prior research on the 15 g/mol helium–xenon centrifugal compressor primarily emphasizes its impact on the closed Brayton cycle power system, with a limited investigation into the compressor’s flow characteristics and constrained operating margin of the original helium–xenon compressor design. This study employs the inlet parameters established by Gallo [23] to undertake a redesign of the helium–xenon compressor, improving its performance while enabling a comprehensive analysis of its internal flow dynamics.

2. Design of Helium–Xenon Mixed Centrifugal Compressor

2.1. Physical Properties of Helium–Xenon Mixture

The physical properties of the helium–xenon mixture used in this paper are based on Tournier’s semi-empirical formula [24], and a calculation program for the physical properties of the helium–xenon mixture working medium with a pressure range of 0.1–20 MPa and a temperature below 1500 K was developed [25]. The measured physical data were loaded into Compal Version 8.9.14.0 software (Concepts ETI, Inc, White River Junction, VT, USA) using NIST Standard Reference Database 23, Wersion 9.1 software (The National Institute of Standards and Technology (NIST), Gaithersburg, MD, USA). Table 1 shows the principal physical properties of the working medium at a temperature of 400 K and a pressure of 701.9 kPa. Helium has better thermal conductivity than air, allowing power systems to use fewer heat exchangers. However, because of its higher specific heat ratio and specific heat at constant pressure, helium causes more compression issues. At the same pressure ratio, the compression work required for helium is approximately five times that of air, significantly increasing the size and weight of helium compressors. To address the challenge of helium’s compressibility, researchers have discovered that incorporating xenon into pure helium can consider the thermal conductivity and compressibility of the circulating working fluid. Compared to helium, the helium–xenon mixture with a molar weight of 15 g/mol exhibits thermal conductivity that is 4.46 times greater than that of air. Yet, its specific heat at constant pressure is only 1.36 times that of air. While inheriting helium’s excellent heat-transfer capacity, it also effectively solves the problem of pure helium being challenging to compress. Consequently, the 15 g/mol helium–xenon mixture was selected as the working fluid for the designed centrifugal compressor.

2.2. Preliminary Design Model of Centrifugal Compressor

The one-dimensional design of the centrifugal compressor and the performance predictions for both design and off-design operating points were conducted using the Compal Version 8.9.14.0 software developed by Concepts NREC Corporation [26]. The impeller flow is modeled according to the two-zone modeling approach proposed by Japikse [26]. This two-zone theory is predicated on two fundamental assumptions: (a) it is assumed that the flow within the primary zone reaches the impeller outlet plane via an isentropic process, with all losses incurred within the impeller runner being attributed to the secondary zone; (b) at the outlet of the impeller, a static pressure equilibrium is established between the primary and secondary zones.
Design experience with centrifugal compressors suggests that the impeller requires a lower blade tip tangential velocity for improved operational efficiency. For centrifugal compressors with axial inlets, there are
W 1 t = ( U 1 t 2 + C m 1 2 ) ( 1 / 2 ) = ( 2 π R 1 t N 60 ) 2 + ( Q π ( R 1 t 2 R 1 h 2 ) ) 2
U1t is the tip circumferential velocity of the impeller inlet, Cm1 is the meridional velocity of the impeller inlet, R1t is the rim radius of the impeller inlet, R1h is the hub radius of the impeller inlet, N is the rotational speed, and Q is the volume flow. When the derivative of R1t in Equation (1) is zero, the tip tangential velocity W1t of the designed centrifugal compressor is the smallest. When the hub ratio R1h/R1t is a fixed value, w1t is the smallest, and R1t is
R 1 t = ( 30 2 Q π 2 N ( 1 ( R 1 h / R 1 t ) ) ) 1 3
The impeller outlet radius (R2) is calculated according to the specified design pressure ratio. The impeller outlet width (B2) is calculated by matching the outlet vortex coefficient (LAM2).
L A M 2 = C t 2 C m 2
Ct2 is the tangential velocity of the impeller outlet, and Cm2 is the meridian velocity of the impeller outlet. The slip coefficient is related to the actual work performed by the impeller, which affects the energy head of the impeller by affecting the actual C2u. C2u is the component speed of the absolute speed of the impeller outlet in the circumferential speed direction. Equation (4) [27] is the slip coefficient model adopted in NREC Compal®, U2 is the circumferential velocity of the impeller outlet, B2 is the height of the impeller outlet, and D2 is the diameter of the impeller outlet.
σ = 1 - 1.25 ( C m 2 U 2 ) π 2 B 2 D 2
Figure 1 is a schematic diagram of the meridian structure of the completed one-dimensional helium–xenon compressor, and the inlet conditions adopted are shown in Table 2. The fluid working medium enters the compressor through position 1. The compressor impeller between position 1 and position 2 increases the pressure of the working fluid and makes it flow to the volute through the vaneless diffuser between position 2 and position 3.

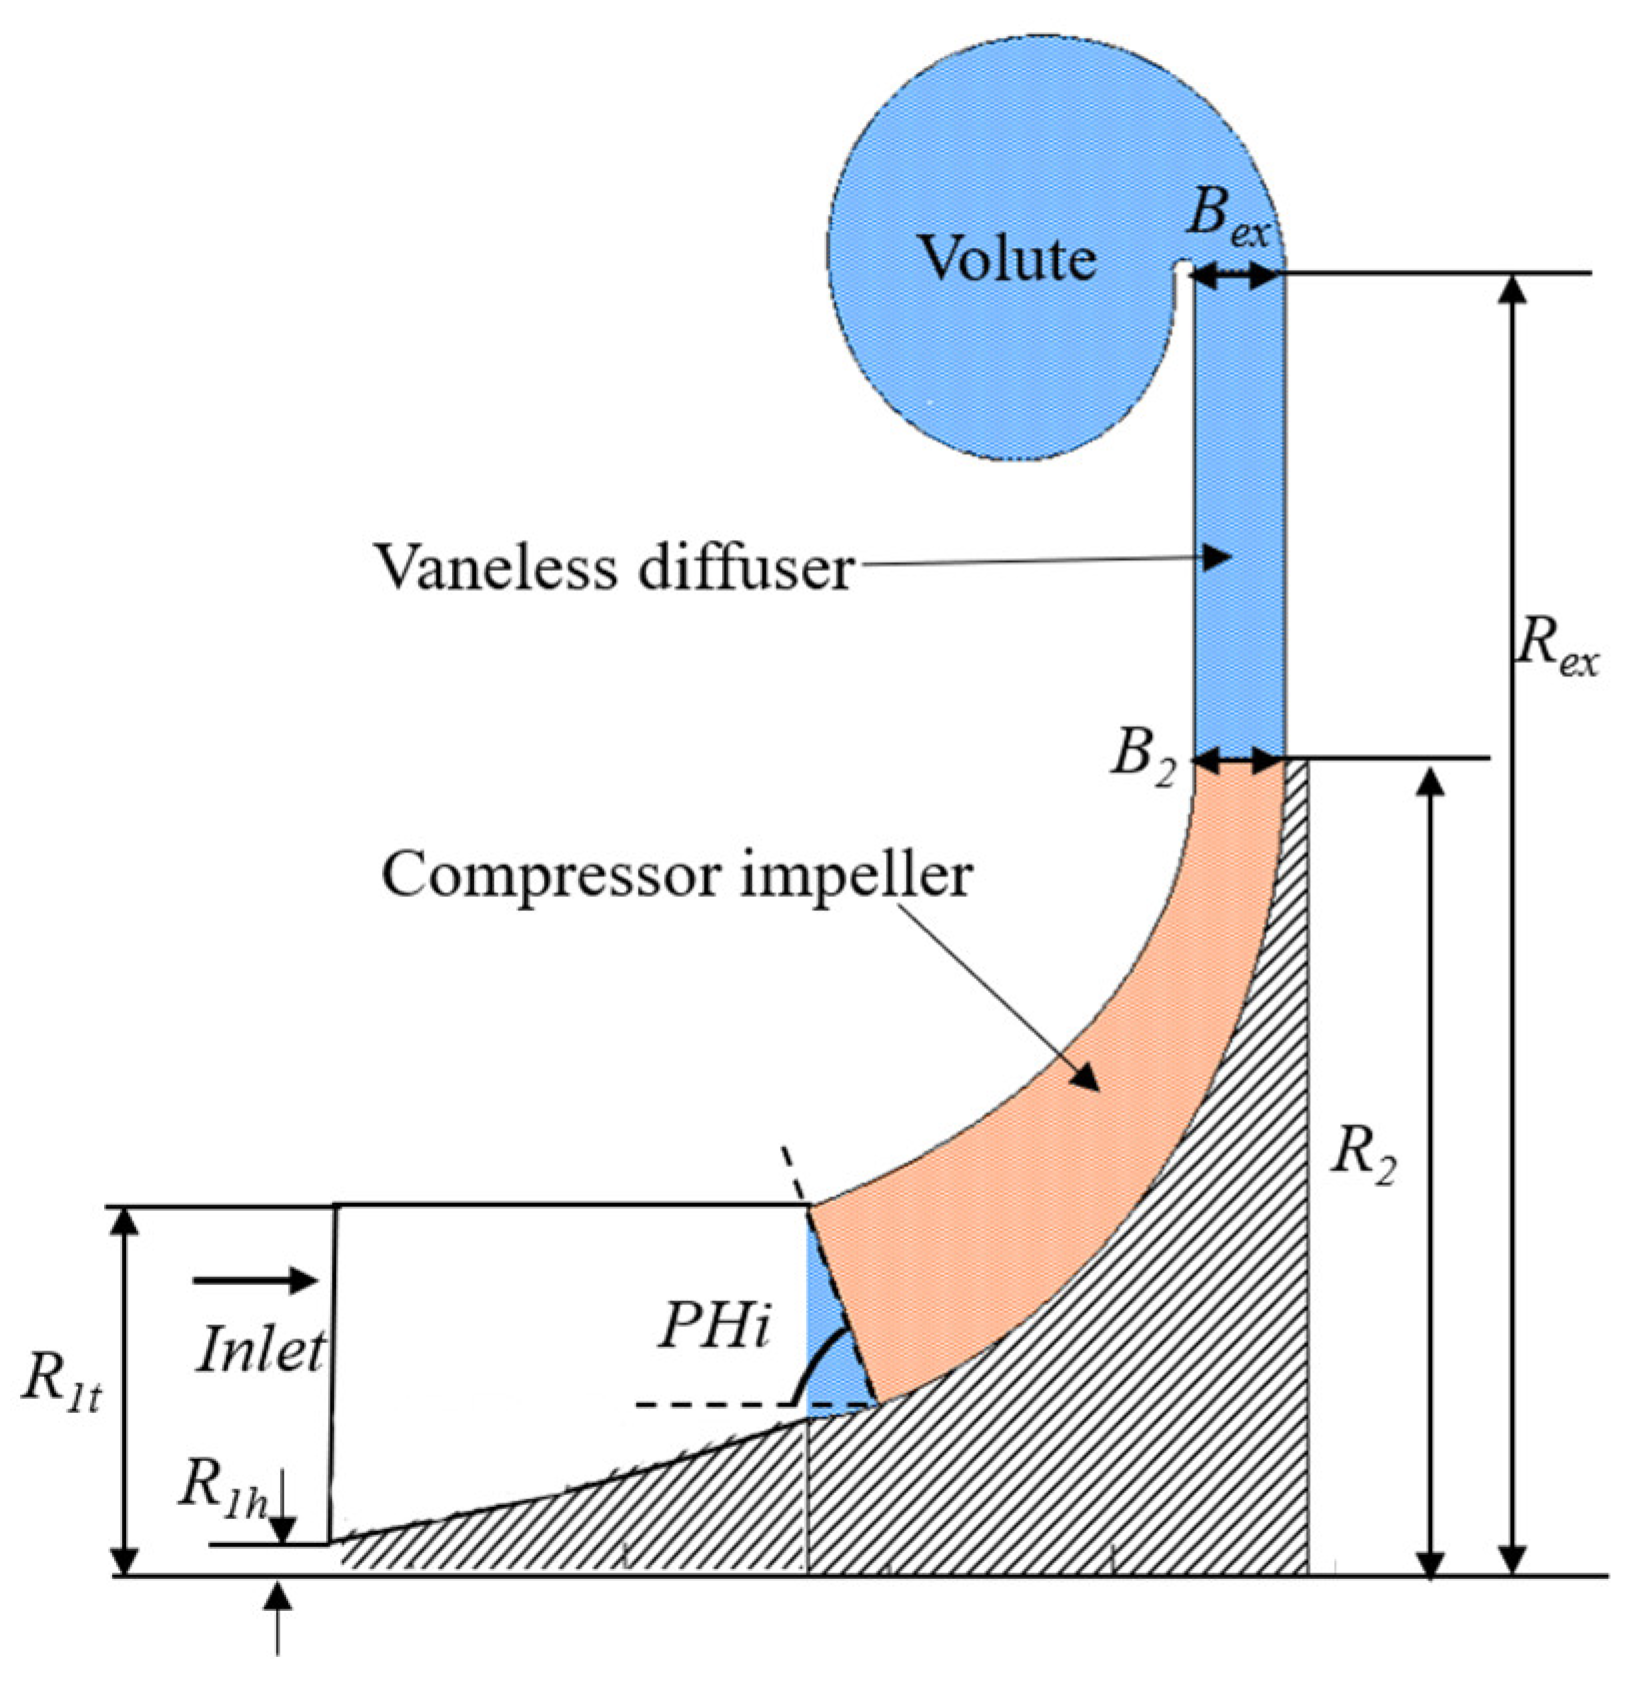
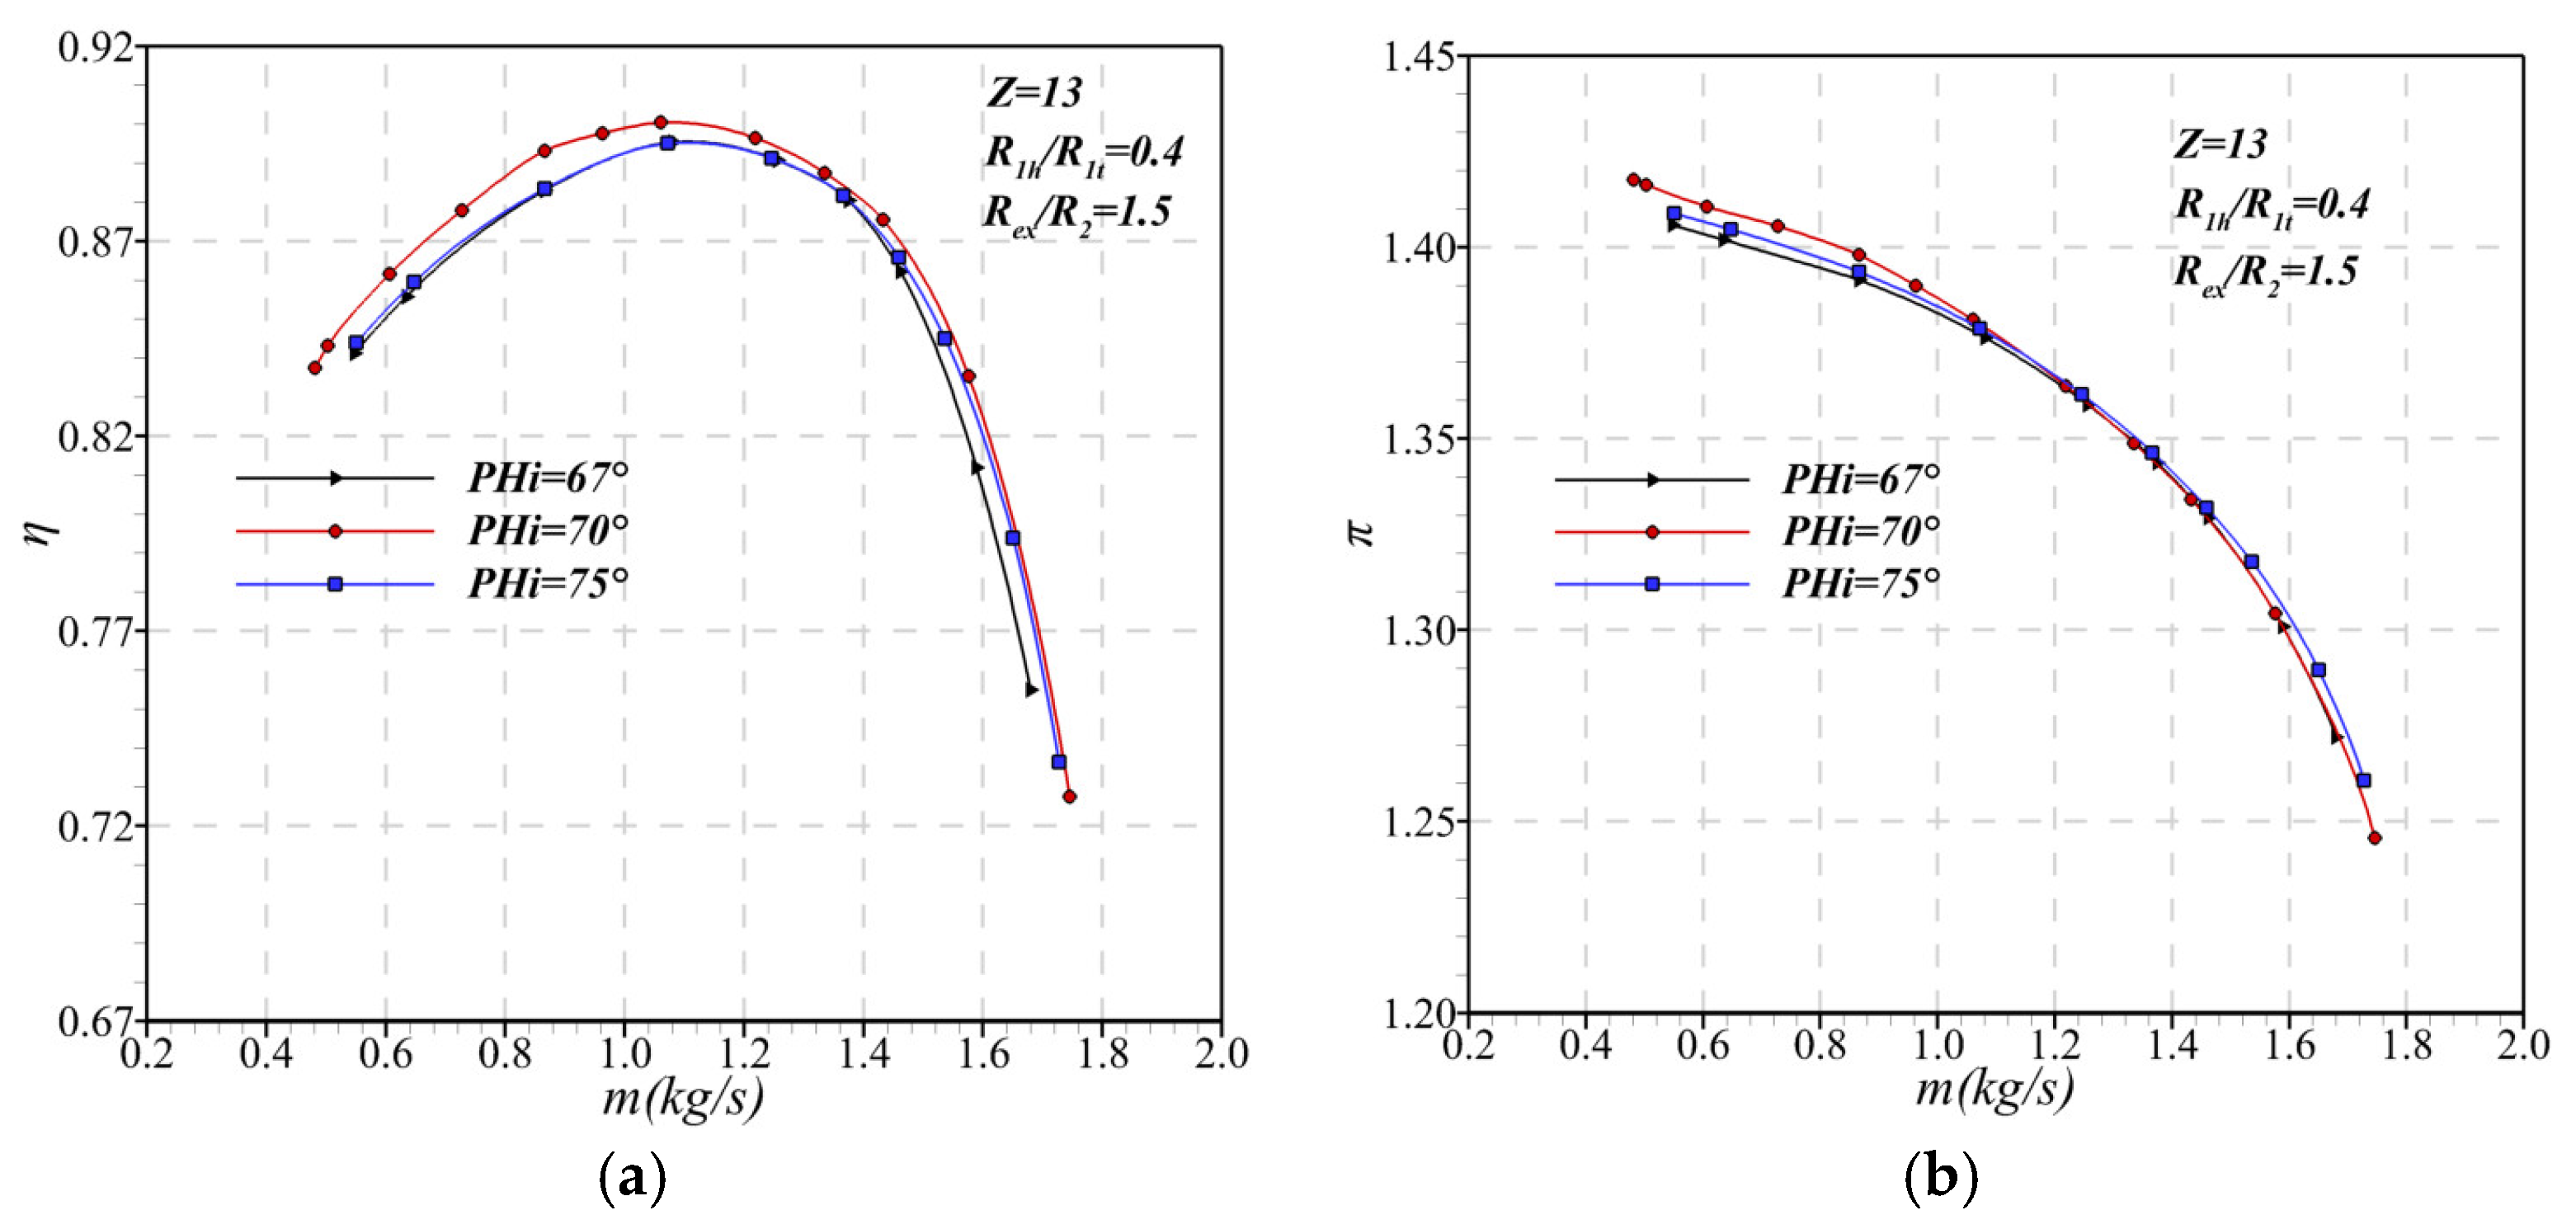
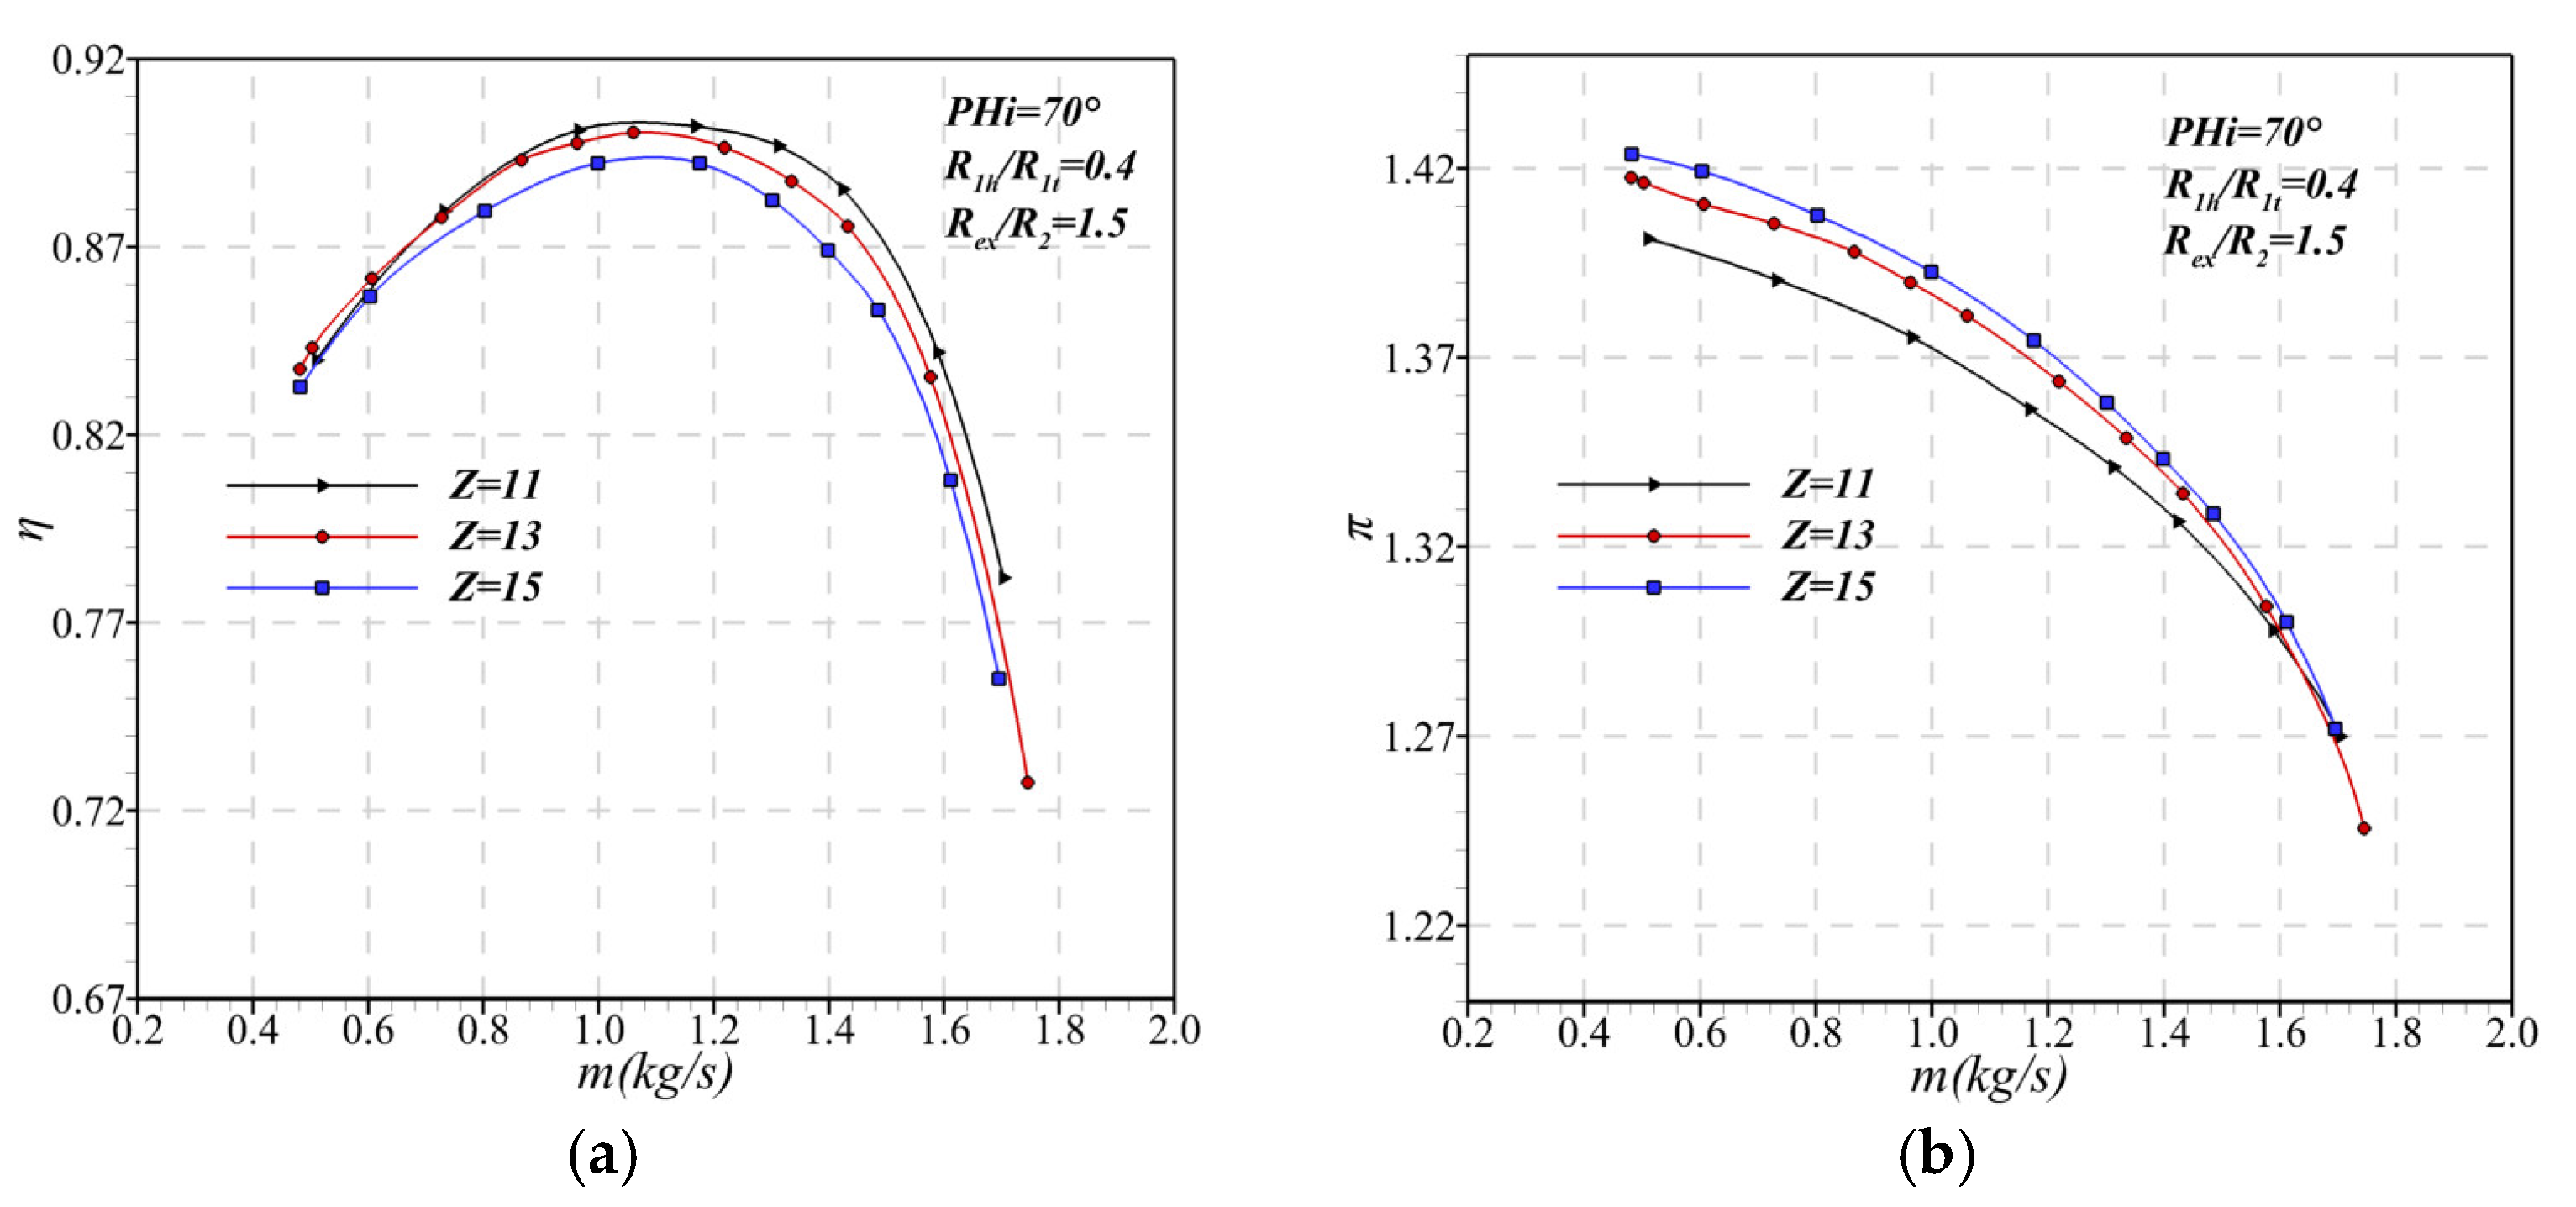
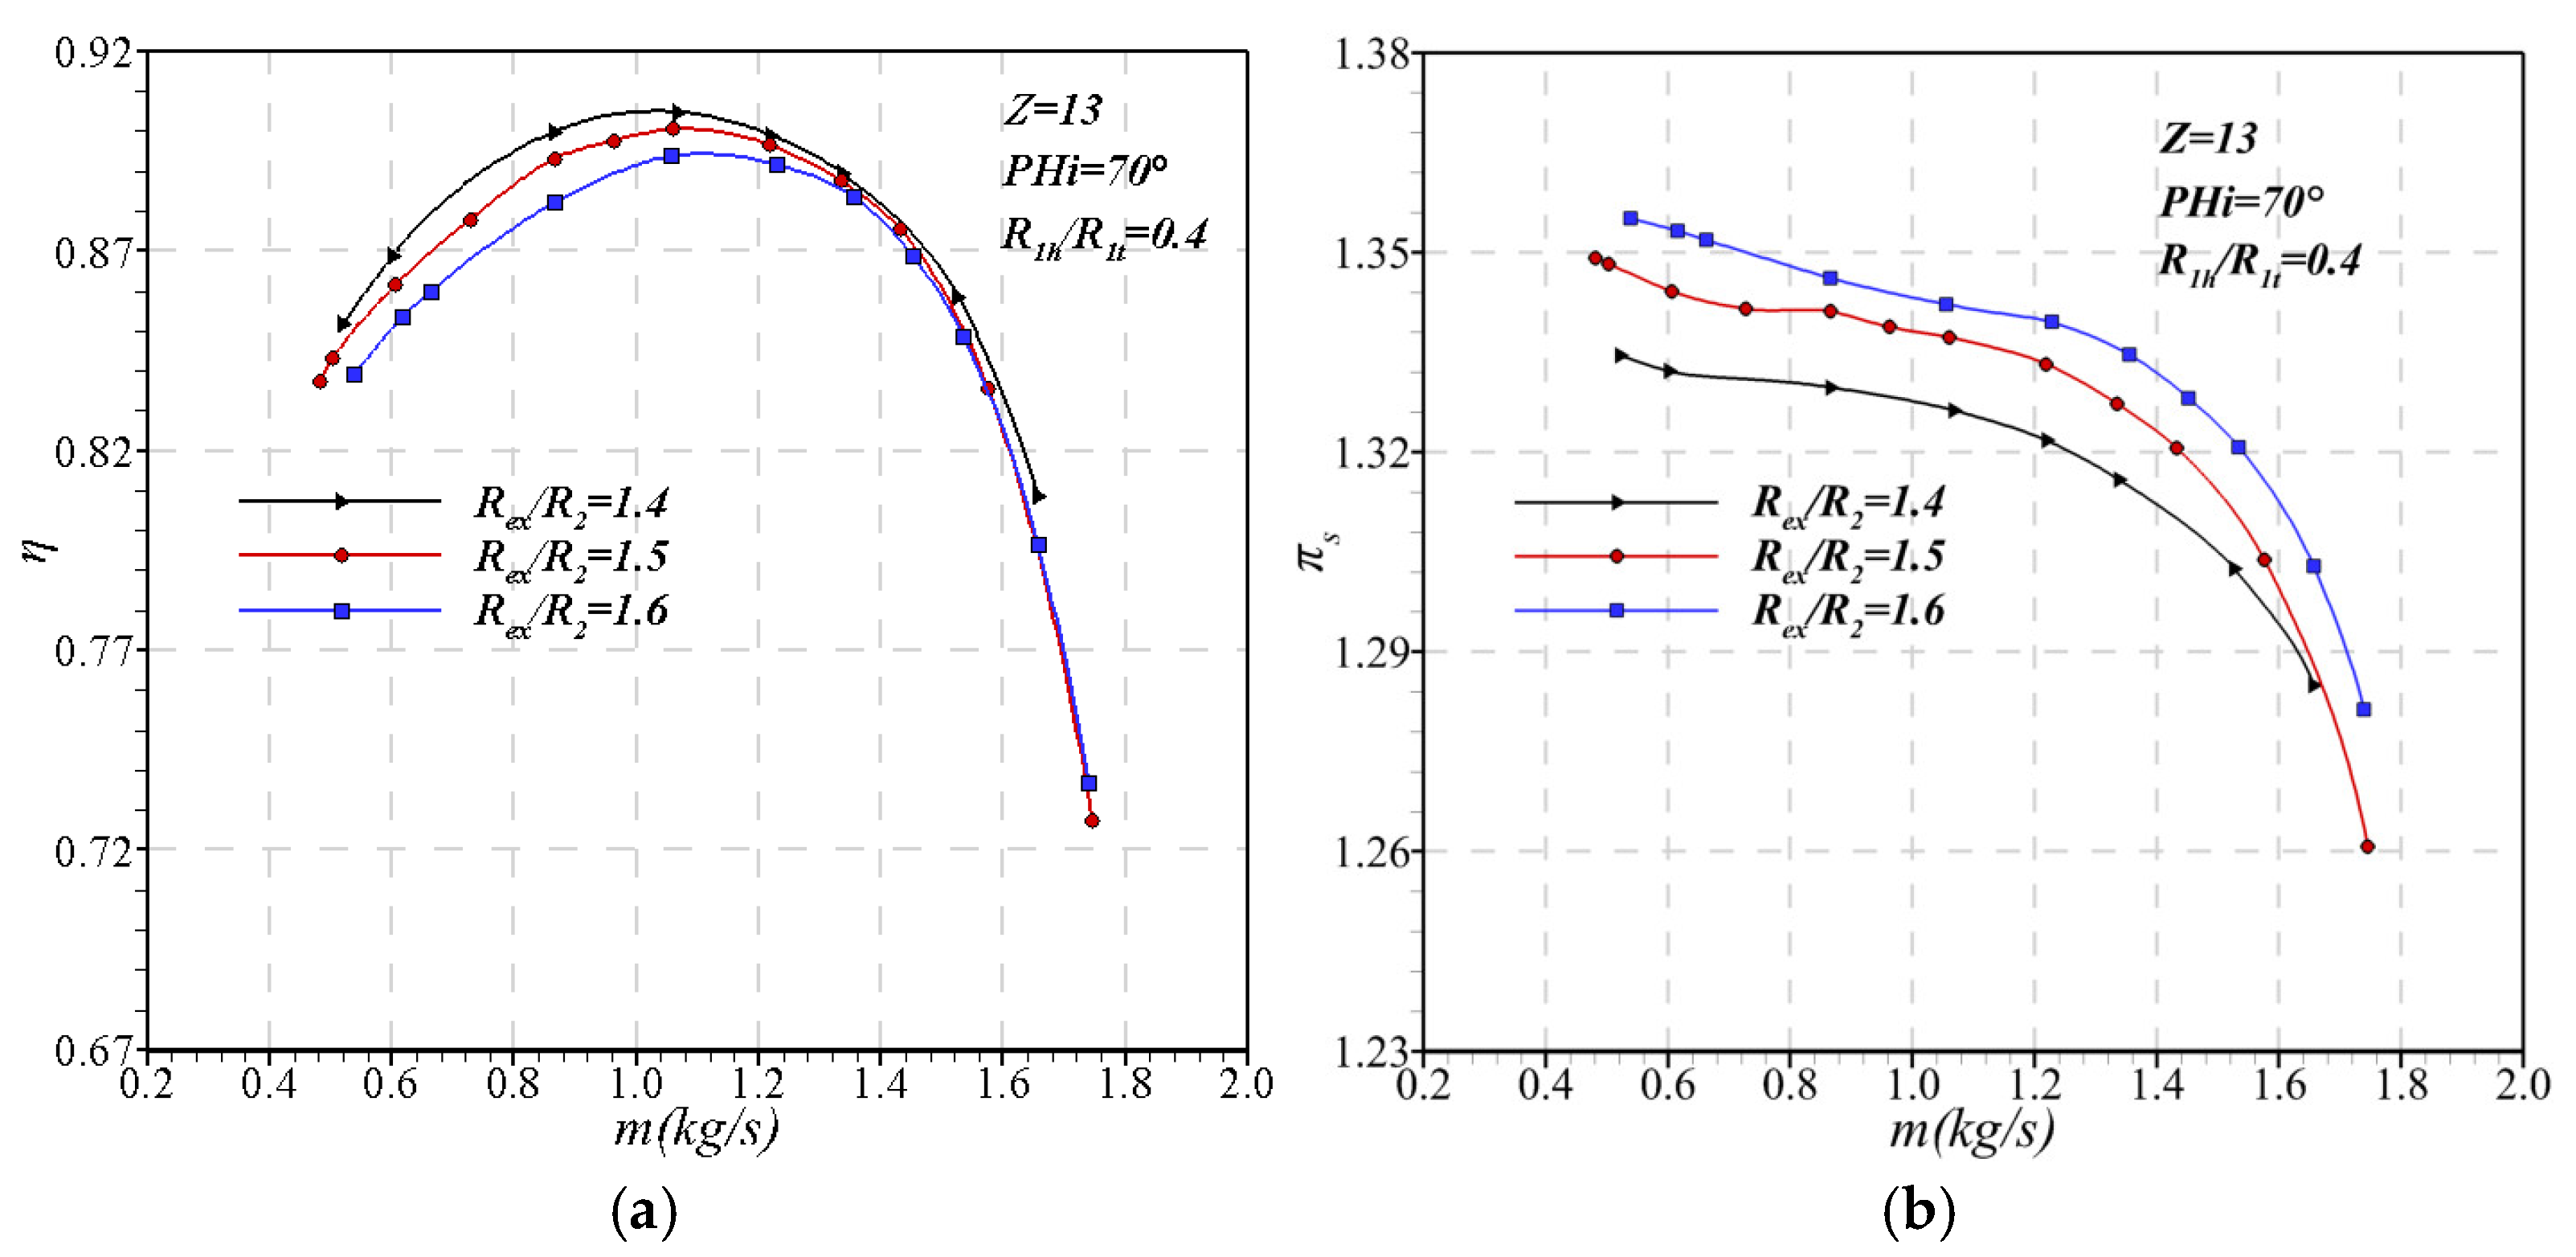
2.3. Analysis of Some Sensitive Parameters of the Compressor
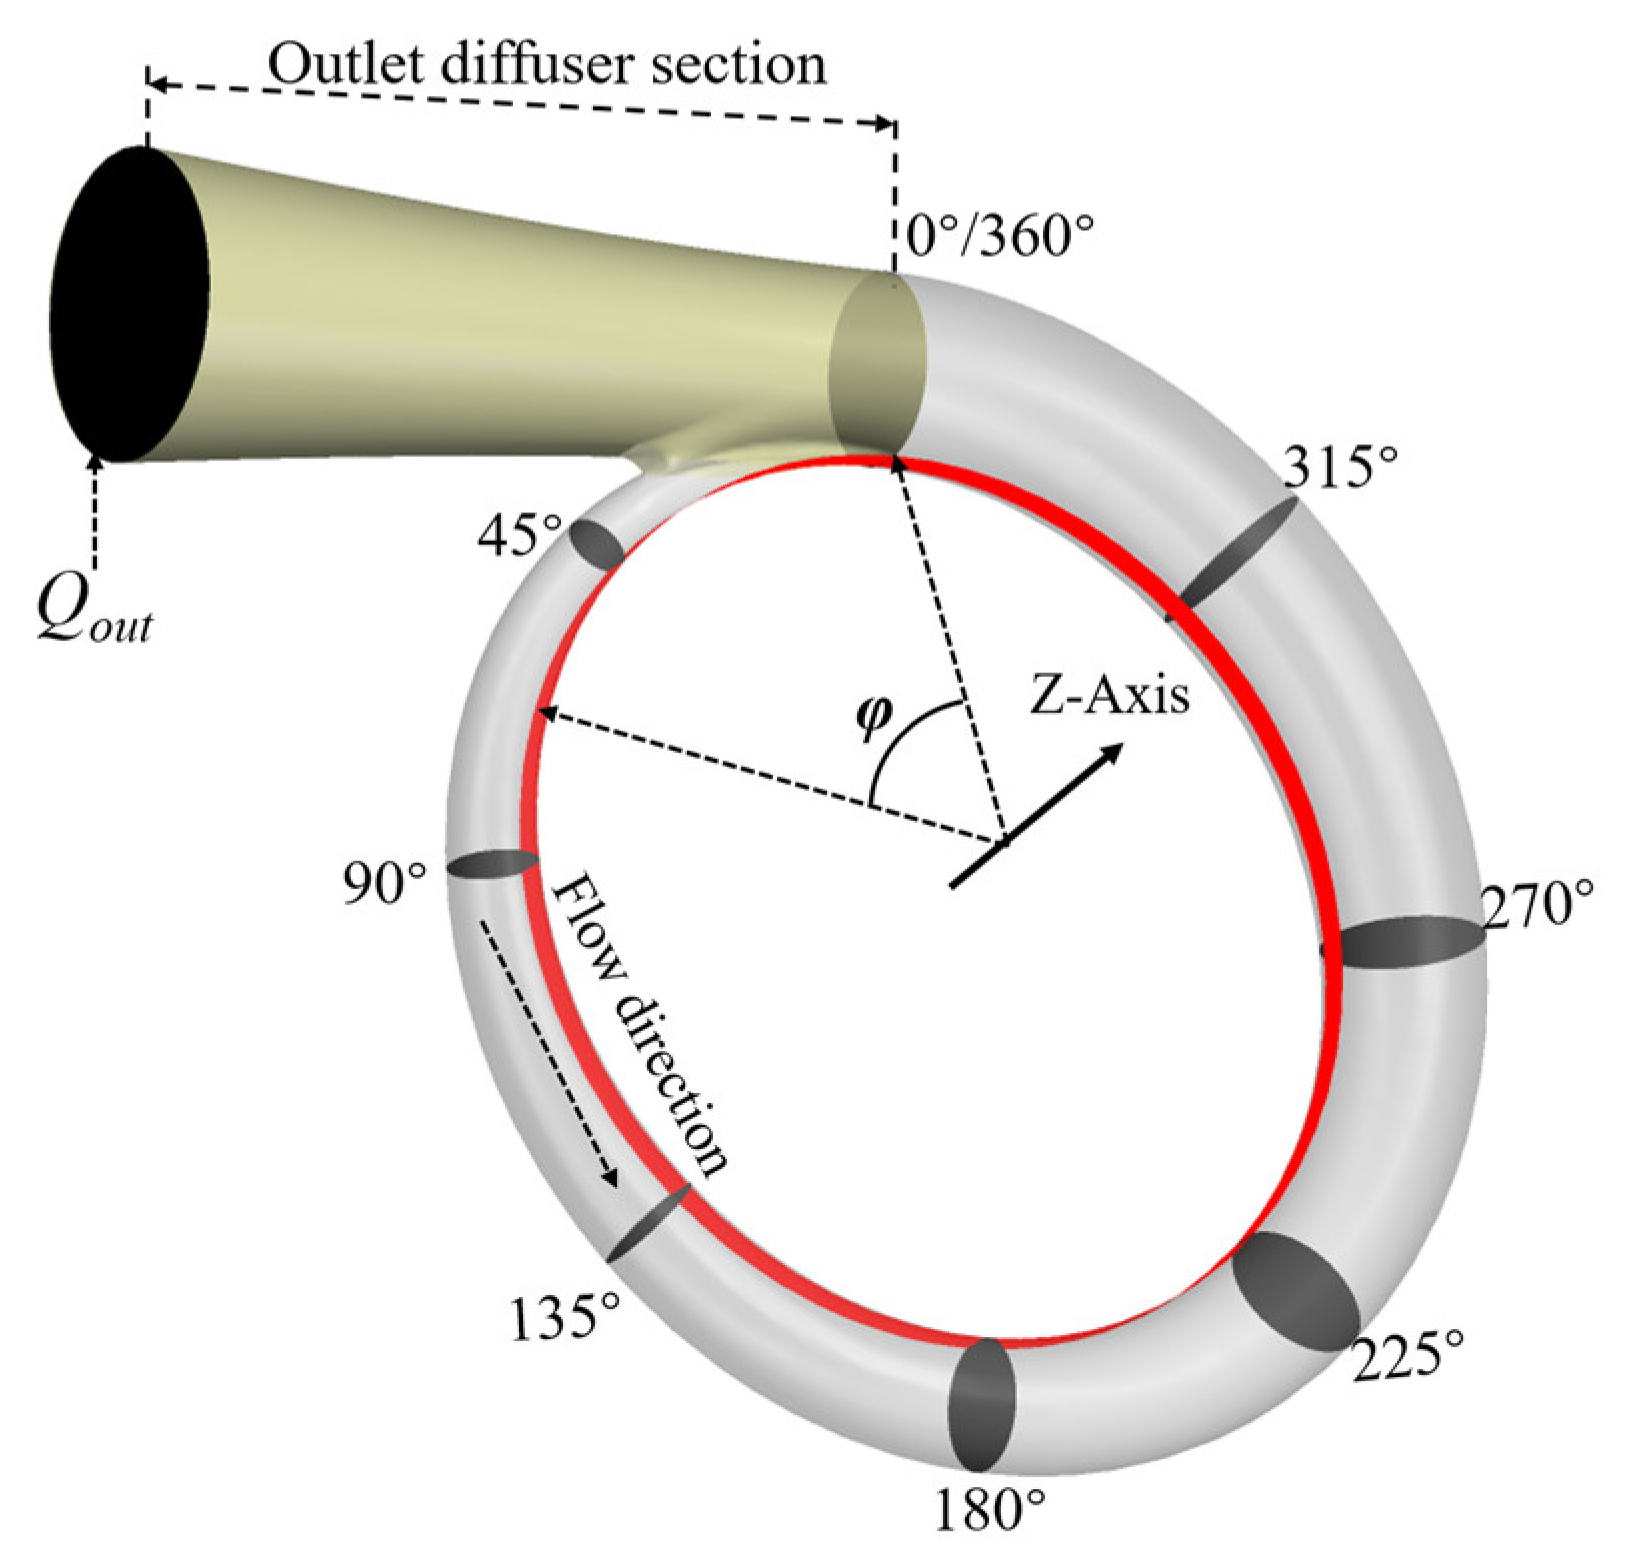
According to the centrifugal compressor design theory [28] and one-dimensional design calculation, the main design parameters of the compressor are shown in Table 3. The generation of the model also needs to import the one-dimensional data of the compressor designed by Compal Version 8.9.14.0 into NREC AxCent64 Fine/Agile Version 8.9.12.0 (AxCent is a registered trademark of Concepts ETI, Inc, White River Junction, VT, USA) to adjust the blade geometry and three-dimensional passage. After adjustment of the blade and impeller runner within AxCent 64 Fine/Agile Version 8.9.12.0, discrepancies from the one-dimensional predicted data are expected. In this study, ANSYS numerical simulation is used to analyze the sensitivity of some parameters selected in three dimensions and analyze the results. The sensitivity of some parameters investigated include the ratio of the impeller hub to rim radius, the inclination angles of the impeller inlet and outlet, the number of impeller blades, and the relative diameter of the diffuser.
Drawing on design experience, the inlet impeller’s hub ratio (R1h/R1t) was selected as 0.35, 0.4, and 0.45, respectively, while keeping other variables constant. The variables include Z (the number of blades), PHi (the inlet anterior tilt angle of the impeller), Rex (the outlet diameter of the impeller), and R2 (the outlet diameter of the diffuser), as illustrated in the performance characteristic curve in Figure 2. When R1h/R1t = 0.4, both high efficiency and pressure ratio are generally sustained across the operational range.
The contraction of the inlet airflow channel causes the airflow to change the direction of the fluid velocity at the position of the inlet chamber near the wall of the shaft body. To reduce losses, the impeller’s anterior tilt angle is adjusted so that the direction of fluid velocity entering the impeller is roughly perpendicular to the blade’s leading edge. Three impeller inlet anterior tilt angles (PHi) are selected: 67°, 70°, and 75°. The characteristic curve of the impeller is depicted in Figure 3, demonstrating that an anterior tilt angle of (PHi = 70°) achieves the highest isentropic efficiency within the calculated flow range. The total pressure ratio (PHi = 70°) is also the greatest near the design flow rate.
The number of impeller blades significantly impacts impeller performance. An insufficient blade count results in widened blade passages, and the channel expansion angle becomes more extensive, elevating the boundary layer thickness, fluid separation, and flow losses. In addition, fewer blades lower the impeller’s sliding coefficient and, as a result, its theoretical energy head. Too many blades will increase the slip coefficient; however, it will also increase the airflow resistance between blades and the blockage of flow channels, reducing efficiency and circulation capacity. By referencing the blade count of the prototype compressor, three different blade numbers (11, 13, and 15) are assessed. The characteristic curves of impellers with varying blade counts are depicted in Figure 4. Notably, 11 blades yield high efficiency but low work capacity, while 13 maintain high efficiency and pressure ratios. Considering the compressor’s operational capacity and efficiency, the compressor with 13 impeller blades performs better.
As the vaneless diffuser’s length has an essential role in determining diffuser ability and compressor efficiency, an analysis of the diffuser’s relative diameter is vital. Also, the values 1.4, 1.5, and 1.6 of Rex/R2 are studied. The analysis depicted in Figure 5 reveals a correlation between increased relative diameter and heightened losses, resulting in reduced compressor efficiency. To balance the high efficiency of the compressor and the pressurization capacity of the diffuser, a relative diameter of Rex/R2 = 1.5 is recommended to obtain the best performance.
Figure 6 shows the velocity triangle parameter for the impeller intake and exit in the middle of the blade, where β1 = 39.67°, β2 = 47.21°, and α2 = 73.23°.

2.4. Volute Design

The volute was designed using commercial software CFturbo2020.1.0 (CFturbo, Inc., Brooklyn, NY, USA), and it can be considered that the airflow in the volute is uniform along the circumference. Figure 7 displays a three-dimensional model of the volute, which divides into fluid-collecting and outlet-diffusion sections. As seen in this image, the end of the fluid-collecting section coincides with the beginning of the outlet-diffusion section, with the corresponding surface defined as a 0°/360° section, and the outlet-diffusion section is perpendicular to the section. φ is the included angle between any radial cross-section and 0° cross-section in the gas-collection section, and the flow rate of different radial cross-sections is different. Starting at φ = 0°, the flow of a radial cross-section with any φ value can be represented as
Q φ = Q o u t φ 360 º
Qout is the volume flow of the volute outlet. Moreover, the gas flow is typically incompressible due to the volute’s low gas velocity. The volute profile should allow gas to flow freely through the volute, keeping cur = const, where cu is the circumferential velocity and r is the radius. In cur = const,
c u r = c i n u r i n r
where rin is the volute inlet radius and cinu is the circumferential velocity component. The fluid flows counterclockwise through the volute.
After selecting the relevant compressor design parameters, Table 4 shows the designed helium–xenon compressor’s performance parameters and geometric parameters.

3. Numerical Methods
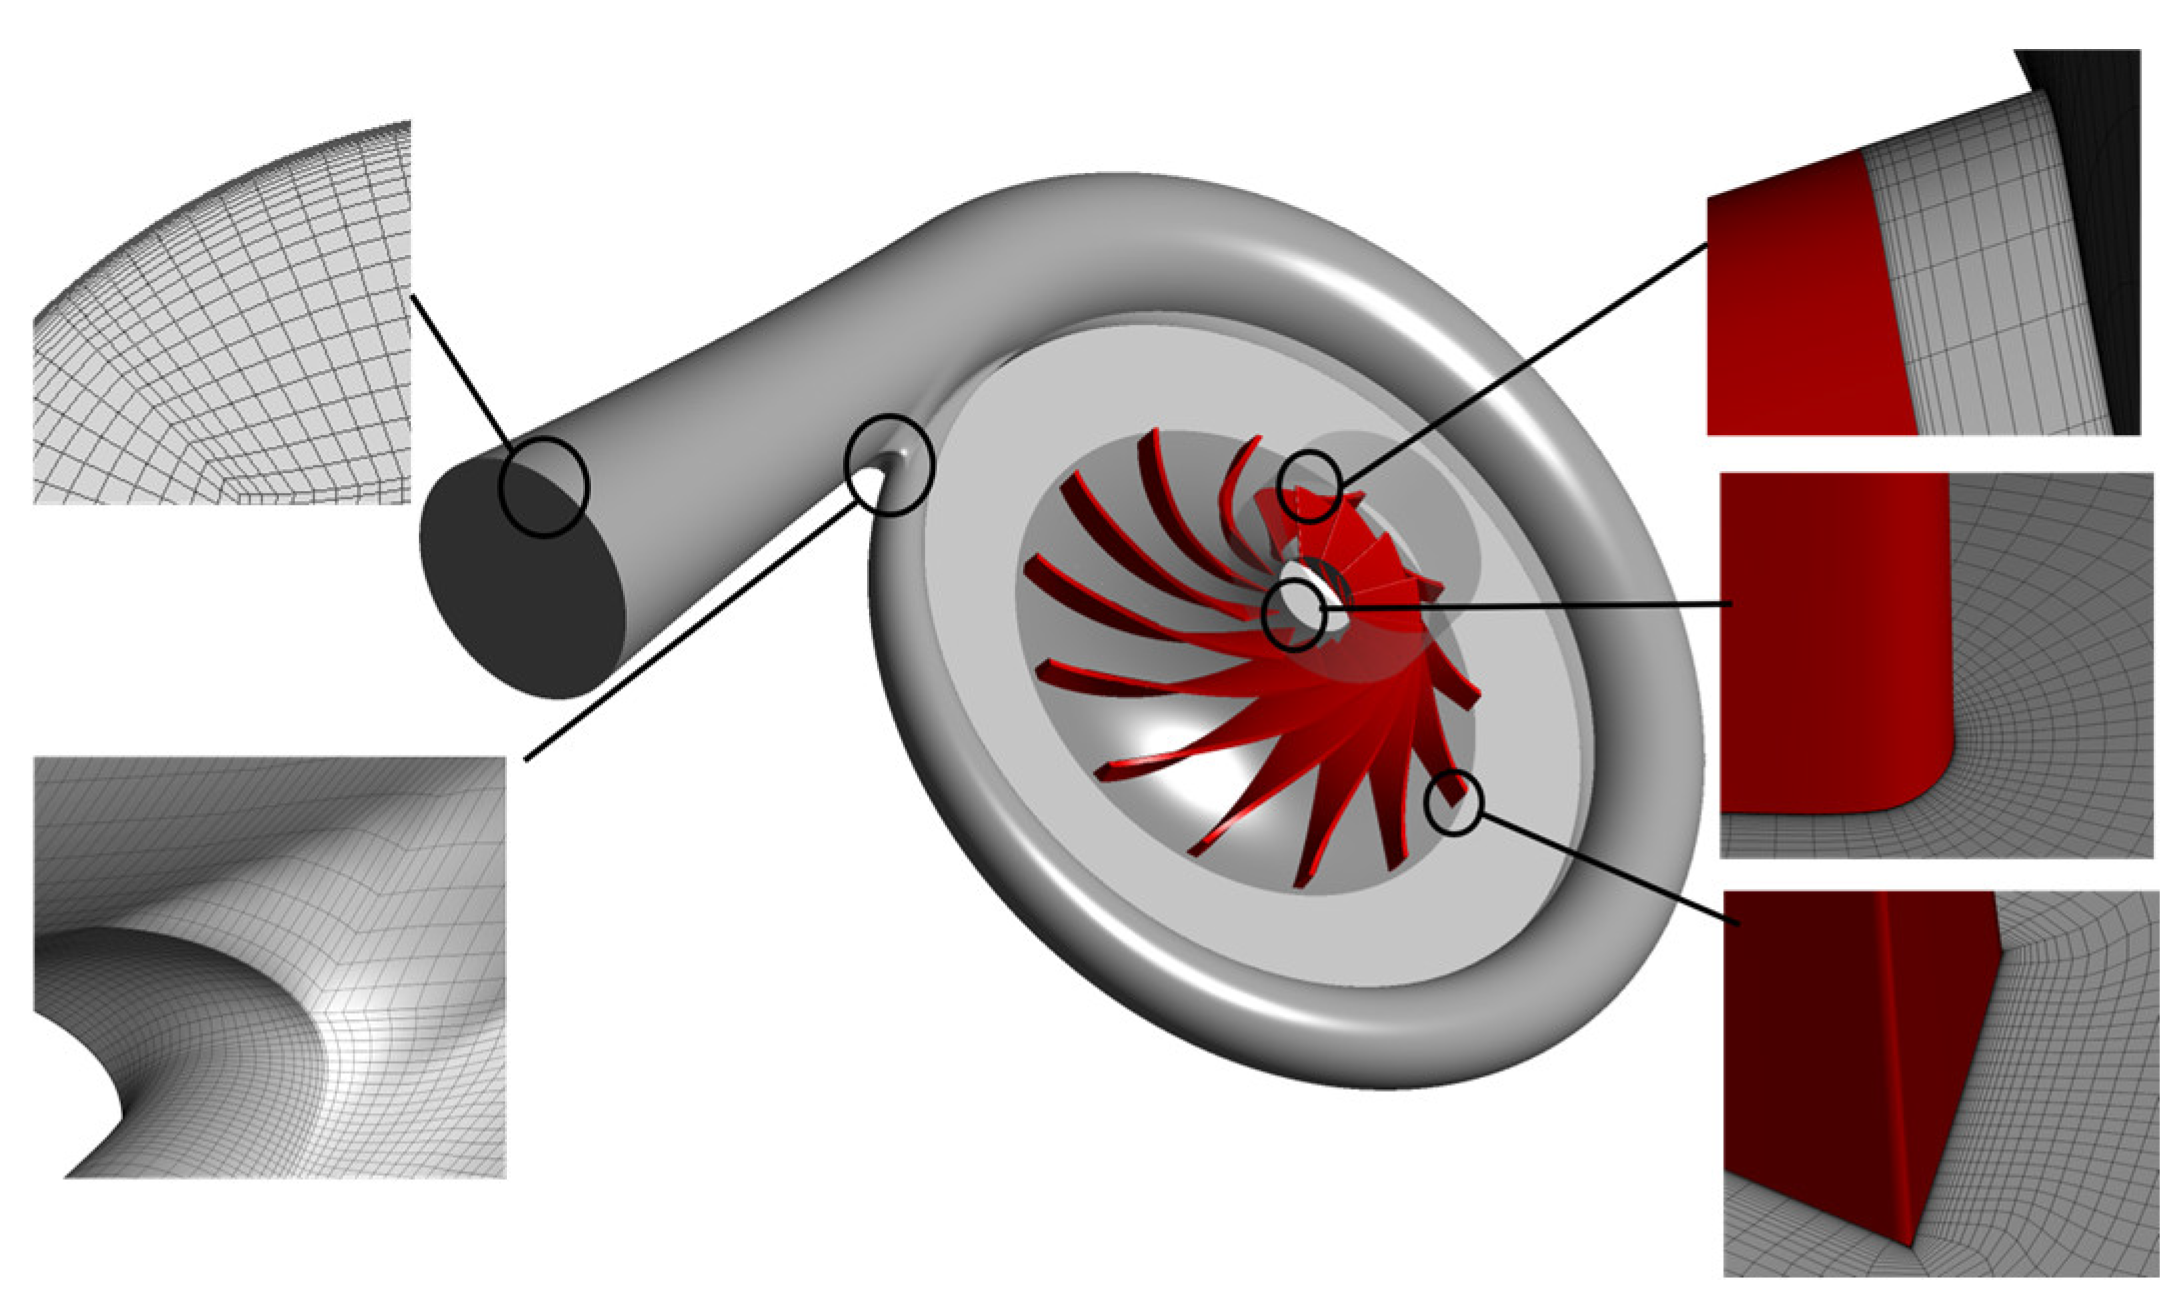
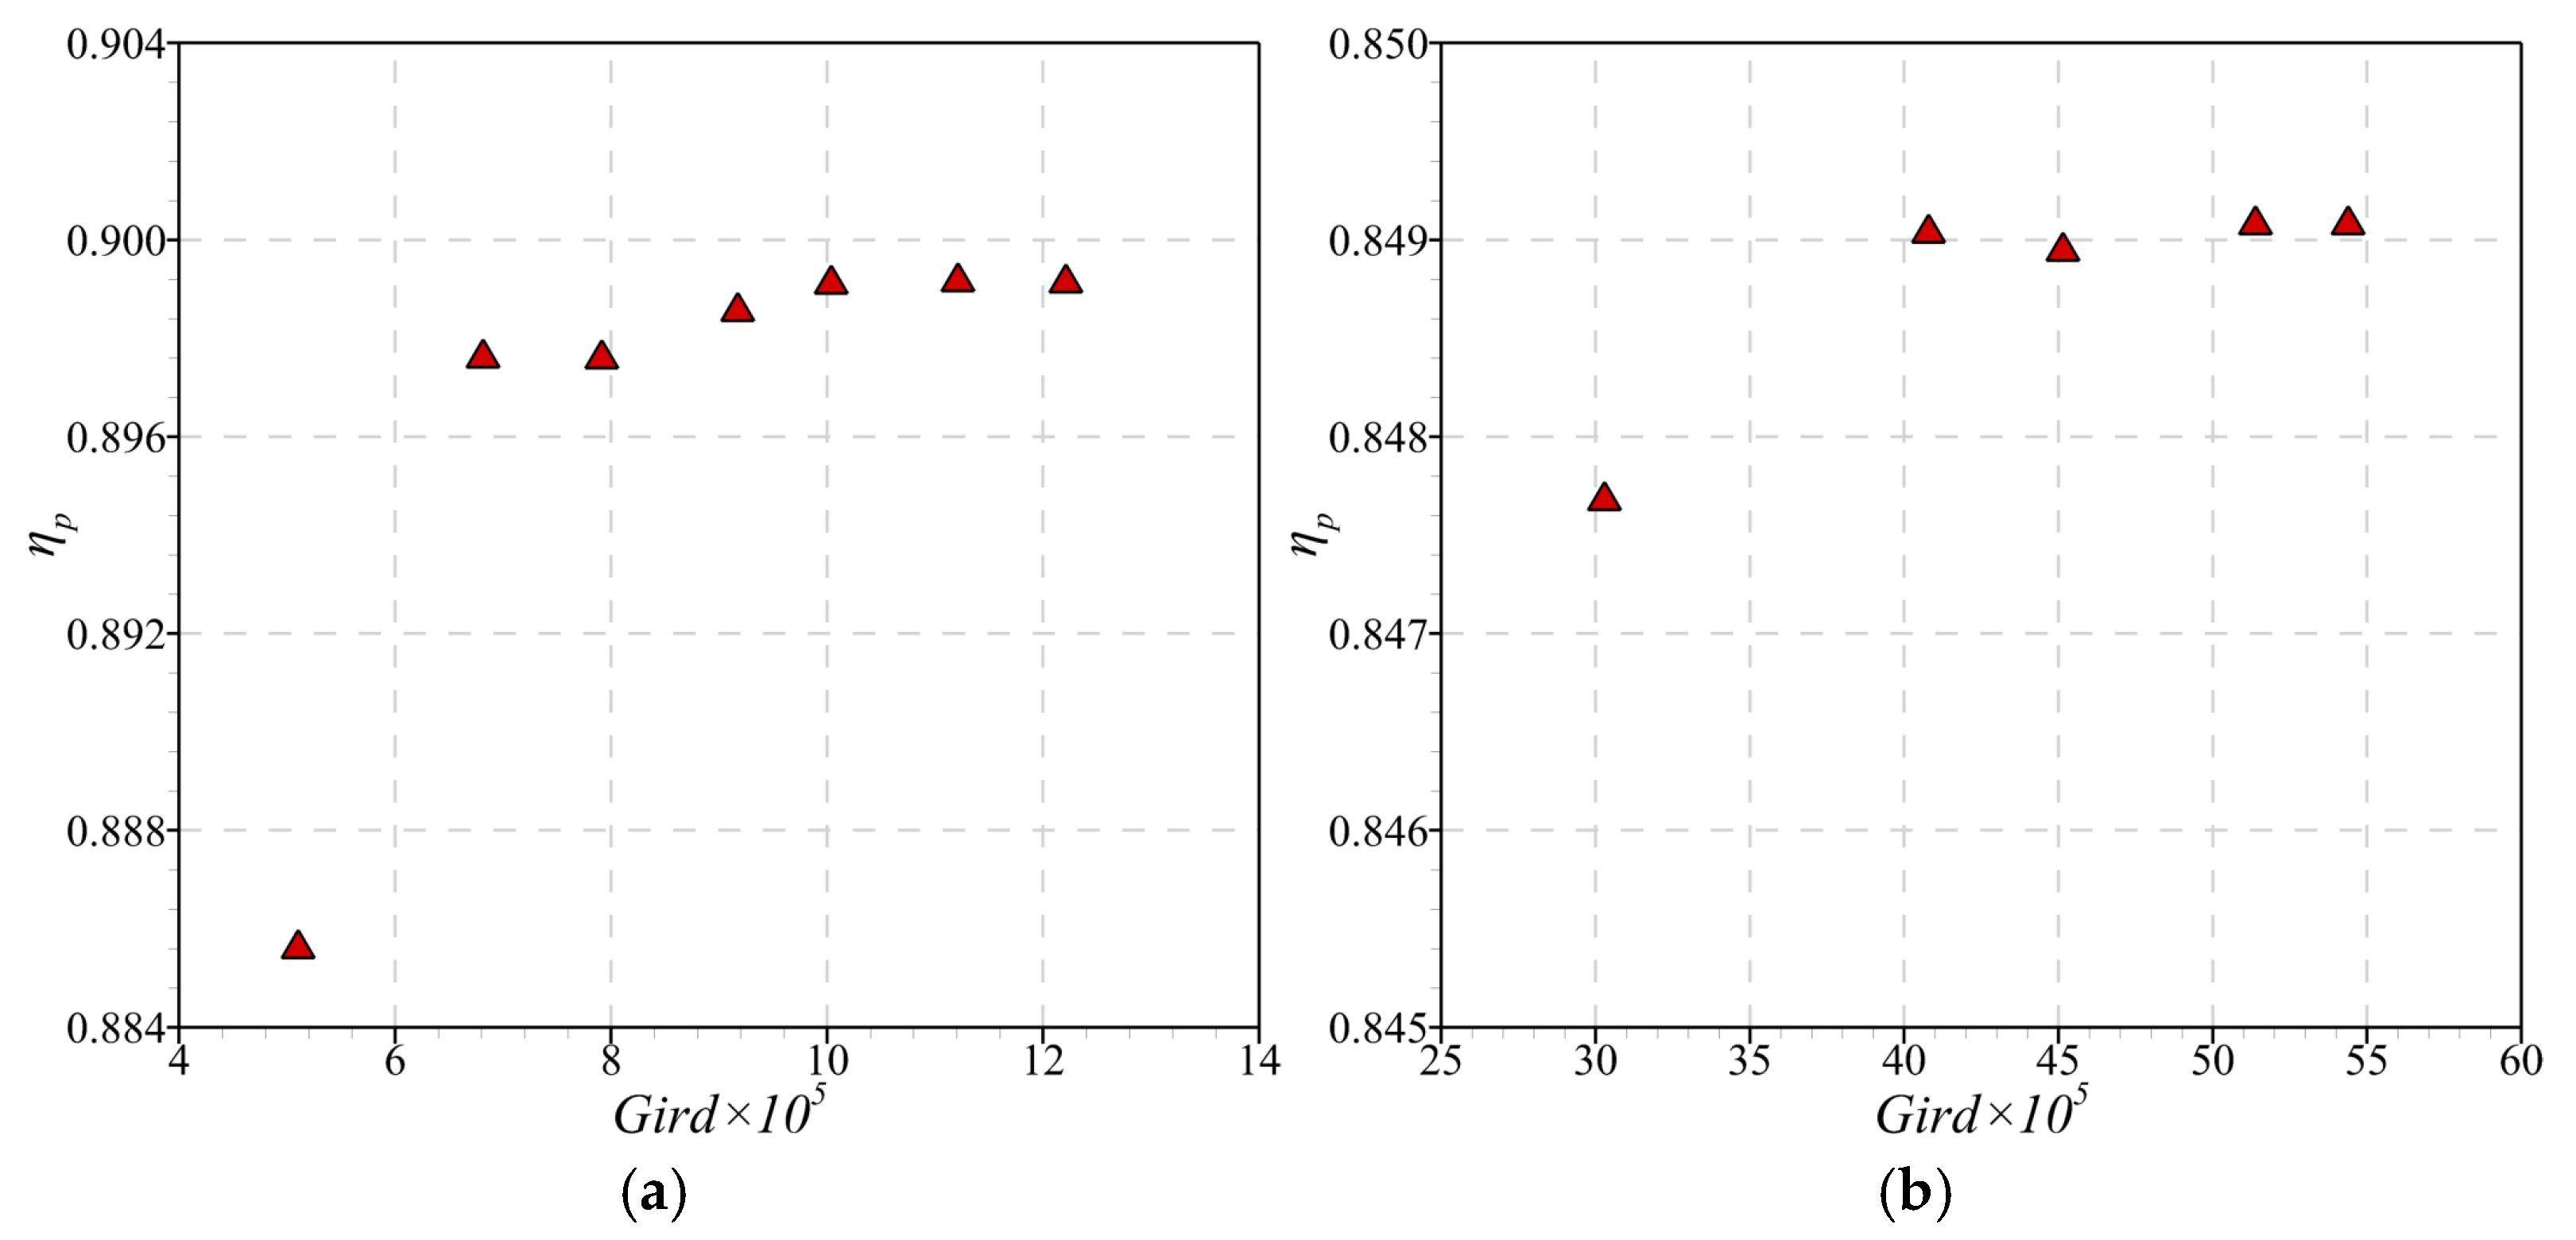
The working fluid of the centrifugal compressor suggested in this study is a binary helium–xenon mixture, characterized by its high cost and the substantial expense associated with experimental investigation. However, with the increased precision with which computational fluid dynamics (CFD) can simulate fluid flow, numerical simulations provide options for cost-effective research and rapid optimization of design parameters.

3.1. Grid Division

After the design of the centrifugal compressor is completed, the three-dimensional configuration and grid division of the centrifugal compressor can be obtained, as shown in Figure 8. The commercial program NUMECA IGG/AutoGrid5 Turbo 141 (NUMECA Ingenieurbüro GmbH & Co. KG, Nürnberg, Germany) is used to grid-distribute the impeller and diffuser in the centrifugal compressor. The internal flow structure of the centrifugal compressor is complicated, with significant bending and twisting of the impeller blades. Furthermore, blade tip clearance requires a higher grid count throughout the flow passage. The impeller blade grid uses the default OH division of AutoGrid5, while the impeller rim uses a butterfly grid. Mesh encryption encompasses the leading and trailing edges, tip clearance, rim and hub, and blade surface of the compressor blade. To fulfill the turbulence model requirements for the first mesh layer’s y+ value, the first mesh layer thickness is set to 0.01 mm with an expansion ratio of 1.2. In contrast, the volute model grid is constructed with ANSYS ICEM CFD 2020 R2 (ANSYS Inc., Canonsburg, PA, USA), requiring O-type topological division and volute wall node encryption. The first layer of the volute grid weighs 0.05 mm and has a grid expansion ratio of 1.2.
Grid independence must be verified before any numerical calculations to ensure computational correctness. The compressor’s polytropic efficiency is employed as a reference value to save computation time, and the independence of the single-channel impeller grid is proven. Grid independence was judged using grid counts of 500,000, 680,000, 790,000, 910,000, 1 million, 1.12 million, and 1.22 million, as shown in Figure 9a. When the grid count reached 1.12 million, the variation of compressor polytropic efficiency was less than 0.1%, indicating that 1.12 million grids are an adequate quantity for the impeller. In addition, it is necessary to verify the independence of the volute gird. When adding the impeller 1.12 million grid number, the grid counts analyzed were 3.02 million, 4.08 million, 4.52 million, 5.12 million, and 5.43 million. As shown in Figure 9b, once the grid count of the entire system reached 4.52 million, the polytropic efficiency exhibited negligible change with further increases in grid count. Therefore, the centrifugal compressor’s grid count, including the volute, was determined to be 4.52 million.

3.2. Numerical Simulation and Boundary Conditions

ANSYS CFX 2020 R2 software was used to solve the three-dimensional stable Reynolds-averaged Navier–Stokes (RANS) equations using the k-epsilon turbulence model. The k-epsilon model, widely used in many computational fluid dynamics (CFD) algorithms, is considered an industry standard due to its stability and predictive ability. It provides a reliable and accurate solution for universal simulations.
The inlet’s total pressure and total temperature were set to 701.9 kPa and 400 K, respectively, as the boundary conditions. Static pressure defined the outlet boundary condition, while changes to the static pressure value controlled the outlet flow. At the inlet, the turbulence intensity was adjusted to 5%. Hubs, casing walls, and blade surfaces were all modeled as adiabatic and non-slip. Adjacent blades formed a periodic interface, and the revolving and stationary domain interfaces were treated using the mixing-plane method. Convergence criteria required that the flow rate, pressure ratio, and polytropic efficiency curves stabilize; the discrepancy between inlet and outlet flow rates be less than 0.5%; and residuals converge to below 1 × 10⁻⁵. In this study, the centrifugal compressor uses a single channel to calculate the flow from the inlet section to the diffuser.

4. Results and Analysis

A centrifugal compressor is divided into a rotating impeller and a volute of fluid collection. The internal flow fields of the compressor impeller without a volute and the whole machine with a volute are analyzed, respectively, and the adaptability between the impeller and the volute can be judged. Comparing the compressor characteristic lines in Figure 10 and Figure 11, the compressor performance has no deviation at the design speed, which indicates that the designed volute and impeller have good adaptability. Figure 11 shows the characteristic curves of the compressor at different rotational speeds (90% N, 100% N, 110% N) under the system operating conditions. It can be seen that the compressor has a wide stable working range at different rotational speeds, and the highest variable efficiency is maintained at around 85%. However, with the decrease in rotating speed, the blade load and pressure ratio decrease, and the working flow of the impeller moves to a small flow. At the same time, the characteristic line of the compressor designed under the same outlet pressure is calculated, and it can be seen that the efficiency of the compressor designed under the same outlet pressure is lower than that of the prototype compressor at the design point, but the flow margin and pressure ratio are greatly improved. N is the design speed, Tin is the compressor inlet temperature, Pin is the compressor inlet pressure, and Pout is the compressor outlet pressure. The flow margin Sm formula is
S m = ( 1 G S / G C ) * 100 %
Gs is the flow near the stall point, and Gc is the flow near the choke point.

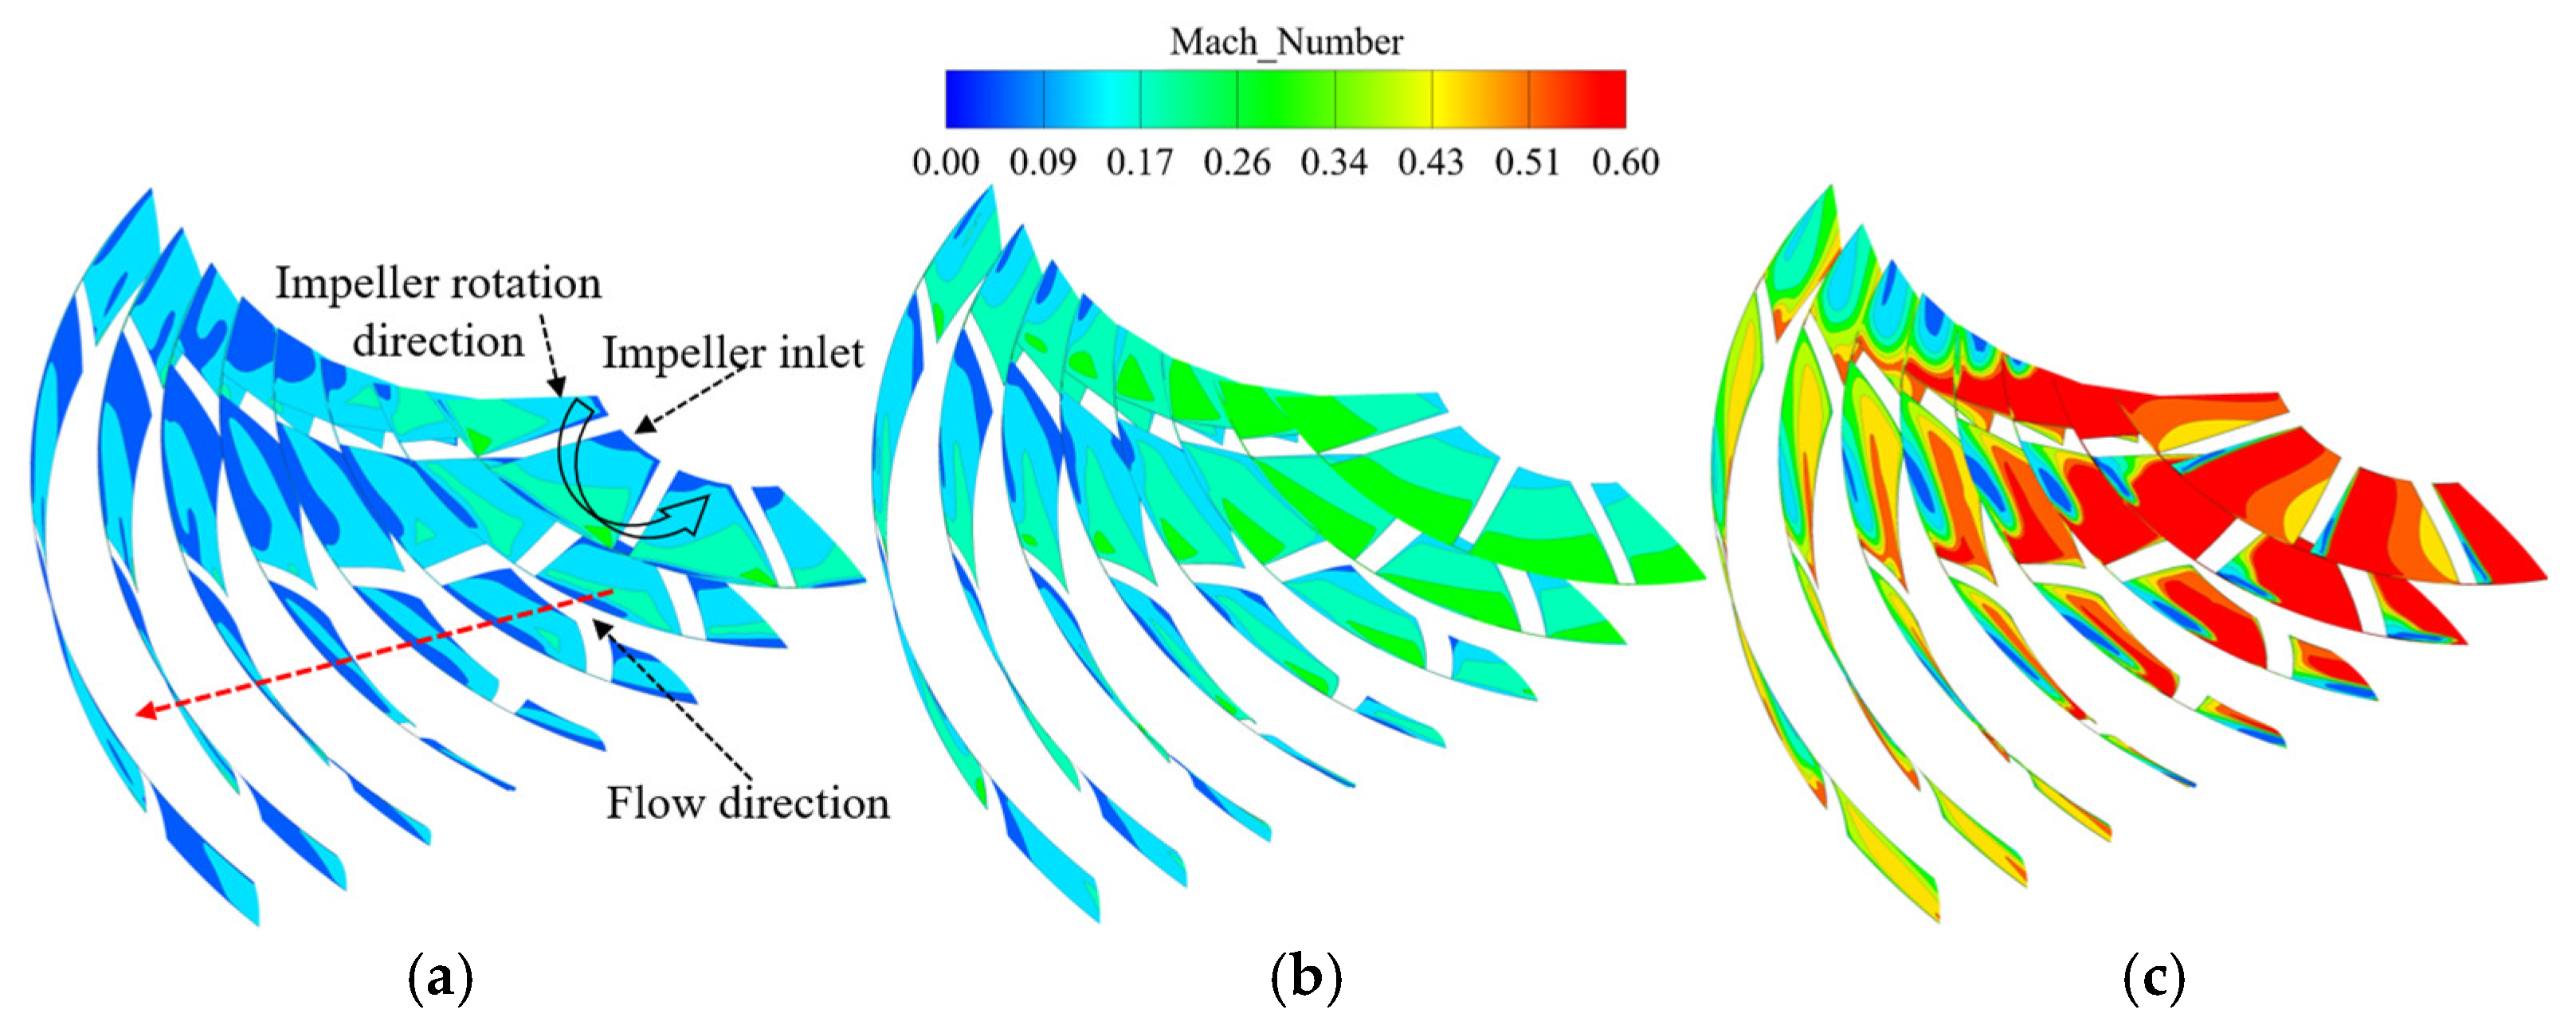
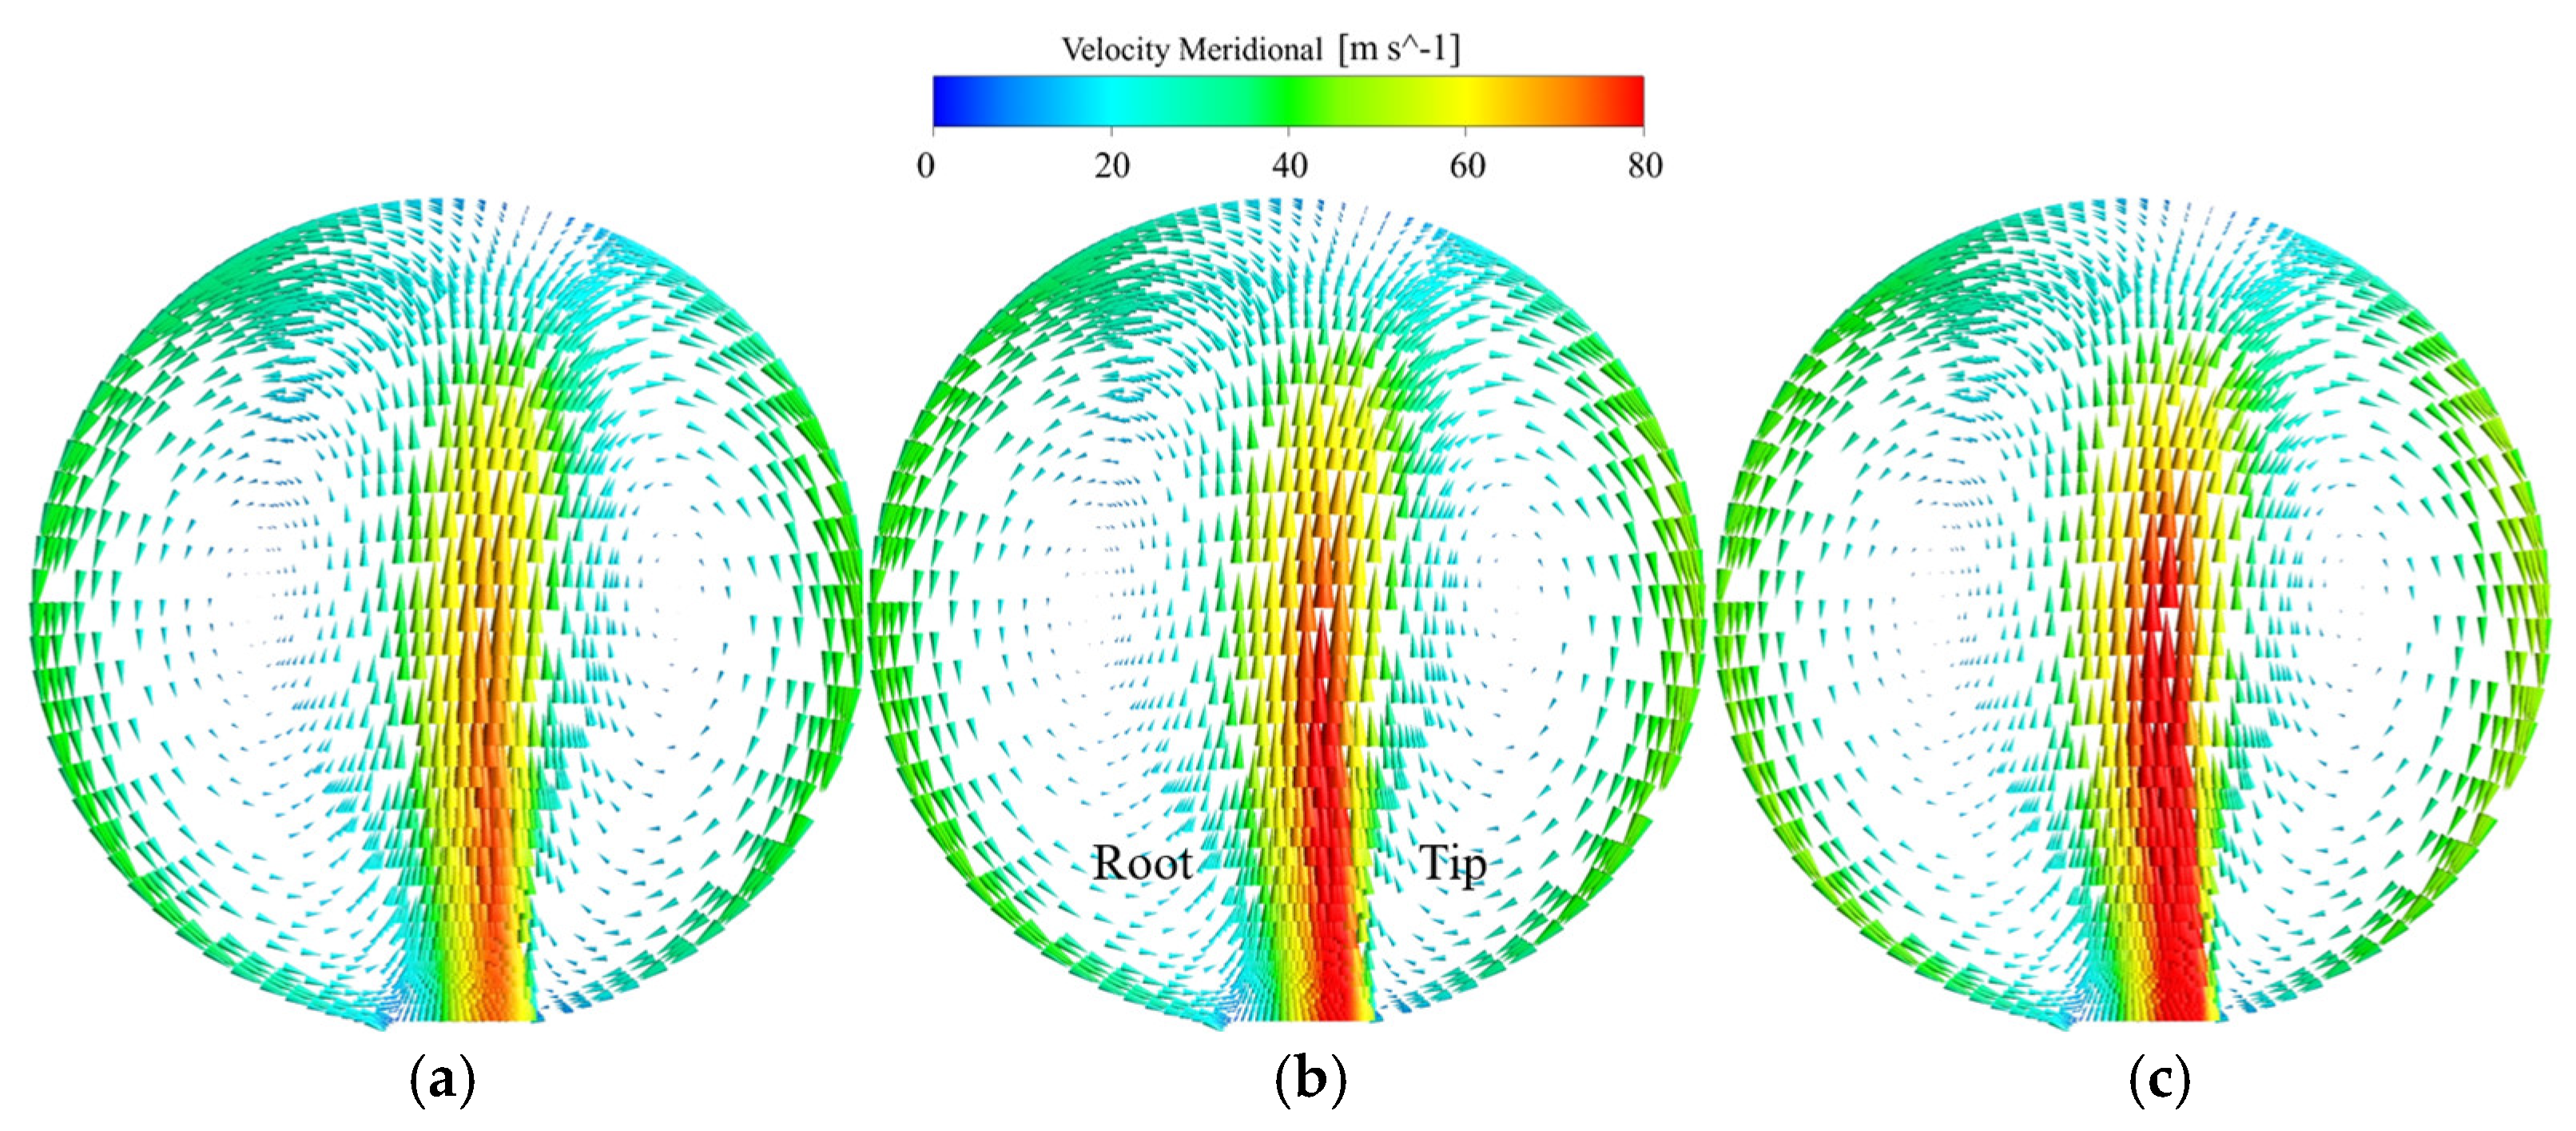
4.1. The Internal Flow of the Impeller

The static pressure envelope diagram of the blade surface in the helium–xenon compressor is displayed in Figure 12 at differing flow rates and with blade heights of 10%, 50%, and 90%. Static pressure increases progressively from the leading edge to the blade’s trailing edge at the design point. Concurrently, there is a progressive increase in the pressure difference between the pressure surface and the suction surface, which indicates that the blade load capacity is increasing from the blade root to the blade tip. The pressure differential on the blade surface is small in the first 40% of the blade’s flow direction as it approaches the stall point, lowering its total load capacity. However, pressure on the pressure surface records lower values near the blockage point than on the suction surface. This effect persists for around 10% of the blade length. This leads to a progressive increase in static pressure along the blade surface via the flow route. Subsequently, there is a gradual elevation in static pressure along the blade surface through the flow passage, culminating in the impeller’s suboptimal overall work capacity.
With chosen sections spanning from 10% to 80% of the impeller flow direction, Figure 13 displays the cloud plot of the relative Mach number within the impeller passage under varied flow rates. The fluid’s intake attack angle is positive near the stall point, which causes the fluid to strike the blade’s leading edge on the suction surface and produce a high-speed zone close to the blade tip. The extent of the low-speed region within the flow channel gradually widens along the pressure surface during downstream flow progression. In contrast, the low-speed region near the blade tip gradually contracts over this developmental phase. Flow separation manifests on the pressure surface, where the separation region expands and influences downstream channels, contributing to heightened fluid losses. At the design point, the impact loss of the fluid entering the impeller on the blades is reduced, the change in fluid velocity gradient in the impeller’s passage is small, there is no abrupt change in fluid velocity in the passage, and the impeller loss is reduced. The fluid’s inlet attack angle is negative near the plugging point, and the fluid impacts the front edge of the blade pressure surface, causing a local supersonic region to appear on the blade pressure surface and a flow separation on the front edge of the pressure surface. However, the separation zone has a limited diffusion range and has little impact on the downstream channel. Low-speed fluid flows through the channel, transitioning from the pressure surface to the suction surface. Low-energy fluid accumulation and blockage occur at the trailing edge of the blade due to the combined influence of the spanwise and reverse pressure gradients in the flow directions.
Figure 14 depicts the cloud plot of the static entropy within the impeller passage at varying flow rates. The passage vortex—created by the interplay of tip leakage flow and passage fluid—and tip fluid friction are the primary causes of high-entropy regions. As the tip leakage flow gradually gathers in the downstream channel, the size and intensity of the high entropy zone grow fast. Near the stall point, at the 10% channel section, a high-entropy region can be observed at the blade tip, and a localized high-entropy region also forms on the blade’s suction surface. As the fluid moves downstream, this high-entropy region migrates toward the suction surface and expands to the blade root along the suction surface wall. At the design point, the high-entropy region begins to appear at the 30% flow channel position and progressively approaches the suction side of the blade during channel flow. The high-entropy region near the blockage point occupies about 1/3 of the fluid channel in 10~80% of the flow channel and expands to the blade root in the downstream channel.

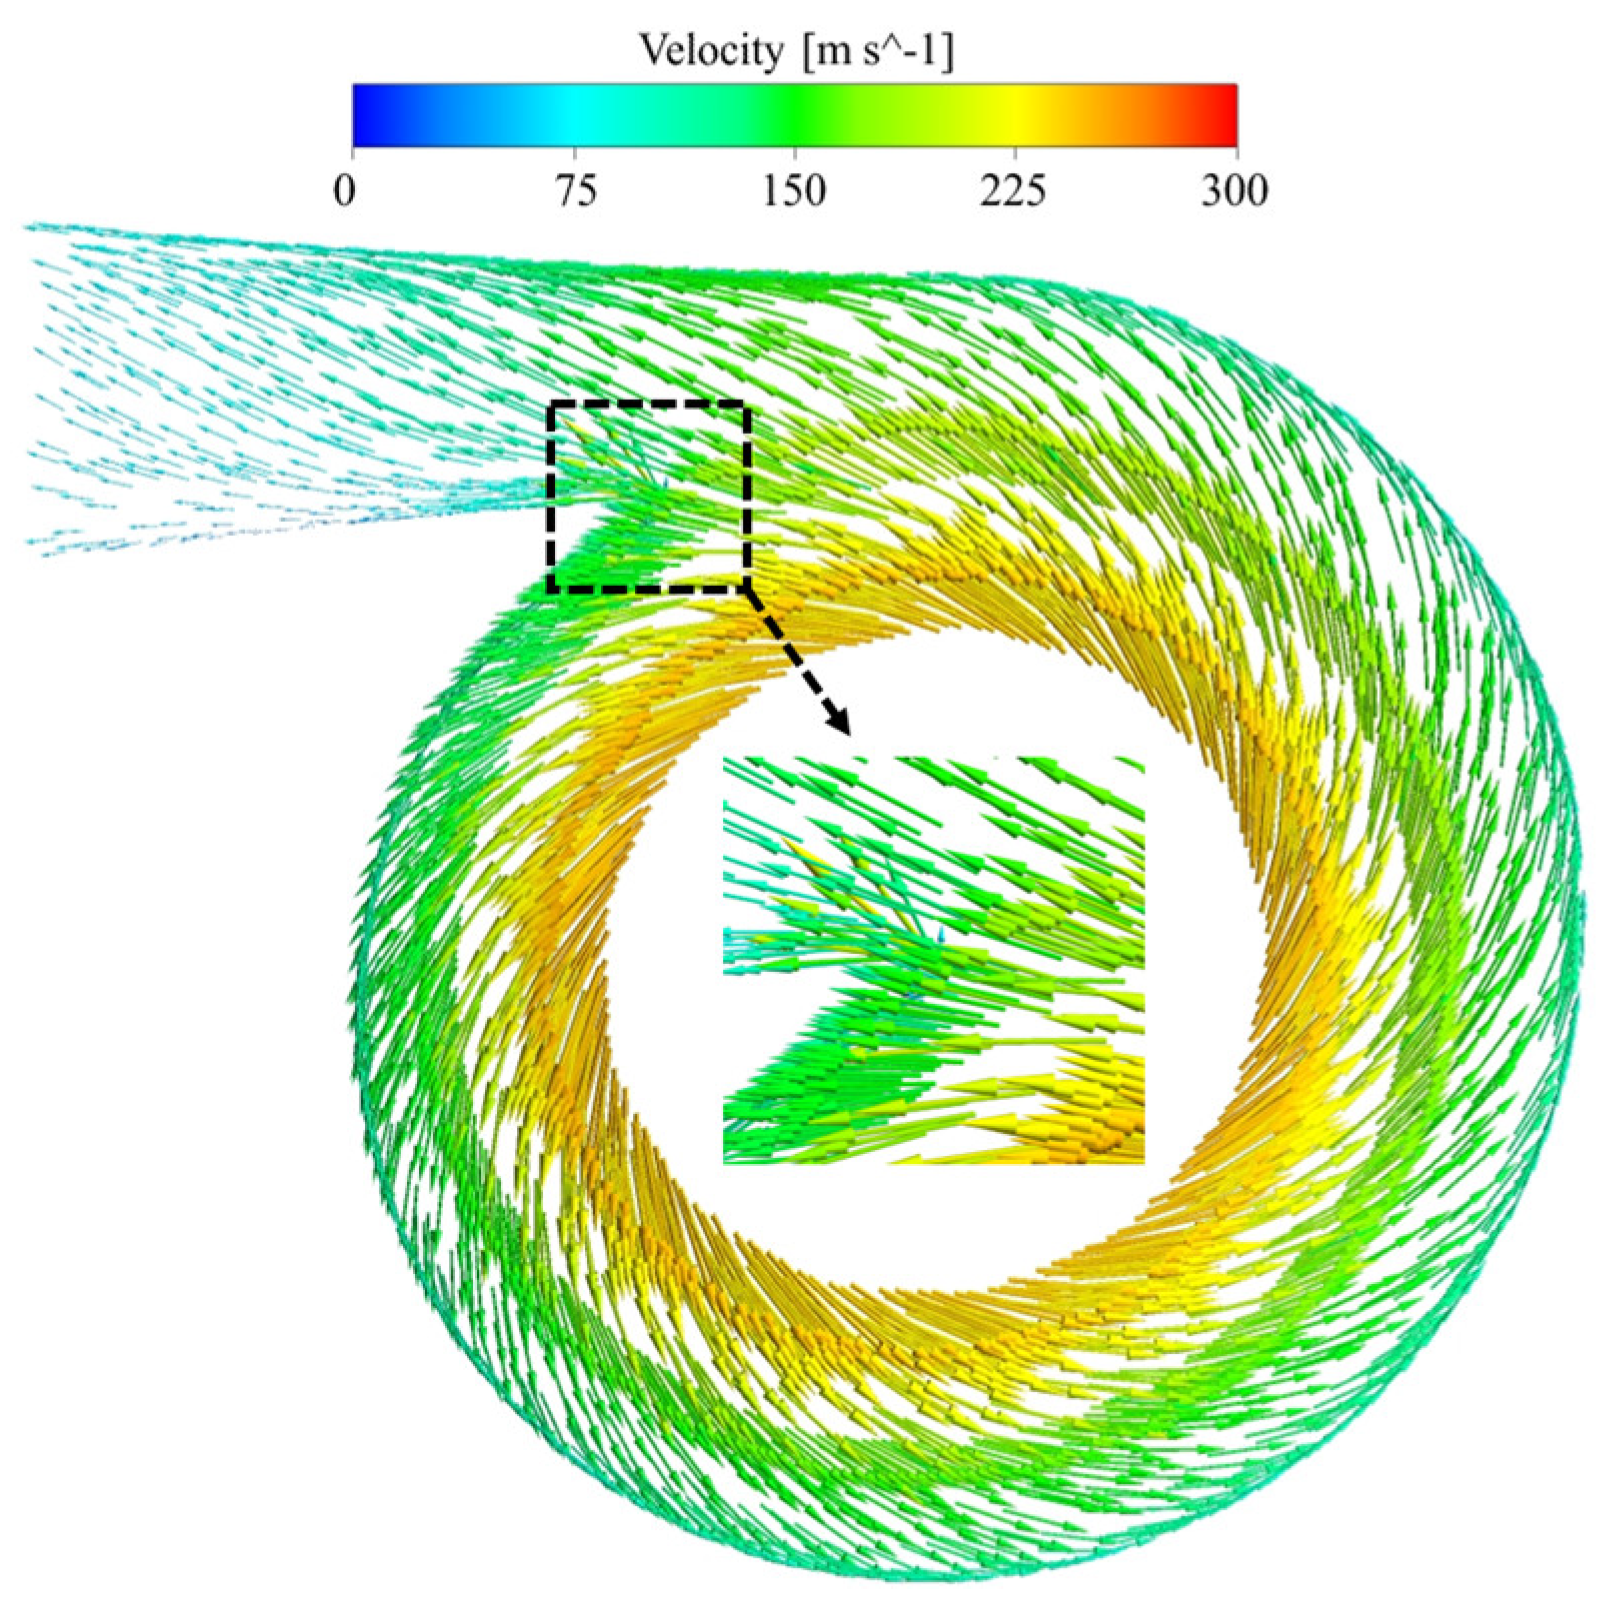
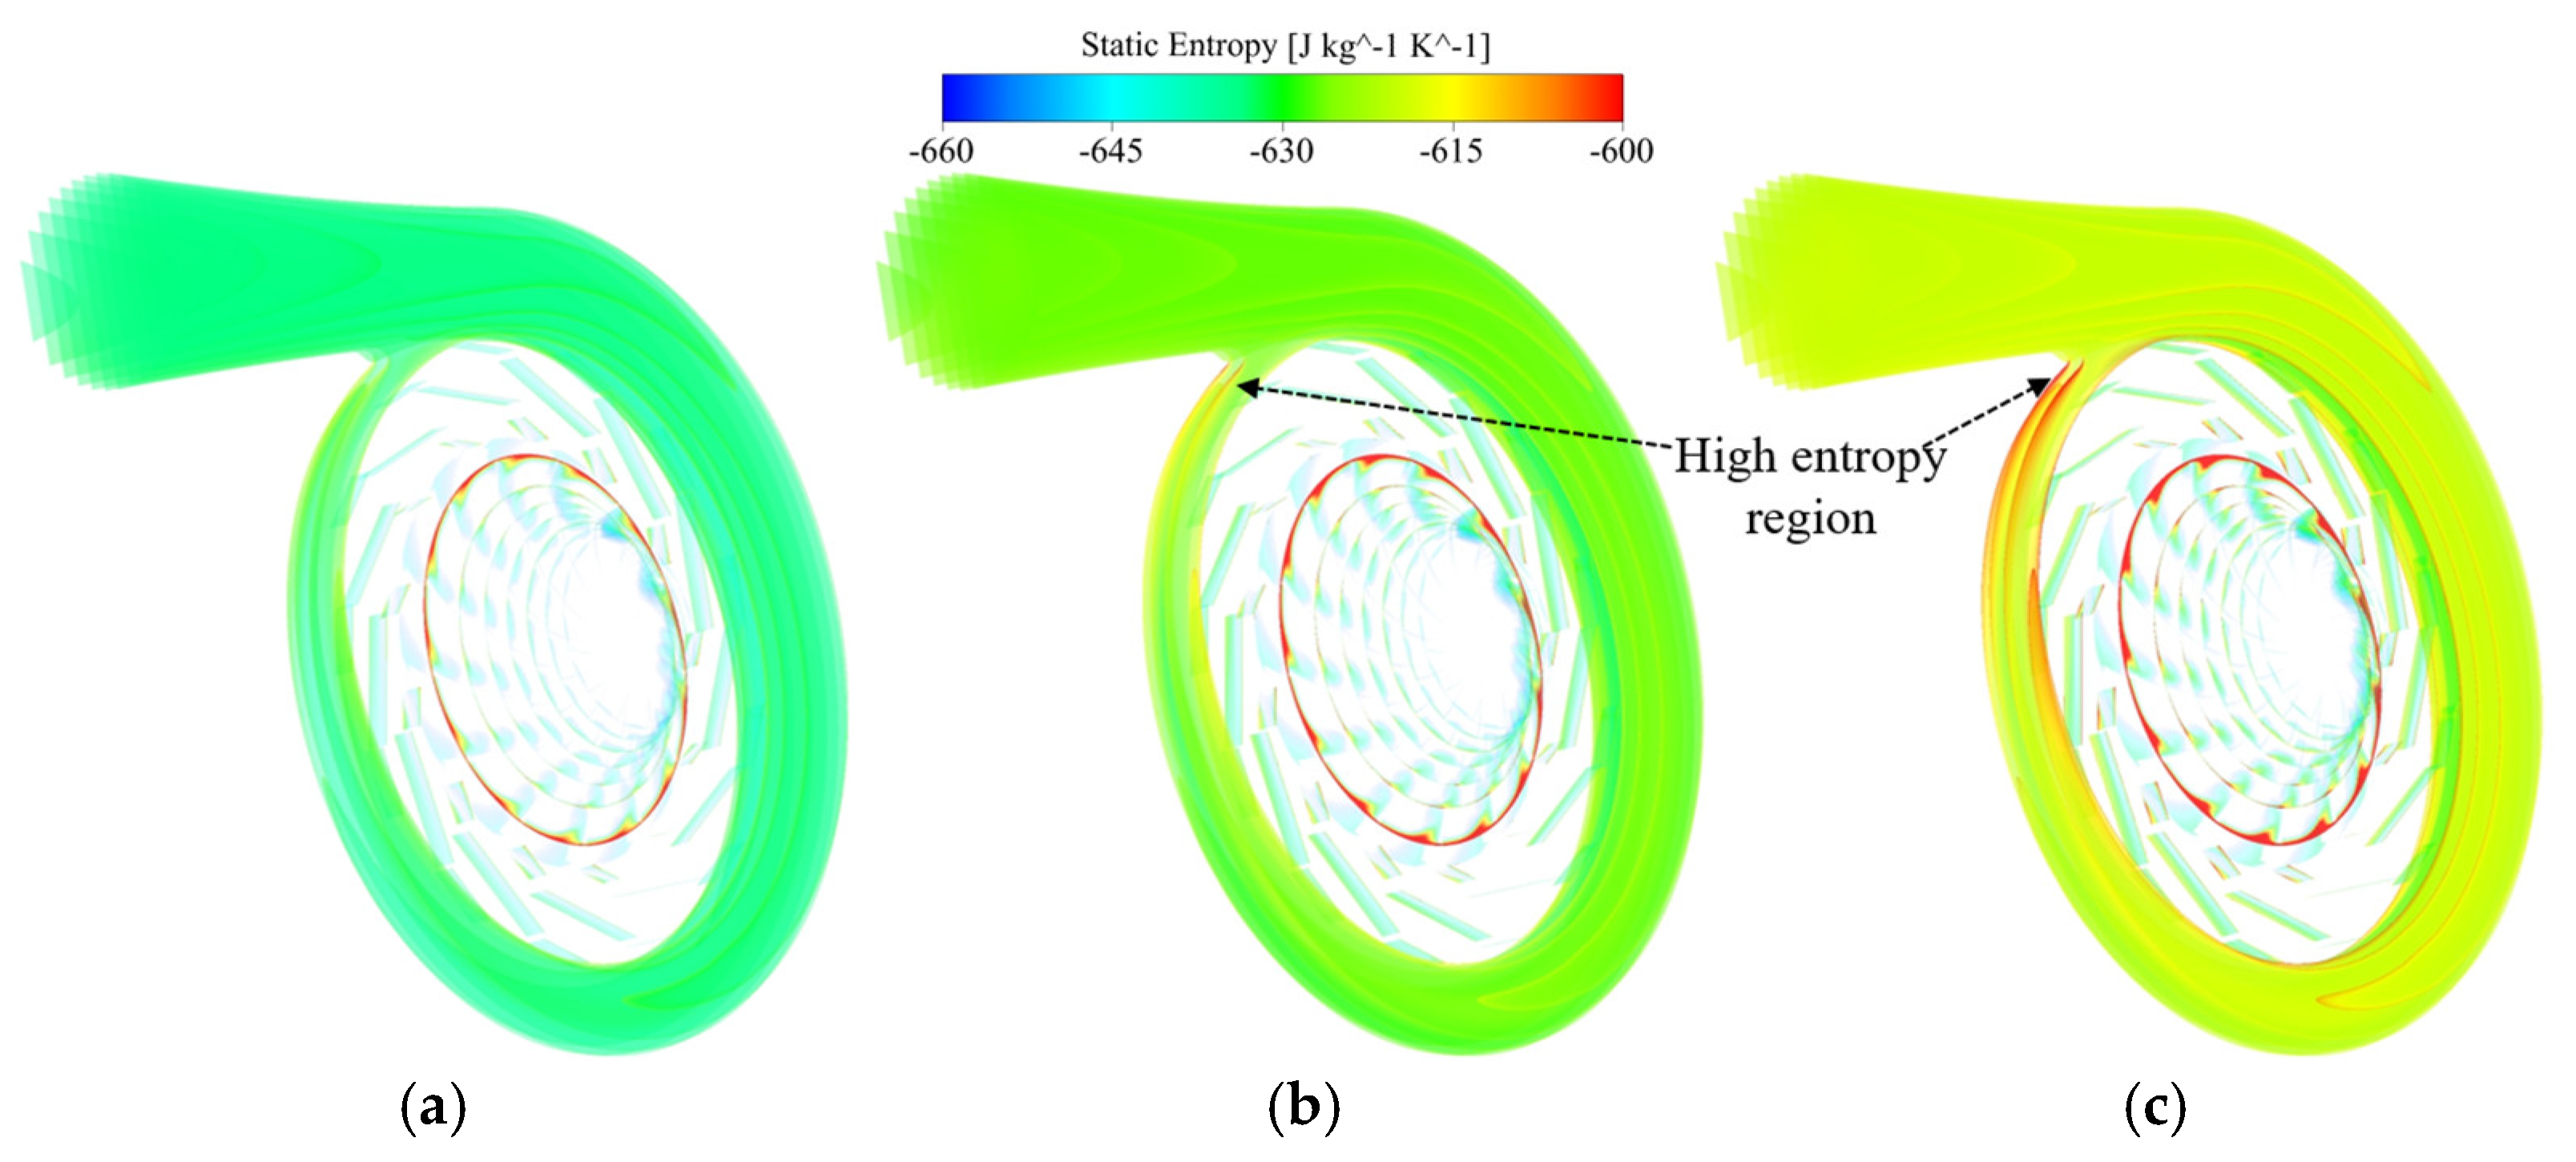
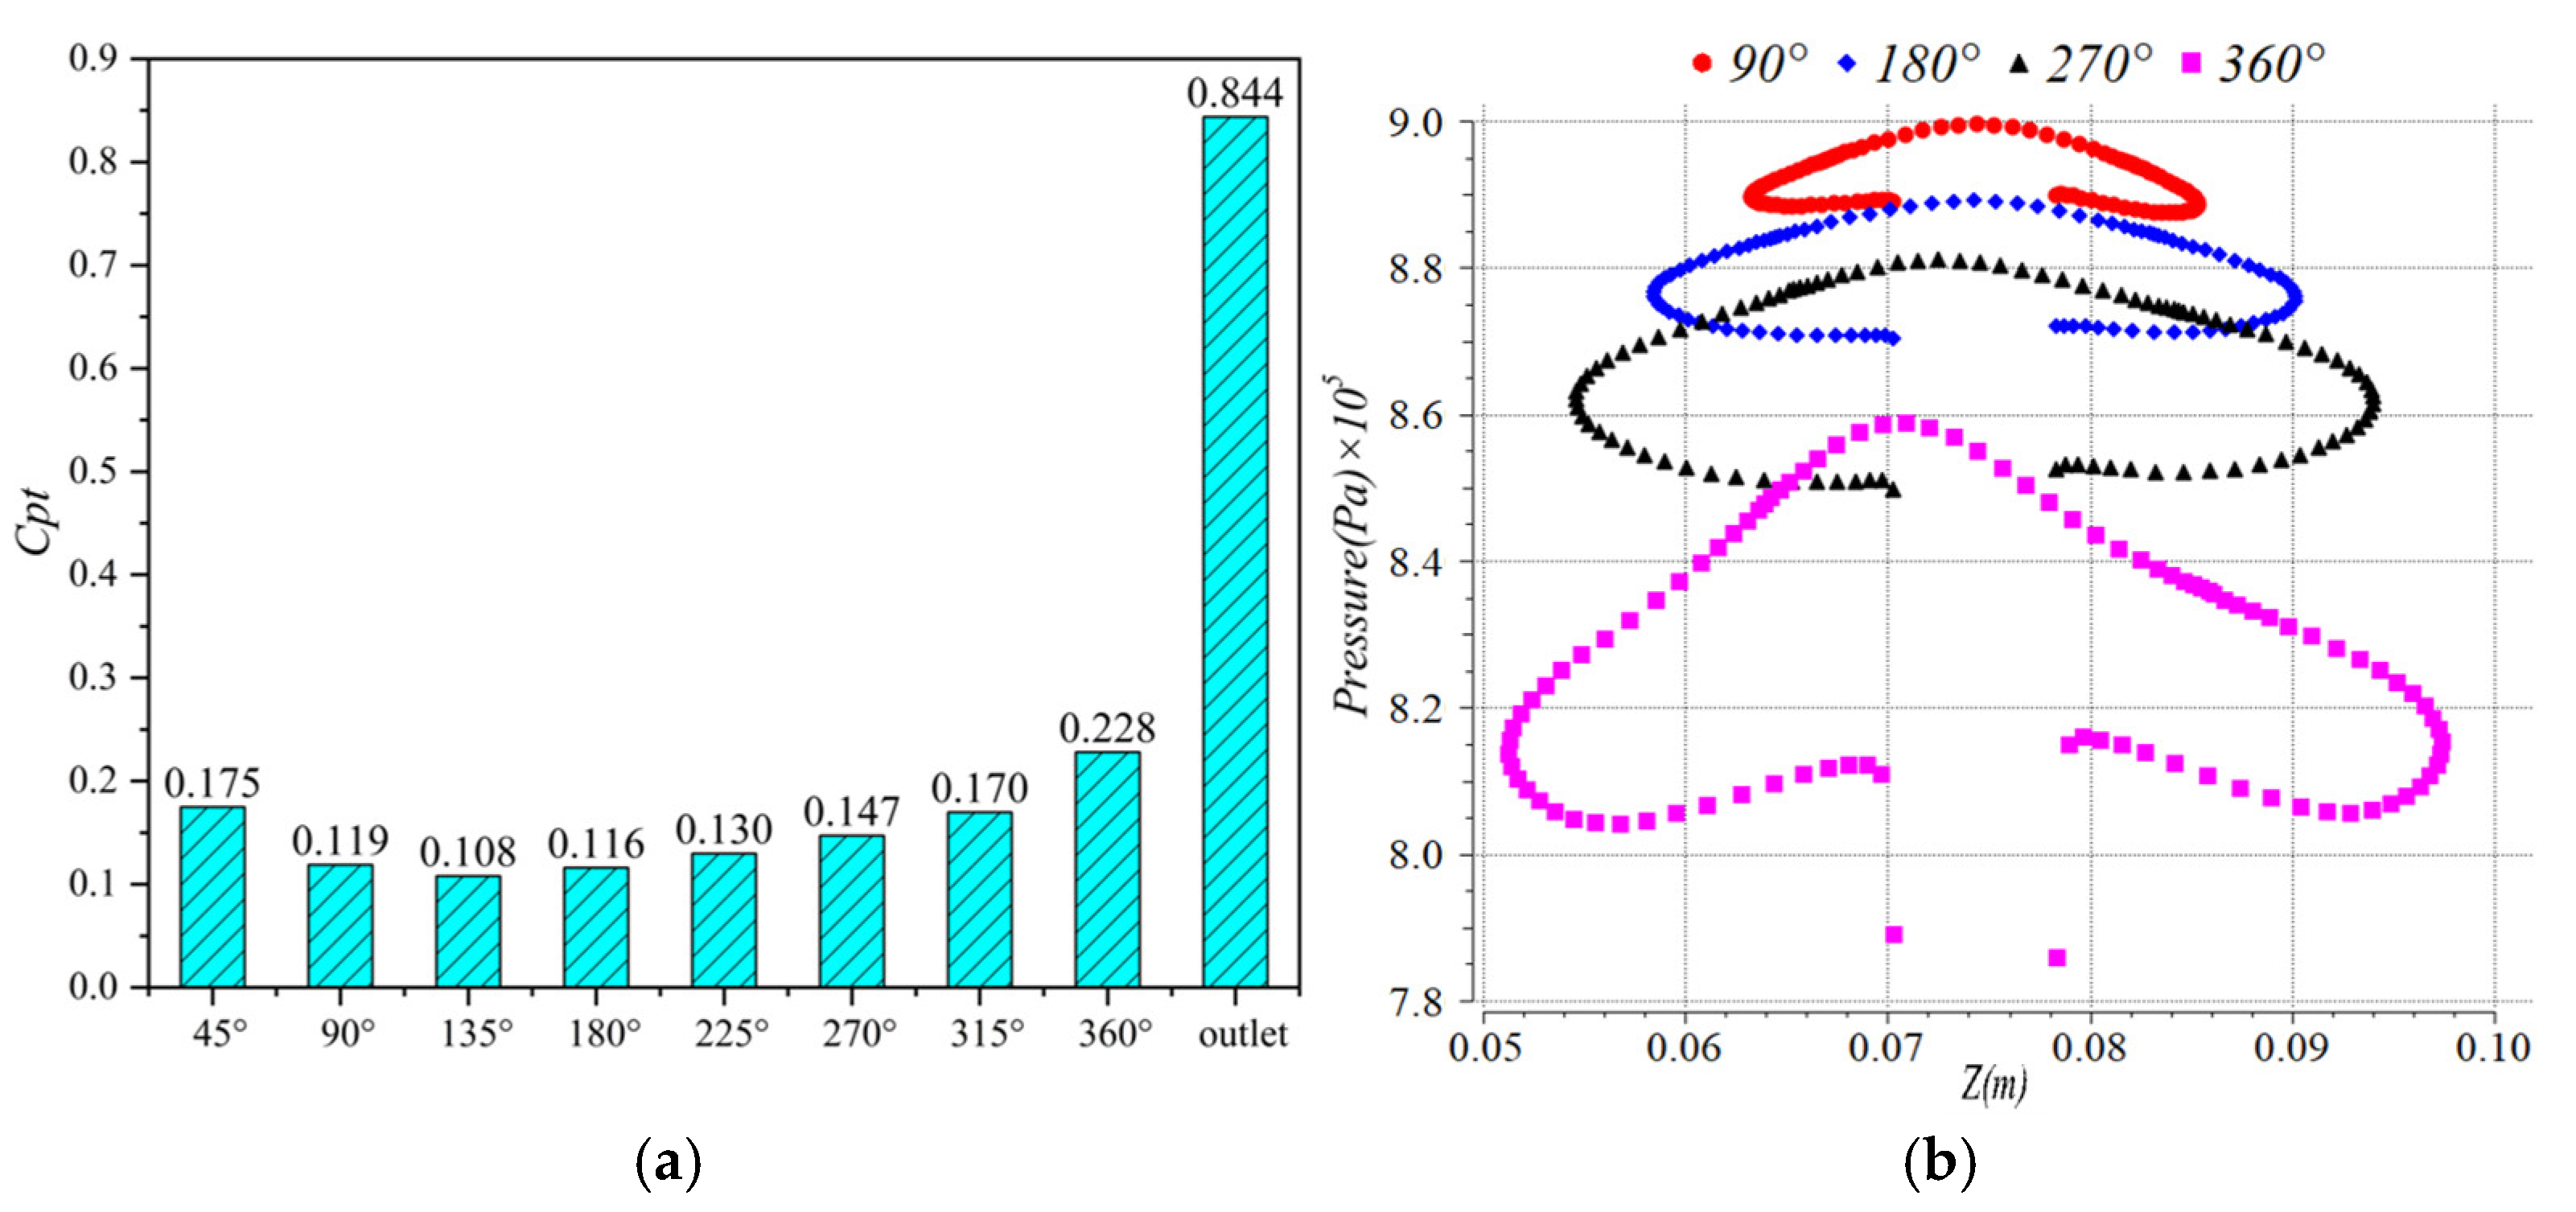
4.2. Analysis of the Whole Machine with Volute

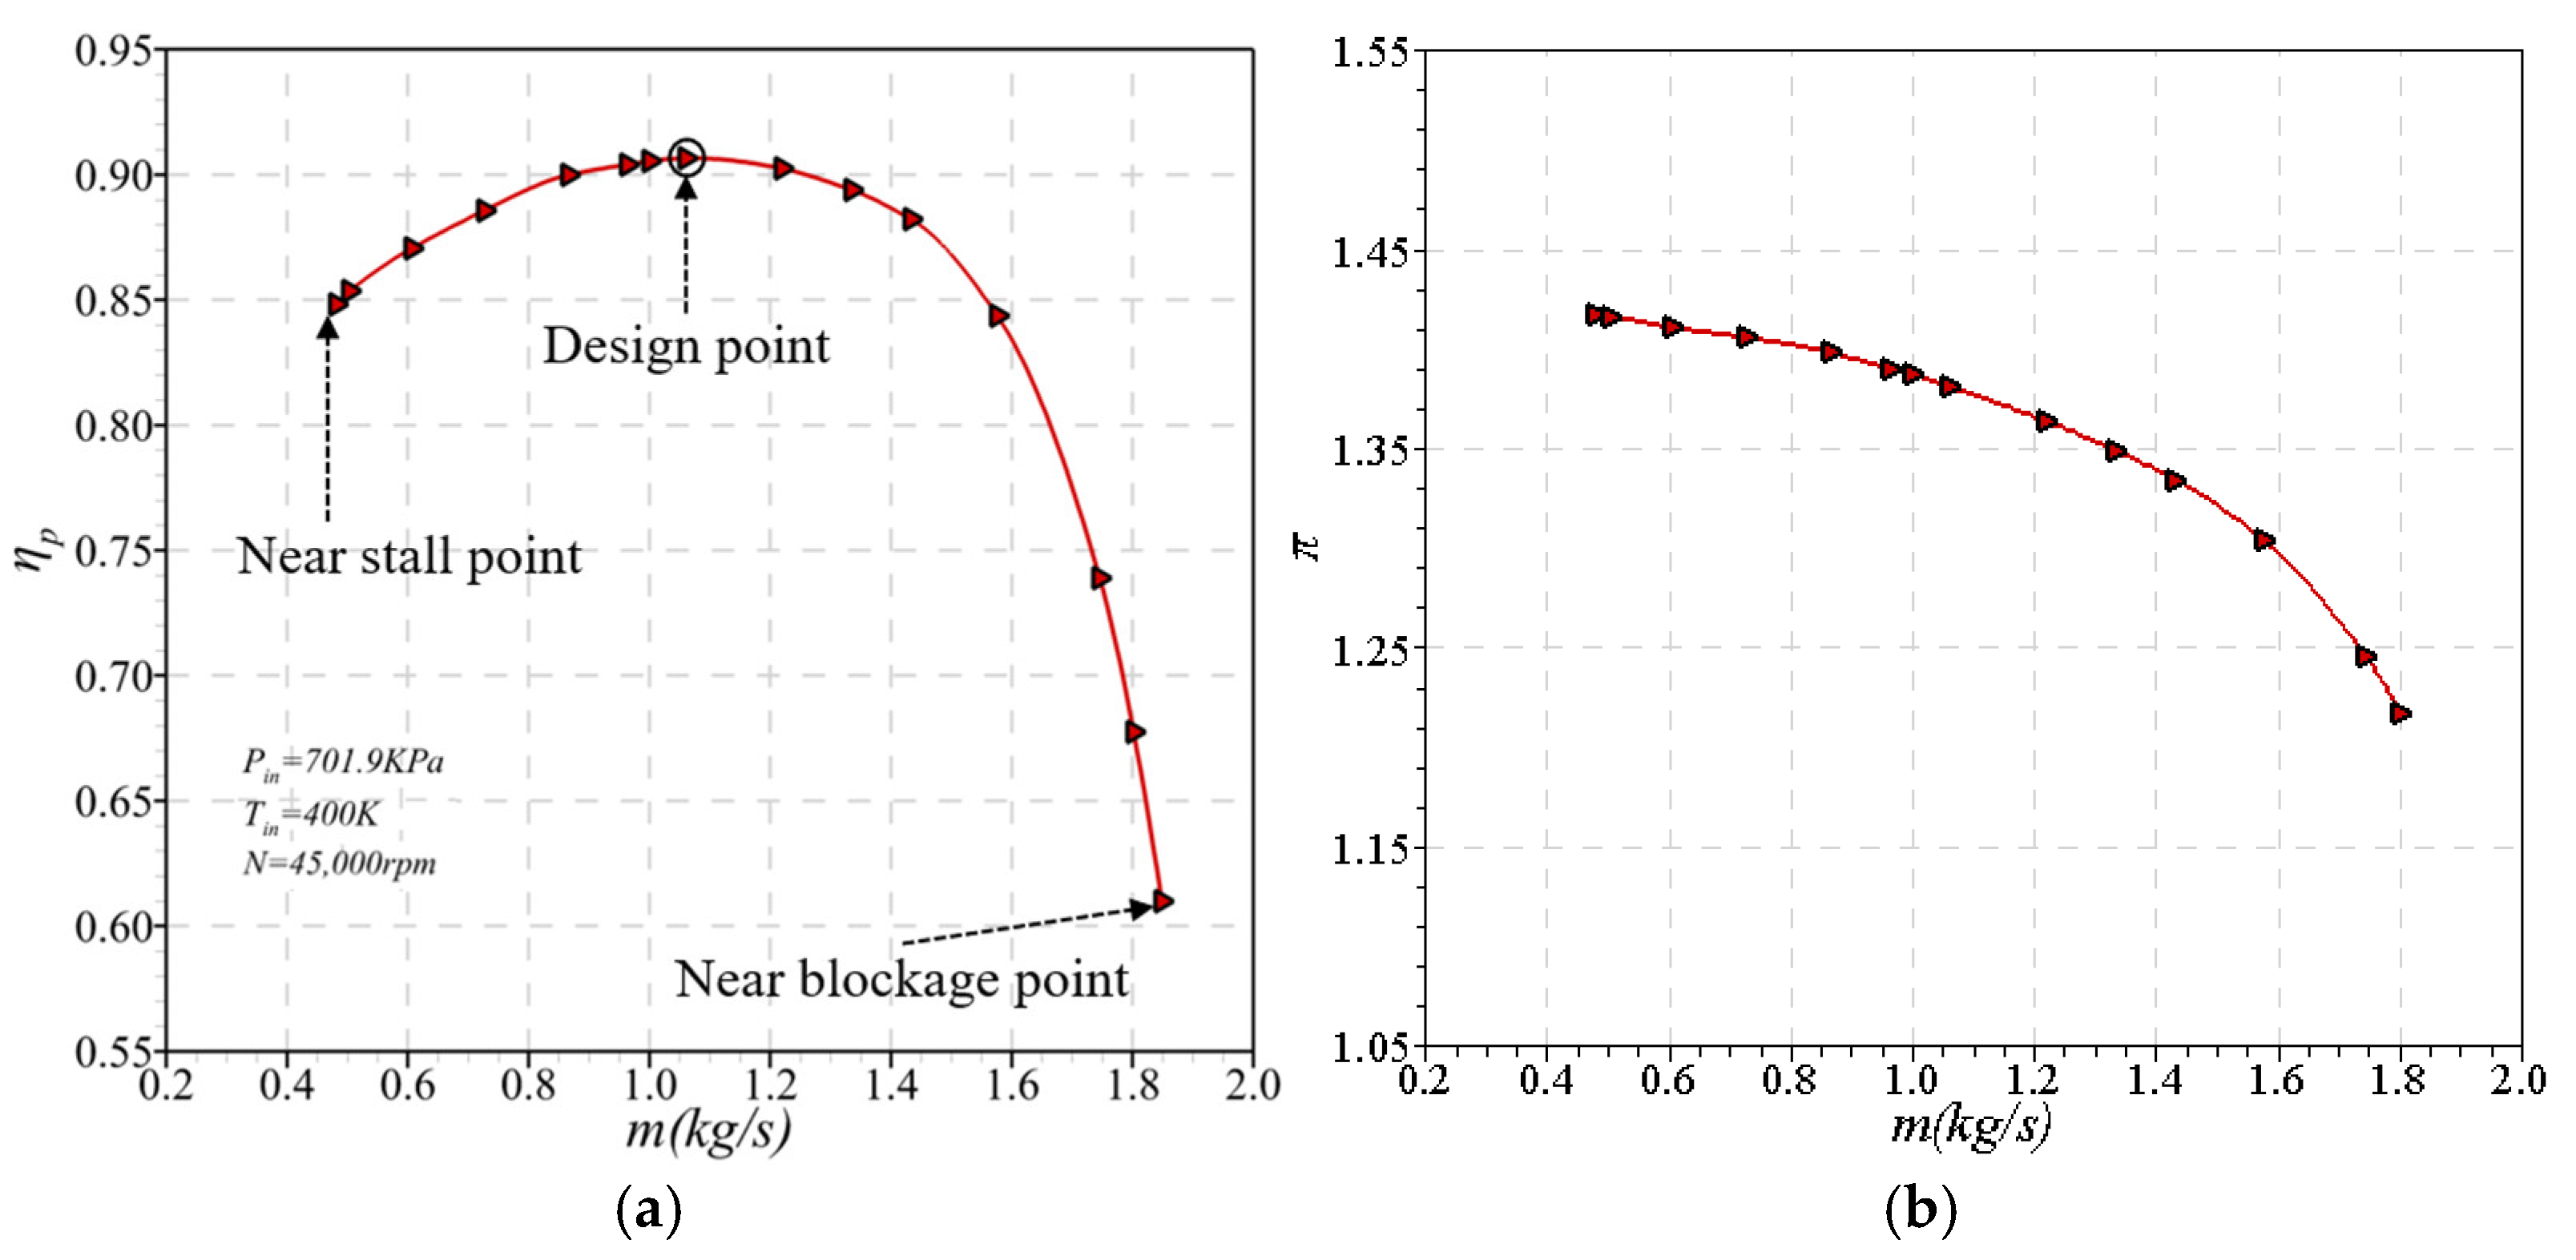
4.2.1. Design Point Analysis

Figure 15 depicts a radial cross-section’s meridian velocity vector diagram at φ = 270° under varying working conditions. The picture shows that the fluid velocity direction creates two approximately symmetrical vortices in the volute’s radial cross-section—the meridional velocity of the fluid entering the volute increases in connection with its rotational speed. Notably, the meridional velocity is higher near the blade tip and lower in the middle of the two vortices. The picture also shows that under three conditions, the direction of the meridional velocity across the same radial cross-section of the volute channel stays relatively constant. This consistency suggests that the compressor’s flow conditions are similar and excellent under these three conditions. Q represents the design flow, and N represents the design speed.
The volute serves primarily as a gas collector and has a symmetrical spiral expansion structure. Figure 16 depicts the volute’s total pressure loss coefficient and circumferential static pressure at various radial cross-sections during the design speed design point. The gradual increase in the volute channel and fluid accumulation contribute to an increasing total pressure loss coefficient from φ = 45° onward. The figure reveals that the circumferential pressure values within the same radial cross-section are approximately symmetrical along the Z-axis, with higher static pressure values observed on the spiral wall outside the volute. The circumferential static pressure of the radial section decreases gradually with the increase in the radial cross-sectional area. The gradient of static pressure drop from 90° to 270° is small. The fluid velocity gradient in the liquid collection section of the volute is slight, and the fluid loss is small.
Figure 17 illustrates how the diffuser’s fluid operates on the diffusion-deceleration principles. The fluid enters the volute through the diffuser in a path that follows the spiral structure of the volute, and the circumferential velocity distribution is uniform. This results in a small effect of the fluid on the volute and the wall of the volute tongue, which lowers the total energy loss.
The volume-division method divides the entire flow channel into many slices. Figure 18 shows high-entropy zones on the impeller rim, diffuser, and volute wall. The rise in entropy at the impeller is principally caused by tip leakage and passage vortex phenomena. The high-entropy zone of the diffuser is created by fluid–wall friction and fluid diffusion. Elevated entropy in the volute is due to fluid–wall friction and vortex structures generated as the fluid moves around the wall. The fluid flows around the wall in the volute and mixes with the fluid that has entered the volute. In this process, the shift in velocity gradient and pressure gradient causes turbulence and non-uniformity in the flow, increasing loss. Furthermore, the entropy value within the compressor flow route increases as the rotating speed and flow rate increase.

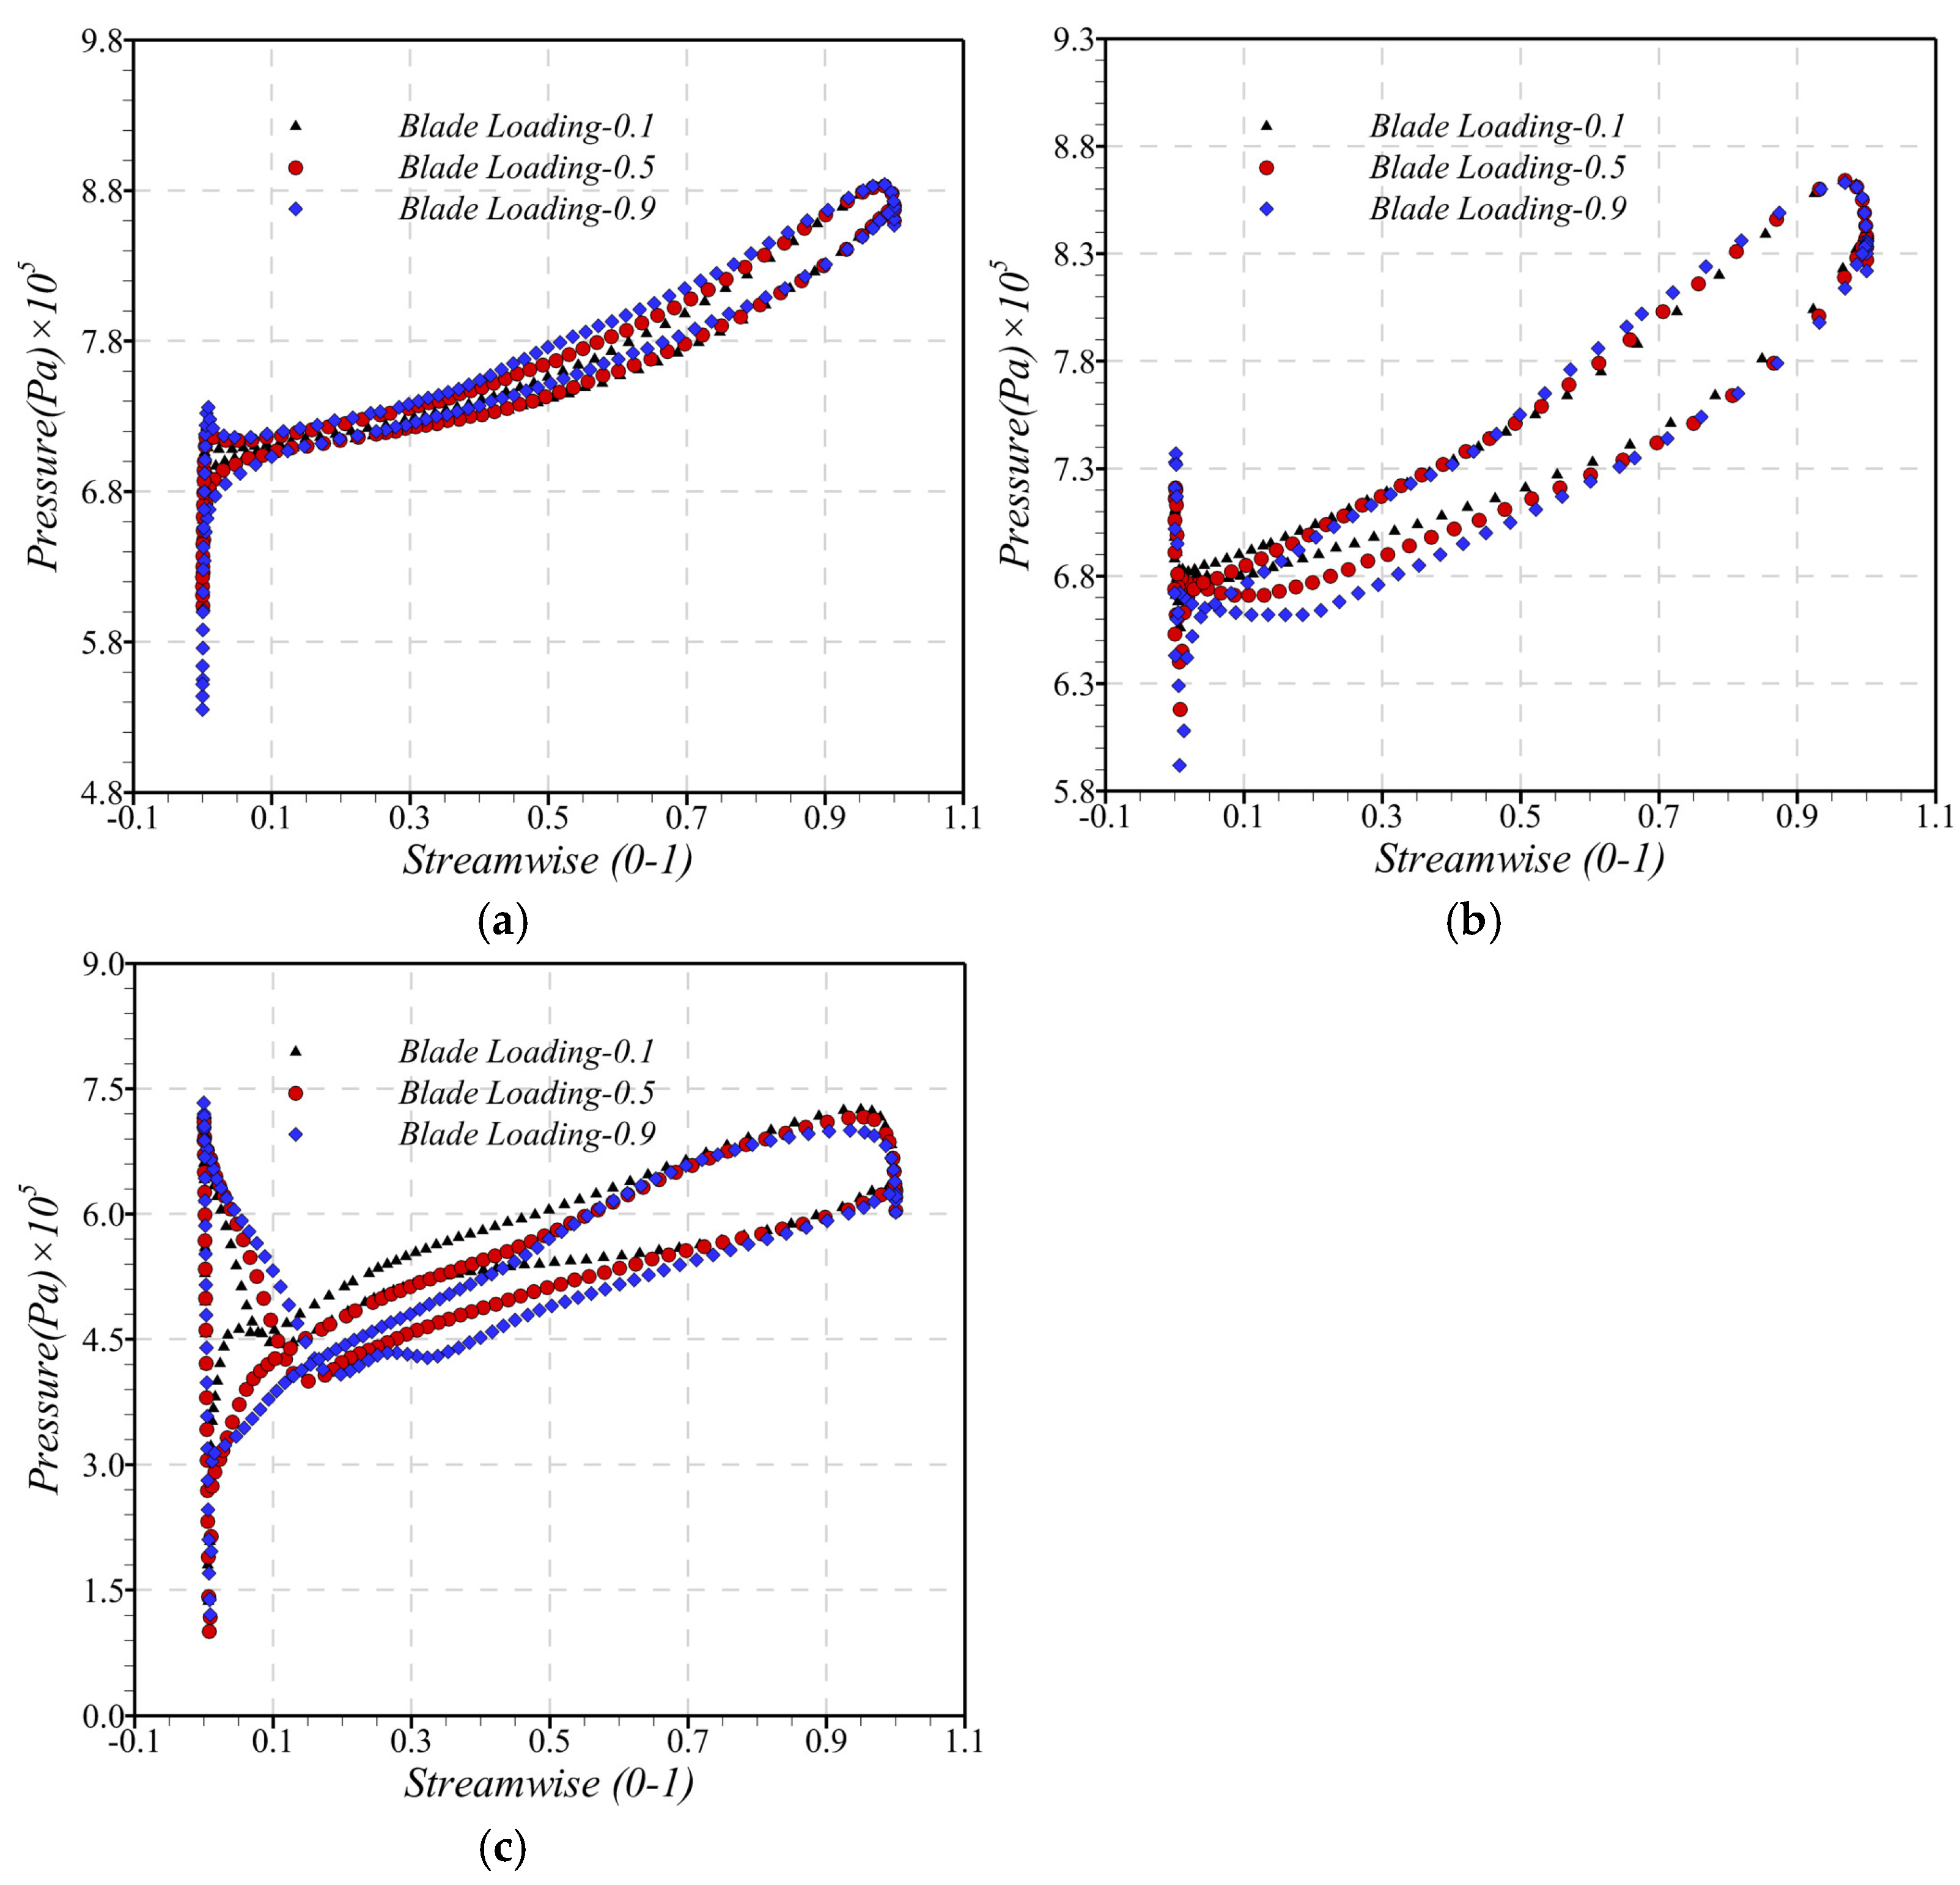
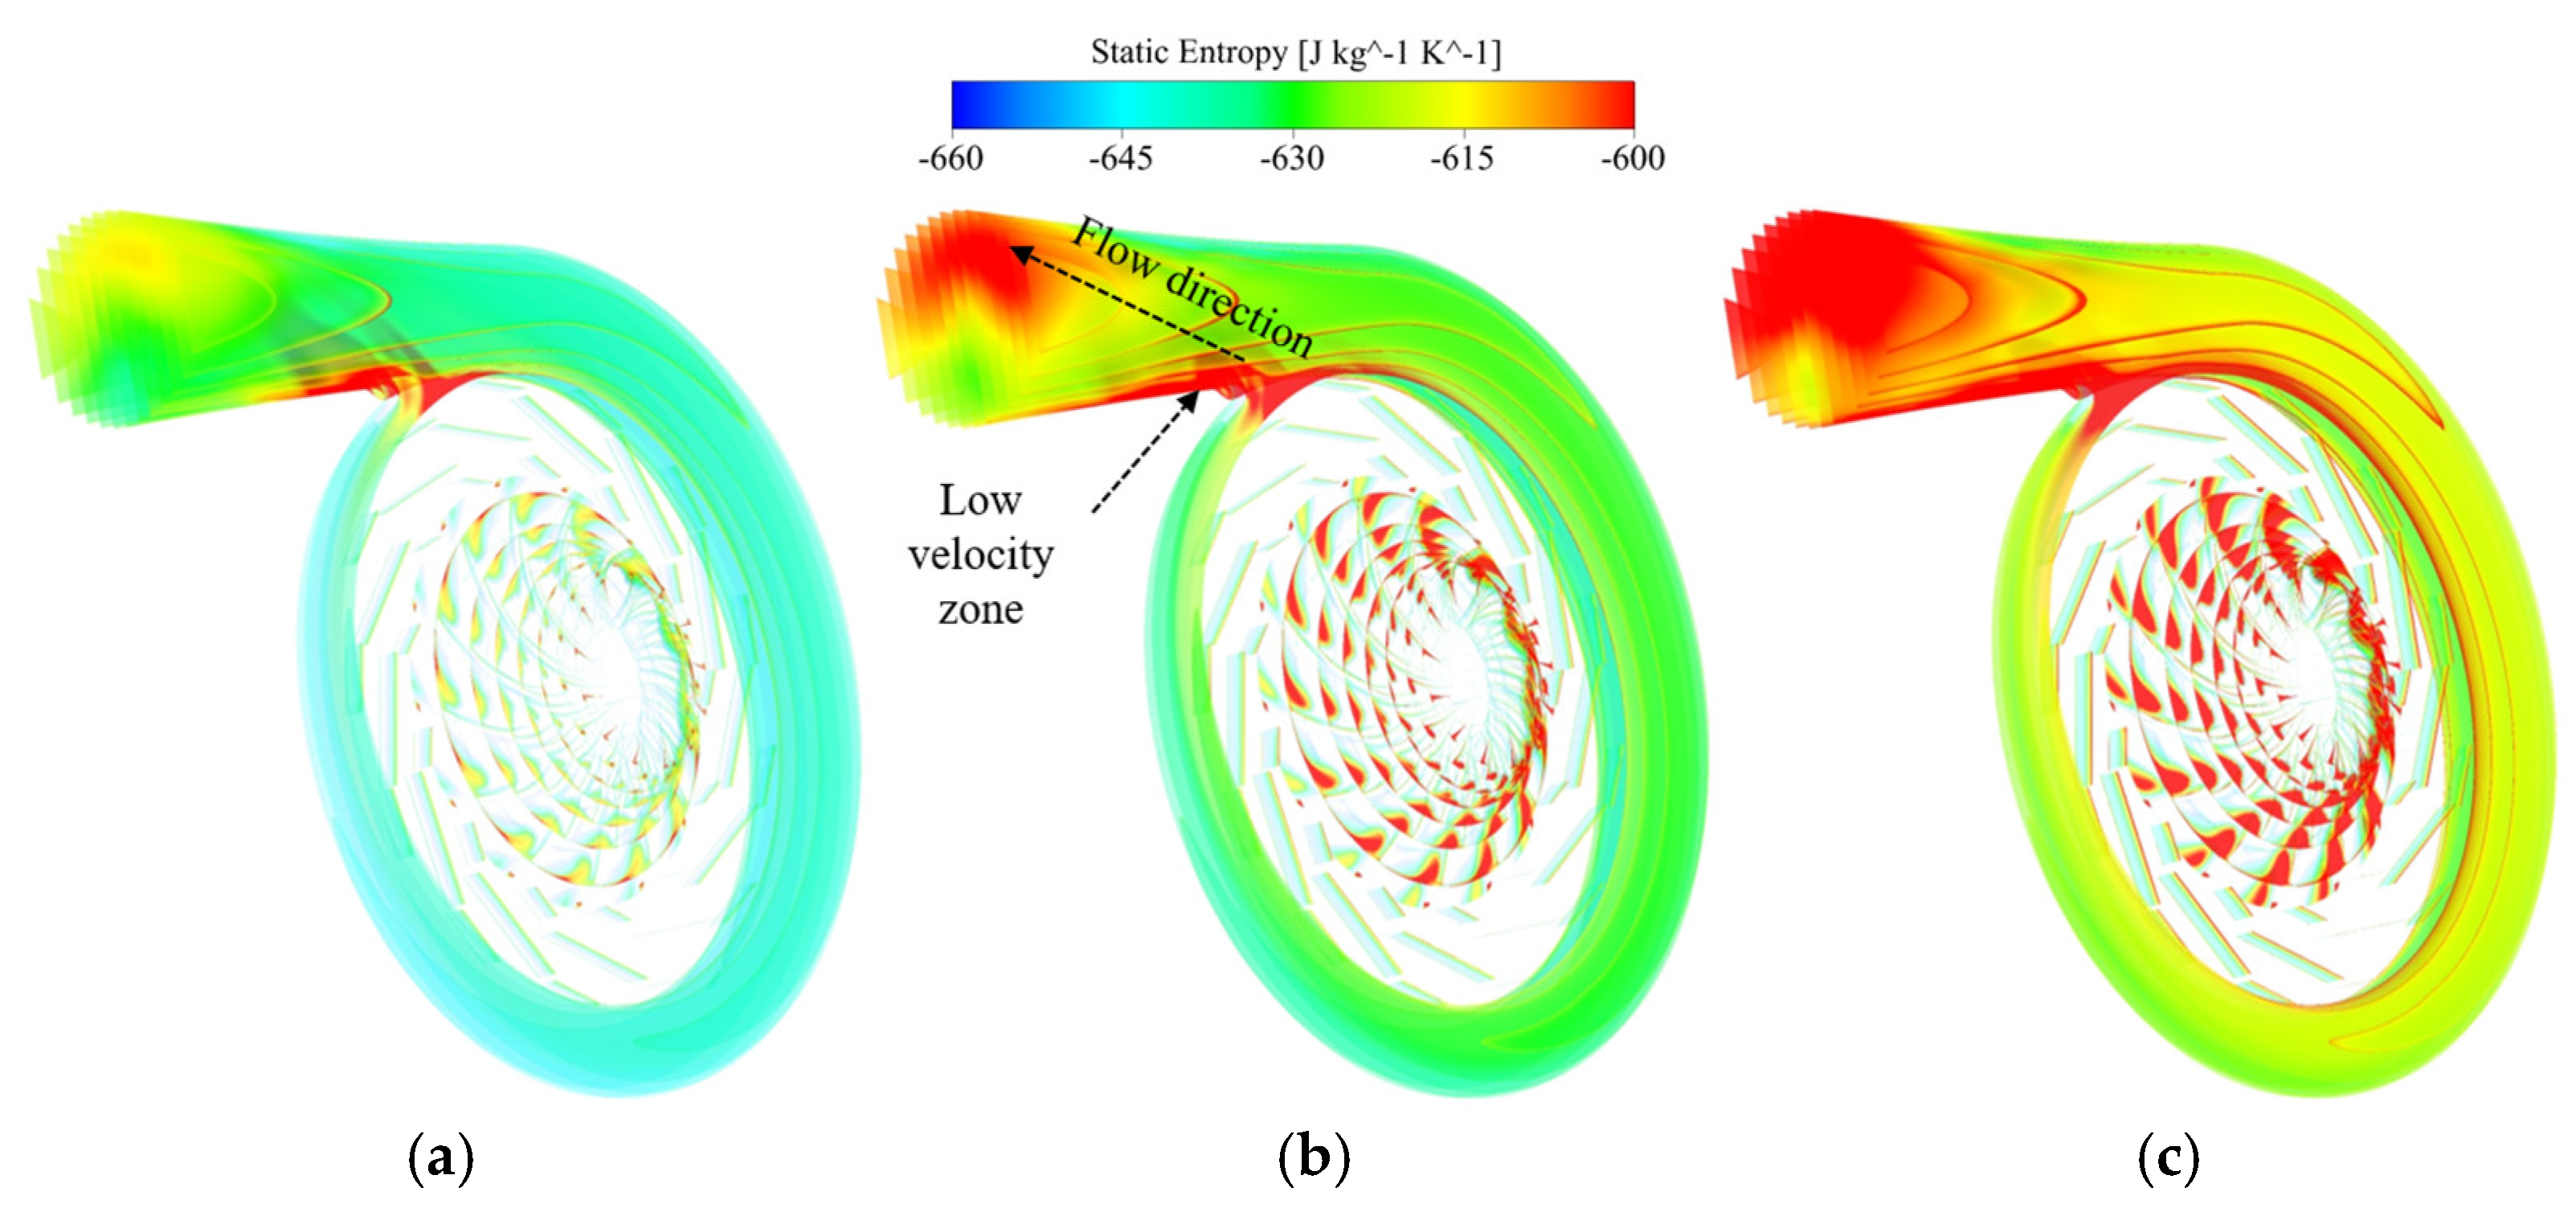
4.2.2. Analysis near the Stall Point

Figure 19 depicts the total pressure loss coefficient and circumferential static pressure profiles of the volute at various radial cross-sections at the stall point to determine the design speed. At a near-stall point, the included angle between the fluid velocity direction at the impeller outcome and the tangential speed direction is slight, the fluid flow route in the diffuser is longer, and fluid losses increase. The path through which the fluid flows in the volute also increases, especially after the fluid flows through the volute tongue. It is divided into two parts: one part of the fluid flows to the outlet, and the other part enters the volute again to form a recirculating flow. The histogram in Figure 19 shows that the most significant overall pressure loss coefficient across the volute’s radial cross-sections occurs at φ = 45°. This occurrence is associated with a substantial concentration of fluid within the volute, aggravated by the short radial cross-section at φ = 45°. Part of the fluid flows back into the volute, causing flow instability and higher losses. Furthermore, the circumferential static pressure gradually increases at the same Z-axis heights from φ = 90° to φ = 360°, indicating a steady decrease in fluid velocity within the volute.
As the axial position φ increases, the fluid velocity within the volute gradually decreases across different radial cross-sections. The fluid velocity near the volute tongue is high, the volute’s radial cross-sectional area is tiny, and the recirculating fluid causes friction between the fluid and the volute wall, causing flow instability and entropy. Figure 20 visually illustrates that the entropy value of the volute fence, particularly in proximity to the volute tongue, where the radial cross-sectional area is minimized, attains its maximum magnitude. Furthermore, entropy values are often higher than at the design point due to the volute’s prolonged flow path and the presence of recirculating fluid.

4.2.3. Analysis of near the Blockage Point

Figure 21 depicts the overall pressure loss coefficient and the volute’s circumferential static pressure profiles at various radial cross-sections at the design speed blockage point. Near the blockage point, the angle between the velocity direction of the fluid coming out of the diffuser and the tangential speed direction is considerable, causing the fluid to impact directly on the volute wall, particularly the volute tongue wall. This nearly vertical contact reduces fluid velocity, causes significant changes in the fluid velocity gradient, and exacerbates losses. The total pressure loss coefficient within the volute at the same radial cross-section is comparatively lower than that of the stall point within the range of φ = 45° to φ = 315°. In comparison, it markedly surpasses the stall point at φ = 360°, indicating an accumulation of low-energy fluids at the volute outlet-diffuser section. Furthermore, as the spiral radius outside the volute increases, the radial cross-sectional area of the volute channel gradually expands, resulting in a reduction in the fluid’s impact energy on the volute wall and a lesser decline in fluid velocity. In contrast, fluid velocity within the volute increases with the radial cross-section. The circumferential static pressure decreases gradually along the same Z-axis height from φ = 90° to φ = 360°, as observed in various radial cross-sections.
Figure 22 depicts Static entropy diagram of the flow passage near the blocking point at different speeds. The angle between the velocity direction of the fluid flowing out of the diffuser and the tangential velocity direction is significant, and the fluid entering the volute directly impacts the volute wall, particularly the tongue wall. Because of the fluid’s nearly vertical impact, the fluid velocity lowers, the fluid velocity gradient changes dramatically, and the loss is exacerbated. Turbulence, flow inhomogeneity, and a significant number of low-energy fluids will be caused by the change in velocity and pressure gradients at the connection between the diffuser section at the volute outlet and the volute tongue. Subsequently, this low-energy fluid amalgamates with the mainstream fluid and proceeds toward the outlet. At the volute outlet-diffuser section, the location where low-energy fluid gathers and the route where low-energy fluid moves can be observed.

5. Conclusions

In this study, the commercial software Concepts NREC Suite.8.9_2021.03 is used to design a 15 g/mol helium–xenon compressor. Combined with numerical simulation, the optimal values of the impeller inlet hub ratio, inlet rake angle, blade number, and relative length of the diffuser are selected. The designed helium–xenon compressor and the helium–xenon compressor in [23] are both near 1.03 kg/s in maximum efficiency, which shows that there is no deviation in the design point and the compressor design is reasonable. The internal flow field of the designed impeller and the whole compressor under different working conditions is analyzed, respectively. Finally, the following conclusions are drawn:
(1)
Under the inlet conditions of Tin = 400 K, Pin = 701.9 KPa, and operating flow m = 0.8657 in the closed Brayton cycle power system, the pressure ratio of the helium–xenon compressor designed in this study is 1.368, and the isentropic efficiency is 83.94%, which is 2.09% higher than that of the prototype helium–xenon compressor, and the polytropic efficiency is 1.1% higher.
(2)
Under the same compressor outlet conditions, the stable working range of the designed compressor is widened, the compressor flow margin is increased by 33.27%, and the pressure ratio at the design point is increased by 9.2%.
(3)
Impeller loss mainly comes from the channel vortex formed by the mixing of tip leakage flow and the fluid in the channel, and this ratio gradually increases with the decrease in working conditions, and the high-entropy region at the downstream tip near the stall point occupies 1/3 of the channel.
(4)
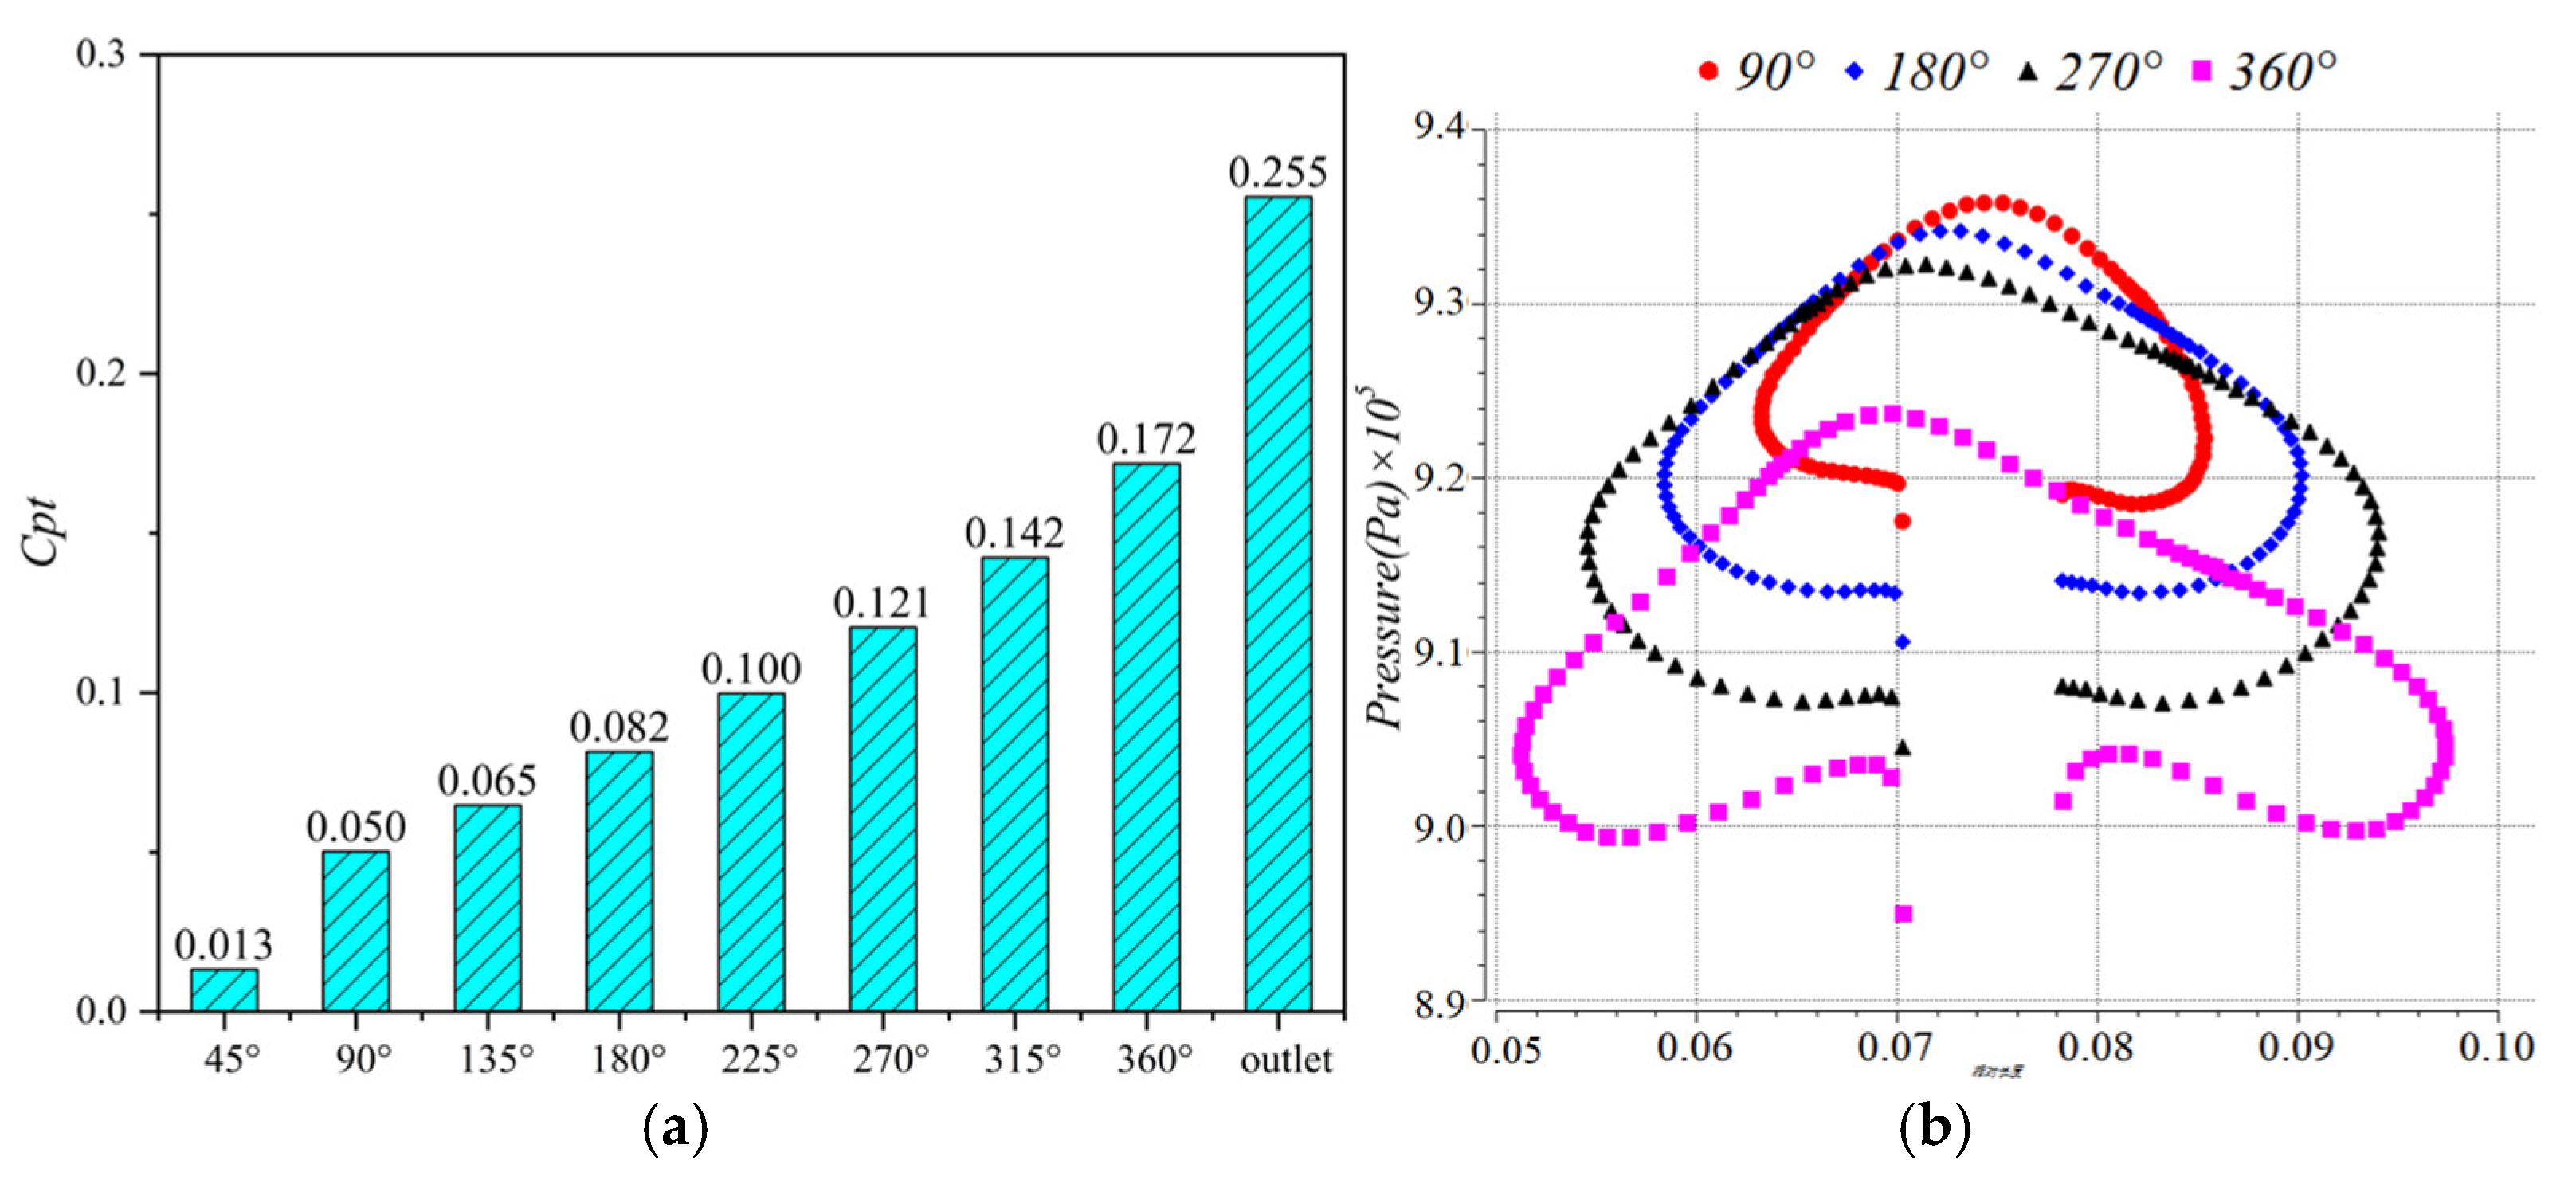
In the volute-collecting section, the loss of the arbitrary cross-section increases with the increase in the φ angle, but at the near stall point and the near blockage point of the compressor, the loss of φ = 45° cross-section in the volute-collecting section is higher than that at other angles in the channel from φ = 90° to φ = 360°, and the loss of the volute tongue is high. Finally, the influence on compressor performance is intensified with the increase in compressor speed.

Author Contributions

Conceptualization, validation, data collection, formal analysis, writing (review and editing), conceptualization, methodology, and writing—original draft, J.Z.; validation, conceptualization, writing, review, and editing, Z.T.; review and editing, A.M.; investigation, software, J.X.; review and editing, H.L. All authors have read and agreed to the published version of the manuscript.

Funding

The funds for this work were provided within the framework of the National Natural Science Foundation of China Project (grant number 52206042), the Natural Science Foundation of Liaoning Province (grant number 2022-BS-096), and the Fundamental Research Funds for the Central Universities (grant number 3132023118).

Data Availability Statement

The raw data supporting the conclusions of this article will be made available by the authors on request.

Acknowledgments

The authors are grateful for the financial support from the National Natural Science Foundation of China (501100001809), the Natural Science Foundation of Liaoning Province (501100 005047), and the Fundamental Research Funds for the Central Universities (501100012226).

Conflicts of Interest

The authors declare no conflicts of interest. The funders had no role in the design of the study; in the collection, analyses, or interpretation of data; in the writing of the manuscript; or in the decision to publish the results. All authors have read and agreed to the published version of the manuscript.

Abbreviations

α2Flow outlet angle, °.
β1The inlet angle of the blade, °.
β2Impeller outlet installation angle, °.
ηIsentropic efficiency.
ηpPolytropic efficiency.
πTotal pressure ratio.
πsStatic–pressure ratio.
ρDensity, kg/m3.
σSlip coefficient.
φThe angle between the volute cross-section and 0°, °.
BexDiffuser outlet height, mm.
B2The impeller exit height, mm.
bThe axial width of the volute inlet, mm.
CAbsolute velocity, m/s.
Ct2The tangential velocity of the impeller outlet, m/s.
Cm2The meridian velocity of the impeller outlet, m/s.
CptTotal pressure loss coefficient.
D2The diameter of the impeller outlet, mm.
LAM2 Exit swirl coefficient.
mMass flow, kg/s.
NRevolution, r/min.
PinThe compressor inlet pressure, KPa.
PoutThe compressor outlet pressure, KPa.
PHiImpeller inlet rake angle, °.
QThe volume rate of flow, m3/s.
R1t/R1hImpeller rim/hub radius ratio.
RexDiffuser outlet diameter, mm.
R2Diameter at the outlet of an impeller, mm.
rRadius, mm.
SmThe flow margin.
TTemperature, K.
KinThe compressor inlet temperature, K.
UCircumferential speed, m/s.
U2The Circumferential velocity of the impeller outlet, mm.
WRelative velocity, m/s.
ZNumber of leaves.

References

  1. Frost, T.H.; Anderson, A.; Agnew, B. A Hybrid Gas Turbine Cycle (Brayton/Ericsson): An Alternative to Conventional Combined Gas and Steam Turbine Power Plant. Proc. Inst. Mech. Eng. Part A J. Power. 1997, 211, 121–131. [Google Scholar] [CrossRef]
  2. McDonald, C.F. Helium Turbomachinery Operating Experience from Gas Turbine Power Plants and Test Facilities. Appl. Therm. Eng. 2012, 44, 108–142. [Google Scholar] [CrossRef]
  3. Golovko, V.F.; Dmttrieva, I.V.; Kodochigov, N.G.; Kuzavkov, N.G. Features of Adapting Gas Turbine Cycle and Heat Exchangers for HTGRs; International Atomic Energy Agency: Vienna Austria, 2001; pp. 63–74. ISSN 1011-4289. Available online: https://www.osti.gov/etdeweb/servlets/purl/20198170 (accessed on 17 July 2024).
  4. Ribeiro, G.B.; Braz Filho, F.A.; Guimarães, L.N.F. Thermodynamic Analysis and Optimization of a Closed Regenerative Brayton Cycle for Nuclear Space Power Systems. Appl. Therm. Eng. 2015, 90, 250–257. [Google Scholar] [CrossRef]
  5. Longstaff, R.; Bond, A. The SKYLON Project. In Proceedings of the 17th AIAA International Space Planes and Hypersonic Systems and Technologies. Conferences, San Francisco, CA, USA, 11–14 April 2011; pp. 2011–2244. [Google Scholar]
  6. Najjar, Y.S.H.; Zaamout, M.S. Comparative Performance of Closed Cycle Gas Turbine Engine with Heat Recovery Using Different Gases. Heat Recovery Syst. CHP 1992, 12, 489–495. [Google Scholar] [CrossRef]
  7. Al-attab, K.A.; Zainal, Z.A. Externally Fired Gas Turbine Technology: A Review. Appl. Energy 2015, 138, 474–487. [Google Scholar] [CrossRef]
  8. Kim, Y.M.; Kim, C.G.; Favrat, D. Transcritical or Supercritical CO2 Cycles Using Both Low- and High-Temperature Heat Sources. Energy 2012, 43, 402–415. [Google Scholar] [CrossRef]
  9. Olumayegun, O.; Wang, M.; Kelsall, G. Closed-Cycle Gas Turbine for Power Generation: A State-of-the-Art Review. Fuel 2016, 180, 694–717. [Google Scholar] [CrossRef]
  10. Tian, Z.; Zheng, Q.; Malik, A.; Jia, X.; Jiang, B. Effect of the Specific Heat Ratio on Transonic Axial Compressor Rotor Performances. Appl. Therm. Eng. 2019, 148, 307–315. [Google Scholar] [CrossRef]
  11. El-Genk, M.S.; Tournier, J.-M. Noble Gas Binary Mixtures for Gas-Cooled Reactor Power Plants. Nucl. Eng. Des. 2008, 238, 1353–1372. [Google Scholar] [CrossRef]
  12. Tournier, J.-M.; El-Genk, M.S.; Gallo, B. Best Estimates of Binary Gas Mixtures Properties for Closed Brayton Cycle Space Applications. In Proceedings of the 4th International Energy Conversion Engineering Conference (IECEC), San Diego, CA, USA, 26–29 June 2006; p. 4154. [Google Scholar]
  13. El-Genk, M.S.; Gallo, B.M. High-Power Brayton Rotating Unit for Reactor and Solar Dynamic Power Systems. J. Propuls. Power 2010, 26, 167–176. [Google Scholar] [CrossRef]
  14. Malik, A.; Zheng, Q.; Qureshi, S.R.; Zaidi, A.A.; Yaqoob, T.; Aziz, A. Effect of Helium Xenon as Working Fluid on Centrifugal Compressor of Power Conversion Unit of Closed Brayton Cycle Power Plant. Int. J. Hydrogen Energy 2021, 46, 7546–7557. [Google Scholar] [CrossRef]
  15. Gallo, B.M.; El-Genk, M.S.; Tournier, J.-M. Compressor and Turbine Models of Brayton Units for Space Nuclear Power Systems. AIP Conf. Proc. 2007, 880, 472–482. [Google Scholar]
  16. Dunn, J.H. Post-Test Inspection of Three Brayton Rotating Units—NASA Technical Reports Server (NTRS-TM-X-67841). Available online: https://ntrs.nasa.gov/archive/nasa/casi.ntrs.nasa.gov/19710015891.pdf (accessed on 17 July 2024).
  17. AIRESEARCH. Design and Fabrication of a High-Performance Brayton-Cycle Compressor Research Package Final Report, (APS-5109-R). 1965. Available online: https://ntrs.nasa.gov/citations/19660009882 (accessed on 17 July 2024).
  18. AIRESEARCH. Design and Fabrication of a Brayton-Cycle Turbine Research Package, (NASA-CR-54367). 1965. Available online: https://ntrs.nasa.gov/citations/19660014298 (accessed on 17 July 2024).
  19. Zhang, S.; Jiang, Y.; Lin, H.; Zheng, Q. Effects of splitter blade length and circumferential position on performance of helium-xenon centrifugal compressor. J. Eng. Therm. Energy Power 2022, 37, 49–56+64. [Google Scholar]
  20. Wang, G.; Liu, X.; Gao, J.; Zheng, Q. Influence of form of tip gap on aerodynamic performance of centrifugal compressor using mixture of helium and xenon. J. Aerosp. Power 2020, 35, 1304–1314. [Google Scholar]
  21. Liu, X. Investigation on Aerodynamic Design and Flow Characteristics of Centrifugal Compressor Using Helium and Xenon. Master, Harbin Engineering University. 2019. Available online: https://www.doc88.com/p-90229358618595.html (accessed on 17 July 2024).
  22. Yuan, Z.; Zheng, Q.; Yue, G.; Jiang, Y. Performance Evaluation on Radial Turbines with Potential Working Fluids for Space Closed Brayton Cycle. Energy Convers. Manag. 2021, 243, 114368. [Google Scholar] [CrossRef]
  23. Gallo, B.M.; El-Genk, M.S. Brayton Rotating Units for Space Reactor Power Systems. Energy Convers. Manag. 2009, 50, 2210–2232. [Google Scholar] [CrossRef]
  24. Tournier, J.-M.P.; El-Genk, M.S. Properties of Noble Gases and Binary Mixtures for Closed Brayton Cycle Applications. Energy Convers. Manag. 2008, 49, 469–492. [Google Scholar] [CrossRef]
  25. Zhang, S.-W. Optimal Design of Helium Xenon Centrifugal Compressor and Experimental System Simulation Research; Harbin Engineering University Harbin: Harbin, China, 2023. [Google Scholar]
  26. Japikse, D. Centrifugal Compressor Design and Performance; Concepts ETI: Wilder, VT, USA, 1996. [Google Scholar]
  27. Stahler, A.F. The slip factor of a radially bladed centrifugal compressor. Trans. ASME J. Eng. Power Ser. A 1959, 87, 181. [Google Scholar] [CrossRef]
  28. Dixon, S.L.; Hall, C.A. (Eds.) Fluid Mechanics and Thermodynamics of Turbomachinery. In Fluid Mechanics and Thermodynamics of Turbomachinery, 7th ed.; Elsevier: Amsterdam, The Netherlands, 2014; pp. 529–537. [Google Scholar]
Figure 1. Compressor meridian structure diagram.
Aerospace 11 00869 g001
Figure 2. Characteristic lines of different inlet hub ratios: (a) Flow–efficiency; (b) Flow–pressure ratio.
Aerospace 11 00869 g002
Figure 3. Characteristics of inlet anterior tilt angle of different impellers: (a) Flow–efficiency; (b) Flow–pressure ratio.
Aerospace 11 00869 g003
Figure 4. Characteristic lines of different blade numbers: (a) Flow–efficiency; (b) Flow–pressure ratio.
Aerospace 11 00869 g004
Figure 5. Relative diameter characteristics lines of different diffusers: (a) Flow–efficiency; (b) Flow–pressure ratio.
Aerospace 11 00869 g005
Figure 6. Impeller inlet and outlet velocity triangle: (a) Impeller inlet; (b) Impeller outlet.
Aerospace 11 00869 g006
Figure 7. Volute model.
Aerospace 11 00869 g007
Figure 8. Schematic diagram of a grid.
Aerospace 11 00869 g008
Figure 9. Grid independence verification: (a) Single machine—no volute; (b) Whole machine—with volute.
Aerospace 11 00869 g009
Figure 10. Characteristic line of helium–xenon compressor without volute: (a) Flow–efficiency; (b) Flow–pressure ratio.
Aerospace 11 00869 g010
Figure 11. Characteristic lines of He-Xe compressor with a volute at different speeds: (a) Flow–efficiency; (b) Flow–pressure ratio.
Aerospace 11 00869 g011
Figure 12. Static pressure envelope of blade surface with different blade heights under various flow rates: (a) Near stall point; (b) Design point; (c) Near blockage point.
Aerospace 11 00869 g012
Figure 13. Relative Mach number in impeller passage with different flow rates: (a) Near stall point; (b) Design point; (c) Near blockage point.
Aerospace 11 00869 g013
Figure 14. Static entropy distribution of impeller passage with different flow rates: (a) Near stall point; (b) Design point; (c) Near blockage point.
Aerospace 11 00869 g014
Figure 15. The meridian velocity of the radial cross-section at different speeds and different flow rates: (a) 90% N-0.9 Q; (b) 100% N-1.0 Q; (c) 110% N-1.1 Q.
Aerospace 11 00869 g015
Figure 16. Total pressure loss coefficient and circumferential static pressure line of different radial cross-sections in the design: (a) Total pressure loss coefficient; (b) Circumferential static pressure line.
Aerospace 11 00869 g016
Figure 17. Vector diagram of relative velocity direction of 50% section of volute and diffuser in Z-axis direction.
Aerospace 11 00869 g017
Figure 18. Static entropy diagram of the whole flow passage at different speeds and different flow rates: (a) 90% N-0.9 Q; (b) 100% N-1.0 Q; (c) 110% N-1.1 Q.
Aerospace 11 00869 g018
Figure 19. Total pressure loss coefficient and circumferential static pressure line of different radial cross-sections near the stall point: (a) Total pressure loss coefficient; (b) Circumferential static pressure line.
Aerospace 11 00869 g019
Figure 20. Static entropy diagram of the whole passage near stall point at different speeds: (a) 90% N; (b) 100% N; (c) 110% N.
Aerospace 11 00869 g020
Figure 21. Total pressure loss coefficient and circumferential static pressure line of different radial cross-sections near the blockage point: (a) Total pressure loss coefficient; (b) Circumferential static pressure line.
Aerospace 11 00869 g021
Figure 22. Static entropy diagram of the flow passage near the blocking point at different speeds: (a) 90% N; (b) 100% N; (c) 110% N.
Aerospace 11 00869 g022
Table 1. Main physical properties of common working fluids.
UnitHeXeAir40 g/mol15 g/mol
Mean molal quantityg/mol4.00131.2928.9540.0015.00
Specific heat at constant pressureJ/(kg·K)5192.9164.51020.0520.91386.3
Ratio of specific heat-1.66581.71211.40221.66911.6663
Thermal conductivityW/(m·K)0.19090.00740.03320.08290.1437
Dynamic viscosityμPa·s24.310630.751423.185332.988830.2024
Prandtl number-0.66140.68510.71310.20730.2913
Sound velocitym/s1007.9204.7402.0367.4607.8
Table 2. Compressor inlet parameters.
Performance ParameterUnitNumerical Value
Inlet pressurekPa701.9
Entry temperatureK400
Revolution speedr/min45,000
The flow of system operationkg/s0.866
Total pressure ratio-1.34
Table 3. Main design parameters of the impeller.
Performance ParameterUnitNumerical Value
Inlet pressurekPa701.9
Entry temperatureK400
Revolution speedr/min45,000
Number of leaves-13
The flow of system operationkg/s0.866
Impeller inlet blade angle°39.81°
Impeller outlet blade angle°30.09°
The backbend angle of the impeller outlet°−30°
Tip clearancemm0.2
Impeller compressor inlet hub radiusmm13.0
Radius of compressor inlet rimmm32.6
Compressor outlet radiusmm72.6
Diffuser outlet radiusmm108.9
Table 4. Some parameters of the helium–xenon compressor.
Performance ParameterUnitNumerical Value
Inlet pressurekPa701.9
Inlet temperatureK400
Revolution speedr/min45,000
Number of leaves-13
The flow of system operationkg/s0.866
Impeller inlet blade angle°39.81°
Impeller outlet blade angle°30.09°
Slip coefficient-0.864
Impeller compressor inlet hub radiusmm13.0
Radius of compressor inlet rimmm32.6
Compressor outlet radiusmm72.6
Diffuser outlet radiusmm108.9
Volute inlet diametermm217.9
Volute casing inlet widthmm8.0
Volute diffuser lengthmm203.3
Outlet diameter of volute diffusion tubemm74.6
The angle of the spiral line where the volute tongue is located°34.7
Total pressure ratio-1.368
Isentropic efficiency-83.94%
Polytropic efficiency-84.9%
Disclaimer/Publisher’s Note: The statements, opinions and data contained in all publications are solely those of the individual author(s) and contributor(s) and not of MDPI and/or the editor(s). MDPI and/or the editor(s) disclaim responsibility for any injury to people or property resulting from any ideas, methods, instructions or products referred to in the content.

