Article

Investigating the Role of Extreme Synoptic Patterns and Complex Topography During Two Heavy Rainfall Events in Crete in February 2019

by
Konstantinos Lagouvardos
1,*,
Stavros Dafis
1,2,
Christos Giannaros
1,
Athanassios Karagiannidis
1 and
Vassiliki Kotroni
1
1
Institute for Environmental research and Sustainable Development, National Observatory of Athens, 15236 Athens, Greece
2
LMD/IPSL, CNRS UMR 8539, École Polytechnique, Sorbonne Universités, 91128 Palaiseau, France
*
Author to whom correspondence should be addressed.
Climate 2020, 8(7), 87; https://doi.org/10.3390/cli8070087
Submission received: 26 May 2020 / Revised: 2 July 2020 / Accepted: 9 July 2020 / Published: 16 July 2020
(This article belongs to the Special Issue Precipitation: Forecasting and Climate Projections)

Abstract

:
During February 2019, two severe storms affected the island of Crete, located in south Greece. Both storms produced excessive rainfall, provoking severe damages, especially in the western part of Crete. The role of the prevailing synoptic patterns and the interaction of the flow with the high mountains of Crete were investigated. For this purpose, a variety of observational and numerical model data were exploited, including data from a dense rain gauge network, satellite imagery, and model analysis of various parameters describing the stability of the impinging flow. The first storm was a long-lasting event, with convective outbreaks embedded in a more stratiform rainfall pattern. The second storm was brief but mostly convection dominated. The analysis of the available data underlined the role of the low-level convergence upstream of the mountains during both storms, highlighting similarities and differences, as well as the role of the stability of the impinging flow. High soil moisture content was also evidenced as a key ingredient for the severe flooding that occurred during the second storm. This work complements similar studies on the role of Mediterranean islands and their topography on the spatial and temporal distribution of extreme rainfall.

1. Introduction

It is well known that large islands in the Mediterranean Sea interact with low-pressure systems that form and develop over the basin, especially during autumn and winter months, thus modulating the distribution, intensity, and persistence of rainfall patterns. During the last decade, many studies have been devoted to the investigation of the role of large western Mediterranean islands on the rainfall regime, mainly in the frame of the HYdrological cycle in the Mediterranean Experiment (HYMEX) [1]. Scheffknecht et al. [2] presented a 30-year climatology of rainfall over Corsica (1985–2015) and identified that warm southeasterly flow that occurs predominantly in autumn produces the most extreme events in the island. Ehmele et al. [3] presented an interesting work on the influence of Sardinia on the rainfall distribution over Corsica. The authors analyzed six cases of heavy rainfall events over Corsica and highlighted how the position and translation speed of frontal systems over Corsica depend on the orography of the neighboring island of Sardinia. The wind direction can be the determining factor for the initiation of deep convection over a mountainous island, thus controlling the location of rainfall, as demonstrated through the use of high-resolution model simulations over Corsica [4]. The role of the integrated water vapor for the preconditioning of heavy rainfall events over Corsica was investigated by Adler et al. [5]. The authors used data from an operational Global Positioning System (GPS) network, radiosondes, and microwave radiometers, in order to map the spatio–temporal distribution of water vapor and to understand its role on the timing and location of isolated deep convection over the island. As inferred by the aforementioned studies, Corsica is a natural laboratory for the study of heavy rainfall events over the area of the western Mediterranean and is therefore an ideal place for the operation of CORSiCA (Corsican Observatory for Research and Studies on Climate and Atmosphere-ocean environment), a project for a multi-site instrumented platform located on the island [6]. More recently, Coquillat et al. [7] and Erdmann et al. [8] installed in Corsica SAETTA, a network of 12 lightning mapping array stations that allows the 3-D mapping of total lightning activity in the area. Data from SAETTA helped to identify the distribution of thunderstorm/lightning activity in the broader area of Corsica with unprecedented detail in space and time. Such facilities provided and still provide valuable data for the monitoring of heavy rainfall over the island and for the better understanding of their dynamics and interaction with the island’s topography.
As it concerns the Balearic islands, Ramis et al. [9] analyzed a long time series of rainfall records over Mallorca island and identified that the highest rainfalls recorded occurred in the mountainous northern area of the island of Mallorca, close to the highest peaks of the main range of the island, especially during winter. The maximum yearly rainfall in the Balearic Islands occurs in autumn [10] and heavy rainfall events are related with cyclogenetic activity in the region. Accumulated 24-h rainfall can reach 100 mm and for some events may exceed 200 mm, so some rain days may account for more than half of the monthly totals, and such events produce severe floods while they may also result in flood-related fatalities [11].
Compared to the existing literature on heavy rainfall events over large and mountainous islands of the western Mediterranean, relatively few studies have investigated so far the role of an eastern Mediterranean island, namely Crete, on the modification and distribution of rainfall. The two exceptionally heavy rainfall events that occurred in February 2019 in Crete provide a valuable frame for exploring the conditions that led to the onset and distribution of rainfall over the island, thus permitting a more coherent image to be drawn of the interaction of low-pressure systems and large islands across the Mediterranean basin.
The main objective of this paper was to present the synoptic and mesoscale features that led to the onset of the two devastating storms and to discuss similarities and differences among them. The analysis was based on the combined use of all available sources of data (rain gauge, satellite imagery and active sensor data, lightning, model analyses). It is of paramount importance to understand the processes that contributed to the persistence of the storms and investigate the interaction of the local topographical features with the large-scale circulation, which both contributed to the high rainfall accumulations over the western part of the island. This knowledge is necessary in order to raise the level of preparedness of the meteorological and hydrological community in future situations that may have the characteristics of the two storms analyzed in this paper.
The rest of the paper is organized as follows: Section 2 describes the study area, the data sources, and, briefly, the used methodology. Section 3 presents the rainfall distribution during the two storms; it discusses the synoptic environment within which the two storms developed, its departure from the climatological means, while the convective motions associated with the storms are scrutinized based on the analysis of satellite imagery. In the same section, the analysis of soil moisture conditions during the period of the two storms, as inferred by remote sensing data, is discussed. Finally, Section 4 provides the overall synthesis of the two storms, discusses the role of orography on the distribution of rainfall, highlights the role of microphysics within the clouds, and gives some prospects for future work.

2. Study Area, Data, and Methodology

2.1. Study Area

Crete island is located at the southern part of Greece, with a surface of 8336 km2, the fifth in rank among the Mediterranean islands in terms of size, and slightly smaller in size than Corsica. Figure 1 shows the major topographic features of the island of Crete. The two highest mountain ranges of Crete (White Mountains on the western part and Mount Idi on the central part of the island) are the third highest peaks in the Mediterranean islands, after Mount Etna in Sicily and Monte Cinto in Corsica. The position of the island far from inland areas, its wide shape with complex topography and high mountains mainly in its western part, and its orientation relative to the prevailing winds play an important role on the formation of the climate conditions in the area [12] and on the considerable spatial variability of the rainfall regime across the island.
Overall, the climate of Crete is of Mediterranean type, with prolonged dry periods during spring and summer and a wet period, mainly spanning from mid-September through mid-April. Tzoraki et al. [13] reported that over the mountains of western Crete rainfall is 8 times higher than that over the coastal areas of the island. According to the dense network of weather stations operated by the National Observatory of Athens (NOA) in Crete during the last decade [14], the stations close to the main mountain ranges on the western part of the island receive an average annual rainfall exceeding 1600 mm of rain, which is comparable to the annual rainfall recorded over the western and more mountainous parts of mainland Greece.
Koutroulis et al. [15] investigated flood events in Crete during the period 1990–2007 and found that ~66% of the events occurred in the western part of the island, while concerning their seasonality, the authors reported that ~50% of the flooding events occurred in November and December. As it concerns the lightning activity over the broader area of Crete, Kotroni and Lagouvardos [16] and Galanaki et al. [17] showed that the maximum activity is found during autumn months, with a local maximum offshore the western coasts of the island. During winter months, lightning activity is substantially reduced, with the maximum values found over the maritime area around the western part of the island.
During summer, rainfall events are rare and the weather regime over the island is mainly influenced by the Etesians (northern section winds, see Kotroni et al. [12]). Analysis of rainfall provided on the dense surface network operated by NOA on the island (https://stratus.meteo.gr/front) showed that during spring and summer rainfall is about 20% of the total amounts occurring during autumn and winter.
In February 2019, two high-impact storms affected the island. During these two storms, more than 1000 mm of rain were accumulated in some stations over the western (and more mountainous parts of the island). It is worth mentioning that in Askyfou station (denoted by AS in Figure 1), more than 1250 mm of rain was accumulated in total during February, among the top highest monthly accumulation recorded known in Greece. Indeed, analysis of past rainfall data from a rain gauge at Askyfou that operated from 1960 up to 2004 revealed that this value of 1250 mm is the highest ever recorded during February in this location.
The first storm, named Chioni by the National Observatory of Athens, lasted from 13 to 17 February 2019, produced high rainfall amounts and surface runoff that provoked considerable damages, and 4 people drowned in the central-southern part of the island (denoted by red diamonds and crosses in Figure 1, respectively). As discussed later in Section 3.4, the first storm moistened the ground, thus enhancing the vulnerability of the area (mainly over western Crete) to the hydrological impacts of the subsequent rainfall episodes.
The second storm, named Oceanis, despite its shorter duration (between 24 and 26 February 2019), produced even higher rainfall amounts over western Crete. The damages that occurred during this event (denoted by blue diamonds in Figure 1) were far more severe, with several collapsed bridges, widespread landslides, and a severely crippled transportation network over the western parts of the island.

2.2. Data Sources

The National Observatory of Athens operates a network of 48 automatic surface weather stations on the island of Crete that are monitoring all basic meteorological variables at 10-min intervals [14]. The NOA network is complemented by 14 stations operated by the Autonomous Region of Crete. Both networks provide data in real time to the Digital Observatory of Crete (see https://www.meteo.gr/crete). In the absence of operating weather radars, the combined weather station network allows the real-time monitoring of the evolution of the rainfall distribution during high-impact rainfall events and served as a basis for the rainfall analysis of the two storms. It should be noted that the availability of these data in real time and the high update frequency (10-min) was of tremendous help during the evolution of both storms, from an operational point of view. The observational analysis based on the ground-based stations was assisted in the current study by profiles obtained from soundings performed at Heraklion airport (Figure 1).
The synoptic conditions during the events were investigated using the Final Operational Global Analysis of the National Center for Environmental Prediction (NCEP FNL) at a 0.25° × 0.25° spatial and 6-h temporal resolution, while the examination of the convective activity was conducted based on the METEOSAT satellite imagery. Additionally, the National Centers for Environmental Protection (NCEP) 40-Year Reanalysis Project dataset [18] was used to compute climatological parameters. The dataset has a 2.5° × 2.5° resolution at 17 pressure levels, and for the current study, the 1981-2010 climatology period was used. In order to examine the possible contribution of saturated soil to the floods observed during Chioni and Oceanis storms, satellite observations from the Soil Moisture Active-Passive (SMAP) satellite were used. The product of SMAP L4 Global 3-hourly 9 km EASE-Grid Surface and Root Zone Soil Moisture Analysis Update, Version 4 (SPL4SMAU; [19,20]) provides observations of volumetric 0–5 cm vertically averaged soil moisture at a high temporal and spatial resolution.

2.3. Methodology

The analysis of the two cases was based on:
(a) The investigation of rainfall distribution as inferred by a dense network of automatic weather stations over the island. This work included analysis of the distribution of observed rainfall height against the elevation of the stations.
(b) The presentation and discussion of the synoptic settings that prevailed during both storms as well as comparison with the climatological means. This discussion comprises analysis of mean sea level pressure maps as well as of geopotential height at the 500-hPa level, in order to draw the synoptic setting into which both storms developed. A comparison with the climatological means of the 500 hPa geopotential height was performed, in order to show the deviations from the mean distribution that may explain the extreme behavior of both storms. Moreover, maps of the effective precipitable water and low-level wind flow permitted detection of the organized convergence of mass in the boundary layer that play an important role in triggering and organizing rainfall patterns. The interaction of this flow with the island’s orography was investigated through calculation of the Froude number, which is known to express the extent of blocking of the flow by the mountain barriers.
(c) The analysis of satellite imagery, permitting depiction of the nature of rainfall (convective versus stratiform) and the comparison with rainfall accumulations at ground. Successive satellite imagery at the infrared and water vapor channels helped to detect the various phases of the evolution of both storms and to identify the convective or stratiform nature of rainfall of each phase. This analysis was assisted by inspection of high-resolution rainfall measurements at ground, which presented a remarkable match with the satellite imagery.
(d) The examination of soil moisture distribution over the flooded areas of western Crete, based on remote sensing data and discussion on the role of the preconditioning of soil moisture during the subsequent days of rainfall in the resulted floods.
The same methodological analysis was performed for both storms with the aim of highlighting the similarities as well as the differences between them. The final aim was to assess the features and mechanisms that contributed to the extreme nature of total accumulated rainfall over the western part of Crete, which in turn was responsible for the widespread damages.

3. Results

3.1. Rainfall Distribution of the Two Storms

Figure 2 presents the accumulated rainfall over the island during the lifetime of each storm. Both storms present similar characteristics, with the highest total amounts over the western part of the island, although the accumulated rainfall was much higher during the second storm. This distribution follows in a consistent way the climatological distribution of rainfall (e.g., [13]). It should be noted, however, that during the first storm, large amounts of rainfall were also recorded over the central and eastern parts of the island, while during the second storm, rainfall was intense and spatially limited in the western part of Crete. For a better description of the day-to-day distribution of rainfall, Figure A1 and Figure A2 (Appendix A) show daily accumulated isohyets for both storms.
It is of interest to investigate the distribution of rainfall with respect to the topographic height of the rain gauges. As can be seen in Figure 3, relatively low rainfall accumulations (<200 mm in total for each storm) were observed at the lower elevation rain gauges. However, a range between ~400 and 700 m exists, within which the highest accumulated rainfall for both storms was observed, while at higher elevations the rainfall amounts decrease again, as inferred by Samaria station located at 1240 m height (far right points in Figure 3), which is the highest elevation station over western Crete. Similar findings were also reported in Khodayar et al. [21] and Kirshbaum et al. [22]. In the former paper, focused on the western Mediterranean area, the authors underlined that for large-scale and especially convective rainfall, higher accumulations are found at middle-altitude rather than at higher elevations. Notably, the authors reported that the highest amounts of rainfall occurred at heights ~500 m. This behavior, which was highlighted from the rain gauge measurements for both studied storms, can be related to the microphysical properties of the flow impinging a high mountain barrier as it is discussed later in Section 4.

3.2. Synoptic-Scale Setting of the Two Storms

3.2.1. Chioni Storm

The first storm, named Chioni, was associated with a short-wave trough over the eastern Mediterranean, and the corresponding surface cyclonic circulation moving from the area south of Crete towards the east (Figure 4a,b, valid at 1200 UTC 13 February and 0000 UTC 14 February 2019) according to the Final Operational Global Analysis of the National Center for Environmental Prediction (NCEP FNL). During the whole day of 13 February, the low-pressure center was moving slowly south of Crete island, with the central pressure gradually deepening from 1013 to 1009 hPa. In the meantime, the slow progression of the high-pressure system in western Europe eastwards (with a central pressure of ~1038 hPa) favored the establishment of a strong north-northeastern flow over the Aegean Sea towards Crete, which resulted in 10-m wind gusts up to 22 m s−1 in several stations over the Aegean Sea and western Crete around 0000 UTC 14 February 2019.
Starting in the morning of 14 February 2019 and during the following 60-h period, the short-wave trough evolved into a cut-off low over southern Greece (see Figure 4c,d, valid at 1200 UTC 15 February and 0000 UTC 16 February 2019, respectively), while the surface low-pressure center moved eastwards over Cyprus, deepening to 1007 hPa at 1200 UTC 15 February (Figure 4c). The mean sea-level pressure gradient over Greece on 15 and 16 February was reduced and therefore the northern flow over the Aegean Sea weakened considerably. The relevant maps but for the period from 1200 UTC 12 February up to 0600 UTC 13 February are shown in Figure A3 (Appendix B), thus permitting a more complete picture of the evolving synoptic situation.
The first phase of the event (approximately within the time period spanning between 0900 UTC 13 February and 0000 UTC 15 February 2019) provoked heavy rainfall over the western part of the island. Figure 5 shows the 1-h accumulated rainfall at Asigonia (AG), Sebronas (SB), and Askyfou (AS) stations (see Figure 1 for the location of the stations). It is remarkable that all three stations, which are located about 50 km apart and at mid-level altitude, presented similar temporal rain-rate evolution during the first phase, although the total accumulated rainfall was 140 mm at AG, 215 mm at AS, and 300 mm at SB. This phase in SB and AS produced more than 50% of the total rainfall measured during this storm.
During this second phase of the storm, namely on 15 February (Figure 5), the rain rate was weaker, possibly produced by stratiform clouds, with total daily accumulations at the three stations varying between 20 and 45 mm. Finally, the third phase of the storm, namely on 16 February (Figure 5), showed sudden peaks in the rain rate records, associated with some convective outbreaks embedded in the stratiform rainfall. At Asigonia station, 184 mm were accumulated in 36 h (0000 UTC 16 February–1200 UTC 17 February, Figure 5). Finally, the rainfall stopped on the evening of 17 February, while the low-pressure system was gradually filled and dissipated in the vicinity of Crete.
As highlighted in Weller et al. [23], organized convergence of mass in the boundary layer plays an important role in triggering and organizing rainfall patterns, while the associated moisture flux provides the necessary water for sustained rainfall. Therefore, a map of effective precipitable water (EPWAT) and low-level convergence shows in a coherent way the advection of moist air masses and the low-level convergence over the mountainous area of western Crete. The EPWAT is calculated by the subtraction between the model-derived precipitable water and the vertically integrated saturation deficit. The choice of showing the EPWAT, instead of the precipitable water, helps to identify the areas with the highest tropospheric moisture that can be precipitated.
Figure 6a presents the aforementioned fields valid at 1200 UTC 13 February, when approximately the first and more extreme phase (in terms of accumulated rainfall) of the storm was initiated in west Crete (see Figure 5). Three key features are evident in Figure 6a:
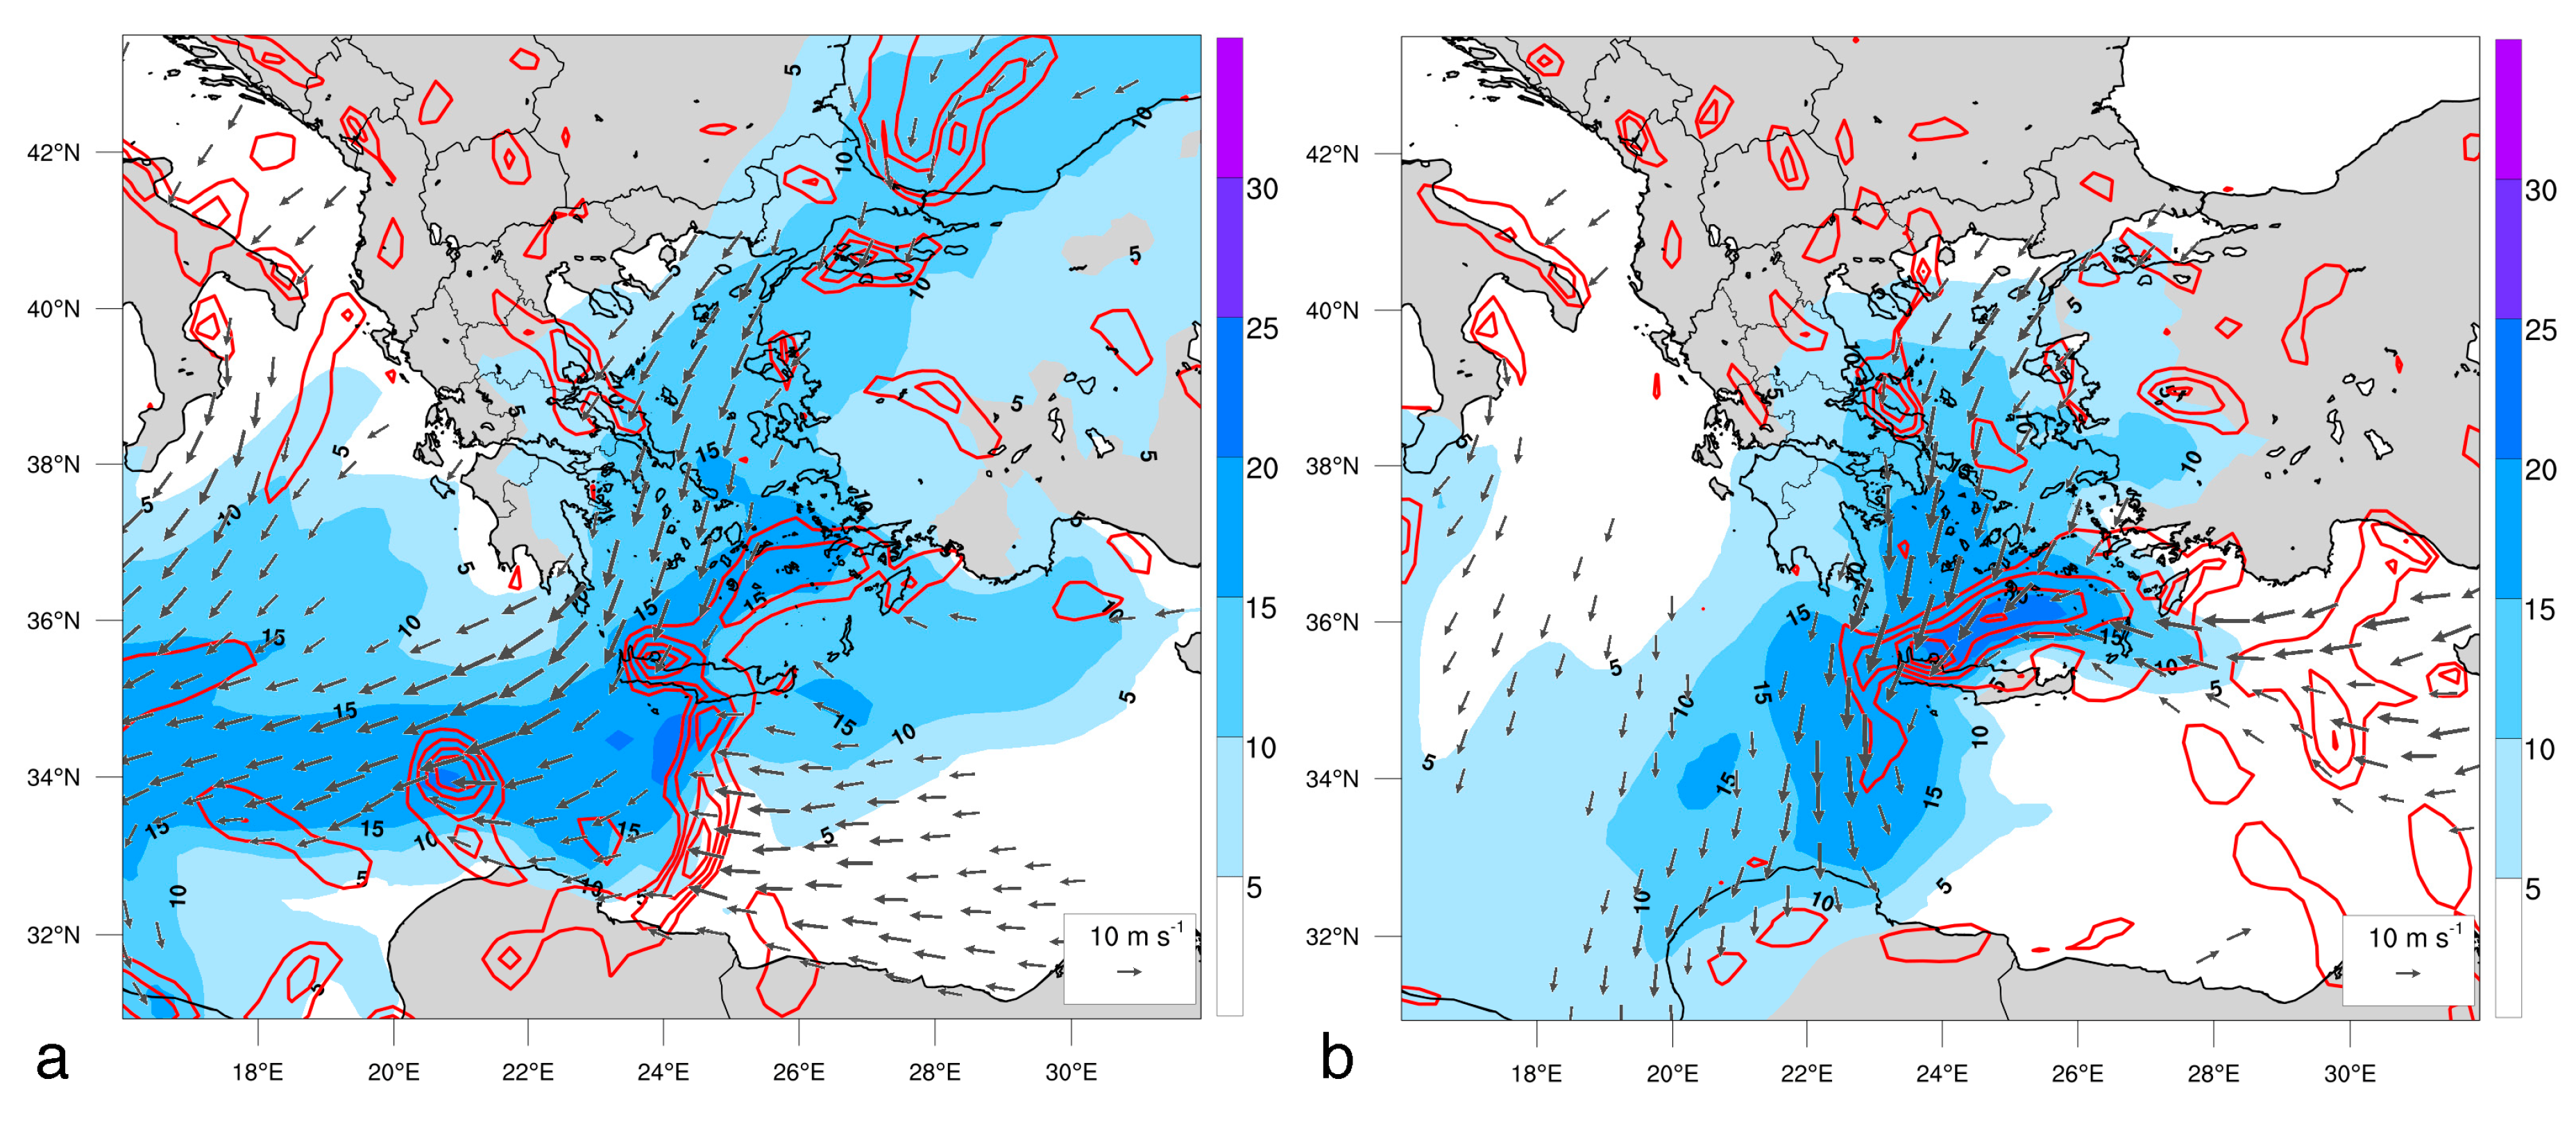
  • A “river” of high EPWAT spanning over the Aegean Sea towards Crete.
  • High values of 10-m wind speed, up to 18 m s−1 offshore the northern coasts of Crete. These values are in close agreement with surface observations from stations located over the Aegean and west Crete.
  • Strong low-level convergence in the windward side of the western White Mountains, reaching 2 × 10⁻⁴ × s−1.
The same pattern was also evident 18 h later, at 0600 UTC 14 February (Figure 6b), when the low-level flow was much more intensified over the maritime area north of Crete (up to 20–22 m s−1), while a slightly weaker low-level convergence zone was evident over the whole northern part of the island.
These aforementioned conditions played an important role in sustaining a constant strong moist airflow towards Crete and especially towards its mountainous western part. The subsequent interaction of this flow with the island’s orography is known to be modulated by the extent of blocking of the flow by the mountain barriers. Houze [24], on his seminar paper discussing the orographic effects on rainfall, distinguishes unblocked and blocked flow and concludes on how the degree of stability of the impinging flow results in the microphysical growth of particles in the windward side of the barrier and hence on the distribution and intensity of rainfall. The degree of blocking is modulated by the Froude number (Fr), which is inversely proportional to the moist Brunt–Väisälä frequency Nm; hence, the Froude number is:
F r = U / ( h   N m ) ,
where U is the impinging low-level wind and h the height of the mountain range.
Calculation of the Nm during the first phase of Chioni, offshore the northern coasts of western Crete, reveals values of ~0.25 × 10⁻² s−1 that, for an impinging flow of ~20 m s−1 and a barrier height of approximately 2100 m, leads to a large Froude number, thus indicating an unstable flow impinging the mountains of west Crete. This feature will be further discussed in Section 4.

3.2.2. Oceanis Storm

The second storm, named Oceanis, was shorter in duration (~72 h) but more intense in terms of accumulated rainfall. A cut-off low was evident at the 500-hPa level at 0000 UTC 25 February 2019, associated with a surface low of 1010 hPa over the northern coasts of Libya (Figure 7a). Twelve hours later, the surface low progressed northeastward, deepening to 1007 hPa south of Crete (Figure 7b). During the following 12 h, the low-pressure system slowly progressed northeastwards, without significant modification of its central pressure (not shown). As in the first storm, the low-pressure system, combined with the anticyclonic circulation over west Europe (~1040 hPa), resulted in very strong northerly flow at the surface over the Aegean Sea and Crete. According to Young and Galvin [25], the high-pressure system shown in Figure 7, associated with a strong upper-air blocking, resulted in record-breaking high temperatures in west Europe on 26 February 2019, setting new February records for some places over the UK.
The pressure gradient over the Aegean Sea was similar to that of the first phase of Chioni, resulting in 10-m winds exceeding 20 m s−1 on 25 February 2019. The relevant maps but for the period from 0000 UTC 24 February up to 1800 UTC 24 February are shown in Figure A4 (Appendix B), thus permitting a more complete picture of the evolving synoptic situation.
Investigation of the temporal evolution of rainfall recorded at the same three weather stations in western Crete (see Figure 8) reveals that the highest amount of accumulated rainfall was recorded from 1500 UTC 24 February up to 2100 UTC 25 February. During this storm, the highest accumulation was observed in Askyfou station, with ~582 mm of total rain.
Figure 9 presents the EPWAT and the low-level convergence at 0000 UTC and 1800 UTC 25 February 2019. The location of the low-level convergence zones is similar to that observed during the initial phase of the first storm (Chioni, see Figure 6), but the magnitude is much higher (with a maximum of 3 × 10⁻⁴ s−1, compared to the 2 × 10⁻⁴ s−1 of the Chioni storm). Moreover, the strong low-level convergence is longer lasting as it remains anchored over western Crete for a substantial number of hours on 25 February. Following the pattern of the first phase of Chioni, the combination of a very strong impinging flow of ~20 m s−1 together with Nm values ranging from 0.25 to 0.30 × 10⁻² s−1 resulted in a rather unblocked flow regime on the windward slopes of White Mountains in western Crete.

3.3. Synoptic-Scale Rank of the Two Storms

Heavy rainfall cold-season events have been associated with important geopotential height anomalies with strong geopotential height gradients and moisture transport (e.g., [26]). For the current study, the quasi-normally distributed confidence limit of the 500-hPa geopotential height [27] was used to rank the synoptic patterns that led to the two examined extreme rainfall events in Crete. Data derived from the NCEP/NCAR 40-Year Reanalysis Project were used to compute the standardized anomalies of daily mean geopotential height at 500 hPa on 14 February 2019 and 25 February 2019 based upon the fixed 30-year period of record from 1981 to 2010. The fields were normalized with respect to the base climatology by:
N = ( X μ ) / σ ,
where X is a grid point with values of the daily mean geopotential height, μ is the 7-day centered mean, and σ is the 7-day centered standard deviation for that field at each grid point. The departure from the normal is given by N. The standardized anomalies (N) scale the anomaly by the standard deviation from the mean and provide a better insight into the significance of an event rather than simply computing the anomalies.
Figure 10 shows N of the 500-hPa geopotential height daily values compared to the 30-year climatology (1981–2010). According to the Chebyshev theorem [28], values greater than 3 for N imply a great departure from the normal distribution, three standard deviations above the normal 500-hPa geopotential height values for that location. Indeed, in a large part of W-NW Europe, in Figure 10, during both Chioni and Oceanis, the anomaly exceeds 3–4. The extreme departures from normal of more than 6 during Oceanis (Figure 10b) show that the geopotential heights have probably never reached such high values at this time of the year. This anomalous pattern was connected with the advection of very cold air masses and instability in the eastern Mediterranean.

3.4. Satellite Imagery and Convective Activity During the Two Storms

Figure 11a,b shows two snapshots of METEOSAT satellite infrared imagery (IR 10.8 μm) valid at 2230 UTC 13 February and at 0600 UTC 14 February. These timestamps of the first phase of the Chioni storm were selected as they were characterized by peaks of rain rate in many stations (see Figure 5). Bands of cloud tops with brightness temperatures lower than 225 K are evident over western Crete. Taking into account the sounding performed at 0000 UTC at Heraklion airport (see Figure 1 for the location), this temperature corresponds to a height exceeding 8000 m. Cloud base, as inferred by calculation of the lifting condensation level from the same sounding, was at ~910 hPa, or ~800 m above mean sea level, well under the height of the White Mountains. During the second phase of the storm (e.g., at 15 February, see Figure 11c,d), infrared (IR) imagery showed characteristics of stratiform cloud formation, with cloud tops’ brightness temperatures higher than 260 K, which approximately correspond to ~3500 m above mean sea level cloud tops.
Better insight into the evolution of cloud tops and convective activity during the lifetime of the Chioni storm is given in Figure 12, in which the brightness temperature of cloud tops from the METEOSAT 10.8 μm channel for the location of Askyfou station is plotted, together with 10-min rainfall records from the corresponding station. On the same plot, asterisks denote the time periods during which the brightness temperature difference between the METEOSAT water vapor and infrared channel (WV 6.2 μm – IR 10.8 μm) exceeds −4 K, a value indicating convective activity [29,30]. Inspection of this graph reveals that several convective cells were embedded in a more uniform and rather stratiform rainfall regime, especially during the first two days of the event. During the second phase of the storm, namely on 15 February, cloud top brightness temperatures over the area ranged between 260 and 265 K, which correspond to a height of ~ 3200–3600 m. These rather low cloud tops indicate the presence of stratiform clouds, in good agreement with the relatively low rain rates recorded by the weather stations at the ground and the absence of lightning activity (not shown).
Figure 13 provides METEOSAT IR 10.8μm imagery valid at 0000 UTC 25 February 2019, during the second storm Oceanis. The cold cloud tops over western Crete are found above the same location with the strong low-level convergence zone shown in Figure 9a. The cloud top brightness temperatures of ~220 K correspond to a height of ~9500 m, while the lifting condensation level, calculated based on the Heraklion sounding measurements, was at ~955 hPa or ~550 m above mean sea level, indicating deep cloud layers on the windward side of the White Mountains.
The convective activity during the lifetime of the Oceanis storm can be studied through inspection of Figure 14. Convective cells were extending higher up and were more persistent over west Crete, especially during the first 18 h of the day on 25 February, when the minimum IR 10.8 μm brightness temperature was below 230 K and the total accumulated rainfall at AS station exceeded 310 mm. This “more convective” nature of the second storm is also in good agreement with the strongest impinging flow over western Crete as well as the much stronger and time-persistent low-level convergence depicted in Figure 9a,b.

3.5. Soil Moisture

Soil moisture conditions prior to a heavy rainfall event play an important role on surface runoff, and on many occasions, saturated soil can accentuate the consequences of heavy rainfall. For instance, Kumar et al. [31] and Houze et al. [32] underlined the influence of soil moisture on flooding and landslides in the Himalaya region and how subsequent heavy rainfall episodes can rapidly increase the flooding vulnerability of a specific area.
Figure 15 shows the evolution of soil moisture (averaged over the northwestern part of Crete) and Askyfou rainfall during February 2019. A first moderate rainfall episode that occurred over western Crete between 5 and 8 February 2019 increased the surface soil moisture close to saturation, from 0.35 to 0.42 cm3 cm−3. During the dry period 9–13 February, soil moisture decreased to 0.36 cm3 cm−3, a value slightly higher than the first days of the month. The Chioni storm (13–17 February) quickly resulted in a soil moisture peak of 0.42 cm3 cm−3 and remained high during the lifetime of this event. Again, during the dry period between the two storms, soil moisture decreased again, but to a higher value (0.38 cm3 cm−3) compared to that before the Chioni storm. As a consequence, rainfall associated with the second storm affected the already highly moist soil, while the peaks of rainfall on 25 February resulted in peaks of soil moisture reaching 0.43 cm3 cm−3, the highest observed value during the whole month.
Evidently, the damaging floods during the second storm (Oceanis) were far more widespread than during the first storm (Chioni), not only due to the higher rain rates but also due to the preconditioning of the soil moisture over western Crete. Similar results were also found in heavy rainfall events in the Himalayas, as discussed by Houze et al. [32]. Satellite monitoring of soil moisture can therefore be a very useful tool, which in combination with rainfall forecasts can help forecasters develop and adjust their warnings not only based on the expected rainfall but also on the pre-event soil moisture conditions in a particular region.

4. Discussion—Concluding Remarks

The two storms analyzed in this paper are among the heaviest rainfall events that occurred on the island of Crete during the last decades. Unfortunately, the rain gauge network over Crete was relatively sparse and it is only during the last decade that the network became dense after the implementation and expansion of the NOA network of automatic weather stations over the Greek territory [14]. Nevertheless, by taking into account reports in the local media on past disasters in the area, it can be inferred that the severity of the two storms was of an unprecedented extent at least since the flood event of December 1967.
During both storms, the interaction of the impinging flow from the southern Aegean Sea towards Crete and the White Mountains presented the behavior discussed conceptually by Houze [24], Medina and Houze [33], and Rotunno and Houze [34]. These papers investigated how the degree of instability of the impinging flow modulates the nature of rainfall (stratiform and/or convective) and consequently the complex microphysical transformations within the clouds developed on the windward side of large barriers. More precisely, the aforementioned authors, based on radar observations on the alpine region, underlined the processes of coalescence within the warm part of the cloud and of riming of supercooled droplets at levels above the 0 °C isotherm on the generation of rainfall on the windward parts of the alpine complex orography. Their results permitted the rainfall mechanisms involved in a complex topography environment to be drawn in a conceptual way.
The degree of instability of the impinging flow is determined by the Froude number. As discussed earlier in Section 3.2, during the first phase of the Chioni storm, the flow was unblocked, which led to embedded convective cells. A blocked flow situation was evident during the second phase, resulting in weaker rain rates over western Crete. During the second storm, Oceanis, the flow was more unstable and strong, resulting in a large Froude number and hence unblocked flow. A case of unblocked flow can result in a more effective rainfall production, as happened with the high rainfall amounts that occurred within a shorter time period during Oceanis.
Although it is not recommended to describe the interaction of rainfall with orography with oversimplified schemes (blocking/no blocking), especially for long-lasting storms during which the degree of stability can vary substantially, the conceptualization proposed by the aforementioned work is a useful frame to set the physical mechanisms that led to the extreme nature of both storms rainfall patterns. Therefore, the following characteristics are drawn:
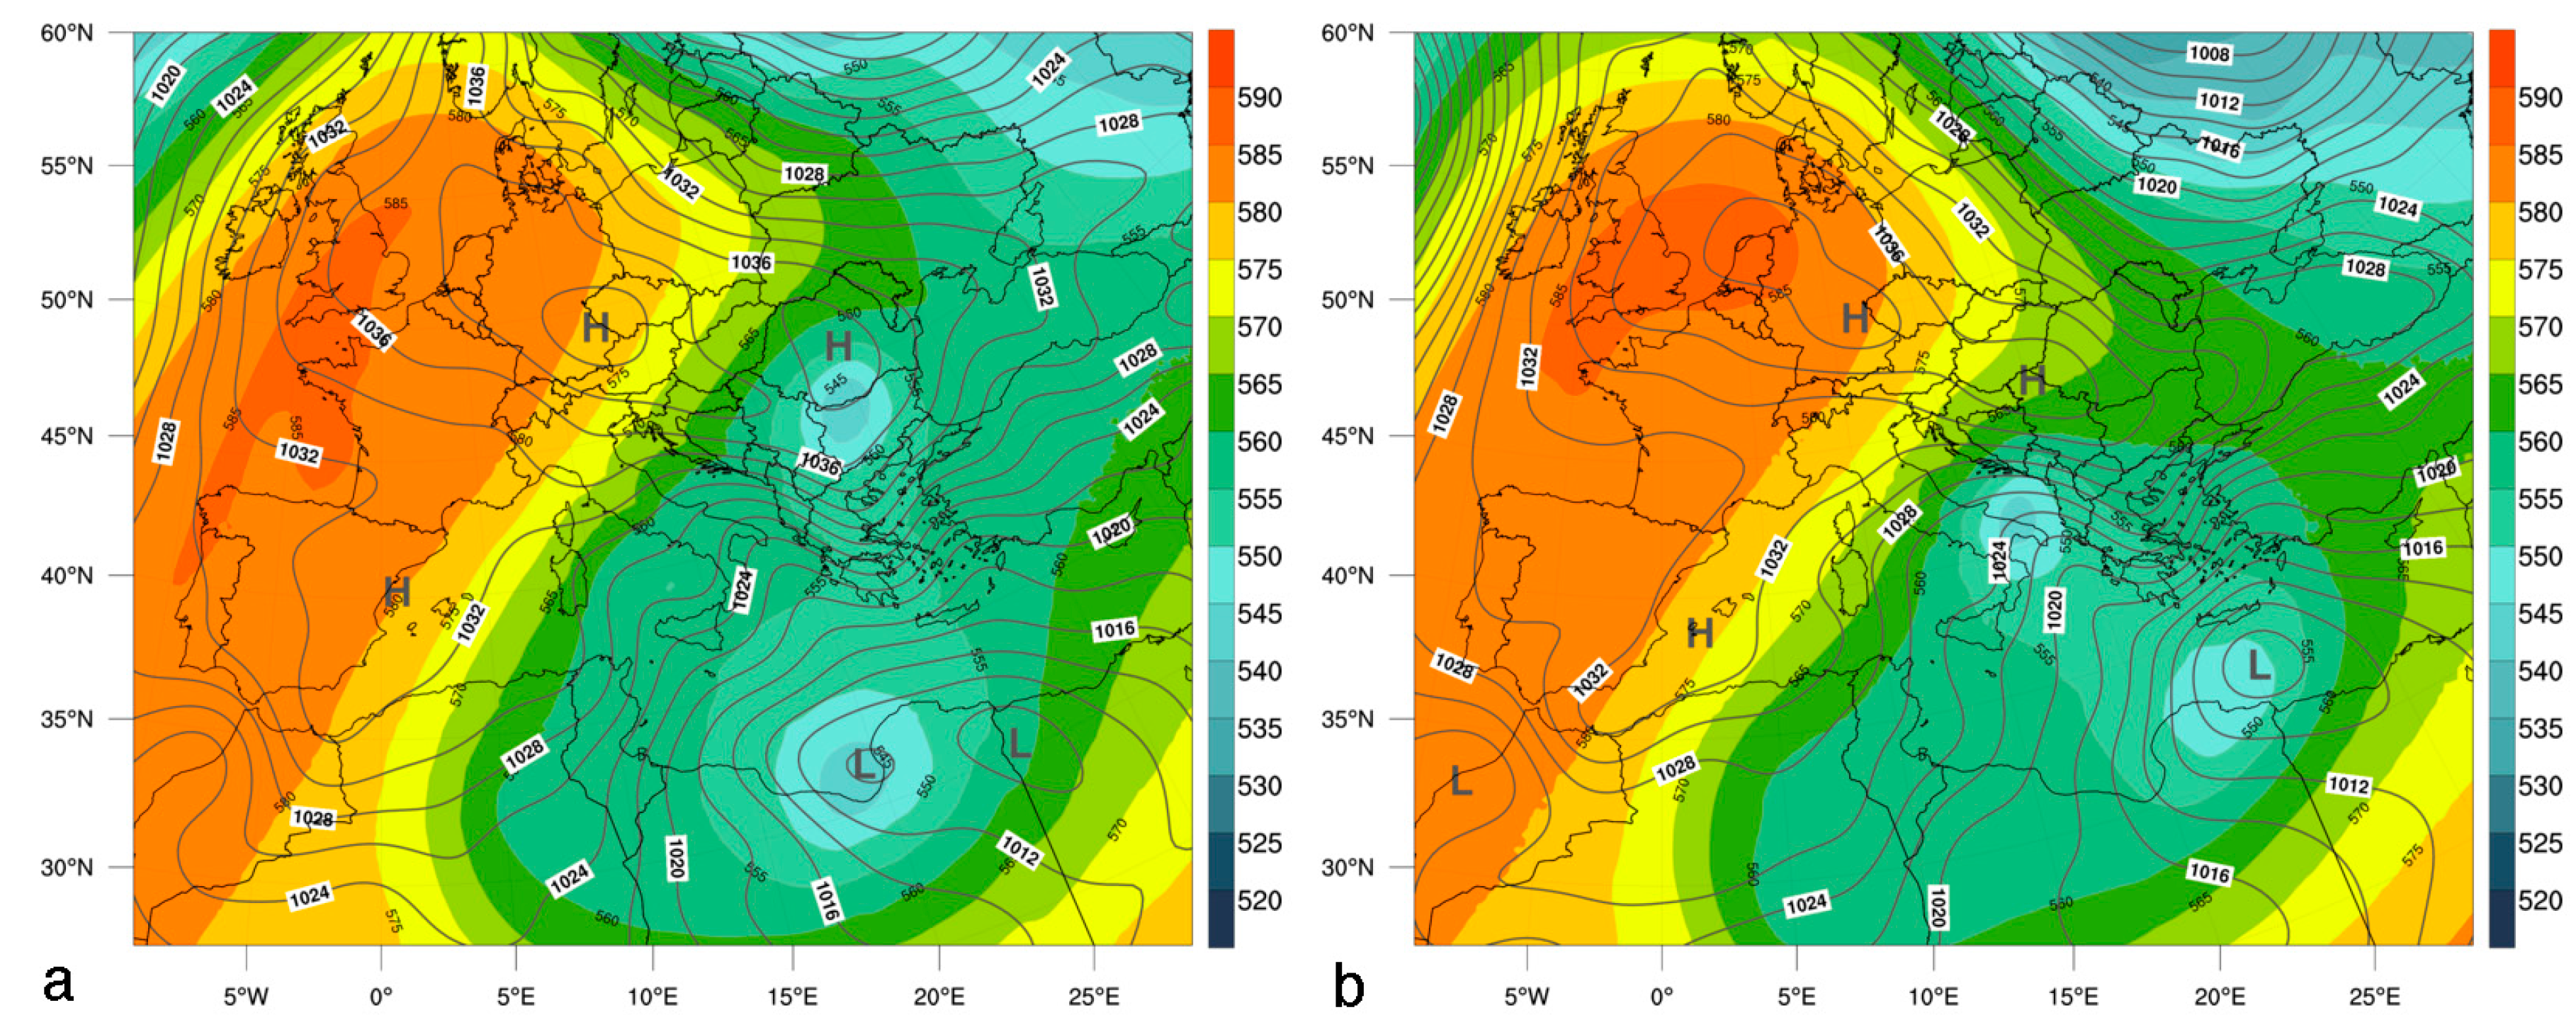
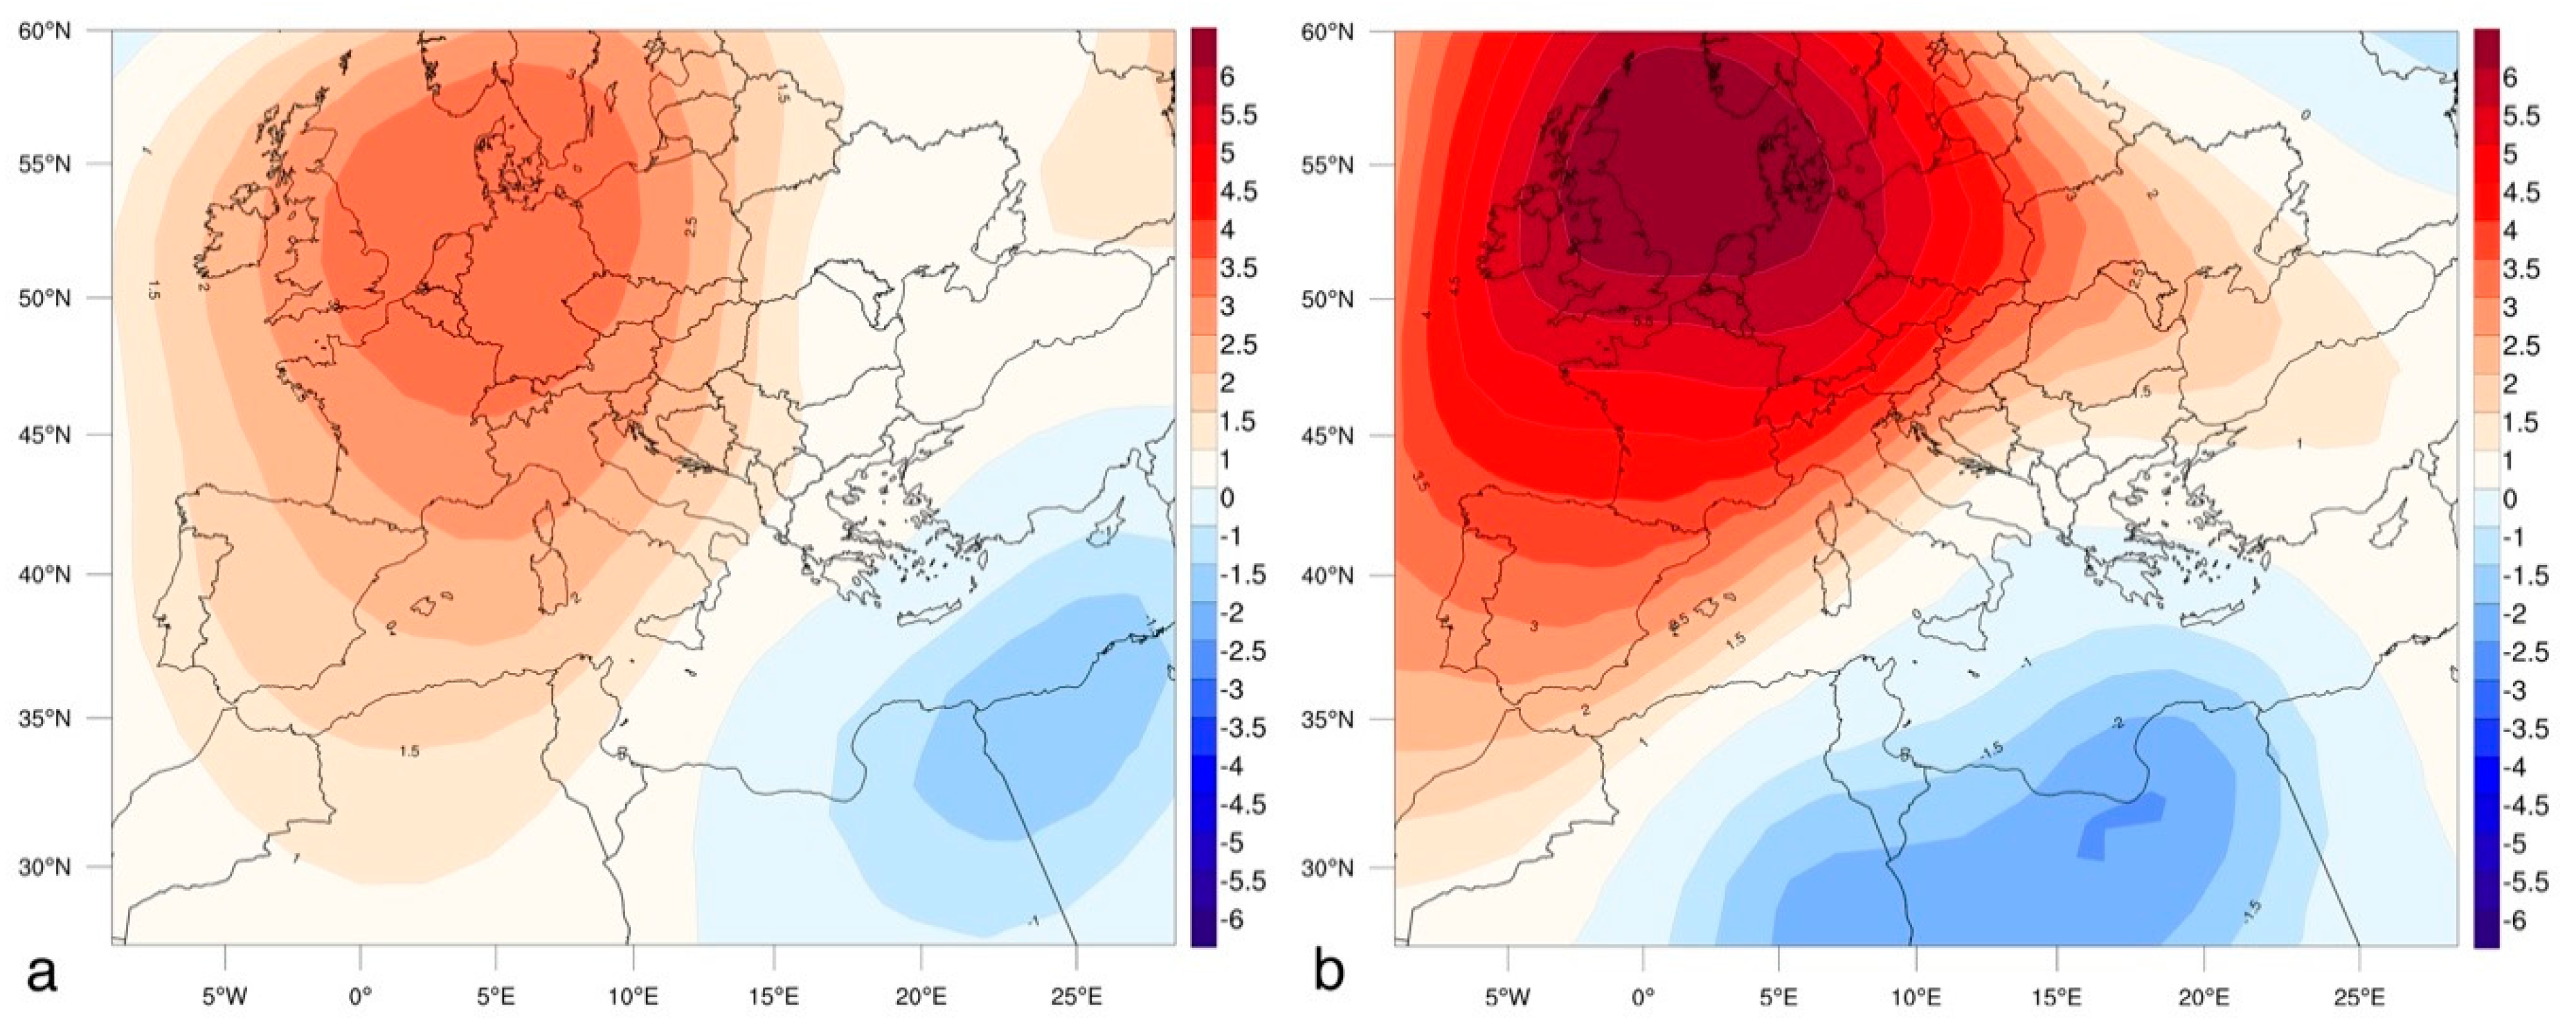
  • Synoptic setting: During both storms, the synoptic setup was similar, with a relatively deep low-pressure system in the vicinity of Crete and a high-pressure system over western Europe. Concerning the departure from the normal means, the meteorological situation in western Europe during Oceanis was reported as a record-breaking event, at least as far as the unseasonably high temperatures in northwest Europe are concerned.
  • Advection of moist air and persistence of impinging flow: During both storms, a strong flow towards the White Mountains for a long period of time led to a continuous inflow of low-level humid air towards the mountain barriers. In addition, long-lasting low-level convergence zones considerably promoted convection over the western parts of the island (see Figure 6 and Figure 9). The magnitude of the low-level convergence was higher and more persistent during the second storm.
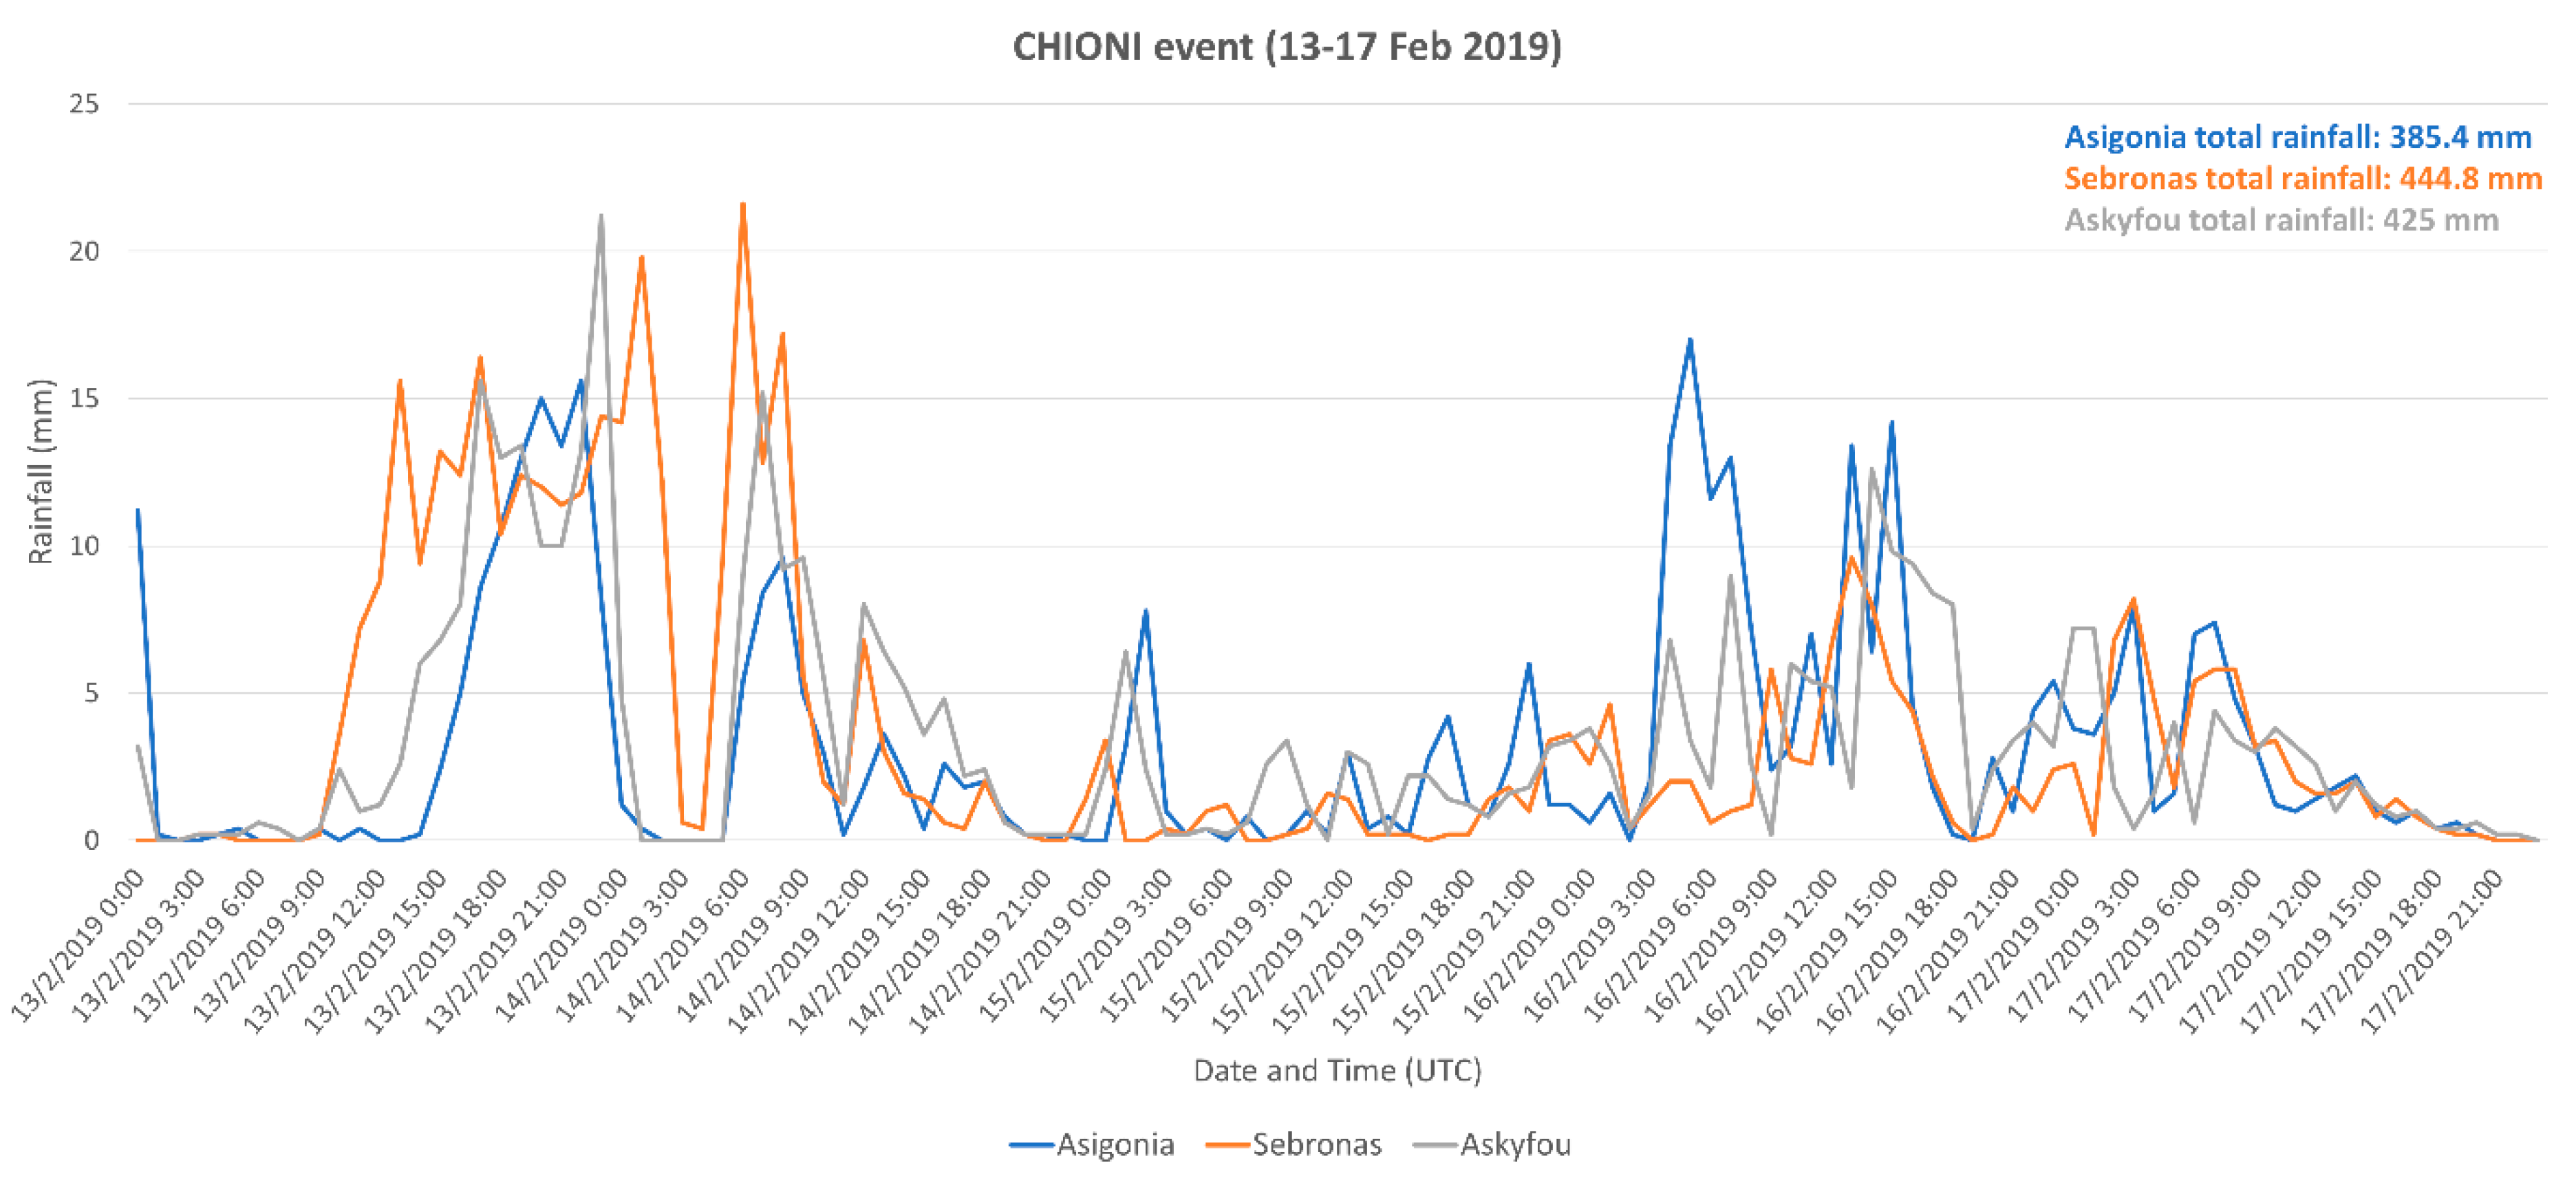
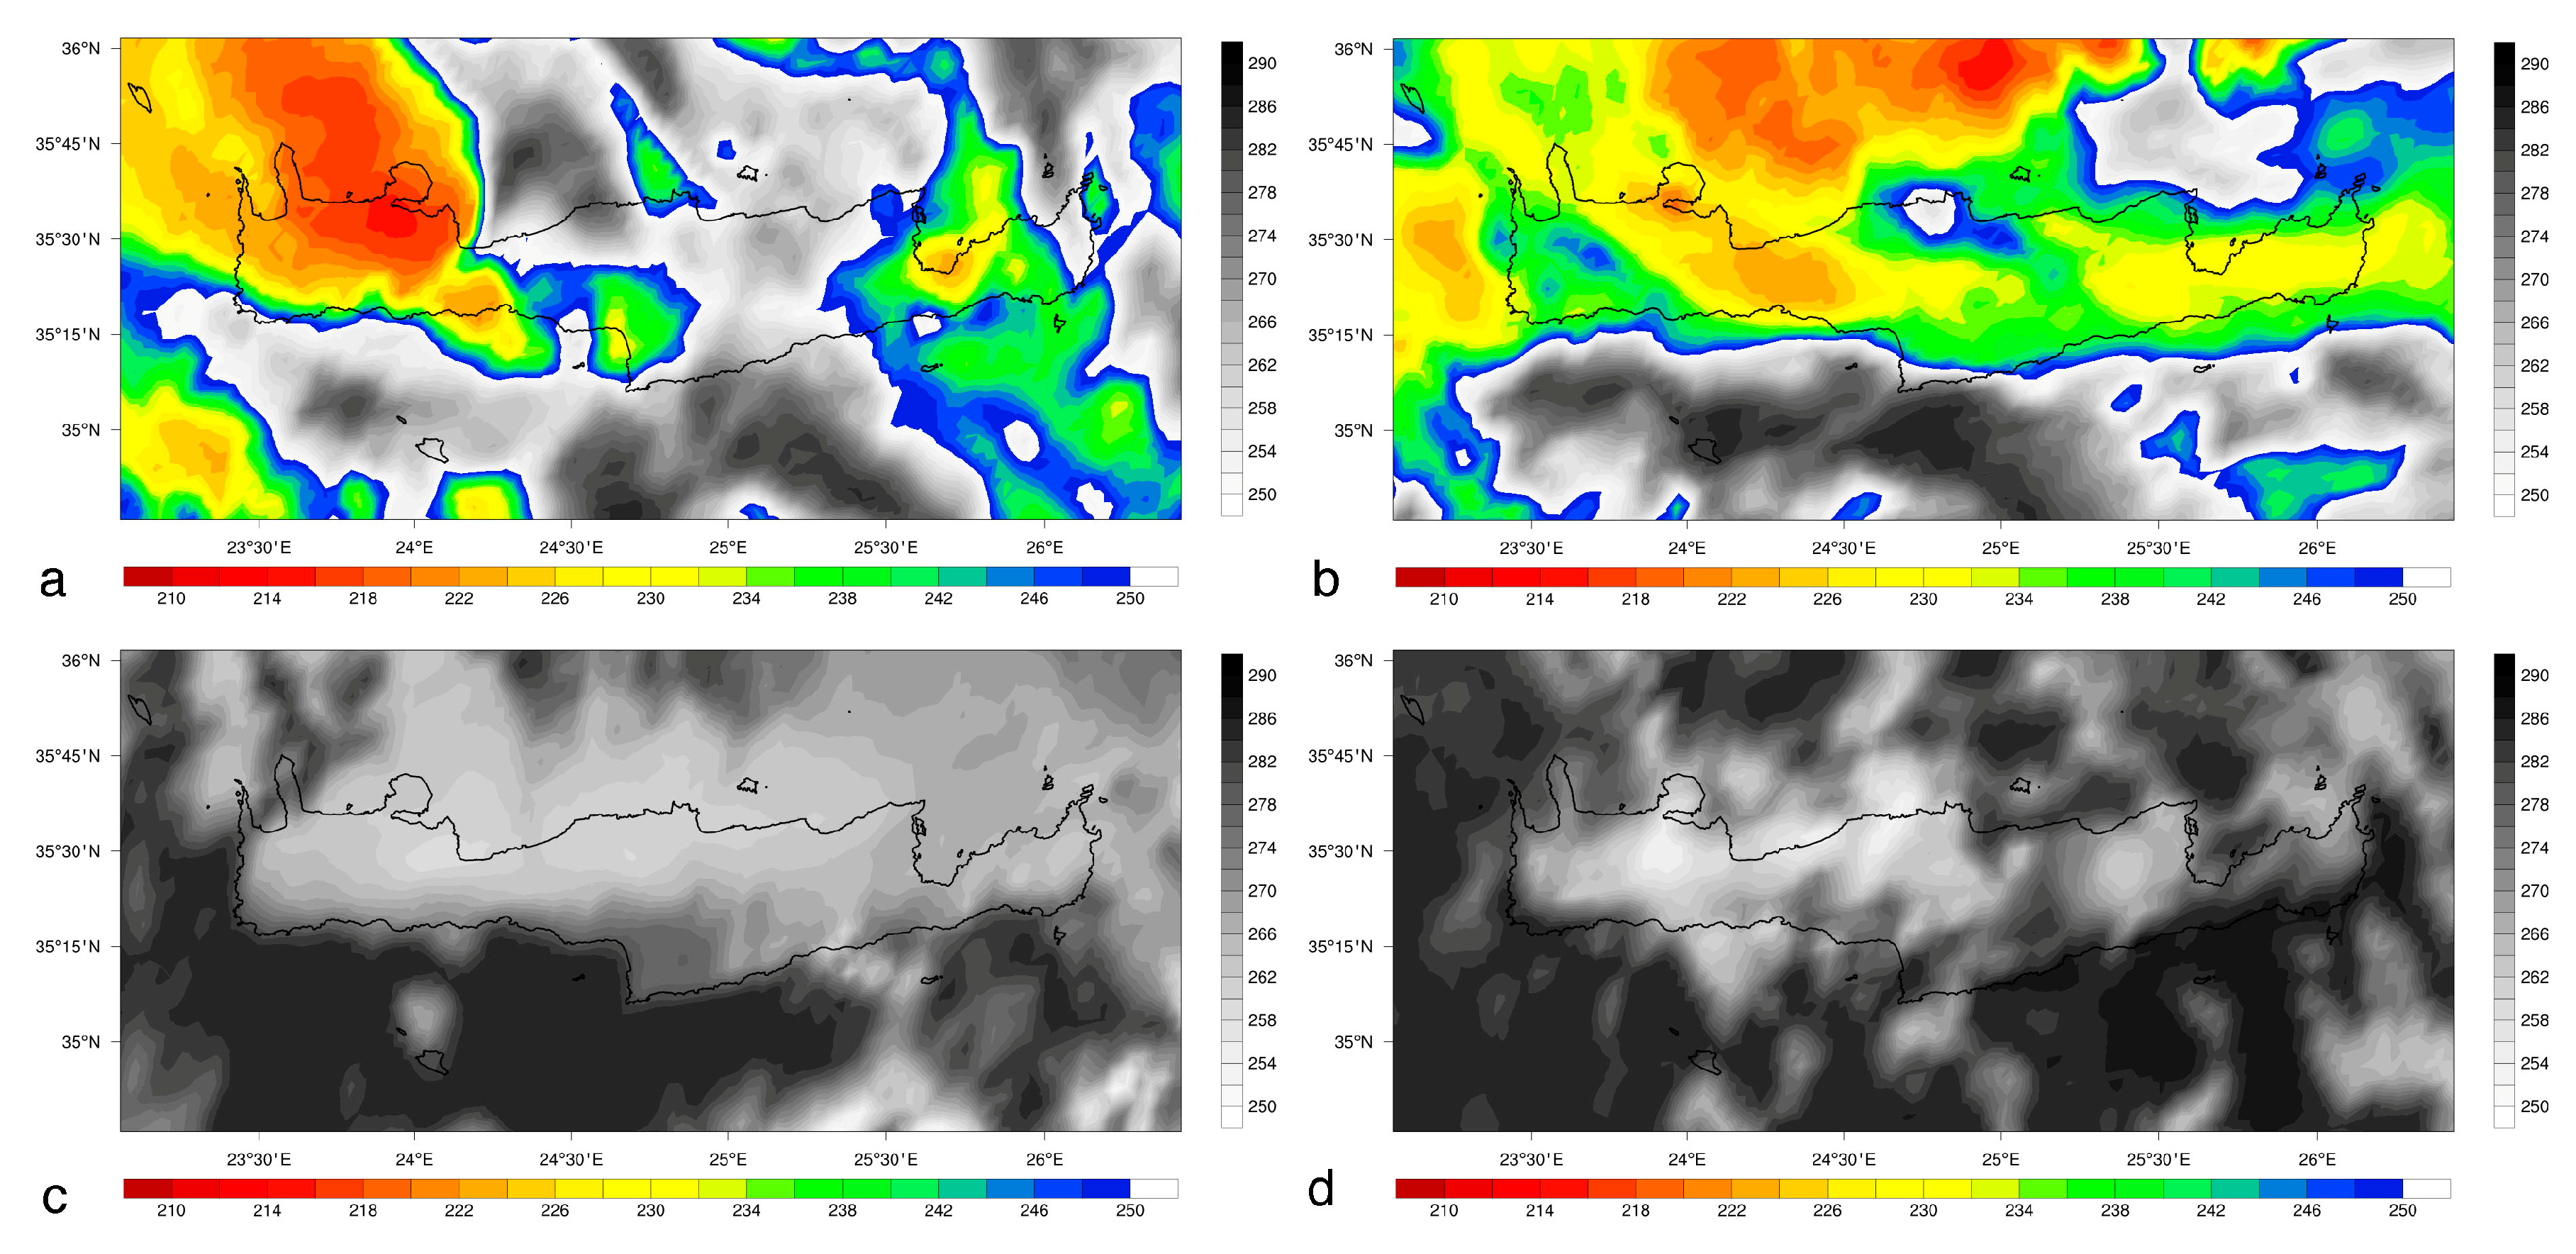
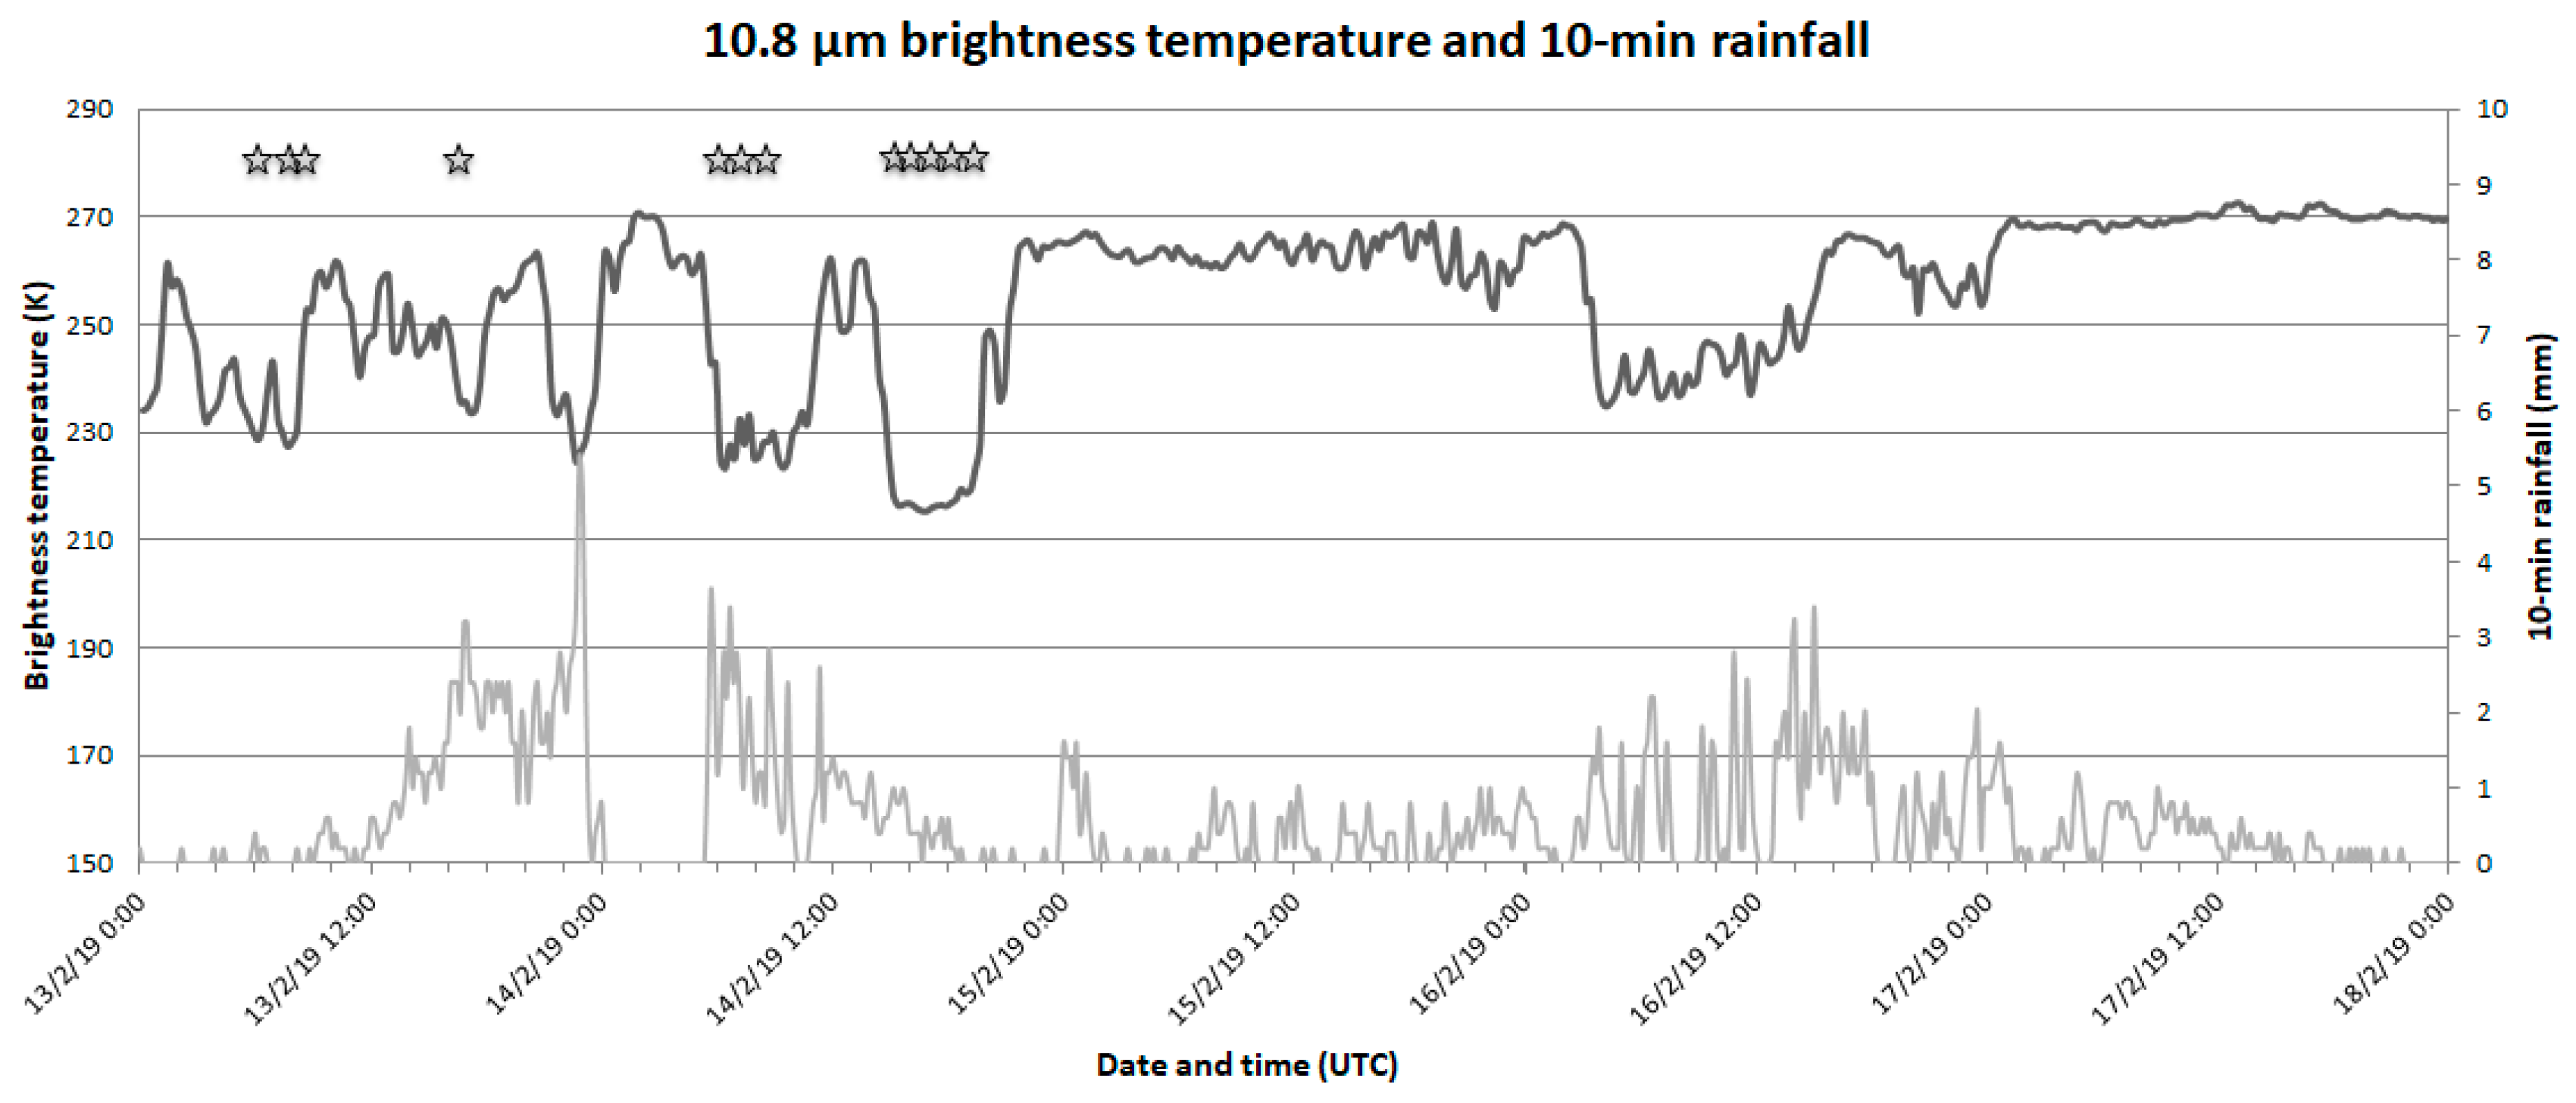
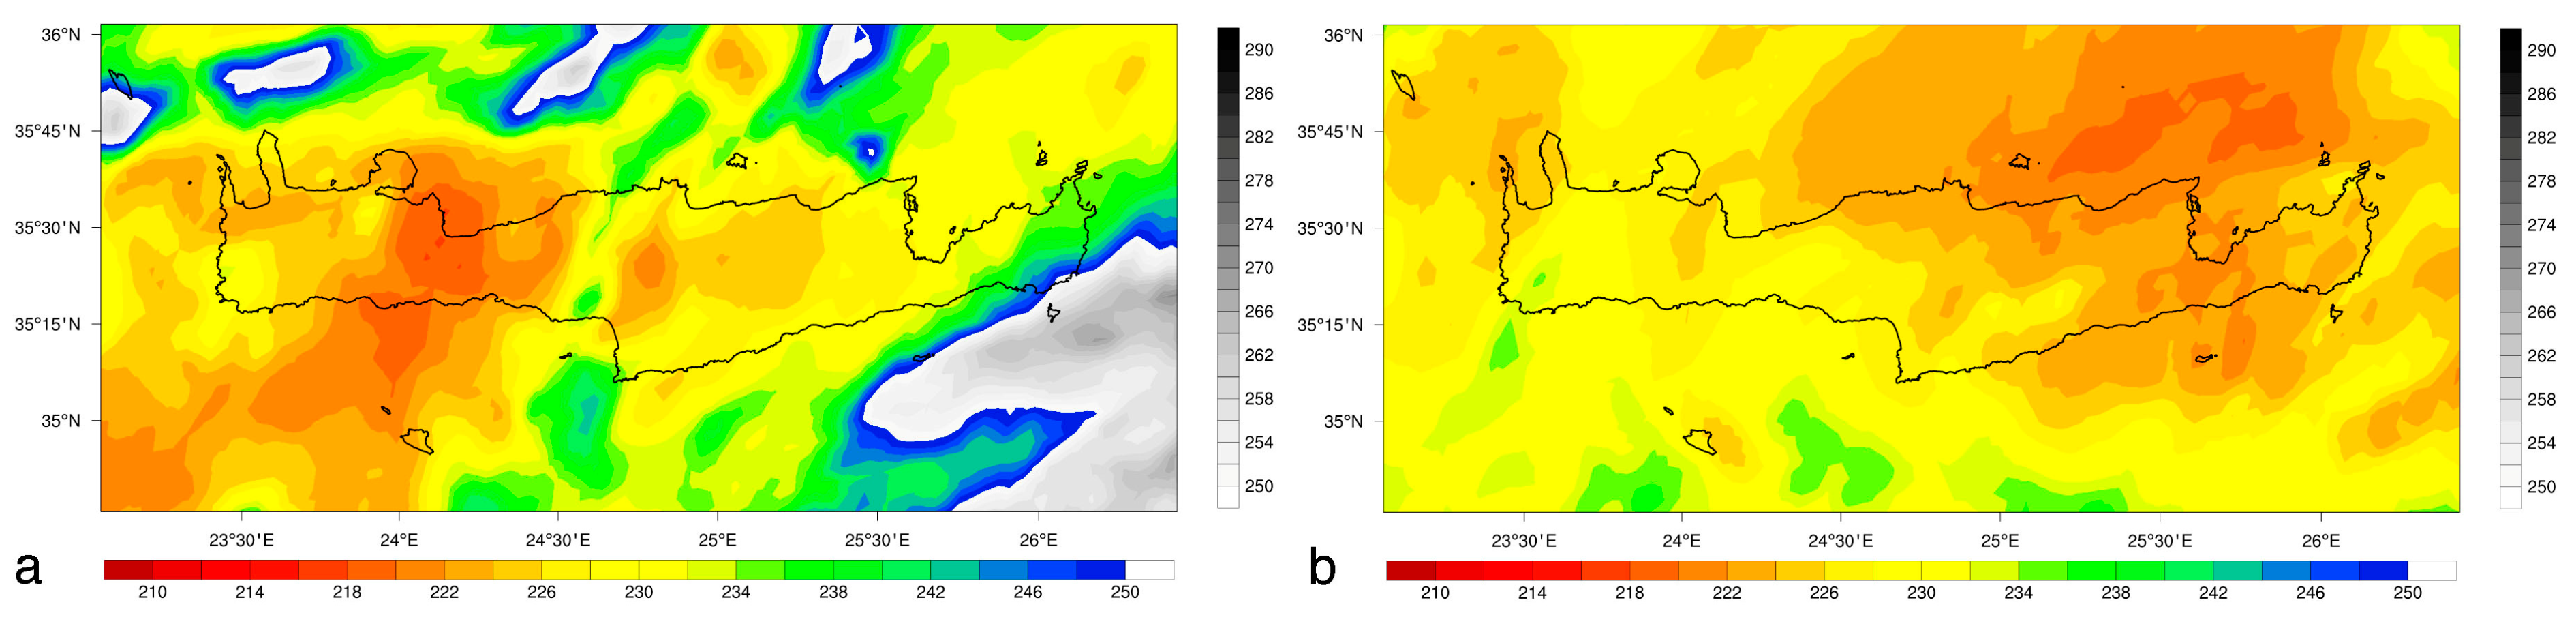
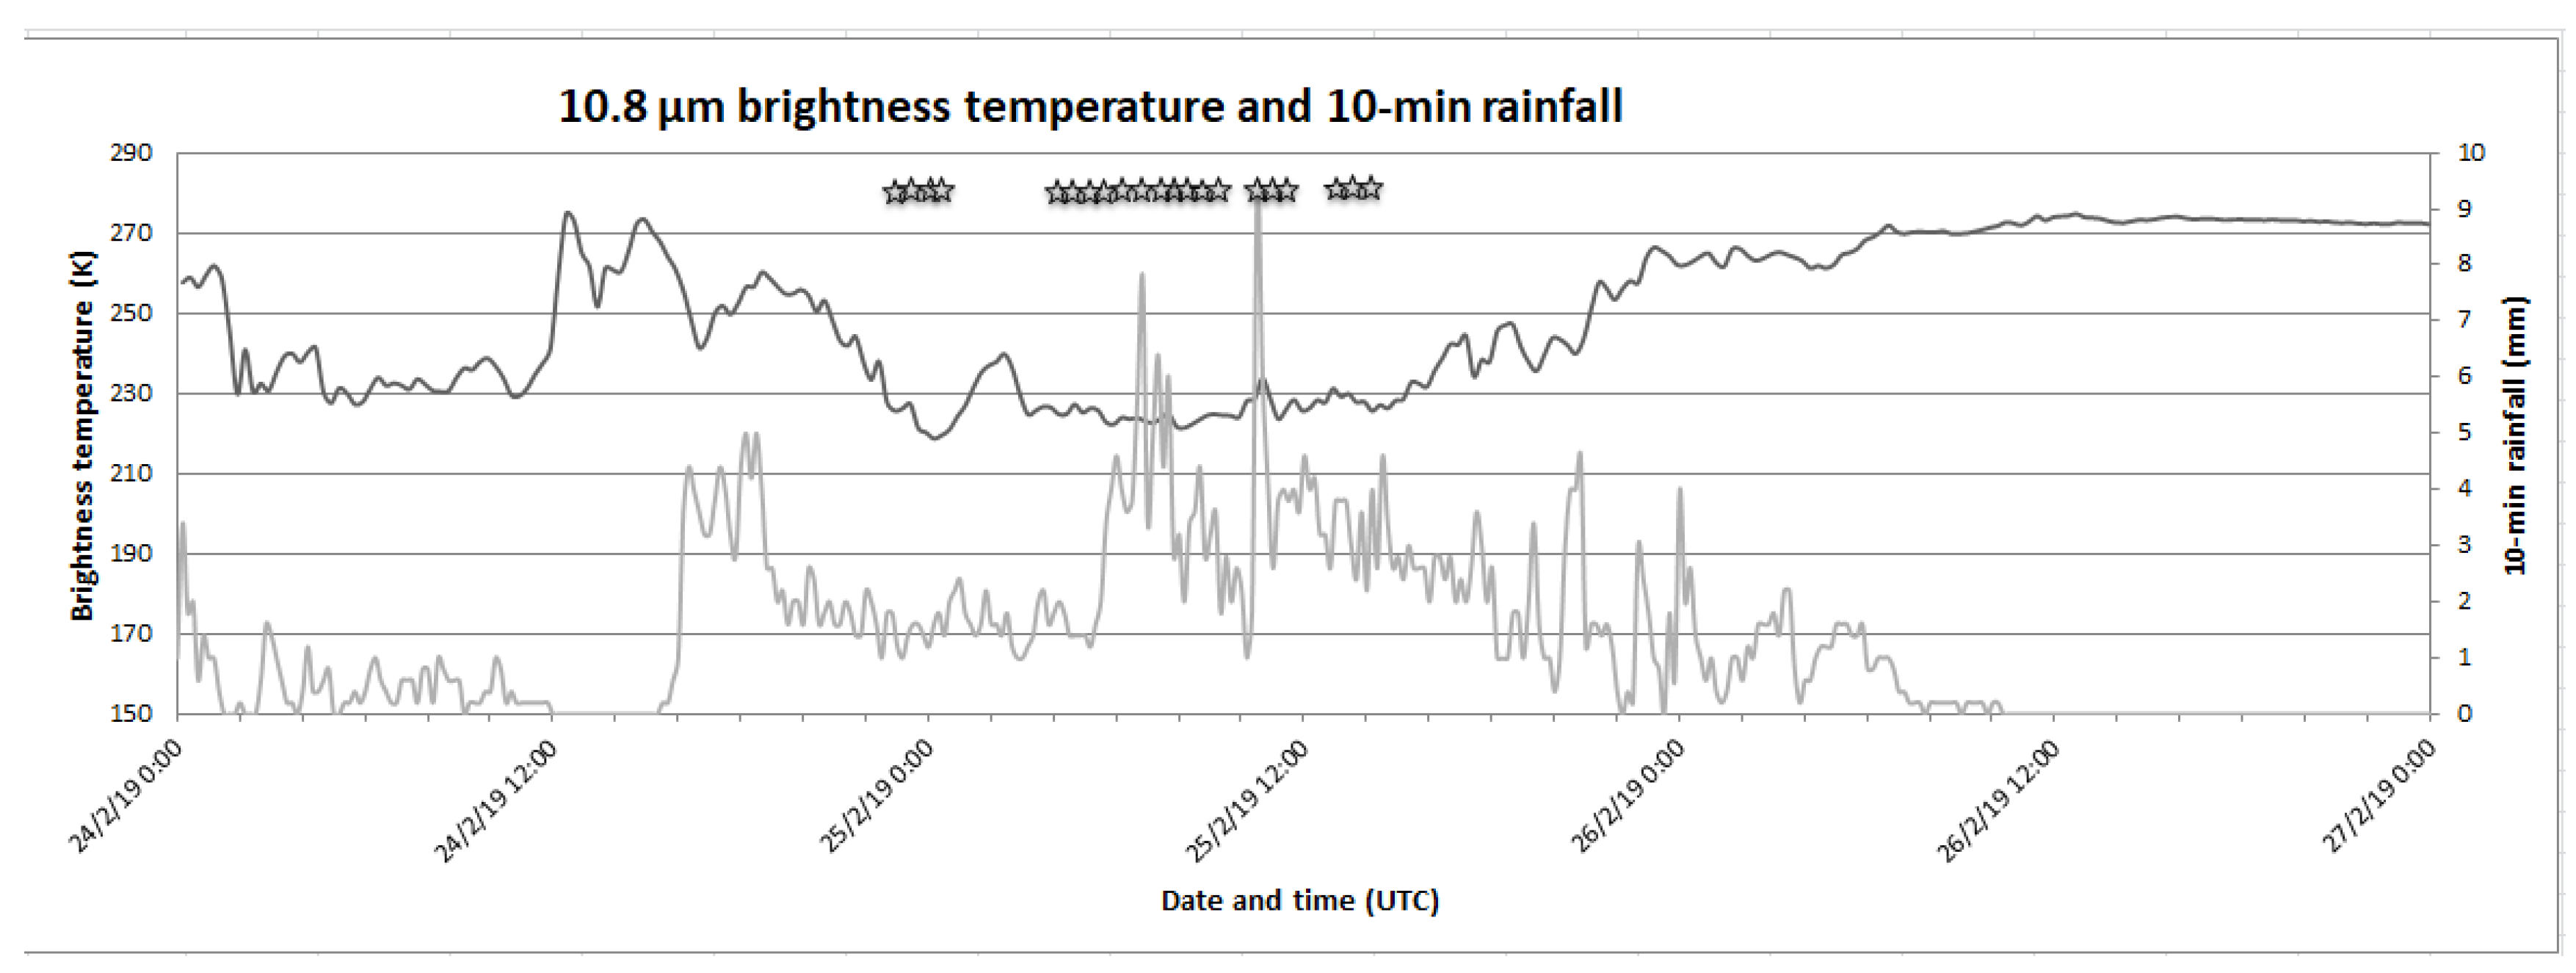
  • Degree of blocking of the impinging flow: Thorough inspection of satellite imagery revealed that during the first phase of Chioni, embedded convective cells developed over western Crete. During the second phase of Chioni, the clouds and rainfall regime were almost purely stratiform. This is an indication of a flow that gradually evolves from neutral/slightly unstable conditions to stable conditions and therefore from unblocked to a more blocked flow. This feature is also supported by the day-to-day lightning activity over the island, as well as from the rainfall spikes evident in the surface observations depicted in Figure 12. During the second storm Oceanis, the flow was unblocked for a longer period of time, leading to a more convective nature of the rainfall regime, as also shown in the time evolution of cloud tops’ brightness temperature and the corresponding rainfall rates at the ground (see Figure 14). This unblocked flow finally generated higher accumulations of rainfall at the ground and at shorter time periods.
  • Microphysical transformations within clouds: During the first phase of the Chioni storm, the height of the 0 °C isotherm was at ~1750 m above mean sea level and during the second storm Oceanis at ~1800 m. As pointed out in Rotunno and Houze [34], unblocked flow leads more easily to condensation ahead of a barrier, enhancing riming processes on the cold part of the clouds, which in both cases examined in this work start at ~1800 m (lower than the top of the White Mountains at 2450 m). Riming and production of graupel within the cold cloud layers produces heavier particles that rapidly fall on the windward slopes of the mountains. This feature shortens the time between the generation of new cloud liquid water by the upward unstable flow and the fallout of rainfall at the sloping surface. Coalescence of cloud droplets below the 0 °C isotherm is also an important factor for rainfall generation, but due to the thin layer (~1000–1200 m between the LCL and the 0 °C isotherm), this factor is not the predominant one during the cases analyzed in this work. Although the absence of radar measurements prohibited the microphysical analysis of the clouds in the two storms, a strong indication of the predominance of riming and the production of heavier particles with larger fall velocities was provided from the rapid response (~10–20 min) of the fallout of rainfall and appearance of embedded convective cells depicted in the satellite imagery. This mechanism, as conceptually presented in Rotunno and Houze [34] (see their Figure 15), is a very efficient way for producing high rainfall amounts at short time scales in many mountain ranges in the Mediterranean and elsewhere.
Grasping the physical mechanisms behind these two storms is of paramount importance since a better understanding will facilitate forecasters’ tasks in future similar occurrences of winter storms on the island. Moreover, this analysis contributes to a more coherent picture of the role of large orographic features on rainfall in the islands of the Mediterranean basin.
Finally, the analysis presented in this work reveals the importance of operating dense observational networks in areas of complex orography, especially when continuous radar measurements are lacking. These networks are beneficial not only for the scientists since they provide valuable data for real-time monitoring and post-analysis but also for the society. Therefore, maintenance and expansion of observational platforms, especially in the mountainous areas, is of paramount importance and among the top priorities of the authors, in collaboration with local authorities not only in Crete but in the whole Greek territory.

Author Contributions

Conceptualization, K.L. and V.K.; Data curation, K.L., S.D., C.G. and A.K.; Formal analysis, K.L. and S.D.; Methodology, K.L. and S.D.; Validation, K.L., C.G. and A.K.; Writing–original draft, K.L. and V.K.; Writing–review & editing, K.L., S.D. and V.K. All authors have read and agreed to the published version of the manuscript.

Funding

This research received no external funding.

Acknowledgments

The authors acknowledge EUMETSAT for the provision of METEOSAT data as well as NCEP, USA for the provision of FNL model analyses. Finally, the authors would like to thank the community of the amateur meteorologists in Crete for their assistance on the prompt operation of the rain gauge network in Crete, especially during the harsh weather conditions of both storms.

Conflicts of Interest

The authors declare no conflict of interest.

Appendix A

Figure A1. Total accumulated rainfall in Crete during the Chioni storm for the periods spanning (a) from 0000 UTC 13 February to 0000 UTC 13 February 2019 (24 h), (b) from 0000 UTC 14 February to 0000 UTC 14 February 2019 (24 h), (c) from 0000 UTC 15 February to 0000 UTC 15 February 2019 (24 h), (d) from 0000 UTC 16 February to 0000 UTC 16 February 2019 (24 h), and (e) from 0000 UTC 17 February to 0000 UTC 17 February 2019 (24 h).
Climate 08 00087 g0a1
Figure A2. Total accumulated rainfall in Crete during the Oceanis storm for the periods spanning (a) from 0000 UTC 24 February to 0000 UTC 24 February 2019 (24 h), (b) from 0000 UTC 25 February to 0000 UTC 25 February 2019 (24 h), and (c) from 0000 UTC 26 February to 0000 UTC 26 February 2019 (24 h).
Climate 08 00087 g0a2

Appendix B

Figure A3. NCEP FNL analysis of 500-hPa geopotential height (shading at 50-gpdm intervals), sea-level pressure (thin black contours at 2-hPa intervals), valid at (a) 1200 UTC 12 February 2019, (b) at 1800 UTC 12 February 2019, (c) at 0000 UTC 13 February 2019, and (d) at 0600 UTC 13 February 2019.
Climate 08 00087 g0a3
Figure A4. NCEP FNL analysis of 500-hPa geopotential height (shading at 50-gpdm intervals), sea-level pressure (thin black contours at 2-hPa intervals), valid on 24 February 2019 at (a) 0000 UTC, (b) at 0600 UTC, (c) at 1200 UTC, and (d) at 1800 UTC.
Climate 08 00087 g0a4

References

  1. Drobinski, P.; Ducrocq, V.; Alpert, P.; Anagnostou, E.; Béranger, K.; Borga, M.; Braud, I.; Chanzy, A.; Davolio, S.; Delrieu, G.; et al. HyMeX: A 10-Year Multidisciplinary Program on the Mediterranean Water Cycle. Bull. Am. Meteorol. Soc. 2013, 95, 1063–1082. [Google Scholar] [CrossRef]
  2. Scheffknecht, P.; Richard, E.; Lambert, D. Climatology of Heavy Precipitation over Corsica in the Period 1985–2015. Q. J. R. Meteorol. Soc. 2017, 143, 2987–2998. [Google Scholar] [CrossRef]
  3. Ehmele, F.; Barthlott, C.; Corsmeier, U. The influence of Sardinia on Corsican rainfall in the western Mediterranean Sea: A numerical sensitivity study. Atmos. Res. 2015, 153, 451–464. [Google Scholar] [CrossRef]
  4. Metzger, J.; Barthlott, C.; Kalthoff, N. Impact of upstream flow conditions on the initiation of moist convection over the island of Corsica. Atmos. Res. 2014, 145–146, 279–296. [Google Scholar] [CrossRef]
  5. Adler, B.; Kalthoff, N.; Kohler, M.; Handwerker, J.; Wieser, A.; Corsmeier, U.; Kottmeier, C.; Lambert, D.; Bock, O. The variability of water vapour and pre-convective conditions over the mountainous island of Corsica. Q. J. R. Meteorol. Soc. 2016, 142, 335–346. [Google Scholar] [CrossRef]
  6. Lambert, D.; Mallet, M.; Ducrocq, V.; Dulac, F.; Gheusi, F.; Kalthoff, N. CORSiCA: A Mediterranean atmospheric and oceanographic observatory in Corsica within the framework of HyMeX and ChArMEx. Adv. Geosci. 2011, 26, 125–131. [Google Scholar] [CrossRef] [Green Version]
  7. Coquillat, S.; Defer, E.; de Guibert, P.; Lambert, D.; Pinty, J.-P.; Pont, V.; Prieur, S.; Thomas, R.J.; Krehbiel, P.R.; Rison, W. SAETTA: High-resolution 3-D mapping of the total lightning activity in the Mediterranean Basin over Corsica, with a focus on a mesoscale convective system event. Atmos. Meas. Tech. 2019, 12, 5765–5790. [Google Scholar] [CrossRef] [Green Version]
  8. Erdmann, F.; Defer, E.; Caumont, O.; Blakeslee, R.J.; Pédeboy, S.; Coquillat, S. Concurrent Satellite and ground-based Lightning Observations from the Optical Lightning Imaging Sensor (ISS-LIS), the LF network Meteorage and the SAETTA LMA in the northwestern Mediterranean region. Atmos. Meas. Tech. 2020, 13, 853–875. [Google Scholar] [CrossRef] [Green Version]
  9. Ramis, C.; Homar, V.; Amengual, A.; Romero, R.; Alonso, S. Daily precipitation records over mainland Spain and the Balearic Islands. Nat. Hazards Earth Syst. Sci. 2013, 13, 2483–2491. [Google Scholar] [CrossRef] [Green Version]
  10. Mayol, T.L.; Homar, V.; Ramis, C.; Guijarro, J.-A. PREGRIDBAL 1.0: Towards a high-resolution rainfall atlas for the Balearic Islands (1950–2009). Nat. Hazards Earth Syst. Sci. 2017, 17, 1061–1074. [Google Scholar] [CrossRef] [Green Version]
  11. Vinet, F.; Bigot, V.; Petrucci, O.; Papagiannaki, K.; Llasat, M.C.; Kotroni, V.; Boissier, L.; Aceto, L.; Grimalt, M.; Llasat-Botija, M.; et al. Mapping flood-related mortality in the Mediterranean basin. Results from the MEFF 2.0 DB. Water 2019, 11, 2196. [Google Scholar] [CrossRef] [Green Version]
  12. Kotroni, V.; Lagouvardos, K.; Lalas, D. The effect of the island of Crete on the Etesian winds over the Aegean Sea. Q. J. R. Meteorol. Soc. 2001, 127, 1917–1937. [Google Scholar] [CrossRef]
  13. Tzoraki, O.; Kritsotakis, M.; Baltas, E. Spatial Water Use efficiency Index towards resource sustainability: Application in the island of Crete, Greece. Int. J. Water Resour. Dev. 2015, 31, 669–681. [Google Scholar] [CrossRef]
  14. Lagouvardos, K.; Kotroni, V.; Bezes, A.; Koletsis, I.; Kopania, T.; Lykoudis, S.; Mazarakis, N.; Papagiannaki, K.; Vougioukas, S. The automatic weather stations NOANN network of the National Observatory of Athens: Operation and database. Geosci. Data J. 2017, 4, 4–16. [Google Scholar] [CrossRef]
  15. Koutroulis, A.G.; Tsanis, I.K.; Daliakopoulos, I.N. Seasonality of floods and their hydrometeorologic characteristics in the island of Crete. J. Hydrol. 2010, 394, 90–100. [Google Scholar] [CrossRef]
  16. Kotroni, V.; Lagouvardos, K. Lightning in the Mediterranean and its relation with sea-surface temperature. Environ. Res. Lett. 2016, 11, 34006. [Google Scholar] [CrossRef]
  17. Galanaki, E.; Kotroni, V.; Lagouvardos, K.; Argiriou, A. A ten-year analysis of cloud-to-ground lightning activity over the Eastern Mediterranean region. Atmos. Res. 2015, 166, 213–222. [Google Scholar] [CrossRef]
  18. Kalnay, E.; Kanamitsu, M.; Kistler, R.; Collins, W.; Deaven, D.; Gandin, L.; Iredell, M.; Saha, S.; White, G.; Woollen, J.; et al. The NCEP/NCAR 40-Year Reanalysis Project. Bull. Amer. Meteor. Soc. 1996, 77, 437–472. [Google Scholar] [CrossRef] [Green Version]
  19. Reichle, R.; De Lannoy, G.; Koster, R.D.; Crow, W.T.; Kimball, J.S.; Liu, Q. SMAP L4 Global 3-Hourly 9 km EASE-Grid Surface and Root Zone Soil Moisture Analysis Update; Version 4. [SPL4SMAU]; NASA National Snow and Ice Data Center Distributed Active Archive Center: Boulder, CO, USA, 2018. [Google Scholar] [CrossRef]
  20. Reichle, R.H.; Liu, Q.; Koster, R.D.; Crow, W.T.; De Lannoy, G.J.M.; Kimball, J.S.; Ardizzone, J.V.; Bosch, D.; Colliander, A.; Cosh, M.; et al. Version 4 of the SMAP Level-4 Soil Moisture Algorithm and Data Product. J. Adv. Model. Earth Syst. 2019, 11, 3106–3130. [Google Scholar] [CrossRef] [Green Version]
  21. Khodayar, S.; Kalthoff, N.; Kottmeier, C. Atmospheric conditions associated with heavy precipitation events in comparison to seasonal means in the western Mediterranean region. Clim. Dyn. 2018, 51, 951–967. [Google Scholar] [CrossRef]
  22. Kirshbaum, J.D.; Adler, B.; Kalthoff, N.; Barthlott, C.; Serafin, S. Moist Orographic Convection: Physical Mechanisms and Links to Surface-Exchange Processes. Atmosphere 2018, 9, 80. [Google Scholar] [CrossRef] [Green Version]
  23. Weller, E.; Jakob, C.; Reeder, M.J. Projected Response of Low-Level Convergence and Associated Precipitation to Greenhouse Warming. Geophys. Res. Lett. 2017, 44, 10610–682690. [Google Scholar] [CrossRef]
  24. Houze, R.A., Jr. Orographic effects on precipitating clouds. Rev. Geophys. 2012, 50. [Google Scholar] [CrossRef]
  25. Young, M.; Galvin, J. The record-breaking warm spell of February 2019 in Britain, the Channel Islands, France and the Netherlands. Weather 2020, 75, 36–45. [Google Scholar] [CrossRef]
  26. Lackmann, G.M.; Gyakum, J.R. Heavy cold-season precipitation in the Northwestern United States: Synoptic climatology and an analysis of the flood of 17–18 January. Weather Forecast. 1999, 14, 687–700. [Google Scholar] [CrossRef]
  27. Grumm, R.H.; Hart, R. 2001: Standardized anomalies applied to significant cold season weather events. Preliminary findings. Weather Forecast. 2001, 16, 736–754. [Google Scholar] [CrossRef]
  28. Blaisdell, E.A. Statistics in Practice; Saunders College Publishing: New York, NY, USA, 1993; p. 653. [Google Scholar]
  29. Feidas, H.; Giannakos, A. Identifying precipitating clouds in Greece using multispectral infrared Meteosat Second Generation satellite data. Theor. Appl. Climatol. 2011, 104, 25–42. [Google Scholar] [CrossRef]
  30. Senf, F.; Dietzsch, F.; Hünerbein, A.; Deneke, H. Characterization of Initiation and Growth of Selected Severe Convective Storms over Central Europe with MSG-SEVIRI. J. Appl. Meteorol. Climatol. 2014, 54, 207–224. [Google Scholar] [CrossRef]
  31. Kumar, A.; Houze, R.A.; Rasmussen, K.L.; Peters-Lidard, C. Simulation of a Flash Flooding Storm at the Steep Edge of the Himalayas. J. Hydrometeorol. 2013, 15, 212–228. [Google Scholar] [CrossRef] [Green Version]
  32. Houze, R.A.; McMurdie, L.A.; Rasmussen, K.L.; Kumar, A.; Chaplin, M.M. Multiscale Aspects of the Storm Producing the June 2013 Flooding in Uttarakhand, India. Mon. Weather Rev. 2017, 145, 4447–4466. [Google Scholar] [CrossRef]
  33. Medina, S.; Houze, R.A. Air motions and precipitation growth in Alpine storms. Q. J. R. Meteorol. Soc. 2003, 129, 345–371. [Google Scholar] [CrossRef] [Green Version]
  34. Rotunno, R.; Houze, R.A. Lessons on orographic precipitation from the Mesoscale Alpine Programme. Q. J. R. Meteorol. Soc. 2007, 133, 811–830. [Google Scholar] [CrossRef]
Figure 1. Main topographic features of Crete (shading). The red diamonds show the location of the main damages during the first storm (Chioni) and the blue diamonds during the second storm (Oceanis). Crosses denote the location of drownings. Three weather stations, Askyfou, Asigonia, and Sebronas, are also labeled (AS, AG, SB, respectively). HR denotes the position of Heraklion airport.
Climate 08 00087 g001
Figure 2. Total accumulated rainfall in Crete (a) during Chioni storm for the period spanning from 0000 UTC 13 February to 0000 UTC 18 February 2019 (120 h), and (b) during Oceanis storm for the period spanning from 0000 UTC 24 February to 0000 UTC 27 February 2019 (72 h).
Climate 08 00087 g002
Figure 3. Accumulated rainfall (mm) versus elevation of the rain gauges (meters). Rectangles denote data during the first storm (Chioni) and circles during the second storm (Oceanis). The points corresponding to Askyfou, Asigonia, and Sebronas stations are labeled AS, AG, and SB, respectively (see Figure 1 for the locations of the stations).
Climate 08 00087 g003
Figure 4. NCEP FNL analysis of 500-hPa geopotential height (shading at 50-gpdm intervals), sea-level pressure (thin black contours at 2-hPa intervals), valid at (a) 1200 UTC 13 February 2019, (b) at 0000 UTC 14 February 2019, (c) at 1200 UTC 15 February 2019, and (d) at 0000 UTC 16 February 2019.
Climate 08 00087 g004
Figure 5. Time evolution of the observed 1-h accumulated rainfall during the 5-day period, starting at 0000 UTC 13 February 2019. Data are shown for 3 automatic stations located at mid-level altitude in the western part of the island (Asigonia (AG), Sebronas (SB), and Askyfou (AS)). The total amount of rainfall recorded during the event is shown in the upper right corner.
Climate 08 00087 g005
Figure 6. NCEP FNL analysis of the effective precipitable water (shading at 5-mm intervals), low-level convergence (red contours at 0.5 × 10⁻⁴ s−1 intervals) and 10-m wind (arrows) valid at (a) 1200 UTC 13 February 2019 and (b) at 0600 UTC 14 February 2019.
Climate 08 00087 g006
Figure 7. NCEP FNL analysis of 500-hPa geopotential height (shading at 50-gpdm intervals), sea level pressure (grey contours at 2-hPa intervals), valid at (a) 0000 UTC 25 February 2019 and (b) at 1200 UTC 25 February 2019.
Climate 08 00087 g007
Figure 8. Time evolution of observed 1-h accumulated rainfall during the 3-day period, starting at 0000 UTC 24 February 2019. Data are shown for 3 automatic stations located at mid-level heights in the western part of (Asi Gonia (AG), Sebronas (SB), and Askyfou (AS)). The total amount of rainfall recorded during the event is shown in the upper-right corner.
Climate 08 00087 g008
Figure 9. NCEP FNL analysis of effective precipitable water (shading at 5-mm intervals), low-level convergence (red contours at 0.5 × 10⁻⁴ s−1 intervals), and 10-m wind (arrows) valid at (a) 0000 UTC 25 February 2019 and at (b) 1800 UTC 25 February 2019.
Climate 08 00087 g009
Figure 10. Standardized 500-hPa geopotential height anomaly (dimensionless) of daily values compared to 30-year climatology for (a) 14 February 2019 and (b) 25 February 2019.
Climate 08 00087 g010
Figure 11. METEOSAT infrared brightness temperature (IR 10.8μm), valid (a) at 2230 UTC 13 February 2019, (b) at 0600 UTC 14 February 2019, (c) 0000 UTC 15 February 2019, and (d) at 1200 UTC 15 February 2019. Cloud top brightness temperatures colder than 250 K are colored.
Climate 08 00087 g011
Figure 12. Time evolution of 10.8 μm brightness temperature (at 15-min intervals) and of 10-min accumulated rainfall at Askyfou area, during the 5-day period, starting at 0000 UTC 13 February 2019. Stars at the top of the diagram indicate the time periods of convective activity.
Climate 08 00087 g012
Figure 13. METEOSAT infrared brightness temperature (IR 10.8μm), valid (a) at 0000 UTC 25 February 2019 and (b) at 1200 UTC 25 February 2019. Cloud top brightness temperatures colder than 250 K are colored.
Climate 08 00087 g013
Figure 14. Time evolution of 10.8 μm brightness temperature (at 15-min intervals) and of 10-min accumulated rainfall at Askyfou area, during the 3-day period, starting at 0000 UTC 24 February 2019. Stars at the top of the diagram indicate the time periods of convective activity.
Climate 08 00087 g014
Figure 15. Time evolution of surface soil moisture volumetric content (cm3 cm−3) (bold line, averaged over northwestern Crete, at 3-h intervals) and of 3-h accumulated rainfall (bar) at Askyfou during February 2019.
Climate 08 00087 g015

