Article

Trends of Climate Change and Variability in Three Agro-Ecological Settings in Central Ethiopia: Contrasts of Meteorological Data and Farmers’ Perceptions

by
Dula Etana
1,2,*,
Denyse J. R. M. Snelder
3,
Cornelia F. A. van Wesenbeeck
4 and
Tjard de Cock Buning
2
1
College of Development Studies, Addis Ababa University, P.O. Box 1176 Addis Ababa, Ethiopia
2
Athena Institute of Research, Vrije Universiteit Amsterdam, De Boelelaan 1085, 1081 HV Amsterdam, The Netherlands
3
Centre for International Cooperation, Vrije Universiteit Amsterdam, De Boelelaan 1105, 1081 HV Amsterdam, The Netherlands
4
Centre for World Food Studies, Vrije Universiteit Amsterdam, De Boelelaan 1105, 1081 HV Amsterdam, The Netherlands
*
Author to whom correspondence should be addressed.
Climate 2020, 8(11), 121; https://doi.org/10.3390/cli8110121
Submission received: 31 August 2020 / Revised: 5 October 2020 / Accepted: 19 October 2020 / Published: 22 October 2020
(This article belongs to the Special Issue Climate Change and Food Insecurity)

Abstract

:
Using gridded daily temperature and rainfall data covering 30 years (1988–2017), this study investigates trends in rainfall, temperature, and extreme events in three agro-ecological settings in central Ethiopia. The Mann Kendall test and Sen’s slope estimator were used to examine the trends and slope of changes in climate indices. The profile of farmers whose perception converges with or diverges from meteorological data was characterized using polling. The average annual temperature has increased by 0.4 and 0.3 °C per decade in the lowland and midland areas, respectively. Average annual rainfall has increased only in the midland areas by 178 mm per decade. Farmers’ perception of increasing temperature fairly aligns with meteorological data. However, there is a noticeable difference between farmers’ perception of rainfall and meteorological data. The perception of farmers with poor economic status, access to media, and higher social capital aligns with measured trends. Conversely, the perception of economically better-off and uneducated farmers diverges from meteorological data. Accurate perception is constrained by the failure of the traditional forecast methods to describe complex weather variabilities and lack of access to down-scaled weather information. The findings highlight the importance of availing specific and agro-ecologically relevant weather forecasts to overcome perceptual problems and to support effective adaptation.

1. Introduction

It is increasingly becoming apparent that climate change, spatio-temporal variability, and extreme events are issues of concern in Africa due to exceptionally high vulnerability [1,2]. Africa is warmer than it was 100 years ago and this warming not only continues but also will accelerate to a rate between 2 and 6 °C in 100 years [3]. Unlike average temperature that is projected to increase across the continent, there is diversity in the pattern of rainfall [4]. According to the projection of the Intergovernmental Panel on Climate Change [5], there will be a reduction in rainfall in Northern and Southern Africa, but an increase in Eastern Africa at the end of the 21st century. Model projections show varying results for Western Africa, yet most of them indicate a wetter core rainfall season with a small delay in the rainy season by the end of the century. There is also a projected increase in extreme temperatures and rainfall in Africa [5]. Due to current and future trends of climate change, it is expected that there will be a decline in the area suitable for agriculture, a shortening of the length of growing seasons, and diminishing crop yields [6].
Although Ethiopia is no exception to the problem of climate change, studies at different spatial scales show contrasting patterns of rainfall and temperature. Rainfall in Ethiopia is highly heterogeneous showing a wide range of patterns with no clear direction of change [1]. Another study [7] reported no significant change in annual rainfall at the national level but a significant decline in the kiremt rainfall (i.e., long rainy season between June and September) for south-western and central Ethiopia. A study in south-western Ethiopia [8] reported decreasing trends of rainfall. Another national-level study showed varied rainfall patterns in different parts of the country [9]. It confirmed significantly decreasing trends of kiremt and annual rainfall in northern, north-western, and western parts of the country. However, an increasing trend of annual rainfall was observed at a limited number of locations in eastern Ethiopia. For central Ethiopia, an increase in annual and kiremt rainfall but a decrease in belg rainfall [short rainy season between March and May] [10]. In the upper Blue Nile basin of Ethiopia, an insignificant increasing trend of annual rainfall was reported [11].
Regional- and local-level analyses show different trends of temperature. Based on climate model projections, one study [1] reported warming in all seasons across the country with relatively modest differences between regions. Another study [8] found upward trends in temperature for south-western Ethiopia. Both increasing and decreasing trends of temperature records were reported in different parts of the upper Blue Nile basin [11]. Both mean annual maximum and mean annual minimum temperature were increasing in the northern, central, and southern parts of the basin but decreasing trend was observed in the western part. A study in central Ethiopia [12] reported significantly increasing trends in annual maximum and minimum temperatures for midland and lowland areas. In north-central Ethiopia, significantly increasing trends of mean and minimum average temperature were reported [13]. There is also evidence that extreme events are becoming common in the country [9,14,15] and considerably vary by eco-environments [14,16].
The identification of the micro patterns of changes in climate variables is not sufficient to address climate problems. Farmers’ perceptions of changes in climate variables is also important for climate risk management and agricultural adaptation [17,18,19]. The way farmers respond to climate change and variability (CCV) depends on how they perceive the problems. Perception motivates action, which suggests that failure to recognize CCV as a livelihood threat might reduce concern and hinder action. Farmers make adaptation decisions based on their perceptions of changes in the climate variables [19]. The use of autonomous adaptation strategies specifically depends on farmers’ perceptions of local weather conditions. The convergence of perception with and divergence from observed trends also determine the type and time of taking actions. Farming decisions to be made and adaptation actions to be taken are more likely to be effective if there is a convergence between objective measurements and subjective assessments. However, it is not easy for farmers to have an accurate perception of changes in climate variables. The difficulty emanates from the fact that climate change is a long-term process, whereas farmers’ perception refers to short-term experience relying on memories [17].
Given these challenges, studies show contrasting results on whether farmers can accurately perceive actual changes in local climate variables. In general, farmers’ perception of an increase in temperature aligns with meteorological records [17,20,21]. However, for rainfall, studies show divergence between perception and records [18,19,21,22]. In Ethiopia, despite heavy reliance on rain-based economic activities and the absence of relevant information, studies linking perception to meteorological data are quite limited. One study [23] found that increased temperature and declining rainfall were the most widely held perceptions among farmers in the central highlands of Ethiopia. However, the result was not compared with meteorological data to validate the accuracy of farmers’ subjective assessments. Another study [24] investigated farmers’ perception in northern Ethiopia and found a divergence between perception of declining rainfall and rainfall measurements. Most of the previous studies compare farmers’ perception with observed results from the nearest weather station due to lack of temperature and rainfall data at the household level. However, this comparison is less precise as all farmers around the stations will have the same measurement values of the climate variables. Besides, previous studies comparing perception and actual measurements did not specifically show the features of farmers whose perceptions converge with or diverge from observed meteorological data. Our study addresses these gaps by using a novel approach to better integrate measured changes in climate variables with a farmers’ perception survey. The integration of perception and the measurements adds new insights into the current literature beyond simply presenting the percentage of farmers who are wrong or right. Whereas climate refers to average weather conditions over a long period of time, weather shows short-term atmospheric conditions. The meteorological data were employed to investigate both long-term changes and short term annual/seasonal variabilities. Although farmers commonly observe short-term atmospheric conditions in their farming operations, they can also perceive long-term changes to make adjustments to their livelihood practices. Hence, both concepts, climate and weather, are used in this study.
Understanding how climate variables are changing at the local level is important for planning appropriate adaptation strategies and boosting agricultural productivity [25]. However, no discernible and consistent patterns of change in and congruence between climate variables and perceptions can be established from these studies. Ethiopia is known for its highly diverse topography with altitudinal differences ranging from 125 m below sea level to 4620 m above sea level [7]. Given the high spatial variation in topography, analysis at the national or regional level masks local variations in temperature and rainfall and hence are of limited use to farmers seeking local solutions to manage the effects of climate change and variability. Hence, downscaling the level of analysis to meaningful geographic units makes the measurements more informative [7] and the information more relevant for farmers to plan for proactive adaptation responses. The ways local climate changes are understood by farmers are equally important in motivating adaptation. Therefore, this study has dual objectives. The first objective is the investigation of agro-ecological differences and temporal changes in rainfall and temperature as well as associated extreme events in topographically diverse areas in central Ethiopia. The second is comparison of the results of meteorological data with famers’ perceptions to discern convergences and divergences. The perceptions of farmers are assessed against the statistical results as the congruence/incongruence between the two has implications for risk management and adaptation decision making. The study contributes to the scant literature on the agro-ecological comparison of climate change and variability. Besides, by integrating meteorological data with a farmers’ perception survey, our study further provides insights on farmers’ understanding of the local weather conditions and its alignment with observed trends of climate variables.

2. Data and Methods

2.1. Description of the Study Areas

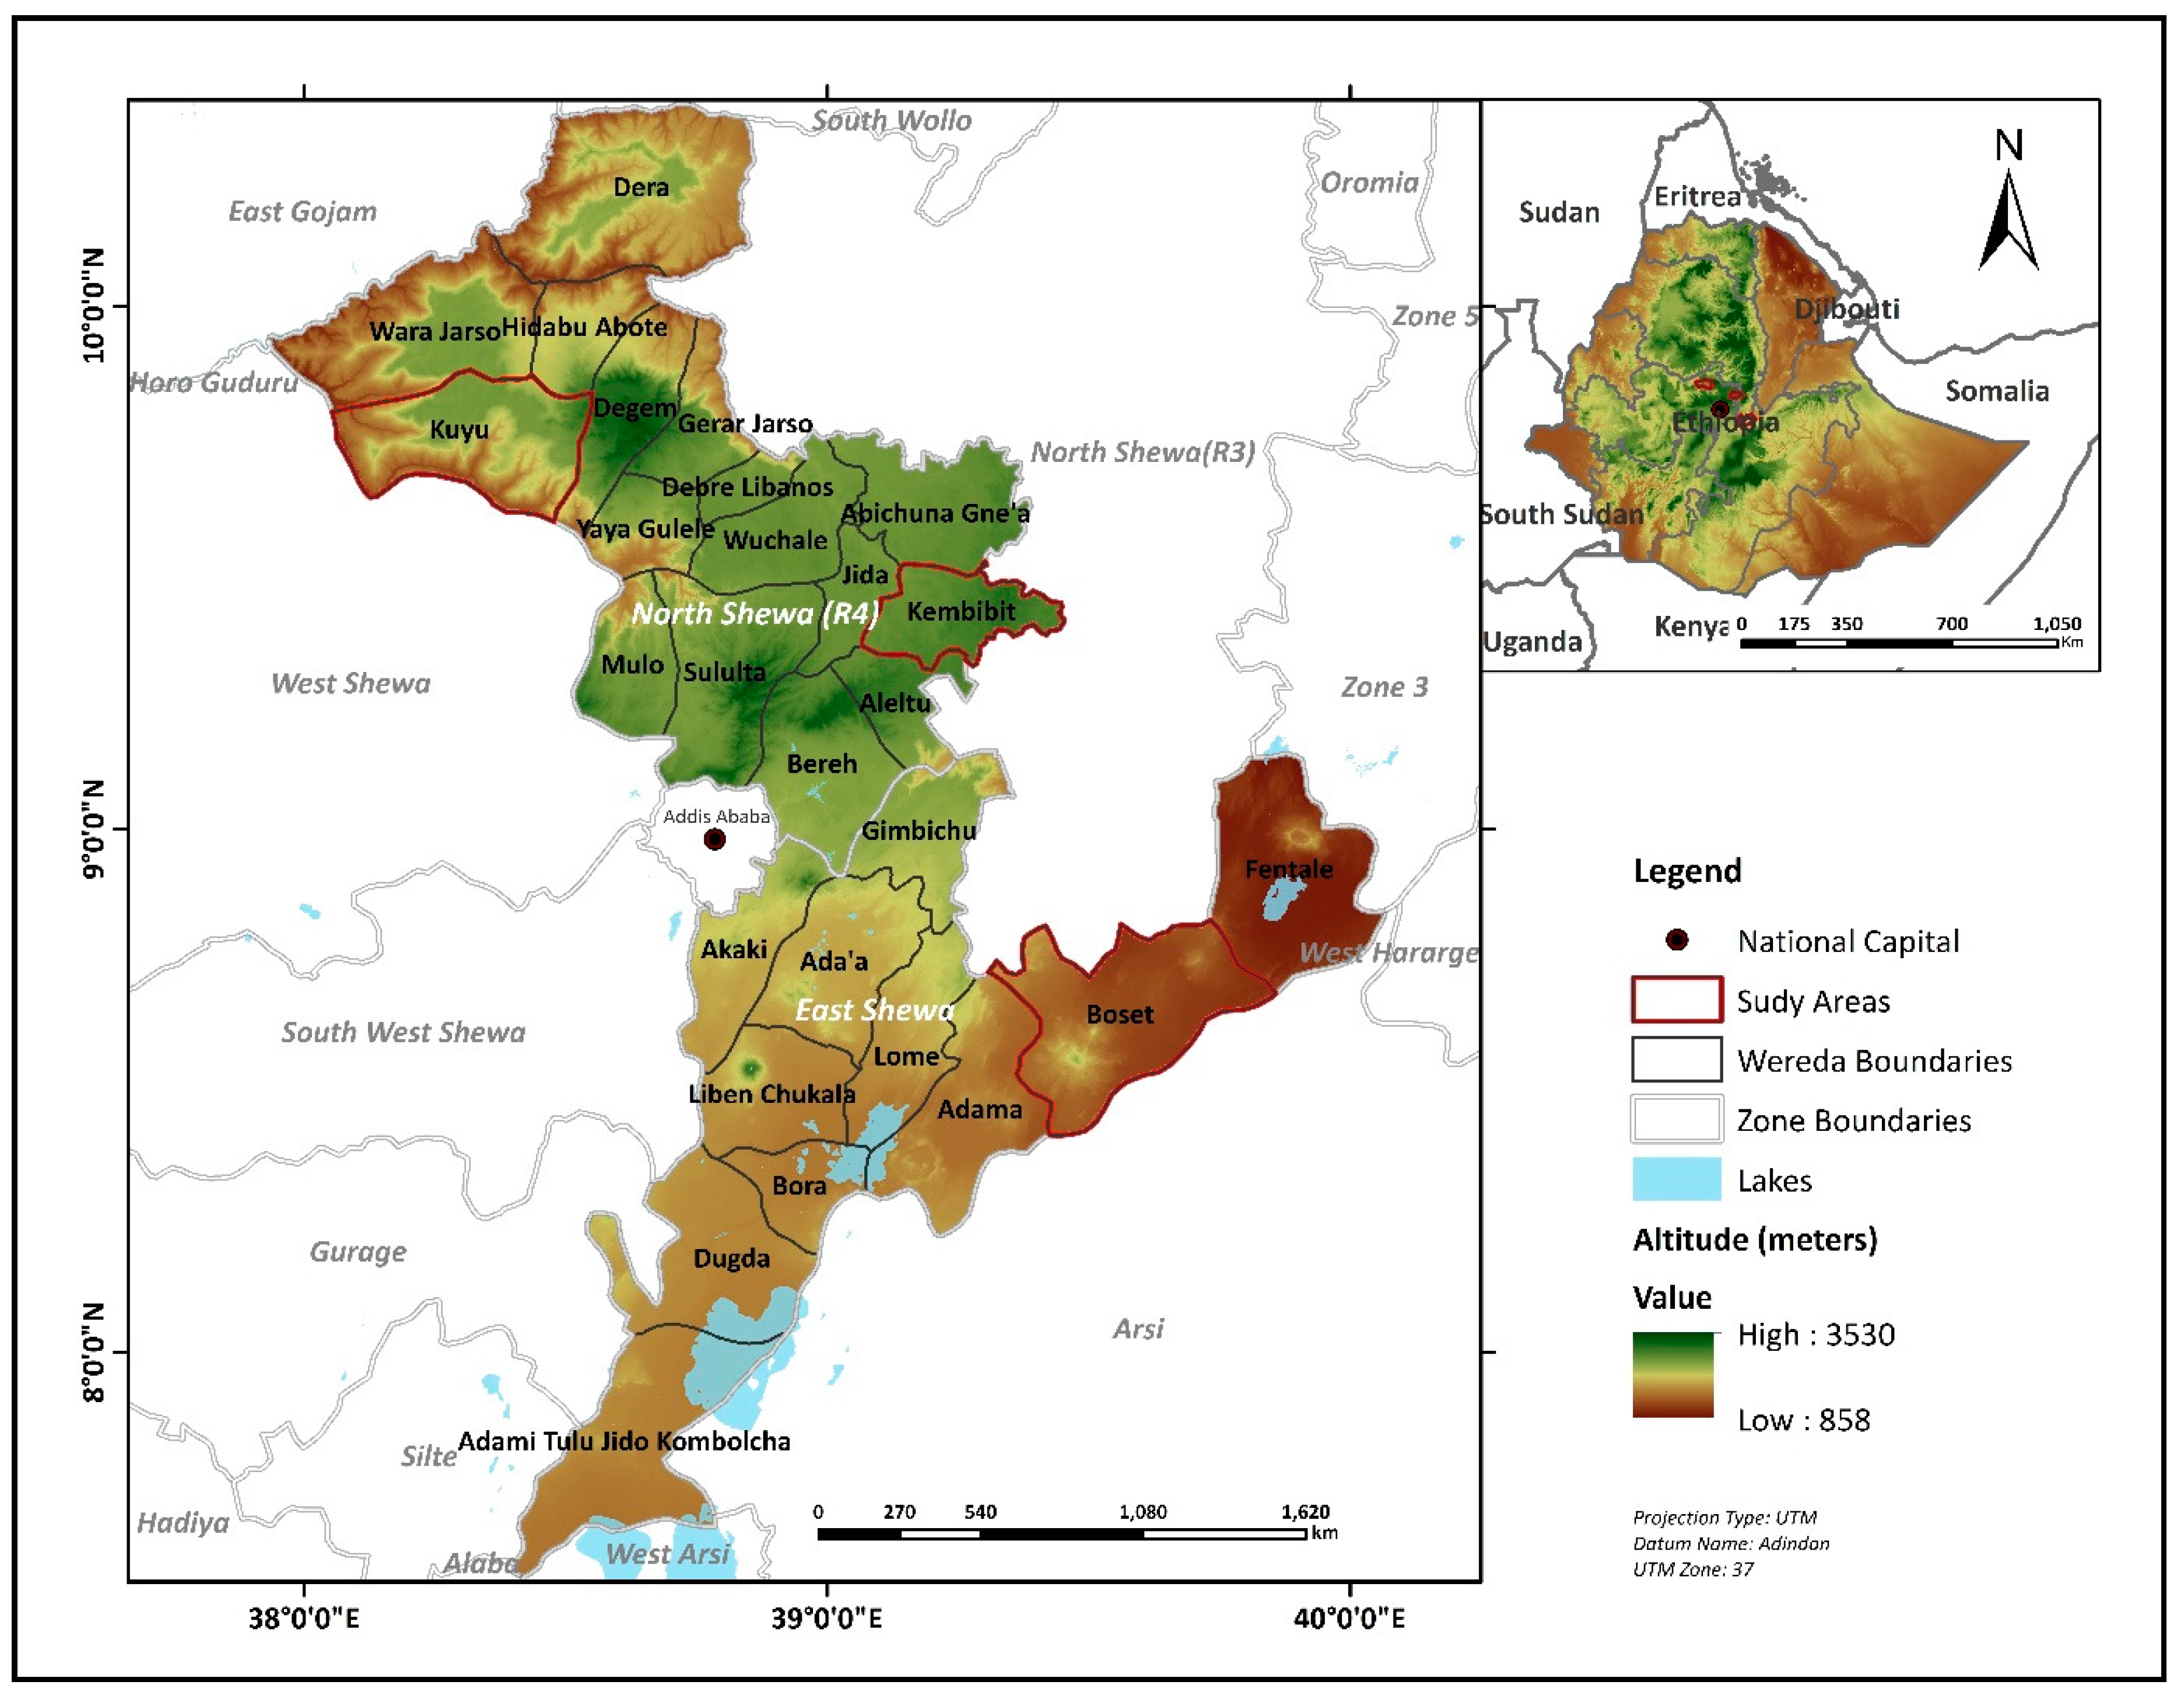
Oromia National Regional State is one of the regions in Ethiopia most vulnerable to climate change and variability. This study covers three districts in Oromia region in central Ethiopia (Kembibit, Kuyu, and Boset) dominantly representing, respectively, highland (H), midland (M), and lowland (L) areas (Figure 1). This agro-ecological classification is mainly based on altitudinal variations that have a strong impact on temperature and rainfall and consequently on agricultural land uses, mainly crop production. Highland, midland, and lowland cover altitudinal ranges of 2300–3200, 1500–2300, and 500–1500 m above sea level, respectively. Kembibit district covers the total area of about 928 km2. It lies between 9°12′–9°32′ N latitude and 39°04′–39°33′ E longitude. The agro-climatic zone of the district is mainly highland (temperate) with pocket areas found in mid-altitude (sub-tropical) areas. Kuyu district is located between 9°35′–9°49′ N latitude and 38°03′–38°31′ E longitude. Its total area is 994.7 km2. Owing to its altitudinal range, the district constitutes three agro-climatic zones (temperate, subtropical, and tropical areas) with a dominant sub-tropical climate. Boset district, which covers a total area of 1514.1 km2, is found between 8°25′–8°50′ N latitude and 39°16′–39°50’ E longitude. Most parts of the area lie between altitudinal ranges of 1000–1500 m above sea level, with a dominantly tropical climate.
The three areas are characterized by a bimodal rainfall distribution with a short belg rainy season, and a long kiremt rainy season. About 85% of the population in these areas live in rural areas, with livelihoods being mainly dependent on crop and livestock production. Owing to differences in temperature and rainfall distribution, these three agro-ecological settings are also characterized by fairly distinct crop production patterns. Sorghum and teff are the dominant types of crops produced in the lowland areas. Maize (Zea Mays), sorghum (Sorghum bicolor), teff (Tef eragrostis), wheat (Triticum), and oil seeds are dominantly produced in the midland areas. In the highland areas, barley and pulses are extensively produced. Farmers follow subsistence means of living that most of the products are used for home consumption. There is a high risk of yield reduction or crop failure during years of adverse weather conditions, threatening their food security. Consequently, the problem of food insecurity is widespread, and a sizeable proportion of the population is supported by the Productive Safety Net Program and emergency food aid. The program is implemented by the government of Ethiopia with the support of development partners in areas prone to chronic food insecurity to help the poor build assets and improve their livelihoods and, eventually, become food self-sufficient and resilient to shocks. The problem of food insecurity in the three study areas is related to declining agricultural productivity induced by adverse weather conditions and other socio-economic problems, such as shortage of farmland, land degradation, and limited use of improved agricultural technologies. The vulnerability of these areas is further compounded by deforestation, population pressure, lack of alternative livelihood options, and poor rural infrastructure.

2.2. Sample Size and Sampling Techniques

The sample size of the study was determined using a sample size calculation for a finite population [26]. The computation was made with the assumptions of 95% confidence interval; 5% level of significance; and 60% of households perceiving climate change and using adaptation strategies. Taking the population size of one of the districts, the sample size was calculated to be 270 households. Considering each district as an independent unit, the total sample size was 810 households. A multi-stage sampling technique was used to identify sample households. The three districts and nine kebeles (lowest administrative unit in Ethiopia) were selected through purposive sampling at the first and second stages, respectively. The selection was made based on the consideration of similarity of livelihood systems and prevalence of climate-related risk factors. At the last stage, sample households were selected using a simple random sampling technique from the list of households living in each kebele. Purposive sampling techniques were employed to identify focus group discussants and key informants.

2.3. Sources of Data and Methods of Data Collection

The data used in this study were obtained mainly from the National Meteorology Agency of Ethiopia and smallholder farmers. The study used gridded daily data of rainfall, maximum temperature (Tmax), and minimum temperature (Tmin) of one grid point in each agro-ecological setting covering the period of 30 years, 1988 to 2017. The dataset has a spatial resolution of 4km that combines station observations and satellite data from the European Organization for the Exploitation of Meteorological Satellites (EUMETSAT) and the US National Aeronautics and Space Administration (NASA). The use of a gridded dataset was necessitated by the limited availability of weather stations [12] and the problem of missing records of rainfall and temperature values in observation data [13], which reduces the validity of time-series trend analysis derived from incomplete data.
Primary data were collected between February and August 2018 from the heads (male or female heads primary responsible for making decisions and generating means of living primarily from agricultural activities) of the sampled smallholder farming households using survey questionnaires and focus group discussions. A paper-based survey questionnaire consisting of close-ended questions was used to collect data on farmers’ perceptions of changes in climate variables in their localities. The questionnaire was pilot tested to assure completeness and clarity. Enumerators who have prior data collection experience as well as accustomed to the study areas were recruited and trained on the content of the questionnaire as well as on techniques of interviewing to collect the survey data. On-spot checking of the questionnaires was made to ensure completeness. In addition, skip rules and ranges were introduced to the data entry software to generate automated error reports during data entry. Furthermore, the accuracy of the entered data was assessed by running frequencies and cross-tabulations, and wrong entries were corrected. Qualitative data were collected using focus group discussions (FGDs). It was used to capture farmers’ understanding of climate change and variability and the use of weather information to make farming decisions. Each group constituting seven to twelve members, four focus group discussions were conducted in each study district. The discussion, which took an hour on average and conducted in a local language, was moderated by the corresponding author and guided by open-ended questions. The audio-recorded discussion was first transcribed and then translated to English before textual analysis.

2.4. Definition and Measurement of Variables

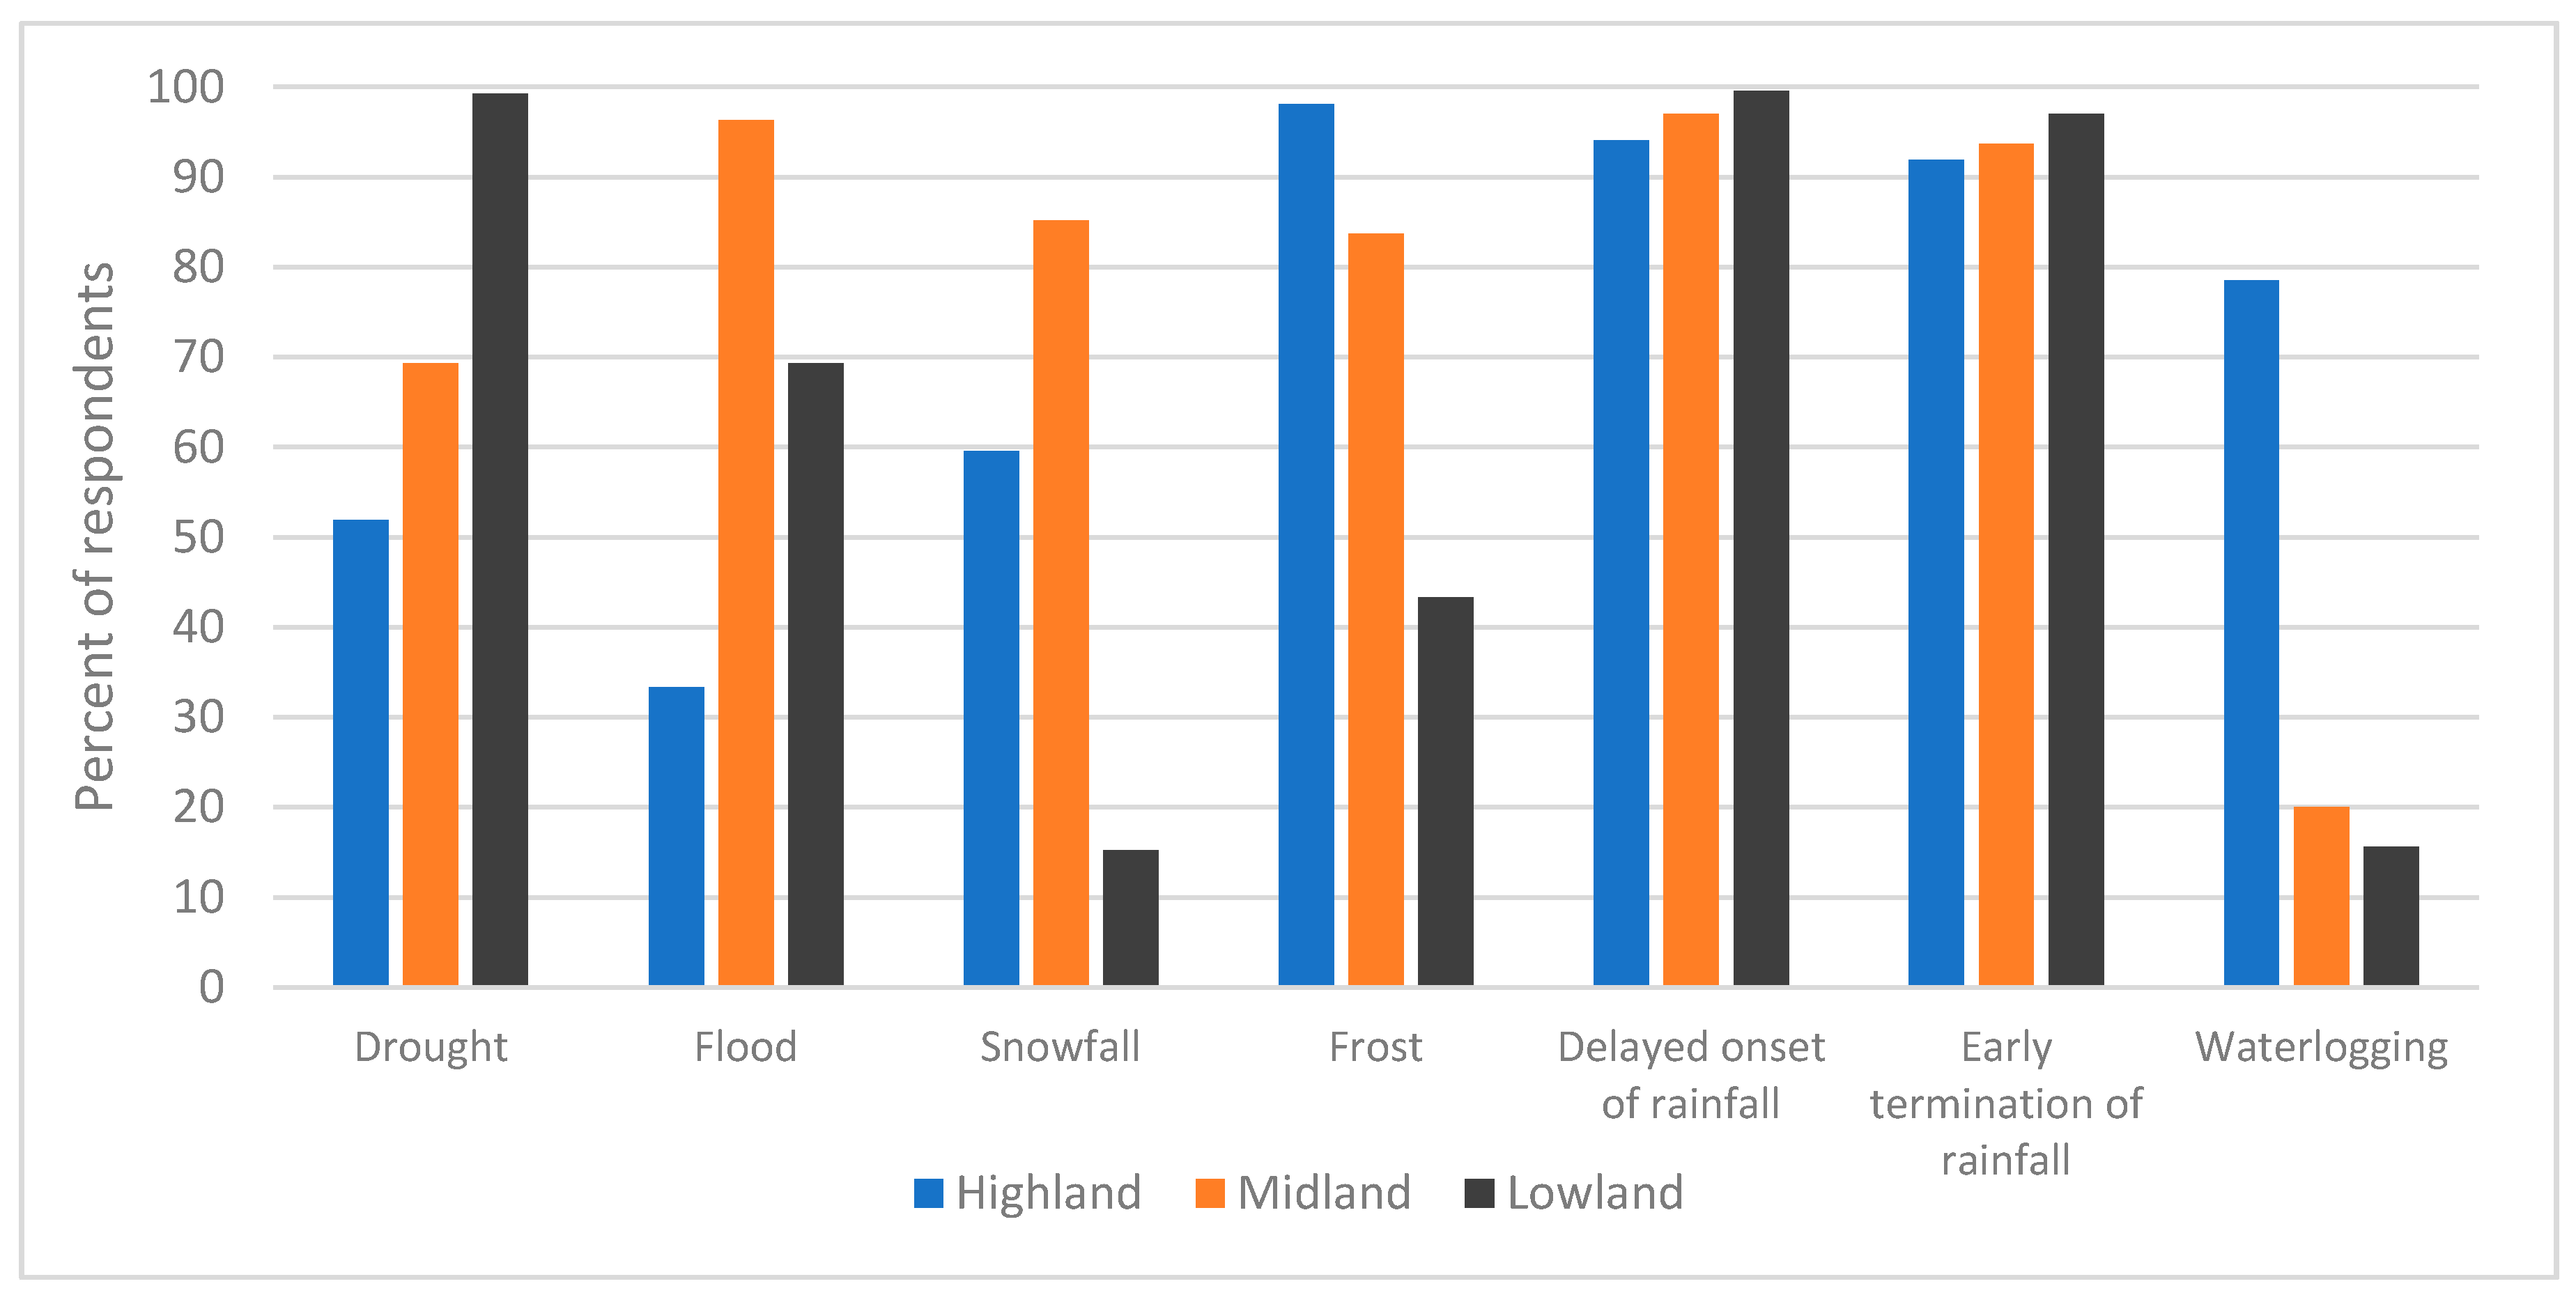
Farmers’ perceptions of changes in temperature and rainfall was measured by asking a close-ended question on whether temperature or rainfall is increasing, decreasing, or observed no change during the past 15 years. Data on the perceptions of extreme events were generated by asking the respondents a yes/no question on whether they had observed the occurrence of a range of climate events (drought, flood, snowfall, frost, delayed onset of rainfall, early termination of rainfall, and waterlogging) during the last 15 years. Given that perception is a function of the demographic and socio-economic characteristics of households, they were considered as explanatory variables to discern the convergence or divergence of farmers’ perceptions from the observed meteorological trends. These characteristics were: age of household head (young—20–39; adult—40–59; old—60+), sex of household head (male, female), educational level of household head (no education, primary or above), size of land owned (small—<1 hectare; medium—1–2 hectare; large—≥2 hectare) economic status (low, medium, high, which was classified based on possession of farming tools and household equipment), access to media (no access at all, had access at least once a week which was determined based on farmer’s access to a radio or television or newspaper), and social capital (low, medium, high). Social capital was measured on a four-point scale using twelve questions emphasizing household heads’ participation in community-based organizations, trust and reciprocity, and contact with locally based formal institutions. The questions were internally consistent to measure social capital (alpha = 0.78). Economic status and social capital were grouped into three classes using the cumulative square root of the frequency method.

2.5. Methods of Data Analyses

2.5.1. Data Quality Assessment

Preliminary assessment of the dataset was performed to ensure that temperature and rainfall data were of acceptable quality. Quality control functions of the ClimPACT2 software [27] were used for automated detection of erroneous data through generation of statistical summary and visual inspection of plots. The results showed that duplicate dates were not found; repeated maximum and minimum temperature values were not observed; negative precipitation values were not present in the dataset; too large values of precipitation (>200 mm) and temperature (>50 °C) were not observed; no large jumps in maximum and minimum temperature values (i.e., temperature difference with the previous day is ≥20 °C) were found; there was no record in which the maximum temperature was lower than the minimum temperature; and no missing value was found for each variable. Quality assessment was followed by the homogeneity test for each meteorological station to identify multiple step change points that could exist in a time series data. The RHtests_dlyPrcp package in R was used for the testing and homogenization of daily precipitation data [28]. Likewise, the RHtestsV4 software package was used to detect and adjust for multiple change points in temperature data that may have first-order autoregressive errors [29]. The monthly series was tested first and the result was used to test the daily series. We used a base period of 1990–2015 and the homogeneity tests were made without using reference series [30]. In the homogeneity tests, we found statistically significant discontinuty in maximum temperature in the lowland area and in minimum temperature in the lowland and midland areas. Adjustments to these daily data were applied using the quantile-matching algorithm [31], and adjusted data were used as homogenized data for trend analysis and the calculation of indices.

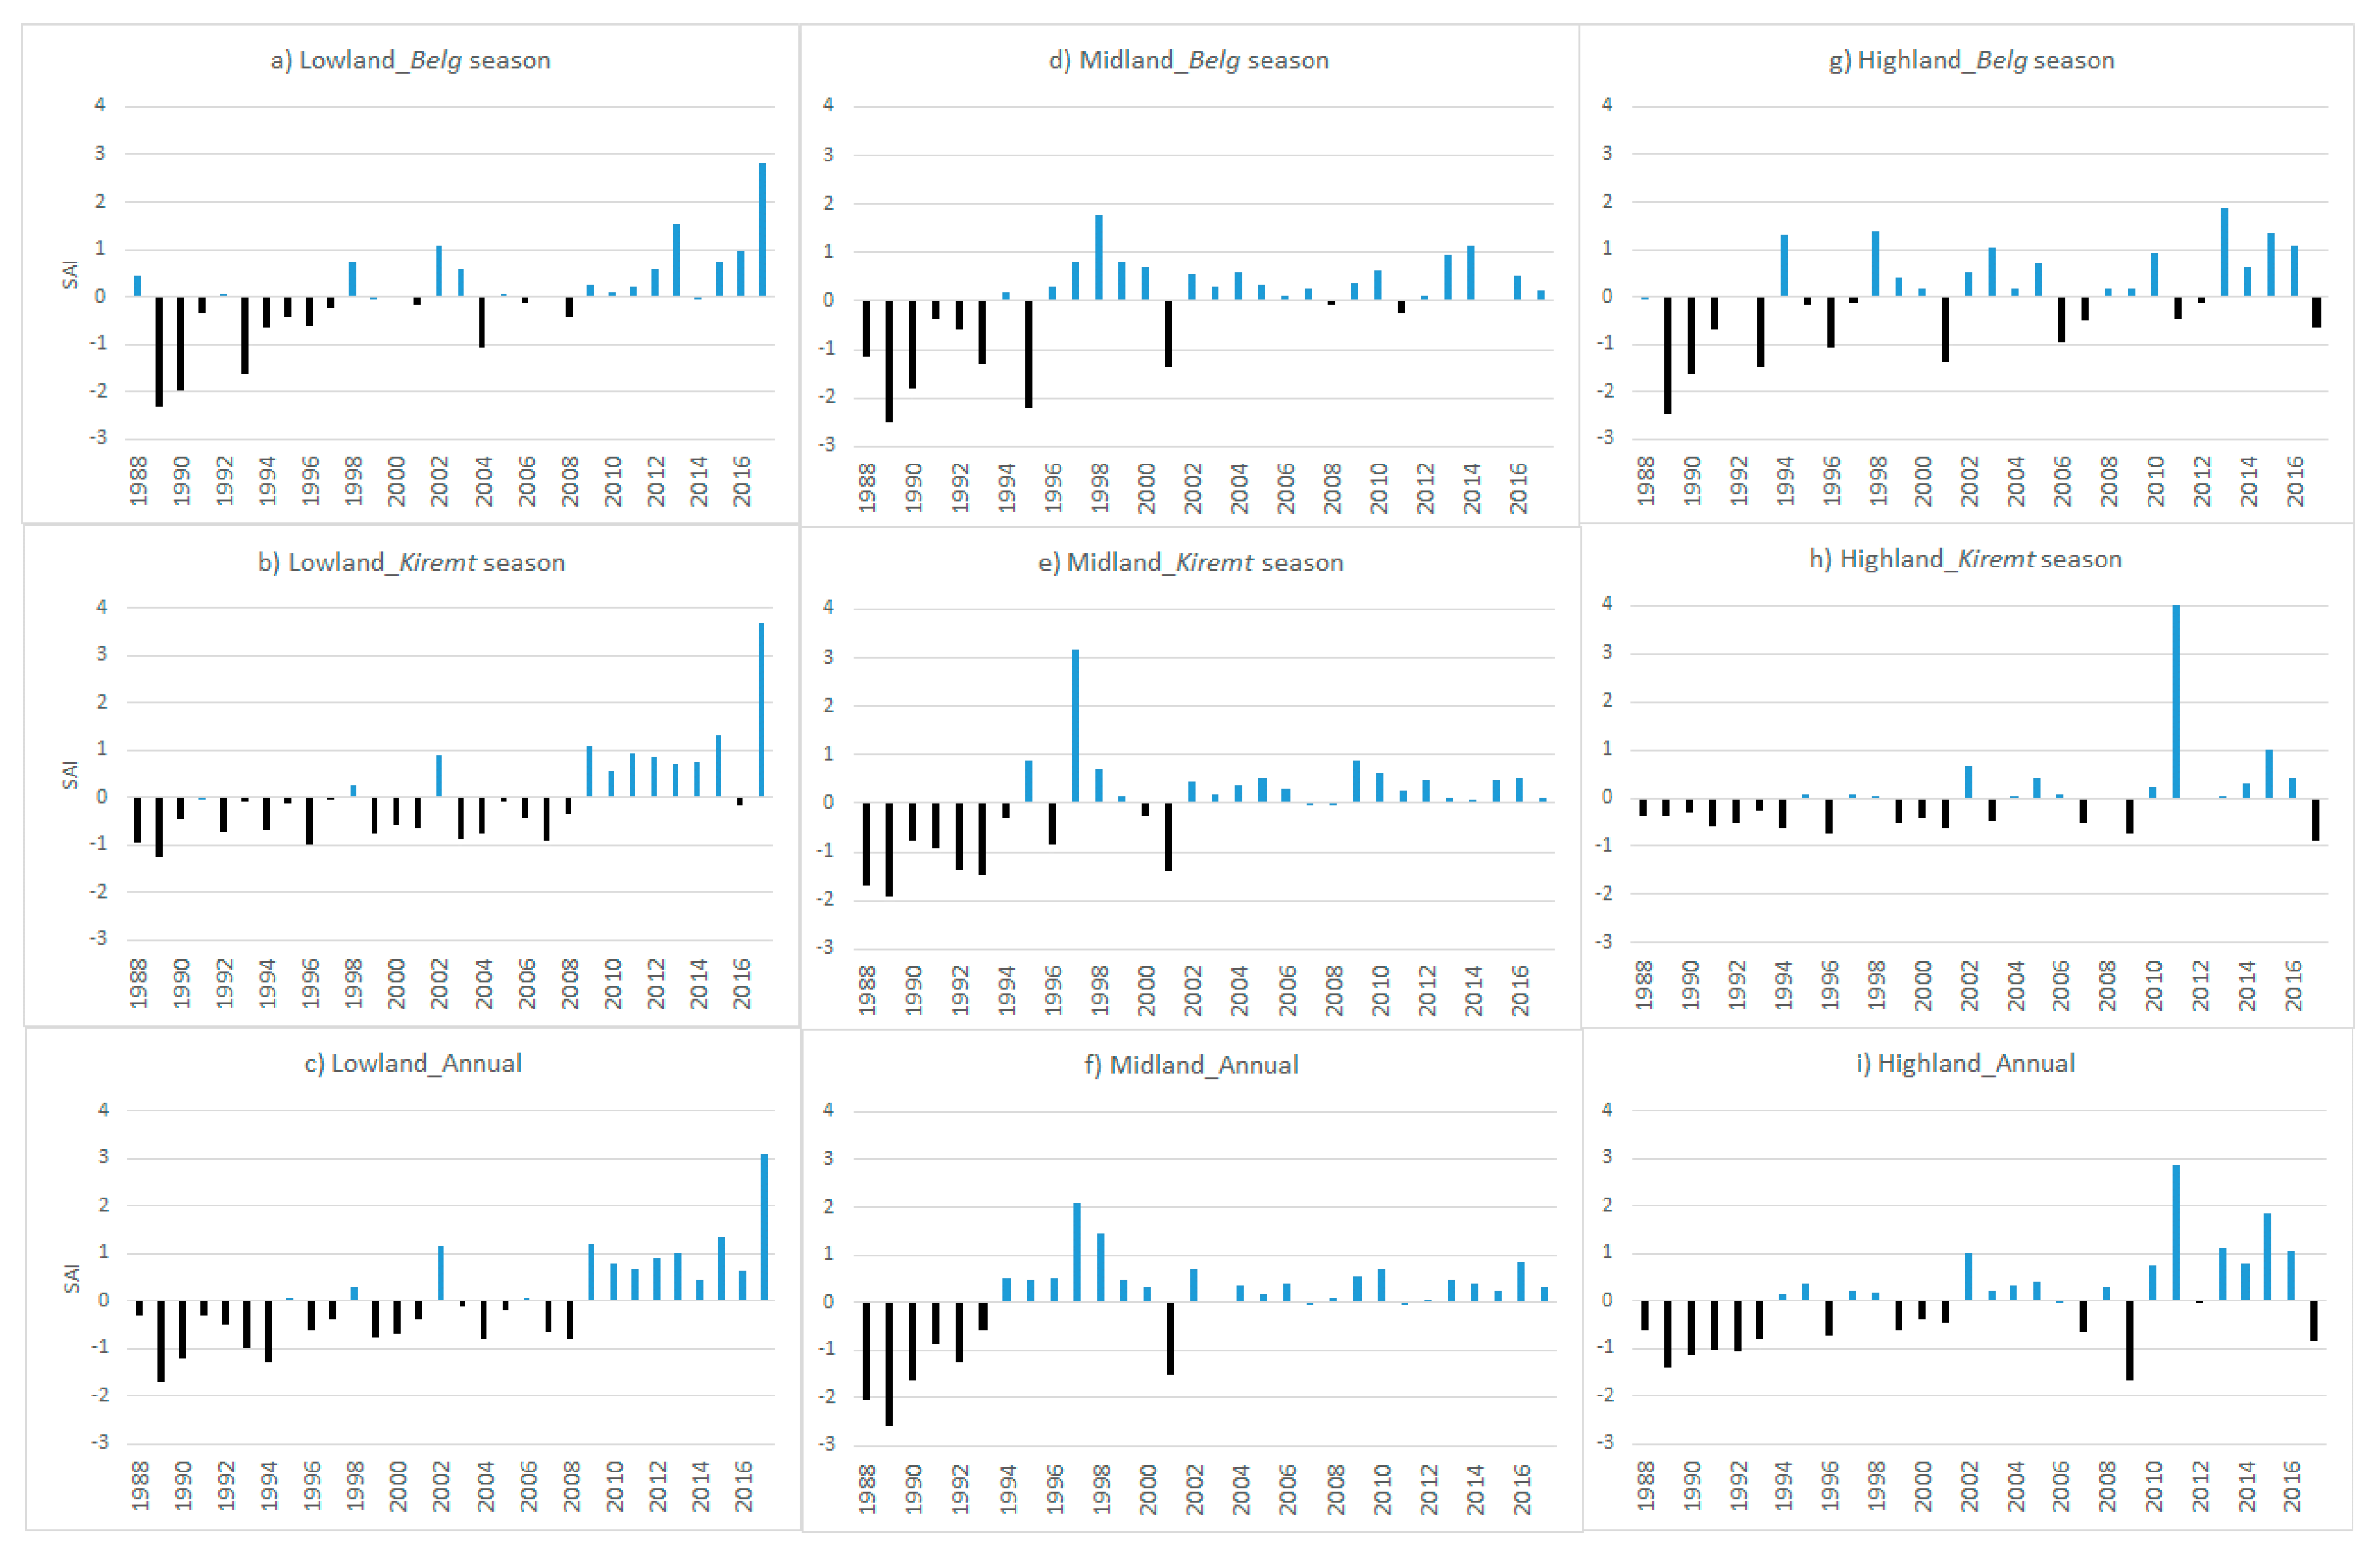
2.5.2. Measurement of Variability

The Standardized Anomaly Index (SAI) was calculated to discern variation in average temperature across the years. It was calculated using the following formula:
S A I =   T A   T M δ
where TA refers to average temperature of a year; TM shows long-term (1988–2017) mean average temperature; and δ 
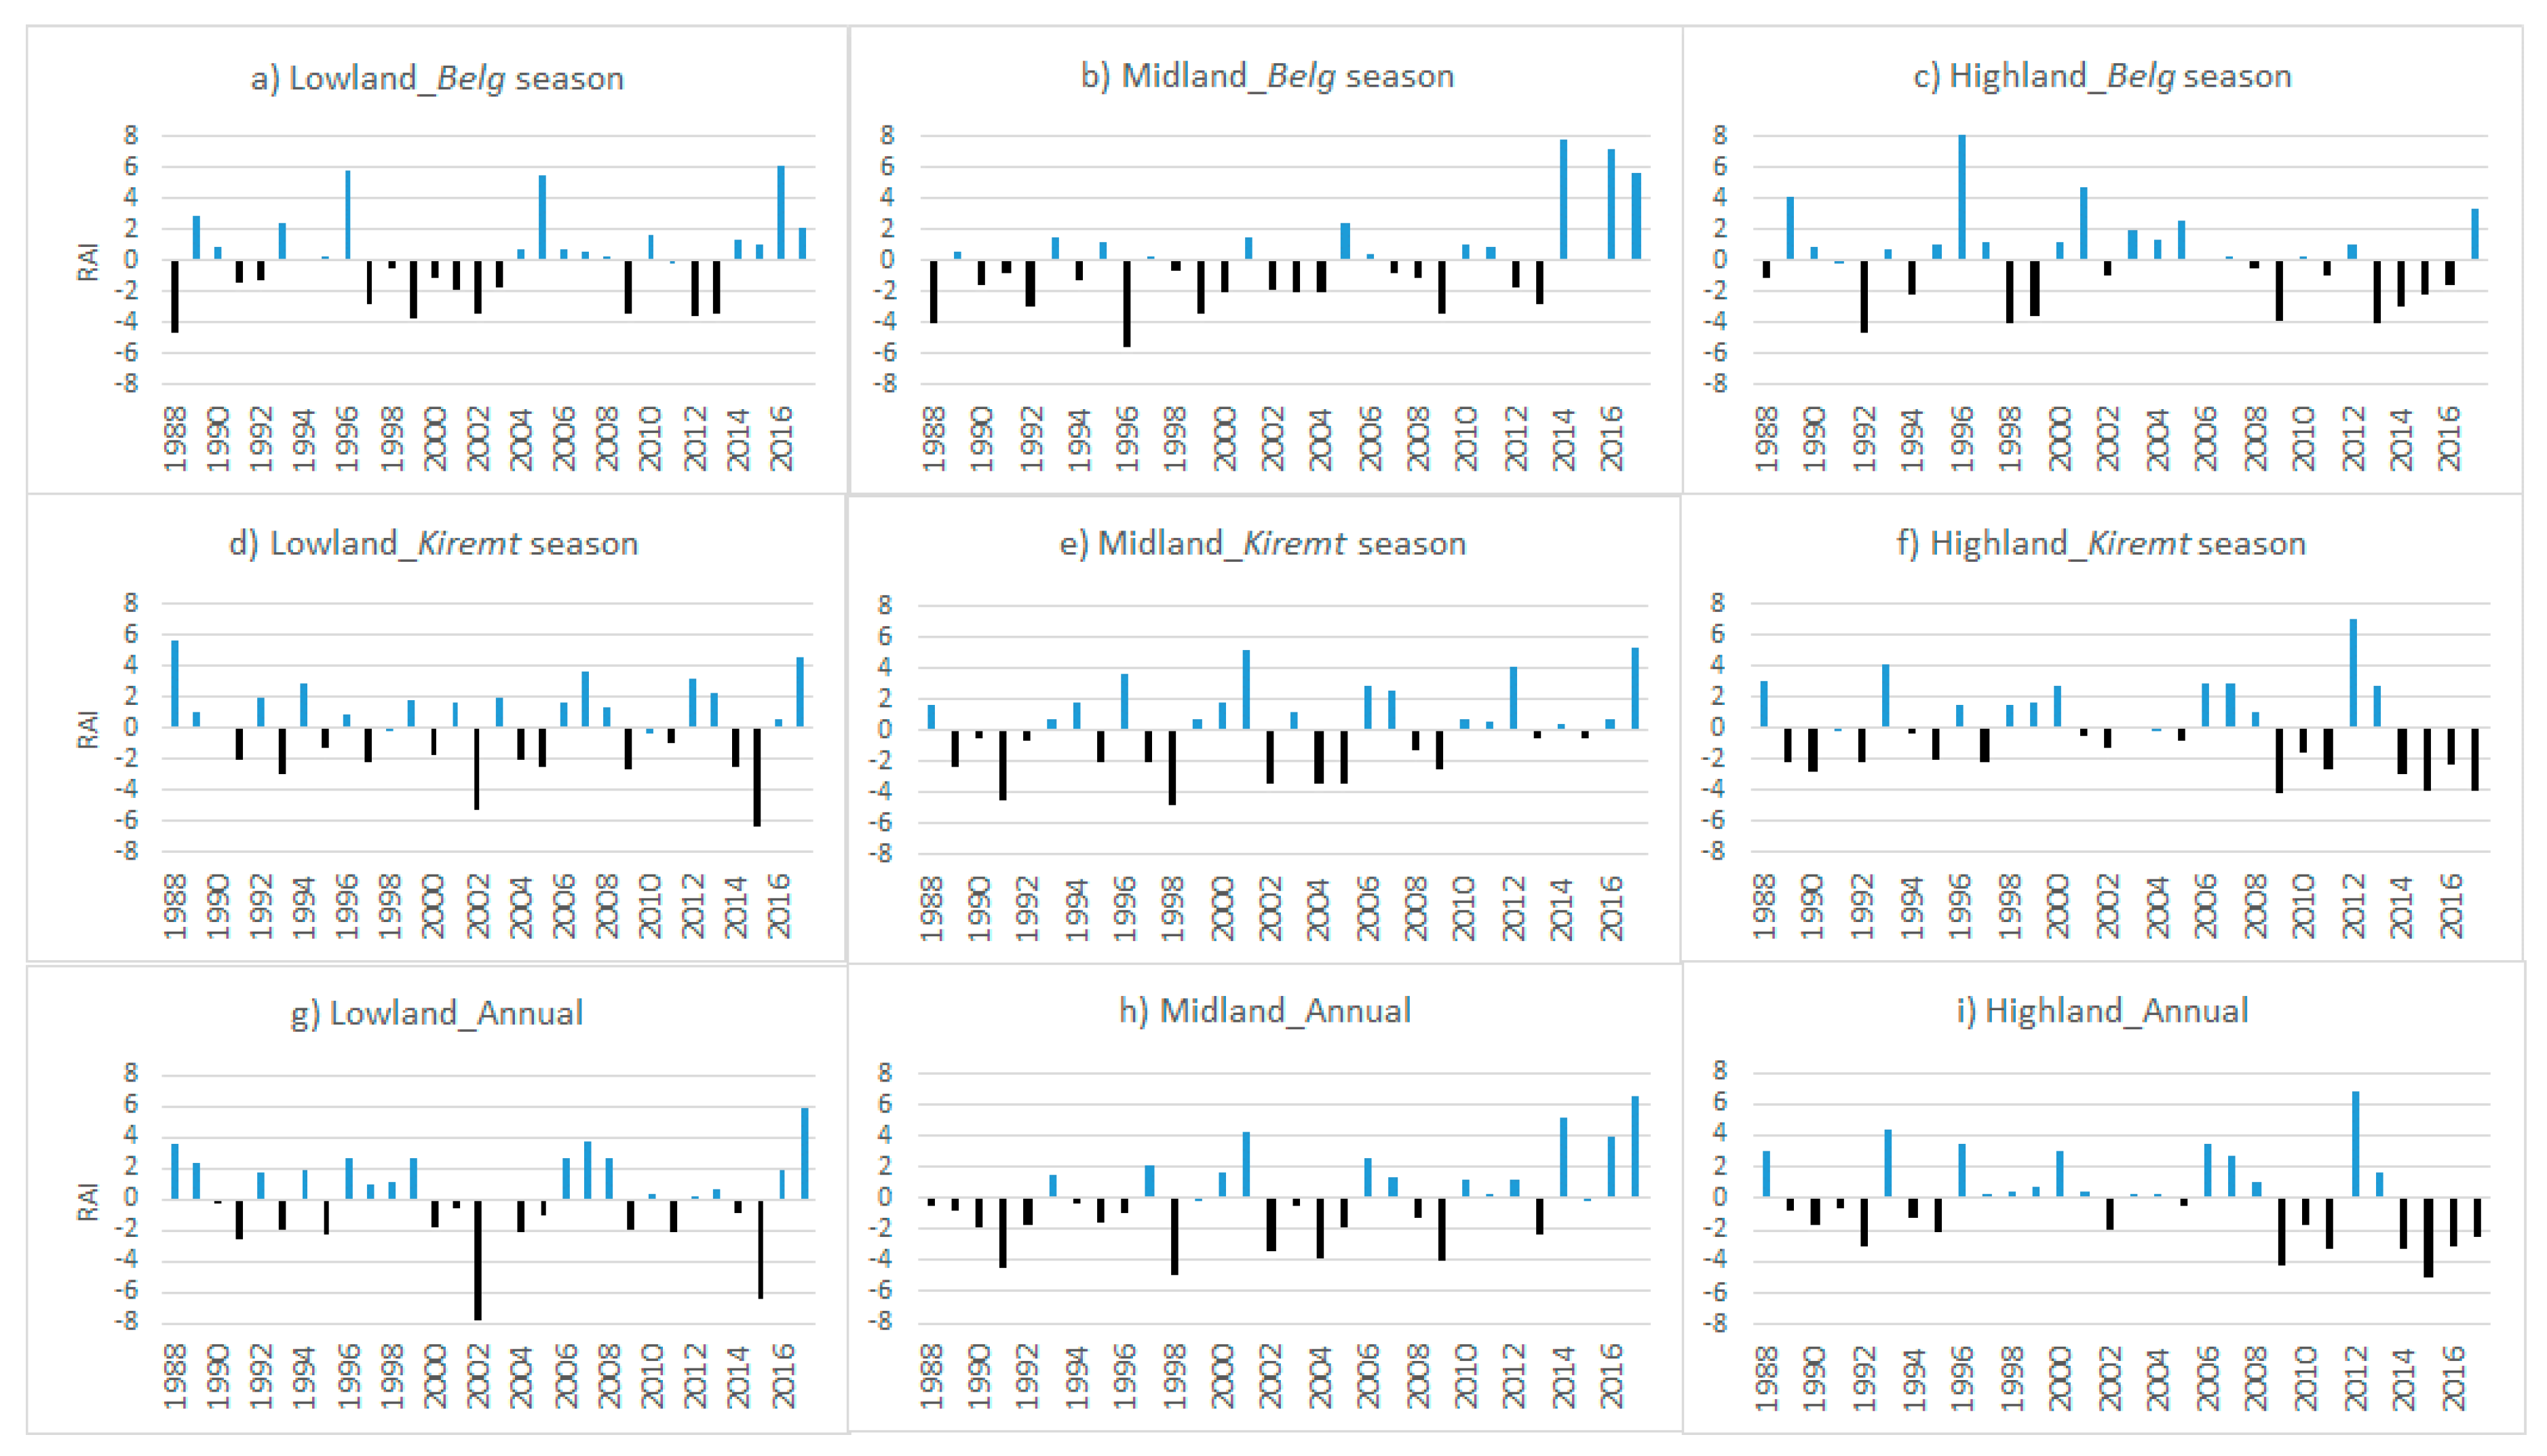
is standard deviation of the long-term average temperature. The annual Rainfall Anomaly Index (RAI) was used to identify years and seasons of positive and negative anomalies [32]. It was computed as follows for positive and negative anomalies, respectively:
R A I =   + 3   ( R F   M R F M H 10   M R F )     a n d       R A I =   3   ( R F   M R F M L 10   M R F )
where RF is the amount of rainfall during a particular year; MRF is the mean rainfall of the observation period (1988–2017); MH10 is mean rainfall of the 10 highest values during the observation period; and ML10 is the mean of the lowest 10 values of the period of record.

2.5.3. Measurement of Extreme Events

Extreme climate indices were computed using the ClimPACT2 software package in R [27]. The temperature-related extreme indices used in this study were FD (number of frost days with daily Tmin < 0 °C), CSDI (cold spell duration indicator), WSDI (warm spell duration indicator), DTR (diurnal temperature range), TXx (hottest day—maximum value of daily Tmax), TNx (hottest night—maximum value of daily Tmin), TXn (coolest day—minimum value of daily Tmax), TNn (coolest night—minimum value of daily Tmin), TN10p (percentage of cold nights during which daily Tmin is less than 10th percentile), TN90p (percentage of warm nights during which daily Tmin is greater than 90th percentile), TX10p (percentage of cold days during which daily Tmax is less than 10th percentile), and TX90p (percentage of warm days during which daily Tmax is greater than 90th percentile). Rainfall-related extreme indices considered in this study were PRCPTOT (annual total wet day precipitation), CDD (Consecutive Dry Days with precipitation of less than 1 mm), CWD (Consecutive Wet Days with precipitation of at least 1 mm), R10mm (number of heavy precipitation days with at least 10 mm), R20mm (number of very heavy precipitation days with at least 20 mm), R95p (very wet day precipitation where the annual sum of daily precipitation is greater than 95th percentile), Rx1day (maximum 1-day precipitation), and Rx5day (maximum 5-day precipitation). All indices were calculated on an annual basis. For the definition and computation of each index, see Alexander and Herold [26].
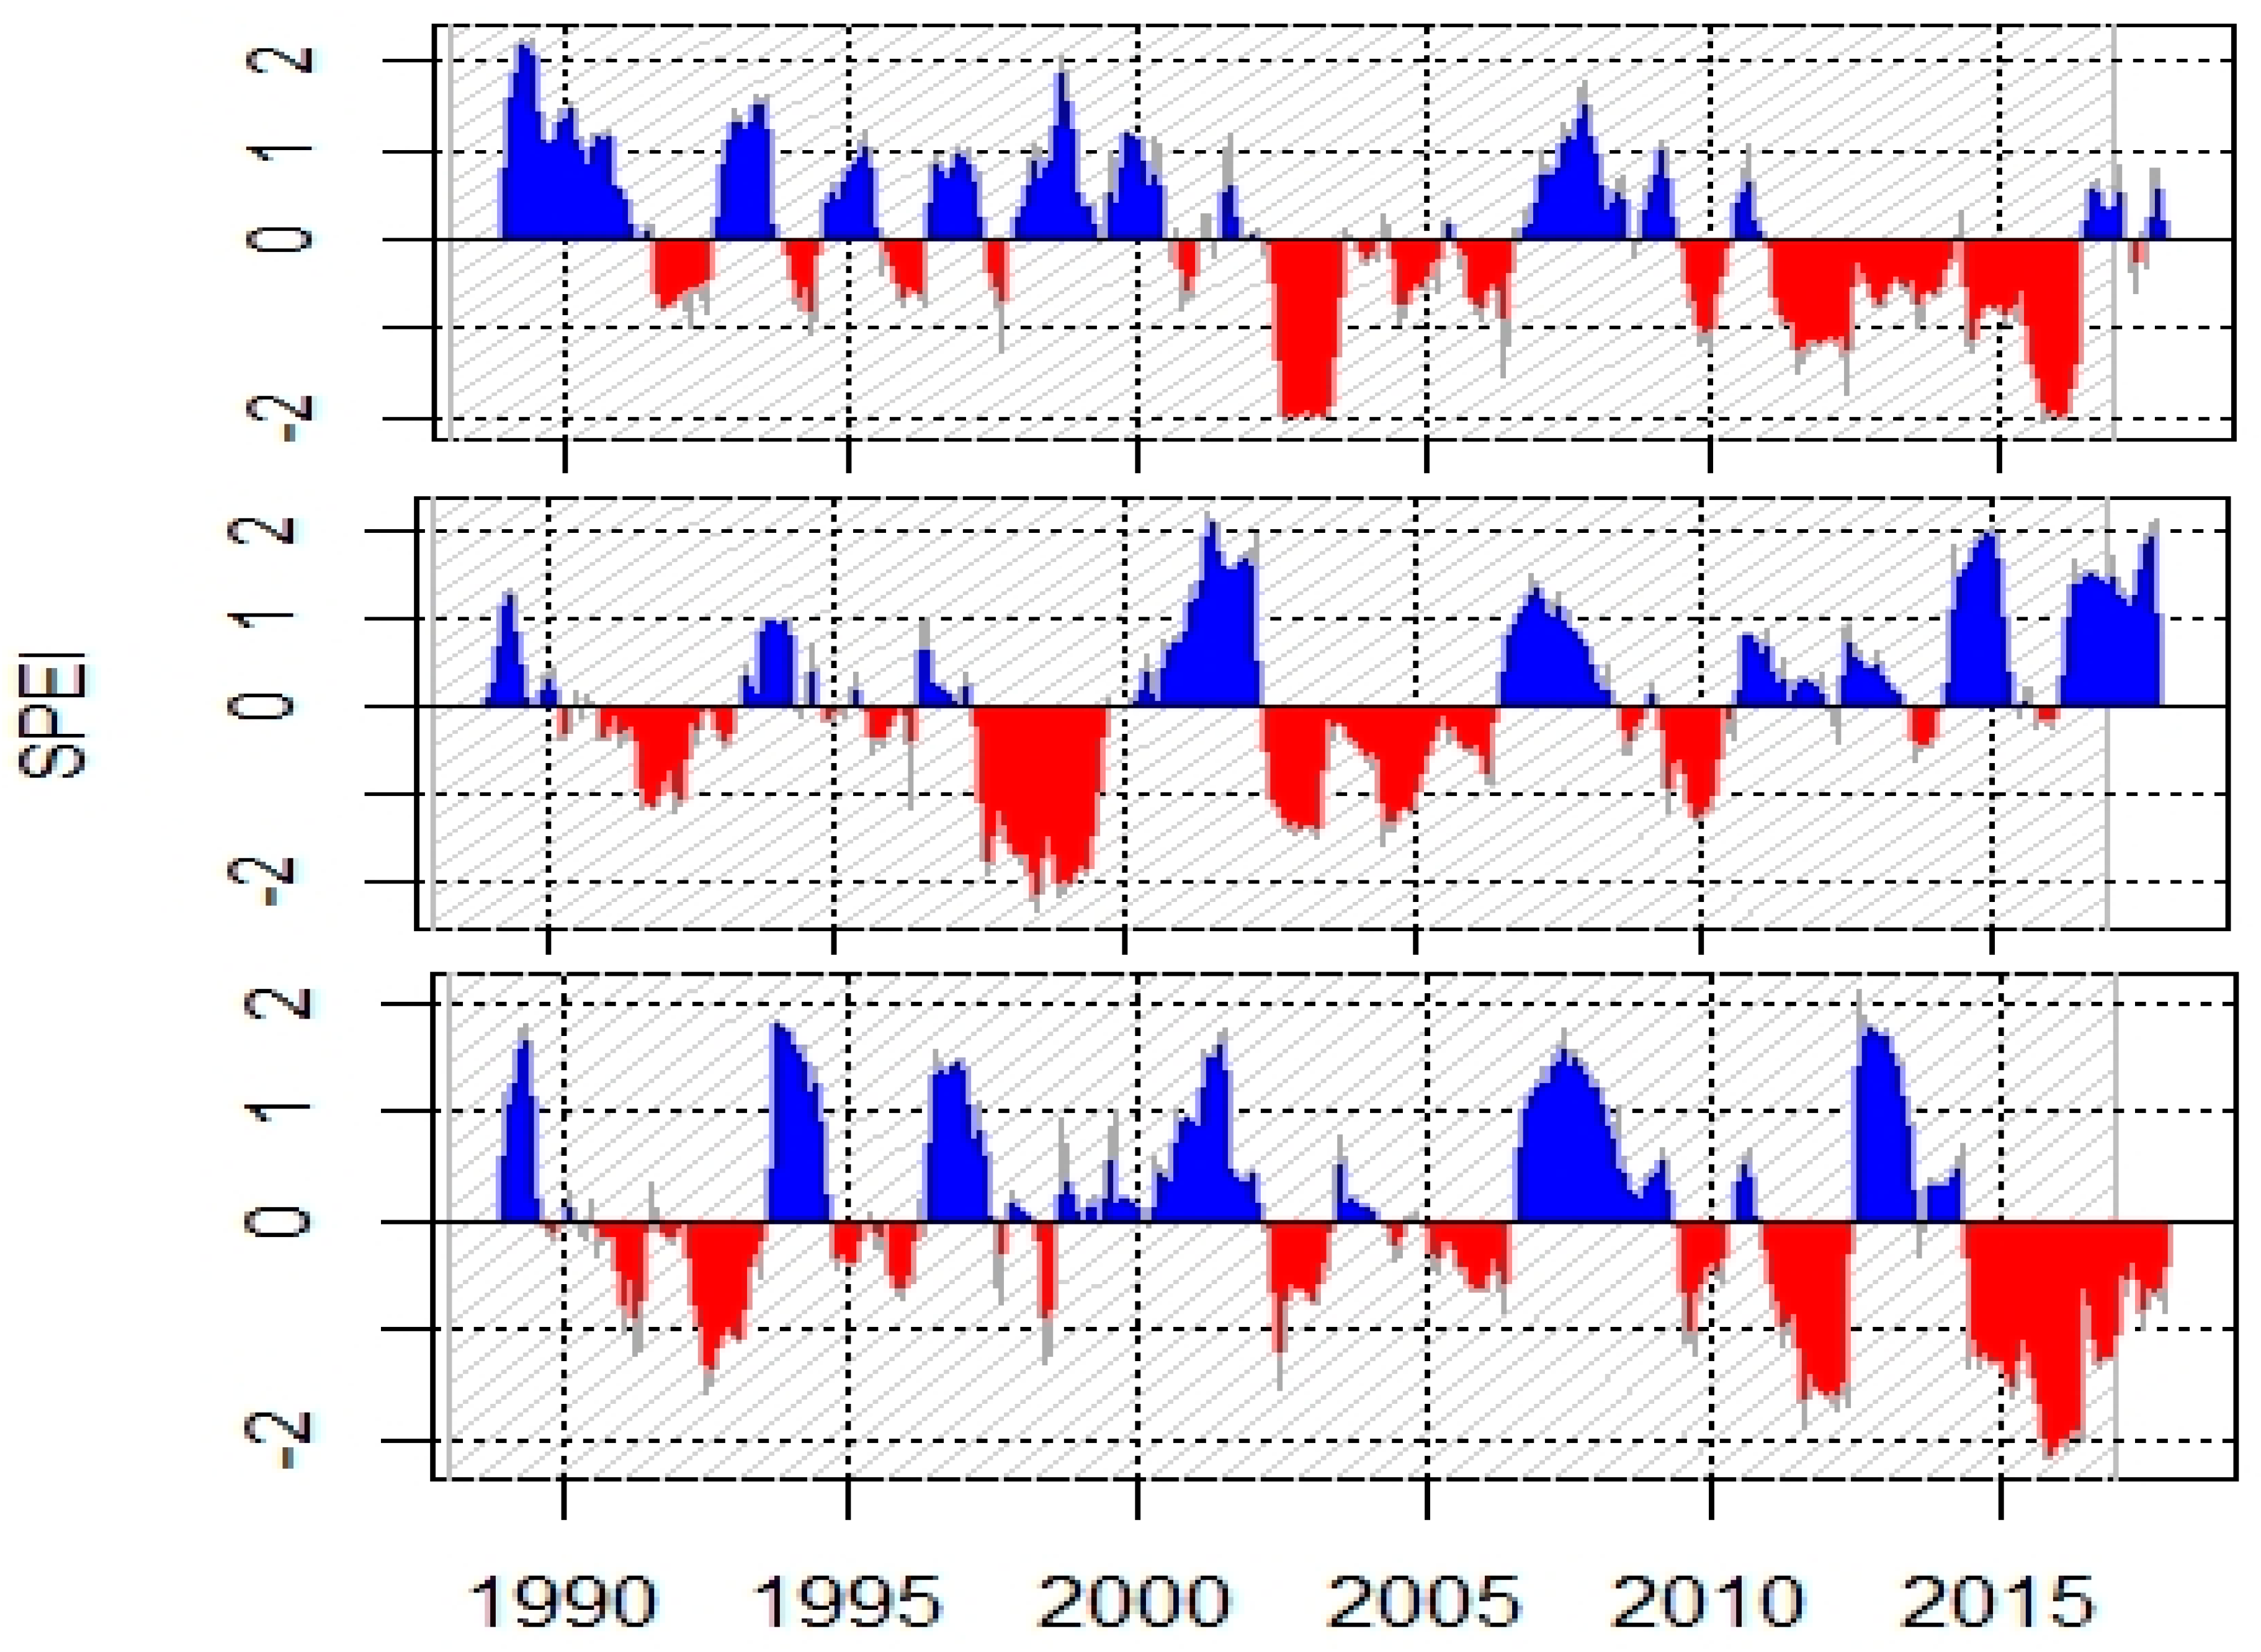
Among extreme events, drought was measured using the Standardized Precipitation Evapotranspiration Index (SPEI). It was used to assess yearly patterns of drought in the study areas. Unlike other precipitation-based indices, SPEI is multi-scalar since it integrates the effects of temperature and precipitation [33]. SPEI is computed from climatic water balance which is the difference between precipitation and potential evapotranspiration (PET). Depending on the availability of data, PET was computed using Hargreaves equation that make use of precipitation, maximum temperature, and minimum temperature [34]. SPEI package in R was used for computation of annual indices.

2.5.4. Trend Analysis

The Mann Kendall (MK) test, which is a non-parametric test used to analyze monotonic trends of changes in hydro-meteorological data, was used to examine trends in seasonal and annual temperature and rainfall as well as temperature and rainfall extremes [35,36]. Positive and negative values of MK test results indicate increasing or decreasing monotonic trends, respectively. The magnitude of changes in the trends of rainfall and temperature data was determined using Theil-Sen’s slope estimator. The MK test statistic, S, was calculated as:
s =   i = 1 n 1 j = i + 1 n s g n   ( X j   X i )
where Xi and Xj refer to the annual values of the climate variables in years i and j, respectively. For time-series data with significant autocorrelation, the modified MK test was used. In this procedure, bias-corrected prewhitening, involving transformation of an autocorrelated sequence into an uncorrelated one before trend testing, was used [37]. This technique enhances the effectiveness of prewhitening in trend analysis by eliminating under- or overestimation of the autocorrelation parameter within the limits of sampling variations [37].

2.5.5. Onset and Cessation of the Rainy Season

The date of onset of kiremt rain was determined using a minimum threshold daily precipitation of 1 mm and a total of at least 20 mm of rainfall accumulated in three consecutive days after June 1 [38]. For the belg season, due to highly erratic rainfall, onset was defined as a total of 10 mm of rain in three consecutive days after 1 March. To avoid the mislabeling of a false start, the additional criterion was used that the three-days cumulative total was not followed by a dry spell of at least ten consecutive days within 30 days. Daily rainfall of less than 1 mm was considered as a dry spell. The end of the rainy season was identified as the first day after 1 September of each year when the water balance, estimated using R-INSTAT, falls to 0 which causes water stress to crops. Assuming that it is the level which determines the occurrence of severe water stress to crops [39], the maximum soil water holding capacity was set to be 100 mm and evaporation was set at 5 mm per day. The length-of-growth period (LGP) is the duration of time between the onset and cessation dates. The probability of exceedance was calculated using RAINBOW software to determine early, normal, and late onset and cessation dates of rainfall [40].

2.5.6. Analysis of Convergence and Divergence Using Polling

The values of the climate variables were computed for each household. This was performed using GAMS software in three stages. First, using the latitudinal and longitudinal locations of three meteorological stations and the households, the Manhattan distance between each household and the three stations was calculated. Second, based on these metrics, the nearest station, the second nearest station, and the third nearest station were identified. Following the Inverse Distance Weighted interpolation process, we took the inverse of the distance values and normalized these values to sum to 1 to calculate the weighting factors corresponding to the three stations. Lastly, the values for each household were calculated by multiplying the observed meteorological data of the three stations by the respective weighting scores of the households.
Then, the polling method was applied to discern the profiles of households whose perception converges with or diverges from the meteorological data. Polling is a multivariate analysis technique involving a joint analysis of a large number of integer-valued explanatory variables using the maximum likelihood prediction method [41]. It is used to jointly evaluate the roles of different variables in predicting the likelihood of convergence or divergence between meteorological data and perceptions. The joint empirical frequency distribution is defined from observed values of the explanatory variables. Then, conditional frequency distributions are derived from this joint distribution by partitioning the answers by, e.g., S respondents indexed s into a vector y of a dependent variable and a vector x of explanatory variables, taking the frequencies of y conditional on x [41,42,43].
C o n d i t i o n a l   f r e q u e n c y =   m y x y ϵ G x m y x                 C o v e r a g e =   m y x x m y x
where m is the mass of the observations, Ys and Xs show integer coded values of the dependent and explanatory variables, respectively. The conditional frequencies show probability estimates of y given profile x. Hence, the set of most probable characteristics associated with each x value (the “winner”) has the highest probability of having the desired y outcomes (convergence or divergence). The coverage of a profile x is the mass of a class within profile x divided by the total mass of the relevant group. The edge of the winning profile over the runner up (i.e., the second best guess) is the ratio of their maximum likelihood probabilities (i.e., the share of the population covered by the most likely profile relative to the share covered by the runner-up). Selection of the best profile from the set of explanatory variables was based on the coverage and edge of each combination. In addition to the observed and perceived climate variables, all possible combinations of four explanatory variables were used to identify the profiles of households whose perceptions converge with or diverge from the meteorological results.

3. Results

3.1. Long-Term Trends of Temperature and Rainfall for Different Agro-Ecological Settings

3.1.1. Trends of Temperature

The average annual temperature of the lowland, midland, and highland areas during the observation period was 22.1, 15.5, and 14.6 °C, respectively. As shown in Table 1, the average annual temperature significantly increased by 0.4 °C per decade in the lowland and by 0.3 °C per decade in the midland areas. The result suggests that the increase in average annual temperature in the lowland areas was related to significant increases in average maximum temperatures, whereas, in the midland areas, there was a significant increase in both average maximum and average minimum temperatures. The seasonal pattern shows increasing trends in average annual temperature during both belg and kiremt seasons in all areas. Increases in average maximum temperatures seem to have caused significant increases in the average temperature of the belg season in the lowland areas and average temperatures of the kiremt season in the midland areas. In other cases, this significant increasing trend was partly related to an increase in the average minimum temperature.

3.1.2. Trends of Rainfall

The MK test result shows contrasting patterns of the trends of annual rainfall (Table 1). In the lowland and highland areas, the decline in rainfall was not statistically significant, indicating no trend in rainfall time series. Conversely, there was a significant increasing trend in annual rainfall in the midland area. In this area, belg and kiremt rainfall significantly increased at respective rates of 45 and 154 mm per decade.

3.2. Annual and Seasonal Variability of Temperature and Rainfall

3.2.1. Temperature Variability

There was noticeable inter-annual and seasonal variability in the average temperature of the study areas (Figure 2). In the lowland and midland areas, the annual average temperature was less than the overall average of the observation period during the first two decades. However, the anomaly indices were positive in recent years, suggesting that the areas are warming. The pattern in the midland areas shows warmer years during the first one and half decade and colder years recently. During most of the years since 2001, the average annual temperature was consecutively lower than the 30 years average. The annual variability of average temperature was very high during the belg season compared to the kiremt season in all areas.

3.2.2. Rainfall Variability

The long-term average annual rainfall of the midland areas was 1185 mm followed by the highland and the lowland areas with respective amounts of 785 and 509 mm. There was noticeable inter-annual and inter-seasonal variability of rainfall (Figure 3). Negative rainfall anomalies were commonly observed during the belg season in all agro-ecological settings, being more apparent in the highland areas in recent years. There were also several years of below-average rainfall during the main farming season in the three areas. The kiremt season in all areas was characterized by yearly differences in rainfall anomalies. Consecutive years of below-average kiremt rainfall was observed mainly in the highland areas. Annual rainfall was below 30 years average in about 47% of the observations in the lowland areas during both belg and kiremt seasons. In the midland and highland areas, below-average kiremt rainfall was observed during 47% and 60% of the observations, respectively.

3.3. Analysis of Extreme Events

3.3.1. Trends of Extreme Precipitation Indices

Annual total wet-day precipitation (PRCPTOT) has significantly increased by about 25 mm per year in the midland areas (Table 2). Moreover, the number of consecutive wet days significantly increased in the midland areas by about three days every decade. The annual number of days with precipitation of at least 10 and 20 mm has increased in these areas respectively by about 9 and 4 days per decade. Similarly, there was a significant increase in maximum 1-day (RX1day) and maximum 5-day (RX5day) precipitation in the midland areas by about 9 and 19 mm per decade, respectively. These figures denote the higher chances of occurrence and increasing trend of flooding in these areas. On the other hand, there was a significant increase in the number of consecutive dry days by 23 days per decade in the highland areas. The amount of maximum 1-day precipitation has significantly decreased by 3.3 mm a decade in the highland areas. There were no significant trends in any of the precipitation indices in the lowland areas.

3.3.2. Trends of Extreme Temperature Indices

The results in Table 3 show an increasing trend of extreme temperature indices. Annual maximum daily maximum temperature (TXx) has significantly increased by approximately 0.4 °C per decade in both the lowland and highland areas. Likewise, minimum daily maximum temperature (TXn) has significantly increased by 0.8 °C per decade in the lowland areas. Annual maximum daily minimum temperature (TNx) has significantly increased in the midland and highland areas. In the lowland areas, a significant decrease in the percentage of cold days (TX10p) by about 6% was noted. Conversely, the annual percentage of warm days (TX90p) has increased significantly by 7.7% in the lowland and by 5.2% per decade in the highland areas. The percentage of cold days (TN10p) has declined in all areas, but the decline was statistically significant in the lowland (by 2.5%) and midland (by 9.4%) areas. The percentage of warm nights (TN90p) has significantly increased in the midland and highland areas at 4.9% per decade. Consequent to changes in daily maximum and minimum temperature, there was a change in DTR. It significantly increased in the lowland areas by about 0.4 °C per decade but significantly decreased in the midland areas by about 0.7 °C per decade. The decline in cold spell (CDSI) was significant only in the midland areas. Contrariwise, the number of warm spell days (WSDI) has significantly increased in both the lowland and highland areas.

3.3.3. Trends of Drought

Figure 4 shows the yearly patterns of drought measured using SPEI. The number of drier years was increasing in the lowland and highland areas recently, whereas the reverse was observed in the midland areas. In the lowland areas, the years before 2000 were mainly wet. Since 2000, most of the years were drier and it was observed consecutively between 2001 and 2005 as well as between 2009 and 2015. In the highland areas, although it was not as frequent as the lowland areas, there were intermittent dry years. However, it has occurred frequently since 2009. The pattern in the midland areas is somewhat different. Although dry years were occurring frequently and consecutively during the first two decades of observation, increase in the number of wet years was observed during the last decade. There were only two drier years since 2009 in the midland areas, whereas it was observed six times in both lowland and highland areas. Drier years constituted 53% of the years of observation in the lowland and midland areas, and 47% in the highland areas.

3.4. Onset and Cessation of Rainfall

There was a failure of belg rain (no consecutive three days rainfall total of 10 mm) for one year in lowland and midland areas and for five years in the highland areas (Table 4). Most of the observation years in the highland and lowland areas were characterized by false onset in which the beginning of rainfall was followed by more than ten days of a dry spell during the subsequent 30 days. It was only in one-third of the years of observation that there was a proper onset of belg rain in the lowland and highland areas. This season is also characterized by a small number of rain days and a prolonged period of dry spells, some being longer than 50 days in all areas.
There were noticeable inter-annual and agro-ecological differences in the onset and cessation of kiremt rain (Figure 5). The date of onset was generally early in the midland areas and late in the lowland areas. In the midland areas, it was as early as the 153rd day of the year (1 June) in 2001 and as late as the 183rd day of the year (1 July) in 1989. In the lowland areas, early onset was observed in 1996 on the 158th day of the year (6 July). Very late onset was observed on the 231st day (18 August) in 2015. The average date of onset in the lowland areas was 12 July. In the highland areas, the early date of onset was observed on 5 June 1996. Rainfall mainly stopped in September in the lowland areas (245th–274th day). Although the end of the kiremt season was observed to be in September in a few years and exceptionally late (the first week of November) in 1999 and 2000, October was the main ending time in the midland areas. In the highland areas, the season variably ended either in September or October. Owing to these differences in the dates of onset and cessation, the length-of-growth period (LGP) varied between years and agro-ecological settings. Since there was late onset and early termination, LGP was shorter in the lowland areas. On the other hand, early onset and late cessation elongated LGP in the midland areas. Although the LGP noticeably varies across years, most of the major cereal crops produced in the areas such as sorghum, maize, and teff require longer period.
Following previous works [44], the probability of exceedance of 75%, 50%, and 25% were used to categorize the time of onset and cessation of kiremt rainfall to be early, normal, or late. The time of onset of rainfall was normal in 18, 15, and 14 years of observation in the lowland, midland, and highland areas, respectively. During the remaining years, it was either early or late. The time of cessation was early for 12 years in the lowland areas, but it ceased at a normal time for 16 years in the midland and for 12 years in the highland areas. As shown in the joint consideration of time of onset and cessation in Figure 6, it was only in about one-fourth of the observation period that the time of onset and cessation of rainfall was normal in the lowland and midland areas. In the highland areas, early onset was followed by either early or normal cessation during most of the years. In about one-tenth of the years of observation, the rain started late and stopped at a normal time. The time of onset and the time of cessation that are assumed to be favorable for agricultural activities (early onset and late cessation, normal onset and normal cessation, normal onset and late cessation) were observed during a few years only; this holds for all areas.

3.5. Farmers’ Perceptions of Climate Change, Variability, and Extreme Events

In the household survey, the major climate-related events reported by respondents were climate variability (delayed onset and early termination of rainfall) and the occurrence of extreme events (Figure 7). The values in the Figure show the percentage of farmers responding “yes” to the question on the perceived occurrence of the extreme events. More than 90% of the household heads in each area reported delayed onset and early termination of rainfall. The percentage of household heads who reported drought was the highest in the lowland areas and it declined consistently as altitude increases. Frost and waterlogging were mainly the problem of farmers in the highland areas. Compared to the other two areas, the percentage of household heads who reported flood and snowfall was higher in the midland areas.
The problem that was commonly raised during the FGDs in all areas was lack of rainfall. Farmers in the lowland areas stated the problem as follows: “it is lack of rainfall that makes us inferior to other people. Our neighbors in the other kebeles play with water. But, in this kebele, it is lack of rainfall that makes us and our children jobless; that changes our skin color; that changes our hair color to grey before we get old” [FGD-L-9]. Farmers in another village in the lowland area further explained that they are not able to benefit from their fertile land due to lack of rainfall saying that: “if there is rain, the hair even grows on the bare head of a person, let alone on this land. There is a lack of rainfall” [FGD-L-10]. In particular, lack of rainfall is most pronounced during the belg season in the three areas, due to which farmers indicated that they are forced to produce only once a year during the kiremt season, abandoning the production of belg crops. Farming in kiremt is also affected by delayed onset and early termination of rainfall. As pointed-out by farmers, “the rain falls late after sowing time passes … and due to early termination of rainfall, the farmlands get dry and crops do not grow very well” [FGD-M-7].
Similar to the results of the household survey, evidence from the FGDs indicated that extreme events occur in the study areas with varying magnitude. Drought was boldly stated by residents of the lowland areas as follows: “It is this problem [drought] that made us lag behind; that wasted our age; that depleted our resources. We have wide farmland; we are healthy. Our major bottleneck is drought …. drought made as beggars” [FGD-L-9]. Frost is mainly raised as a problem in the highland areas. Farmers explained that “it [frost] comes when the crop matures. When it comes, our effort of one year is damaged in one day” [FGD-H-3]. According to farmers’ observation, though the cold period begins in November, it has become colder than in the past and the cold period starts as early as September. The other problem identified by farmers in the highland areas was waterlogging. The frequently mentioned extreme event in the midland areas was heavy rainfall in summer, which causes erosion and exacerbates the problem of a landslide. Farmers explained that “in the past, during the rainy season, there were foggy days with drizzle rainfall for the whole day that was conducive for agriculture. Now, rain falls heavily and erodes our soil, which also becomes a cause for a landslide” [FGD-M-5].
Farmers have developed traditional methods of forecasting weather conditions and making farming decisions. Owing to the absence of established means of knowledge transmission, these methods are not generally known in some villages. Farmers revealed that the local-knowledge-based traditional forecast system involving the observation of various signals is known only by few elderlies and that there is a generation gap in valuing the roles of these traditional forecasts in the usual farming activities. The information obtained from the traditional forecast is not considered to be dependable for farming decision making, as farmers said, as the observed weather condition deviates from the predictions based on traditional knowledge and expectations. Consequently, observing traditional signals is not an assurance that rain will come or will come at the expected time. The limited role of traditional methods of the forecast increases the demand for modern weather information for farming activities and climate risk management. However, the farmers noted that they do not have access to weather information. When it is available through media broadcasts, it is often reported at a higher spatial scale which, according to farmers, does not show the local weather condition and hence is not relevant for farming decisions. In addition, information on the expected time of onset and cessation of rainfall is generally missing in the weather forecasts of higher spatio-temporal resolution.

3.6. Convergence and Divergence Between Meteorological Data and Farmers’ Perceptions

With no noticeable difference between the three agro-ecological settings, most of the farming households were headed by young persons and adults (Table 5). Most of the households were headed by males. About two-thirds of the households had no formal education. Nearly one-third of the farmers had less than one hectare of land, whereas the percent of households owing greater than two hectares was relatively higher in the highland areas. Half of the farming households had medium economic status. In the highland areas, close to half of the farmers were economically better-off, whereas, in the midland areas, only about one-in-ten households had higher economic status. While most of the farmers had moderate social capital, higher percentage of farmers in the highland areas had high social capital. Slightly more than half of the farmers had no access to media.
In general, the change in temperature was correctly perceived as about three-fourth of the farmers correctly perceived that temperature was increasing (Table 6). However, for rainfall, perception and actual results aligned for only 5% of the farmers. While the measurement showed no significant change in the amount of rainfall during 30 years of observation, most of the farmers (62.2%) perceived that it was either decreasing (55.9%) or increasing (6.3%). In areas where rainfall was increasing, the perception of 32.7% of the farmers was not consistent with the actual result as they perceived that it was decreasing (32.3%) or that there was no change (0.4%). The occurrence of drought was correctly perceived by half of the farmers. The perception of about one-third of the farmers converged with the meteorological result concerning the occurrence of flood. Variability in the time of onset and cessation of rainfall was correctly perceived by most of the farmers. Close to two-thirds of the farmers correctly perceived late onset of rainfall. Likewise, the perception of more than half of the farmers (55.2%) converged with the meteorological data that there was an early cessation of rainfall during the kiremt season. However, although the meteorological data showed otherwise, slightly more than one-third of the farmers wrongly perceived that there were late onset and early cessation of kiremt rainfall.
Table 7 shows the profiles of farmers whose perceptions converges with and diverges from observed rainfall and temperature records. In the midland areas, the perception of farmers converged with the statistical result showing a significant increase in rainfall over the 30 years. Likewise, male household heads and those who had access to media had more accurate perception of rainfall trends. The share of farmers with correct perception of increasing rainfall in this winning profile was 34%. In the highland areas, farmers’ perception converged with the meteorological results that there was no change in the amount of rainfall. Old-age farmers and those who had access to media correctly perceived that there was no change in the trend of rainfall. On the other hand, with the highest share of farmers with diverging perception included in this winning profile (86%), there was a divergence between meteorological results and perception among farmers with no education, no access to media, a large size of land (≥2 ha), and medium economic status. Male household heads, those who had medium social capital, and those with access to media had a correct perception of an increase in temperature that converges with meteorological results. Farmers residing in the lowland areas also correctly perceived an increasing trend of temperature. A wrong perception of temperature was observed among farmers with no education, no access to media, a medium or large size of land, and medium economic status. Temperature perception that diverges from the meteorological result was also noticed among farmers residing in the midland areas.
The profiles of households whose perceptions of drought and flood was consistent with observed trends of drought and flood are shown in Table 8. Drought was computed using the Standardized Precipitation Evapotranspiration Index, whereas flood was measured using a proxy indicator of change in the number of heavy precipitation days (R10mm). Accurate perception of drought varies by agro-ecological settings. While farmers in the lowland areas perceived the occurrence of drought, which was convergent with the meteorological result, the absence of drought was correctly noticed by farmers in the midland areas. Adults, males, as well as farmers with access to media at least once a week and higher social capital correctly perceived the occurrence of drought. However, the perception of farmers in the highland areas diverged from the meteorological result. Although the observation showed drought occurrence, it was not perceived by farmers. The drought perception of farmers who had no education, no access to media, owned a large size of land, and medium economic status diverged from the meteorological data. The coverage this profile has of the relevant farmers was 27%. The likelihood of having the highest probability to have this diverging perception was also relatively higher (1.95). Convergence and divergence in flood perception also vary by agro-ecological settings. In the midland areas, farmers’ perception of a flood as a key problem was confirmed by the meteorological data. In addition, the perception of farmers with at least primary-level education, owned a small size of land, and medium social capital on the occurrence of flood aligned with the observed data. The perception of farmers in the highland areas also converged with the meteorological data that there was no flood. In the lowland areas, although farmers perceived the occurrence of flood, it was not supported by meteorological data. Lack of education, lack of access to media, being a young household head, and medium economic status further characterizes households with an inaccurate perception of flood occurrence. The share of farmers failing to recognize the actual occurrence of flood in the winning profile was 40%. It is also worth noting that there was heterogeneity among farmers from the same agro-ecological settings as there were farmers from the midland areas who had an inaccurate perception of drought and flood occurrence.
The profile of households with convergent and divergent perceptions of the time of onset and cessation of kiremt rainfall is shown in Table 9. Accurate perception of the occurrence of late onset of rainfall was observed among male household heads, owners of the small size of land, households with medium social capital, and residents of the midland areas. Eleven percent of the farmers with the right prediction are characterized by this winning profile. The perception of a late onset of rainfall that deviates from the meteorological result was observed among farmers in the lowland and highland areas. In the lowland areas, farmers perceived a late onset of rainfall, which was not consistent with the actual measurement. In the highland areas, although the meteorological data showed a late onset of rainfall, farmers’ perception diverged from this. In addition, lack of education, low social capital, lack of access to media, young household heads, and ownership of medium size of land characterized households whose perception diverged from the meteorological data. Early cessation of kiremt rainfall was accurately perceived by adults, males, owners of the small size of land, medium social capital, and poor farmers. Although the share of farmers included in the profile was smaller, lack of education, ownership of a large size of land, lack of access to media, and medium economic status characterized farmers whose perception of the time of cessation of rainfall diverged from the observed meteorological data. However, as indicated by the edge value, it is with higher certainty that the combination of these variables characterizes the winning profile.

4. Discussion

In Ethiopia, long-term changes in climate conditions, the inter-annual and seasonal variability of temperature and rainfall, and the frequency of occurrence of extreme events are detrimental for agricultural activities and food security. The results of the analyses of temperature and rainfall time series data reveal a variety of changes in climate conditions of the study areas and notable differences between the agro-ecological settings. The findings generally show increasing warming, annual and seasonal rainfall variability, increasing extreme events, variation in rainfall onset and cessation dates, and convergence and divergence between measured variables and perceptions.
The average temperature of the study areas is increasing which reflects the rising global mean temperature. Such increasing trends of temperature in Ethiopia are also reported in other studies [12,16]. Concerning rainfall, we found a significantly increasing trend in the midland areas but no trend in the highland and lowland areas. Like other parts of Ethiopia [1,12], the study areas are characterized by inter-annual and intra-seasonal rainfall variability. A shift in rainfall anomalies each year indicate the repeated occurrence of rainfall deficits during the farming seasons. In addition, belg season is characterized by either total failure of rainfall or false start, both referring to a lack of rainfall to undertake farming activities. Although easterly winds from the Indian Ocean and shifts in the Inter-Tropical Convergence Zone are the main underlying factors for rainfall variation in Ethiopia [10], the diverse topography of the country plays a crucial role in the variability of temperature and rainfall distribution across agro-ecological areas.
The effect of high variability in the amount and distribution of belg rain on the livelihood of smallholder farmers in Ethiopia is noticeable for various reasons. First, since the season comes after a long dry season, belg rain is crucial for water availability, the production of belg crops, and the growth of pasture for livestock. Second, rainfall variability during the belg season constrains farmers’ options to produce belg crops [10]. Although belg crops are important for farmers to bridge the time until the harvest of summer crops without significant food shortage, the risk of planting these crops is very high due to prolonged dry spells and short growth periods. As noted by farmers, these result in crop failure, lower crop productivity, and the abandoning of production of belg crops, ultimately increasing vulnerability to food insecurity. Third, the poor performance of belg rain affects crop production activities during the subsequent main rainy season by influencing the soil moisture and thereby the time of planting long-duration crop varieties such as maize and sorghum [15]. Variability in the amount of rainfall and the time of onset and cessation are also challenging for farmers as they cannot follow conventional farming calendars. Variability or failure of rainfall further exacerbates under- and/or unemployment due to loss of farming days.
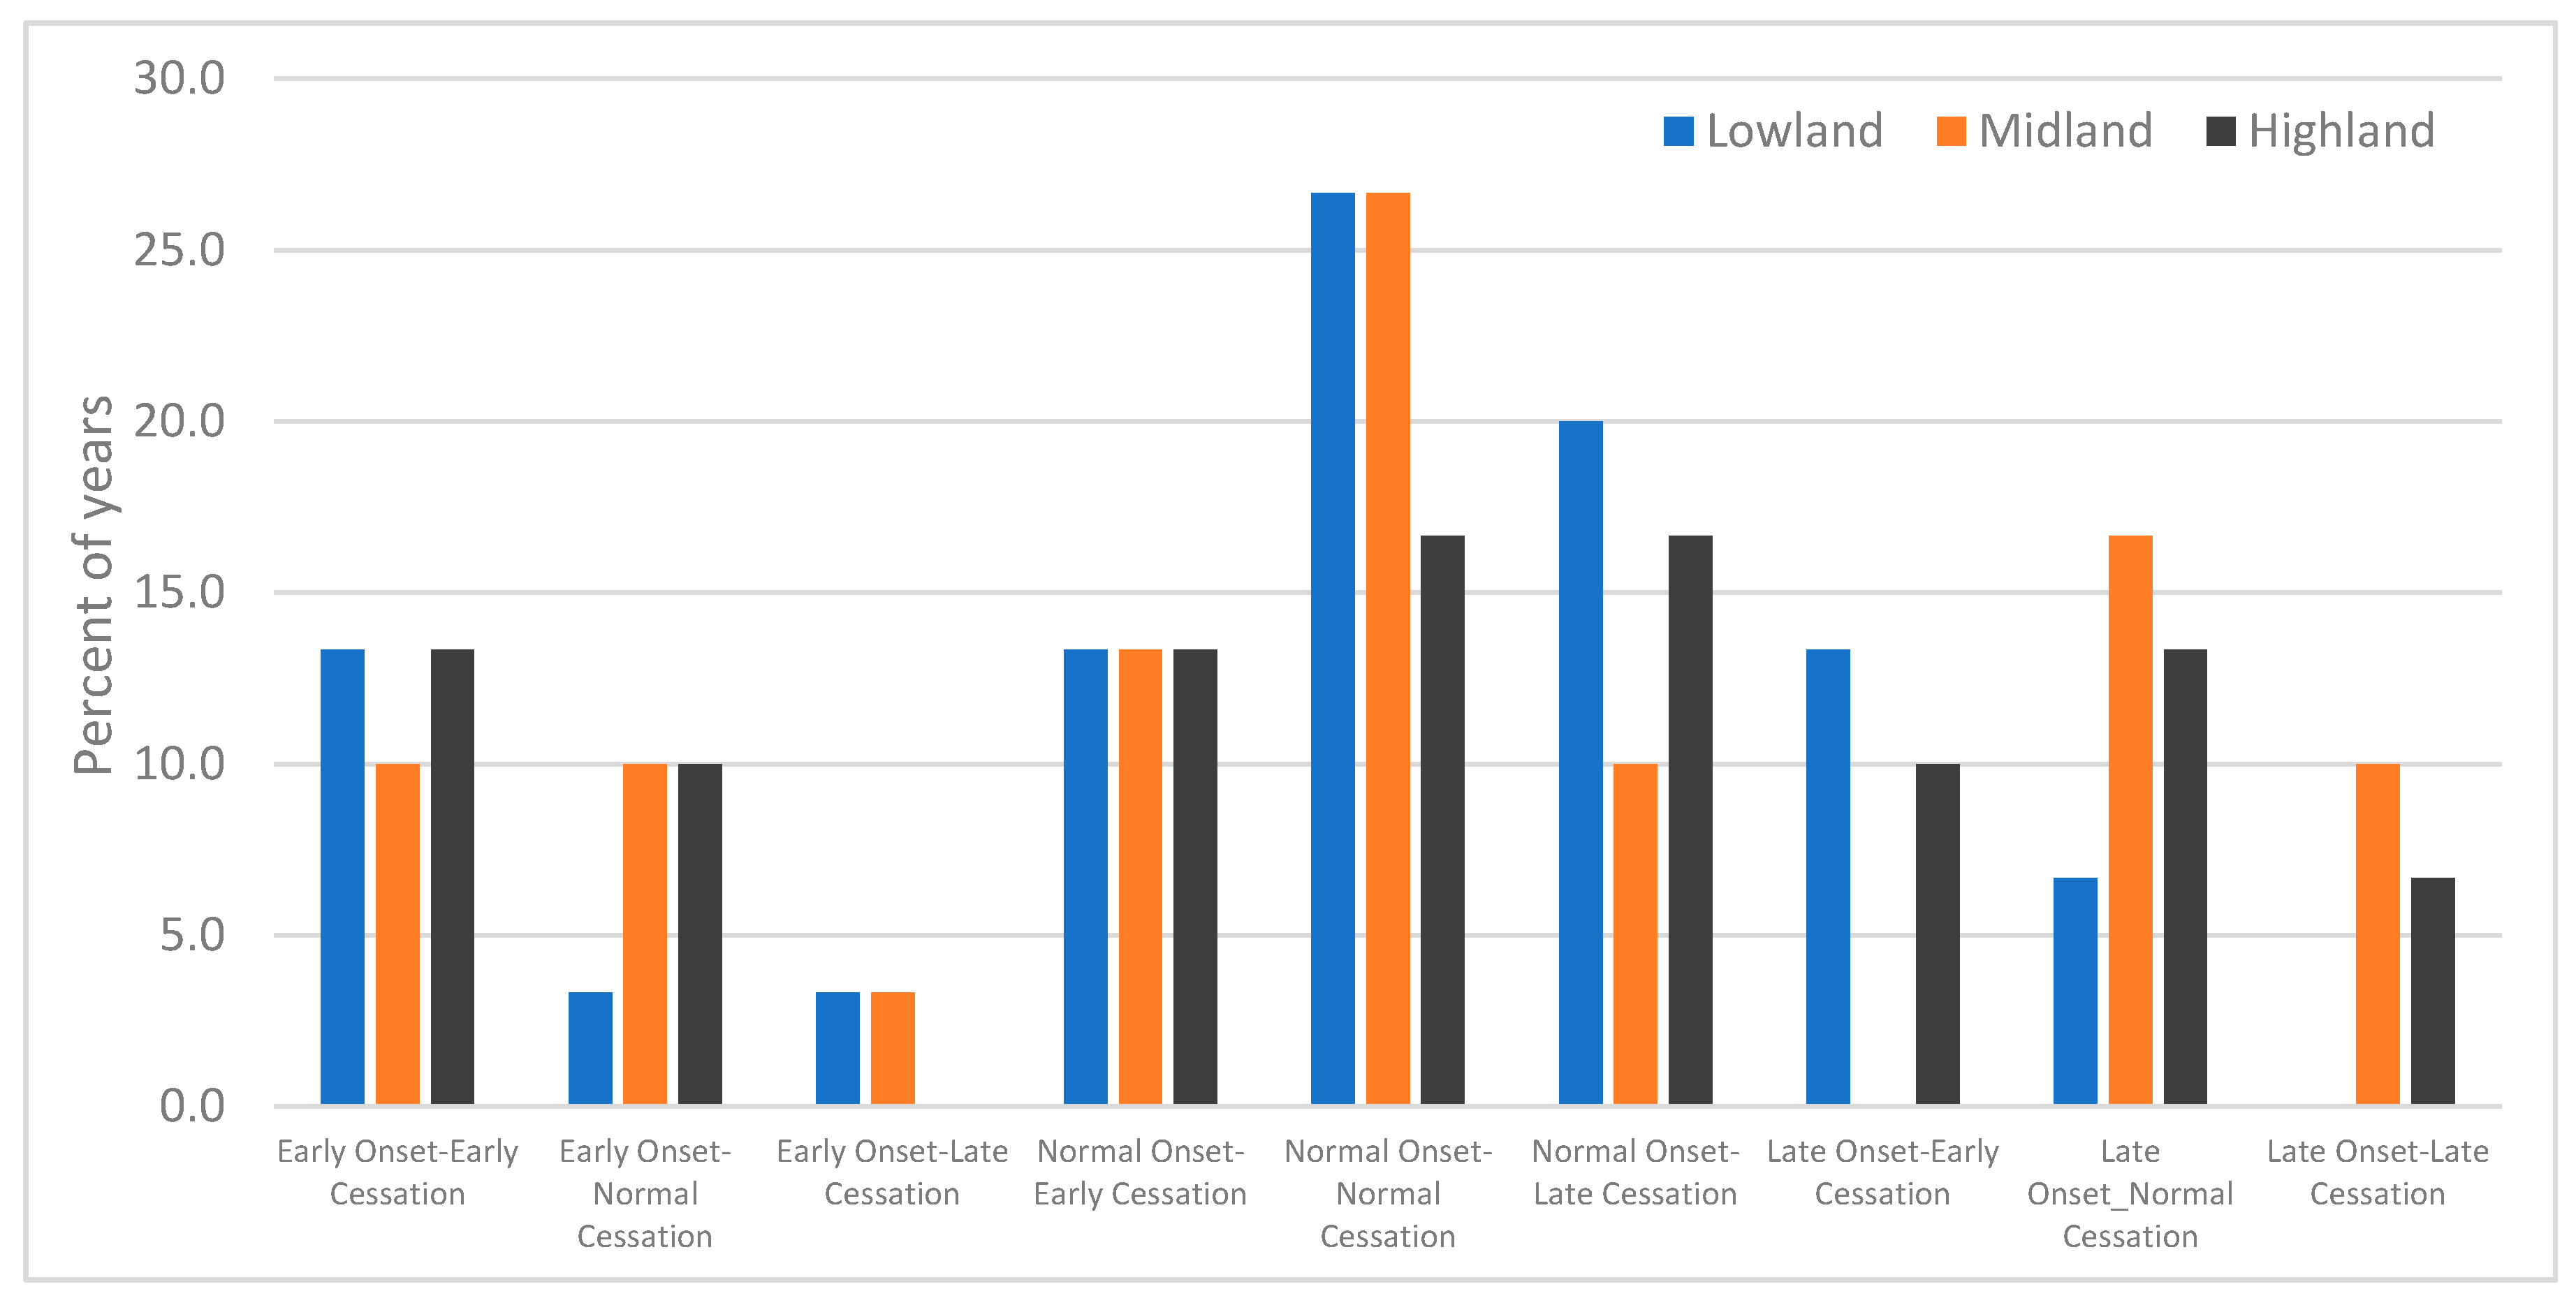
There are also challenges associated with reliance on kiremt rainfall for crop production. Due to yearly variation in the time of onset and cessation, there is high uncertainty in farmers’ decisions of types of crops to be produced and time of planting. In the lowland areas, for instance, owing to the normal or late onset and early cessation, LGP is shorter and the rain stops before the ripening of crops. Consequently, farmers harvest substantially lower yields or there is a complete failure of crops. In the midland areas, too, early termination of rainfall at the beginning of September makes crops infertile. Farmers in the highland areas would benefit from early rainfall and early planting as crops are harvested earlier. However, late onset results in late planting, which makes crops with longer-duration growth periods vulnerable to very cold weather that often starts in September/October and lasts until December, leading to an immense loss of yields.
Consistent with previous findings [2,14,16], the results suggest increasing warm days and nights and decreasing cold days and nights. An increase in extreme events causes changes to human systems much more than changes in average climate conditions [25]. Warming leads to higher rates of evaporation [1] and puts additional stresses on water resources [3], which, through a reduction of crop and livestock production, escalates livelihood vulnerability. There is also a risk of an increase in pests, weeds, and disease which affect both crop and livestock production [5]. The significant values of heavy (R10mm) and very heavy (R20mm) precipitation as well as maximum 1-day (RX1day) and maximum 5-day (RX5day) precipitation denote a high intensity rainfall in the midland areas. The occurrence of flooding, which was mentioned by farmers as one of their problems, is partly explained by the significant increase in heavy precipitation in the area. The effect of flooding is aggravated by the sloping topography of the area and lack of vegetation cover. The occurrence of landslides in the midland areas is also partly related to heavy rainfall. In the lowland and midland areas, frequent occurrences of CDDs and drier years have a deleterious effect on farming activities and farmers’ livelihoods.
Both convergence and divergence are observed between farmers’ perceptions and the results of meteorological data. Despite heterogeneity among farmers, the perception, of more than half of them, of temperature, the occurrence of drought, and the late onset and early cessation of rainfall was in unison with the meteorological data. There was a clear overlap between the perception that temperature is increasing and the statistically significant increasing trends of temperature data. This finding is congruent with many previous studies that showed consistency between perception and measurement of temperature [45]. However, there was variation, especially regarding rainfall trends. Farmers’ perception of decreasing rainfall was not supported by statistical data. We found an increasing trend of rainfall in the midland areas but no significant change in the highland and midland areas. This finding is consistent with previous studies showing that farmers’ perception of declining rainfall deviates from rainfall records [19,24,46]. Farmers’ perception of trends of rainfall may not corroborate observed meteorological trends for various reasons. As noted in a previous study [20], farmers’ perception of decreasing rainfall while it is not happening might show failure in the expected utility and availability heuristic. In line with the utilitarian perspective, farmers’ perception of declining rainfall more reflects its livelihood impacts in terms of a decline in agricultural production and food security [18,22,24], which are also caused by factors other than climate change such as a decline in soil fertility and limited use of farm technologies [18,19]. Farmers’ perception of declining rainfall might also arise from changes in the seasonality of rainfall and frequency of occurrence of extreme events instead of a change in the total amount of rainfall [46]. For farmers, change in rainfall is perceived as a process, not in terms of quantity [47]. They tend to base their perceptions of recent weather conditions and extreme events as well as on the wrong timing of heavy rainfall instead of long-term changes in average conditions [18,48]. When judging changes in rainfall, the time reference of farmers could be the period when rain is expected for planting, whereas the scientific analysis refers to long term or annual/seasonal changes [49]. Farmers also refer to the amount and distribution of rainfall during the cropping season to form perceptions.
Extreme events such as drought and rainfall variability are more accurately perceived by farmers. Drought takes a central position in the memory of people as it directly affects water and food availability [24], which contributed to a perception aligned with actual measurements. Farmers have good memories of extreme events that perceptions of their occurrence are more likely to be in tandem with observed meteorological data [18]. Although there are farmers whose perceptions deviate from the actual observation, the occurrence of late onset and early cessation of rainfall was correctly perceived by more than half of the farmers. Since the time of onset and cessation of rainfall is strongly related to farming activities, including the preparation of land for planting, farmers are highly likely to correctly recognize these changes. The convergence and divergence between perception and meteorological observation are strongly influenced by the agro-ecological contexts in which farmers undertake their farming activities. This shows that the consistency of perception with observed scientific trends depends on environmental differences in farmers’ exposure to different climate variables. Farmers contextually define and characterize the weather conditions of a particular time and place based mainly on what they feel about the cropping season, entailing the important role of perceptual factors in framing their understanding of changes in climate variables.
Household characteristics account for both convergence and divergence between farmers’ perceptions and meteorological data. We found that the perceptions of males, older farmers, and those with relatively higher social capital, access to media, and holding a small size of land converge with meteorological data. Male farmers’ perception is aligned with meteorological data, which might be related to their better position to access information and primary responsibility to engage in farming activities. Proper recognition of changes in climate variables is based partly on the number of years of farming experience, meaning that older-age farmers have a more accurate perception than younger farmers [20,50]. Given the complexity of properly observing trends in weather conditions on the one hand and less reliance on traditional weather forecasts in the study areas on the other hand, higher social capital and exposure to mass media facilitate farmers’ access to credible information that helps them form a correct perception of changes in local weather conditions [51]. Since their livelihood is most pronouncedly affected by adverse climate conditions, poor farmers are relatively well cognizant of changes in local weather conditions [50]. Conversely, misperceptions were noticed among economically better-off farmers. This is evident from the divergence of perceptions among farmers owning a large size of land and with medium economic status. Economically better-off farmers are more likely to generate their livelihoods from multiple sources that they are less dependent on weather-sensitive livelihood activities. Hence, they are likely to misperceive ‘real’ changes in climate variables. The results of our study also suggest that a lack of education contributes to the misperception of changes in weather conditions. Lack of education undermines access to varying sources of information and the cognitive ability to process information and make use of it to form an evidence-based perceptions.
Farming decisions and climate risk management plans partly depend on the availability of and access to reliable and relevant weather information. The use of traditional knowledge to forecast weather information is constrained by the high variability of the microclimate that made the forecasts less reliable. In the past, climate change occurred gradually and extreme events occur once in many years so that farmers can develop knowledge systems to adapt to. However, nowadays, the weather condition is highly variable not only between years and seasons but also within a day so that it has become difficult to describe the complex situation using the traditional systems that had been in use in the past. Although this is partly addressed through access to media which help farmers to have an accurate perception of changing weather conditions, there are also limitations associated with access to modern weather information. Weather stations are limited in number and unevenly distributed [12], the result of which fails to clearly show spatial differences of the micro-climate. Since the forecast is also made at a higher spatial scale and on a seasonal basis [52], it is less useful for farming decisions at the local level due to highly diverse topography. In addition, there is a lack of information on the time of onset and cessation of rainfall, which is important for decisions on planting time. Farming and adaptation decisions in an uncertain environment and without access to specific and reliable weather information are challenges for risk management. Besides, the lack of specific meteorological information contributes to farmers’ incorrect perceptions of local weather changes [24].

5. Conclusions

Climate change and variability as well as the accuracy of farmers’ perceptions of these changes are decisive for agricultural activities and the effectiveness of the livelihood strategies pursued by farmers. Geographical location as well as seasons have a great impact on the trends of changes in climate variables, occurrence of extreme events, and the accuracy of farmers’ perceptions. All the three agro-ecological settings in this study are challenged by climatic factors that are either the same across all or vary between them. The increasing average maximum and average annual temperature, increasing warm extremes, and decreasing cold extremes denote that the study areas are warming. An increase in warm extremes and recurrent occurrence of drier years are the problems in the lowland and highland areas whereas heavy precipitation is observed in the midland areas. The effect of climate-related events of diverse nature are expected to be severe in the study areas. While midland areas face severe consequences of heavy rainfall, lowland and highland areas are highly challenged by a relatively small amount of rainfall, higher inter-annual variability, a shorter crop growth period, and a longer duration of dry spells. Rainfall variability, particularly during the short rainy season, is the major constraint in these areas, resulting in reliance on crop production once a year during the long rainy season which is also characterized by yearly variation in the time of onset and cessation. In spite of the accurate perception of increasing temperature, most farmers inaccurately perceived declining rainfall. Lower economic status, access to media, and higher social capital are associated with accurate perception. Perception diverges from actual trends among economically better-off farmers and households whose heads have no education. Although agro-ecological settings account for noticeable variation in the accuracy of perceptions of changes in climate variables, there is high heterogeneity among farmers in each agro-ecological setting. The divergence of farmers’ perception from observed rainfall situation being highly likely to induce inaction, a lack of access to reliable weather information further undermines informed adaptation decision making. These are formidable challenges for smallholder farmers struggling to sustain their livelihoods as cropping calendar, the type of crops produced, and crop productivity are adversely affected by variable and uncertain climate conditions.
The observed changes in climatic variables have several implications for planning. First, reducing the impact of climate change requires the identification and implementation of adaptation strategies that are specifically suitable for the climate feature of each agro-ecological setting. For instance, variability in the distribution of rainfall brings to the fore the importance of water management as well as availing seeds that can be harvested in a short time or withstand water stress for effective adaptation. Second, the recurrence of climate variability and extreme events necessitates the expansion of alternative climate-resilient livelihood opportunities as a means to sustain food security. Third, increasing the availability of weather stations at the local level and enhancing the capacity to collect and analyze weather information increase the opportunity to anticipate the likely occurrences of weather-related risks and manage them through proactive measures. The deviation of farmers’ perceptions from the observed changes might result in under- or over-estimating the impacts of changes and hampering their efforts for adaptation. In this vein, the dissemination of agro-ecologically specific, spatially interpolated, and locally relevant weather information is important to reach farmers and help them have accurate perceptions of the local weather conditions and make informed farming decisions and other livelihood choices. Specifically, it would be helpful for farmers to make proper farming adjustment and adaptation decisions if they have access to timely information not only on the amount and distribution of rainfall but also on the expected time of onset and cessation of rainfall during the cropping seasons. In addition to mass media (e.g., radio), the use of a cell phone and locally based formal (e.g., agricultural development agents, health extension workers) and informal (e.g., community-based organizations) structures would be useful to enhance farmers’ access to reliable weather information. Furthermore, in spite of correctly perceiving changes in climate variables, since poor farmers lack the capacity to adapt, availing farm inputs that are tolerant to water stress and shorter crop growth period as well as improved production technologies increase their resilience to CCV.
Several issues remain unanswered. Farmers’ perception of CCV is a necessary but not a sufficient condition to take adaptation actions [19]. Equally important is how they perceive the adverse effects of these changes on their livelihoods and the welfare of the community. The narrow focus on farmers’ perceptions of changes in temperature and rainfall does not properly capture their comprehensive understanding of causes and consequences of climate change as well as possible responses, which are decisive to take action to minimize impacts. Farmers’ understanding of local weather conditions is also rooted in socio-cultural factors. Hence, understanding farmers’ holistic perspective on changing climate conditions as well as the underlying factors of variation in their perceptions requires further investigation. In addition, given the temporal changes in climate variables, adaptation decisions and the selection of adaptation strategies change across time. The dynamic interplay between climatic variables, households’ vulnerability, and farmers’ adaptation decision making is the subject of future inquiry.

Author Contributions

Conceptualization, D.E., D.J.R.M.S., C.F.A.v.W. and T.d.C.B.; methodology, D.E. and C.F.A.v.W.; software, D.E. and C.F.A.v.W.; validation, D.E., D.J.R.M.S., C.F.A.v.W. and T.d.C.B.; formal analysis, D.E. and C.F.A.v.W.; investigation, D.E.; data curation, D.E.; writing—original draft preparation, D.E.; writing—review and editing, D.E., D.J.R.M.S., C.F.A.v.W. and T.d.C.B.; visualization, D.E.; supervision, D.J.R.M.S., C.F.A.v.W. and T.d.C.B. All authors have read and agreed to the published version of the manuscript.

Funding

This research was funded by EP-NUFFIC, grant number R/002597.01. The APC was also funded by EP-NUFFIC.

Acknowledgments

The authors are very much grateful to the National Meteorology Agency of Ethiopia for the permission to use meteorological data. We would also like to thank the four anonymous reviewers for their valuable comments and suggestions which helped a lot in improving the paper.

Conflicts of Interest

The authors declare no conflict of interest.

References

  1. Conway, D.; Schipper, E.L.F. Adaptation to climate change in Africa: Challenges and opportunities identified from Ethiopia. Global Environ. Chang. 2011, 21, 227–237. [Google Scholar] [CrossRef]
  2. Omondi, P.A.O.; Awange, J.L.; Forootan, E.; Ogallo, L.A.; Barakiza, R.; Girmaw, G.B.; Fesseha, I.; Kululetera, V.; Kilembe, C.; Mbati, M.M. Changes in temperature and precipitation extremes over the Greater Horn of Africa region from 1961 to 2010. Int. J. Climatol. 2014, 34, 1262–1277. [Google Scholar] [CrossRef]
  3. Hulme, M.; Doherty, R.; Ngara, T.; New, M.; Lister, D. African climate change: 1900–2100. Clim. Res. 2001, 17, 145–168. [Google Scholar] [CrossRef] [Green Version]
  4. Kotir, J.H. Climate change and variability in Sub-Saharan Africa: A review of current and future trends and impacts on agriculture and food security. Environ. Dev. Sustain. 2011, 13, 587–605. [Google Scholar] [CrossRef]
  5. Niang, I.; Ruppel, O.C.; Abdrabo, M.A.; Essel, A.; Lennard, C.; Padgham, J.; Urquhart, P. Africa. In Climate Change 2014: Impacts, Adaptation, and Vulnerability. Part B: Regional Aspects. Contribution of Working Group II to the Fifth Assessment Report of the Intergovernmental Panel on Climate Change; Barros, V.R., Field, C.B., Dokken, D.J., Mastrandrea, M.D., Mach, K.J., Bilir, T.E., Chatterjee, M., Ebi, K.L., Estrada, Y.O., Genova, R.C., et al., Eds.; Cambridge University Press: Cambridge, UK; New York, NY, USA, 2014; pp. 1199–1265. [Google Scholar]
  6. Adhikari, U.; Nejadhashemi, A.P.; Woznicki, S.A. Climate change and eastern Africa: A review of impact on major crops. Food Energy Secur. 2015, 4, 110–132. [Google Scholar] [CrossRef]
  7. Cheung, W.H.; Senay, G.B.; Singh, A. Trends and spatial distribution of annual and seasonal rainfall in Ethiopia. Int. J. Climatol. 2008, 28, 1723–1734. [Google Scholar] [CrossRef]
  8. Jury, M.R.; Funk, C. Climatic trends over Ethiopia: Regional signals and drivers. Int. J. Climatol. 2013, 33, 1924–1935. [Google Scholar] [CrossRef]
  9. Wagesho, N.; Goel, N.; Jain, M. Temporal and spatial variability of annual and seasonal rainfall over Ethiopia. Hydrol. Sci. J. 2013, 58, 354–373. [Google Scholar] [CrossRef]
  10. Rosell, S. Regional perspective on rainfall change and variability in the central highlands of Ethiopia, 1978–2007. Appl. Geogr. 2011, 31, 329–338. [Google Scholar] [CrossRef]
  11. Mengistu, D.; Bewket, W.; Lal, R. Recent spatiotemporal temperature and rainfall variability and trends over the Upper Blue Nile River Basin, Ethiopia. Int. J. Climatol. 2014, 34, 2278–2292. [Google Scholar] [CrossRef]
  12. Alemayehu, A.; Bewket, W. Local spatiotemporal variability and trends in rainfall and temperature in the central highlands of Ethiopia. Geogr. Ann. Ser. A Phys. Geogr. 2017, 99, 85–101. [Google Scholar] [CrossRef]
  13. Asfaw, A.; Simane, B.; Hassen, A.; Bantider, A. Variability and time series trend analysis of rainfall and temperature in northcentral Ethiopia: A case study in Woleka sub-basin. Weather Clim. Extrem. 2018, 19, 29–41. [Google Scholar] [CrossRef]
  14. Esayas, B.; Simane, B.; Teferi, E.; Ongoma, V.; Tefera, N. Trends in extreme climate events over three agroecological zones of southern Ethiopia. Adv. Meteorol. 2018, 2018, 7354157. [Google Scholar] [CrossRef]
  15. Gummadi, S.; Rao, K.P.C.; Seid, J.; Legesse, G.; Kadiyala, M.D.M.; Takele, R.; Amede, T.; Whitbread, A. Spatio-temporal variability and trends of precipitation and extreme rainfall events in Ethiopia in 1980–2010. Theor. Appl. Climatol. 2018, 134, 1315–1328. [Google Scholar] [CrossRef] [Green Version]
  16. Mekasha, A.; Tesfaye, K.; Duncan, A.J. Trends in daily observed temperature and precipitation extremes over three Ethiopian eco-environments. Int. J. Climatol. 2014, 34, 1990–1999. [Google Scholar] [CrossRef]
  17. Hasan, M.K.; Kumar, L. Comparison between meteorological data and farmer perceptions of climate change and vulnerability in relation to adaptation. J. Environ. Manag. 2019, 237, 54–62. [Google Scholar] [CrossRef]
  18. Osbahr, H.; Dorward, P.; Stern, R.; Cooper, S. Supporting agricultural innovation in Uganda to respond to climate risk: Linking climate change and variability with farmer perceptions. Exp. Agric. 2011, 47, 293–316. [Google Scholar] [CrossRef] [Green Version]
  19. Simelton, E.; Quinn, C.H.; Batisani, N.; Dougill, A.J.; Dyer, J.C.; Fraser, E.D.; Mkwambisi, D.; Sallu, S.; Stringer, L.C. Is rainfall really changing? Farmers’ perceptions, meteorological data, and policy implications. Clim. Dev. 2013, 5, 123–138. [Google Scholar] [CrossRef]
  20. Foguesatto, C.R.; Artuzo, F.D.; Talamini, E.; Machado, J.A.D. Understanding the divergences between farmer’s perception and meteorological records regarding climate change: A review. Environ. Dev. Sustain. 2020, 22, 1–16. [Google Scholar] [CrossRef]
  21. Imran, M.; Shrestha, R.P.; Datta, A. Comparing farmers’ perceptions of climate change with meteorological data in three irrigated cropping zones of Punjab, Pakistan. Environ. Dev. Sustain. 2020, 22, 2121–2140. [Google Scholar] [CrossRef]
  22. Rao, K.; Ndegwa, W.G.; Kizito, K.; Oyoo, A. Climate variability and change: Farmer perceptions and understanding of intra-seasonal variability in rainfall and associated risk in semi-arid Kenya. Exp. Agric. 2011, 47, 267–291. [Google Scholar] [CrossRef] [Green Version]
  23. Bewket, W. Climate change perceptions and adaptive responses of smallholder farmers in central highlands of Ethiopia. Int. J. Environ. Stud. 2012, 69, 507–523. [Google Scholar] [CrossRef]
  24. Meze-Hausken, E. Contrasting climate variability and meteorological drought with perceived drought and climate change in northern Ethiopia. Clim. Res. 2004, 27, 19–31. [Google Scholar] [CrossRef] [Green Version]
  25. Aguilar, E.; Aziz Barry, A.; Brunet, M.; Ekang, L.; Fernandes, A.; Massoukina, M.; Mbah, J.; Mhanda, A.; Do Nascimento, D.; Peterson, T. Changes in temperature and precipitation extremes in western central Africa, Guinea Conakry, and Zimbabwe, 1955–2006. J. Geophys. Res. Atmos. 2009, 114. [Google Scholar] [CrossRef]
  26. Kothari, C.R. Research Methodology: Methods and Techniques; New Age International: New Delhi, India, 2004. [Google Scholar]
  27. Alexander, L.; Herold, N. ClimPACT2: Indices and Software. A Document Prepared on Behalf of the Commission for Climatology (CCI) Expert Team on Sector-Specific Climate Indices (ET-SCI); World Meteorological Organization: Geneva, Switzerland, 2016. [Google Scholar]
  28. Wang, X.L.; Feng, Y. RHtests_dlyPrcp User Manual; Climate Research Division, Atmospheric Science and Technology Directorate, Science and Technology Branch, Environment Canada: Toronto, ON, Canada, February 2013; Volume 25, p. 2014.
  29. Wang, X.L.; Feng, Y. RHtestsV4 User Manual; Climate Research Division Atmospheric Science and Technology Directorate Science and Technology Branch, Environment Canada: Toronto, ON, Canada, 2013. Available online: http://etccdi.pacificclimate.org/software.shtml (accessed on 25 June 2019).
  30. Wang, X.L. Accounting for autocorrelation in detecting mean shifts in climate data series using the penalized maximal t or F test. J. Appl. Meteorol. Climatol. 2008, 47, 2423–2444. [Google Scholar] [CrossRef]
  31. Wang, X.L.; Chen, H.; Wu, Y.; Feng, Y.; Pu, Q. New techniques for the detection and adjustment of shifts in daily precipitation data series. J. Appl. Meteorol. Climatol. 2010, 49, 2416–2436. [Google Scholar] [CrossRef]
  32. Van Rooy, M. A Rainfall Anomally Index Independent of Time and Space. Notos 1965, 14, 43–48. [Google Scholar]
  33. Vicente-Serrano, S.M.; Beguería, S.; López-Moreno, J.I. A multiscalar drought index sensitive to global warming: The standardized precipitation evapotranspiration index. J. Clim. 2010, 23, 1696–1718. [Google Scholar] [CrossRef] [Green Version]
  34. Hargreaves, G.H.; Allen, R.G. History and evaluation of Hargreaves evapotranspiration equation. J. Irrig. Drain. Eng. 2003, 129, 53–63. [Google Scholar] [CrossRef]
  35. Kendall, M. Rank Correlation Methods; Charles Griffin: London, UK, 1975. [Google Scholar]
  36. Mann, H.B. Nonparametric tests against trend. Econom. J. Econom. Soc. 1945, 13, 245–259. [Google Scholar] [CrossRef]
  37. Hamed, K. Enhancing the effectiveness of prewhitening in trend analysis of hydrologic data. J. Hydrol. 2009, 368, 143–155. [Google Scholar] [CrossRef]
  38. Tesfaye, K.; Walker, S. Matching of crop and environment for optimal water use: The case of Ethiopia. Phys. Chem. Earth Parts A/B/C 2004, 29, 1061–1067. [Google Scholar] [CrossRef]
  39. Stern, R.; Rijks, D.; Dale, I.; Knock, J. INSTAT Climatic Guide; Statistical Service Centre, University of Reading: Reading, UK, 2006. [Google Scholar]
  40. Raes, D.; Willems, P.; Baguidi, F. RAINBOW—A software package for analyzing data and testing the homogeneity of historical data sets. In Proceedings of the 4th International Workshop on ‘Sustainable management of marginal drylands’, Islamabad, Pakistan, 27–31 January 2006. [Google Scholar]
  41. Keyzer, M.; Pande, S. Classification by crossing and polling for integrated processing of maps and surveys An addendum to GRCP-software. In Staff Working Paper, Centre for World Food Studies; Vrije Universiteit: Amsterdam, The Netherlands, 2007. [Google Scholar]
  42. Etana, D.; van Wesenbeeck, C.F.; de Cock Buning, T. Socio-cultural aspects of farmers’ perception of the risk of climate change and variability in Central Ethiopia. Clim. Dev. 2020, 1–13. [Google Scholar] [CrossRef]
  43. van Wesenbeeck, C.F.; Sonneveld, B.G.; Voortman, R.L. Localization and characterization of populations vulnerable to climate change: Two case studies in Sub-Saharan Africa. Appl. Geogr. 2016, 66, 81–91. [Google Scholar] [CrossRef]
  44. Araya, A.; Stroosnijder, L.; Habtu, S.; Keesstra, S.D.; Berhe, M.; Hadgu, K. Risk assessment by sowing date for barley (Hordeum vulgare) in northern Ethiopia. Agric. For. Meteorol. 2012, 154–155, 30–37. [Google Scholar] [CrossRef]
  45. Mulenga, B.P.; Wineman, A.; Sitko, N.J. Climate trends and farmers’ perceptions of climate change in Zambia. Environ. Manag. 2017, 59, 291–306. [Google Scholar] [CrossRef] [PubMed]
  46. Kosmowski, F.; Leblois, A.; Sultan, B. Perceptions of recent rainfall changes in Niger: A comparison between climate-sensitive and non-climate sensitive households. Clim. Chang. 2016, 135, 227–241. [Google Scholar] [CrossRef]
  47. Roncoli, C. Ethnographic and participatory approaches to research on farmers’ responses to climate predictions. Clim. Res. 2006, 33, 81–99. [Google Scholar] [CrossRef]
  48. Marx, S.M.; Weber, E.U.; Orlove, B.S.; Leiserowitz, A.; Krantz, D.H.; Roncoli, C.; Phillips, J. Communication and mental processes: Experiential and analytic processing of uncertain climate information. Global Environ. Chang. 2007, 17, 47–58. [Google Scholar] [CrossRef]
  49. Ovuka, M.; Lindqvist, S. Rainfall variability in murang’a district, kenya: Meteorological data and farmers’ perception. Geogr.Ann. Ser. A Phys. Geogr. 2000, 82, 107–119. [Google Scholar] [CrossRef]
  50. Ayal, D.Y.; Leal Filho, W. Farmers’ perceptions of climate variability and its adverse impacts on crop and livestock production in Ethiopia. J. Arid Environ. 2017, 140, 20–28. [Google Scholar] [CrossRef]
  51. Clayton, S.; Devine-Wright, P.; Stern, P.C.; Whitmarsh, L.; Carrico, A.; Steg, L.; Swim, J.; Bonnes, M. Psychological research and global climate change. Nat. Clim. Chang. 2015, 5, 640. [Google Scholar] [CrossRef]
  52. Korecha, D.; Sorteberg, A. Validation of operational seasonal rainfall forecast in Ethiopia. Water Resour. Res. 2013, 49, 7681–7697. [Google Scholar] [CrossRef]
Figure 1. Geographical location and topography of the study areas.
Climate 08 00121 g001
Figure 2. Trends of standardized anomaly index of average annual temperature by agro-ecological settings and season (1988–2017).
Climate 08 00121 g002
Figure 3. Trends of annual rainfall anomaly index by agro-ecological settings and season (1988–2017).
Climate 08 00121 g003
Figure 4. Trends of the Standardized Precipitation Evapotranspiration Index (SPEI) in the lowland (top), midland (middle), and highland (bottom) areas.
Climate 08 00121 g004
Figure 5. Trends of onset and cessation days of rainfall by agro-ecological settings.
Climate 08 00121 g005
Figure 6. Distribution of time of onset and cessation of kiremt rainfall by agro-ecological settings.
Climate 08 00121 g006
Figure 7. Distribution of households’ perceptions of climate variability and extreme events by agro-ecological settings.
Climate 08 00121 g007
Table 1. Agro-ecological differences in seasonal and annual trends of temperature and rainfall (1988–2017).
PlaceVariableBelgKiremtAnnual
MKSlopeMKSlopeMKSlope
LowlandTmin0.0160.0030.269 *0.0390.1540.023
Tmax0.615 ***0.0900.3840.0600.616 ***0.068
Tavr0.333 **0.0320.366 **0.0440.438 ***0.042
MidlandTmin0.306 *0.0230.2230.0150.407 *0.027
Tmax0.1450.0220.315 *0.0270.320 *0.025
Tavr0.319 *0.0210.255 *0.0190.434 **0.030
HighlandTmin0.497 ***0.1290.453 **0.0780.409 *0.065
Tmax0.0440.006−0.159−0.028−0.009−0.001
Tavr0.269 *0.0570.347 *0.0440.2410.033
LowlandRainfall0.1030.661−0.002−0.028−0.039−0.344
Midland0.379 *4.5380.591 **15.4430.621 ***24.784
Highland−0.136−0.707−0.021−0.699−0.062−2.022
* p < 0.05, ** p < 0.01, *** p < 0.001.
Table 2. Trends of precipitation indices by agro-ecological settings (1988–2017).
VariablesLowlandMidlandHighland
MKSlopeMKSlopeMKSlope
PRCPTOT−0.037−0.3690.621 ***25.037−0.076−2.180
CDD0.0900.750−0.097−0.6670.364 *2.300
CWD−0.120−0.0530.291 *0.333−0.114−0.087
R10mm−0.044−0.0010.616 ***0.9450.0210.001
R20mm0.1340.0010.389 **0.394−0.0690.001
R95p0.1160.6250.461 ***10.529−0.092−0.667
RX1day0.1260.1620.397 *0.880−0.299 *−0.333
RX5day0.2250.4000.500 ***1.909−0.007−0.022
* p < 0.05, ** p < 0.01, *** p < 0.001.
Table 3. Trends of extreme temperature indices by agro-ecological settings (1988–2017).
LowlandMidlandHighland
MKSlopeMKSlopeMKSlope
FD--−0.032−0.0650.2480.001
CSDI−0.0250.001−0.417 **−0.636−0.1530.001
WSDI0.490 **0.375−0.0170.0010.470 ***0.001
DTR0.366 **0.036−0.419 **−0.0740.0760.007
TXx0.419 **0.0440.1400.0260.258 *0.036
TXn0.490 ***0.081−0.247−0.0570.1620.035
TNx0.2050.0200.400 **0.1220.397 **0.06
TNn0.1100.0120.1160.0590.1490.019
TX10p−0.571 ***−0.6130.0710.133−0.221−0.194
TX90p0.596 ***0.768−0.020−0.0120.473 ***0.519
TN10p−0.292 *−0.249−0.582 ***−0.937−0.193−0.205
TN90p0.1310.1600.436 ***0.4850.384 **0.488
* p < 0.05, ** p < 0.01, *** p < 0.001.
Table 4. Characteristics of belg season in three agro-ecological settings.
IndicatorsLowlandMidlandHighland
Onset (number of years)Failure of belg115
False onset19515
Proper onset102410
Months of onset (number of years)March2102
April4124
May424
Cessation1st week of May1st week of May1st week of May
Length of dry spell daysMean302534
Longer505458
Shorter171117
Number of rain daysMean112111
Minimum332
Maximum253922
Table 5. Percentage distribution of households’ demographic and socio-economic characteristics by agro-ecological settings.
VariablesCategoriesNAll HouseholdsHighlandMidlandLowland
Age of household head20–3929836.832.929.537.6
40–5931338.631.332.636.1
≥6019924.637.240.222.6
Sex of household headMale70286.734.332.832.9
Female10813.326.937.036.1
Education of household headNo education54767.536.030.233.8
Primary and above26332.527.839.932.3
Size of land owned (in hectare)<1 28435.133.834.931.3
1–2 22227.419.841.438.7
≥2 30437.542.826.031.2
Economic status of a householdLow18022.221.751.726.7
Medium40349.829.836.234.0
High22728.048.913.737.4
Social capital of a householdLow24430.129.927.043.0
Medium36044.430.838.930.3
High20625.441.731.127.2
Head’s access to mediaNo access43754.030.944.624.5
At least once a week37346.036.220.143.7
Total81010033.333.333.3
Table 6. Percentage distribution of variation of farmers’ perceptions of climate change and variability by observed meteorological results (n = 810).
Measured VariablesCategoriesFarmers’ Perceived Changes
YesNo
Temperature changeYes7617.1
No6.80
Rainfall changeYes0.732.7
No62.24.3
Drought occurrenceYes50.416.3
No23.110.2
Flood occurrenceYes32.21.2
No34.132.5
Late onset of rainYes63.73.0
No33.20.1
Early cessation of rainYes55.24.0
No39.01.9
Table 7. Winning profiles of convergence and divergence between measurement and farmers’ perceptions of rainfall and temperature changes.
Variables and Winning ProfilesCoverageEdge
Rainfall
Yes-YesMrain—Increasing; Prain—Increasing
aPWATLOGSEXMEDIAAGRO34%1.0
bNoMaleYesMidland
No-NoMrain—No change; Prain—No change
aAGESEXMEDIAAGRO14%1.27
bOldMaleYesHighland
No-YesMrain—No change; Prain—Increasing
aEDUCLANDECONMEDIA86%1.22
bNo LargeMediumNo
Yes-NoMrain—Increasing; Prain—Decreasing
aEDUCLANDECONMEDIA17%1.22
bNoLargeMediumNo
Temperature
Yes-YesMtemp—Increasing; Ptemp—Increasing
aSEXSOCAPMEDIAAGRO10%1.15
bMaleMediumYesLowland
No-YesMtemp—No change; Ptemp—Increasing
aEDUCLANDMEDIAAGRO21%1.43
bNoMediumNoMidland
Yes-NoMtemp—Increasing; Ptemp—Decreasing
aEDUCLANDECONMEDIA19%2.30
bNoLargeMediumNo
a—Variables; b—Winning profiles; Mrain—Measured rainfall; Prain—Perceived rainfall; Mtemp—Measured temperature; Ptemp—Perceived temperature; PWATLOG—Perceived waterlogging; AGE—Age of household head; SEX—Sex of household head; EDUC—Educational level; MEDIA—Access to media; ECON—Economic status of households; LAND—Size of landholding; SOCAP—Social capital; AGRO—Agro-ecological setting.
Table 8. Winning profiles of convergence and divergence between measurement and farmers’ perceptions of the occurrences of drought and flood.
Variables and Winning ProfilesCoverageEdge
Drought
Yes-YesMdrought—Yes; Pdrought—Yes
aSEXSOCAPMEDIAAGRO16%1.37
bMaleMediumYesLowland
No-NoMdrought—No; Pdrought—No
aAGEECONSOCAPAGRO12%1.43
bAdultMediumHighMidland
No-YesMdrought—No; Pdrought—Yes
aEDUCECONMEDIAAGRO22%1.05
bNoMediumNoMidland
Yes-NoMdrought—Yes; Pdrought—No
aEDUCLANDMEDIAAGRO27%1.95
bNoLargeNoHighland
Flood
Yes-YesMflood—Yes; Pflood—Yes
aEDUCLANDSOCAPAGRO13%1.10
bPrimary+SmallMediumMidland
No-NoMflood-No; Pflood-No
aEDUCSOCAPMEDIAAGRO14%1.41
bNoMediumYesHighland
No-YesMflood—No; Pflood—Yes
aEDUCECONMEDIAAGRO14%1.19
bNoMediumNoLowland
Yes-NoMflood—Yes; Pflood—No
aAGESEXECONAGRO40%1.32
bYoungMaleMediumMidland
a—Variables; b—Winning profiles; Mdrought—Measured occurrence of drought; Pdrought—Perceived occurrence of drought; Mflood—Measured occurrence of flood; Pflood—Perceived occurrence of flood.
Table 9. Winning profiles of convergence and divergence between measurement and farmers’ perceptions of the time of onset and cessation of rainfall.
Variables and Winning ProfilesCoverageEdge
Late onset
Yes-YesMLateOnset—Yes; PLateOnset—Yes
aSEXLANDSOCAPAGRO11%1.28
bMaleSmallMediumMidland
No-YesMLateOnset—No; PLateOnset—Yes
aEDUCLANDSOCAPAGRO12%1.1
bNoMediumLowLowland
Yes-NoMLateOnset—Yes; PLateOnset—No
aAGEEDUCMEDIAAGRO17%1.32
bYoungNoNoHighland
Early cessation
Yes-YesMEarlyCessation—Yes; PEarlyCessation—Yes
aSEXLANDSOCAPMEDIA10%1.23
bMaleSmallMediumYes
No-NoMEarlyCessation—No; PEarlyCessation—No
aAGESEXECONMEDIA2%1.0
bAdultMalePoorNo
No-YesMEarlyCessation—No; PEarlyCessation—Yes
aEDUCLANDECONMEDIA8%1.09
bNoLargeMediumNo
Yes-NoMEarlyCessation—Yes; PEarlyCessation—No
aEDUCLANDECONMEDIA3%2.02
bNoLargeMediumNo
a—Variables; b—Winning profiles; MLateOnset—Measured late onset of rainfall; PLateOnset—Perceived late onset of rainfall; MEarlyCessation—Measured early cessation of rainfall; PEarlyCessation—Perceived early cessation of rainfall.
Publisher’s Note: MDPI stays neutral with regard to jurisdictional claims in published maps and institutional affiliations.

