1. Introduction
A data center (DC) is a processing infrastructure where computer systems of companies and/or organizations are gathered. It is an environment that has a large infrastructure where digital systems can communicate over a network, storing all the information needed by companies. All data transmitted are stored in the networks or generated in DC’s. Thus, there is a physical infrastructure behind every solution used in computer systems. With the volume of use, storage, and technological evolution of the systems, platforms and services that are offered using networks, the available cloud computing services have increased. Therefore, the number of servers has increased so that the systems can carry out their proper operation and users obtain responses to their requests in a timely manner [
1]. Continuous growth occurs, with the companies’ revenues growing on average 24% per year and their investments more than 38%; most of it is used for the construction and equipment of DCs [
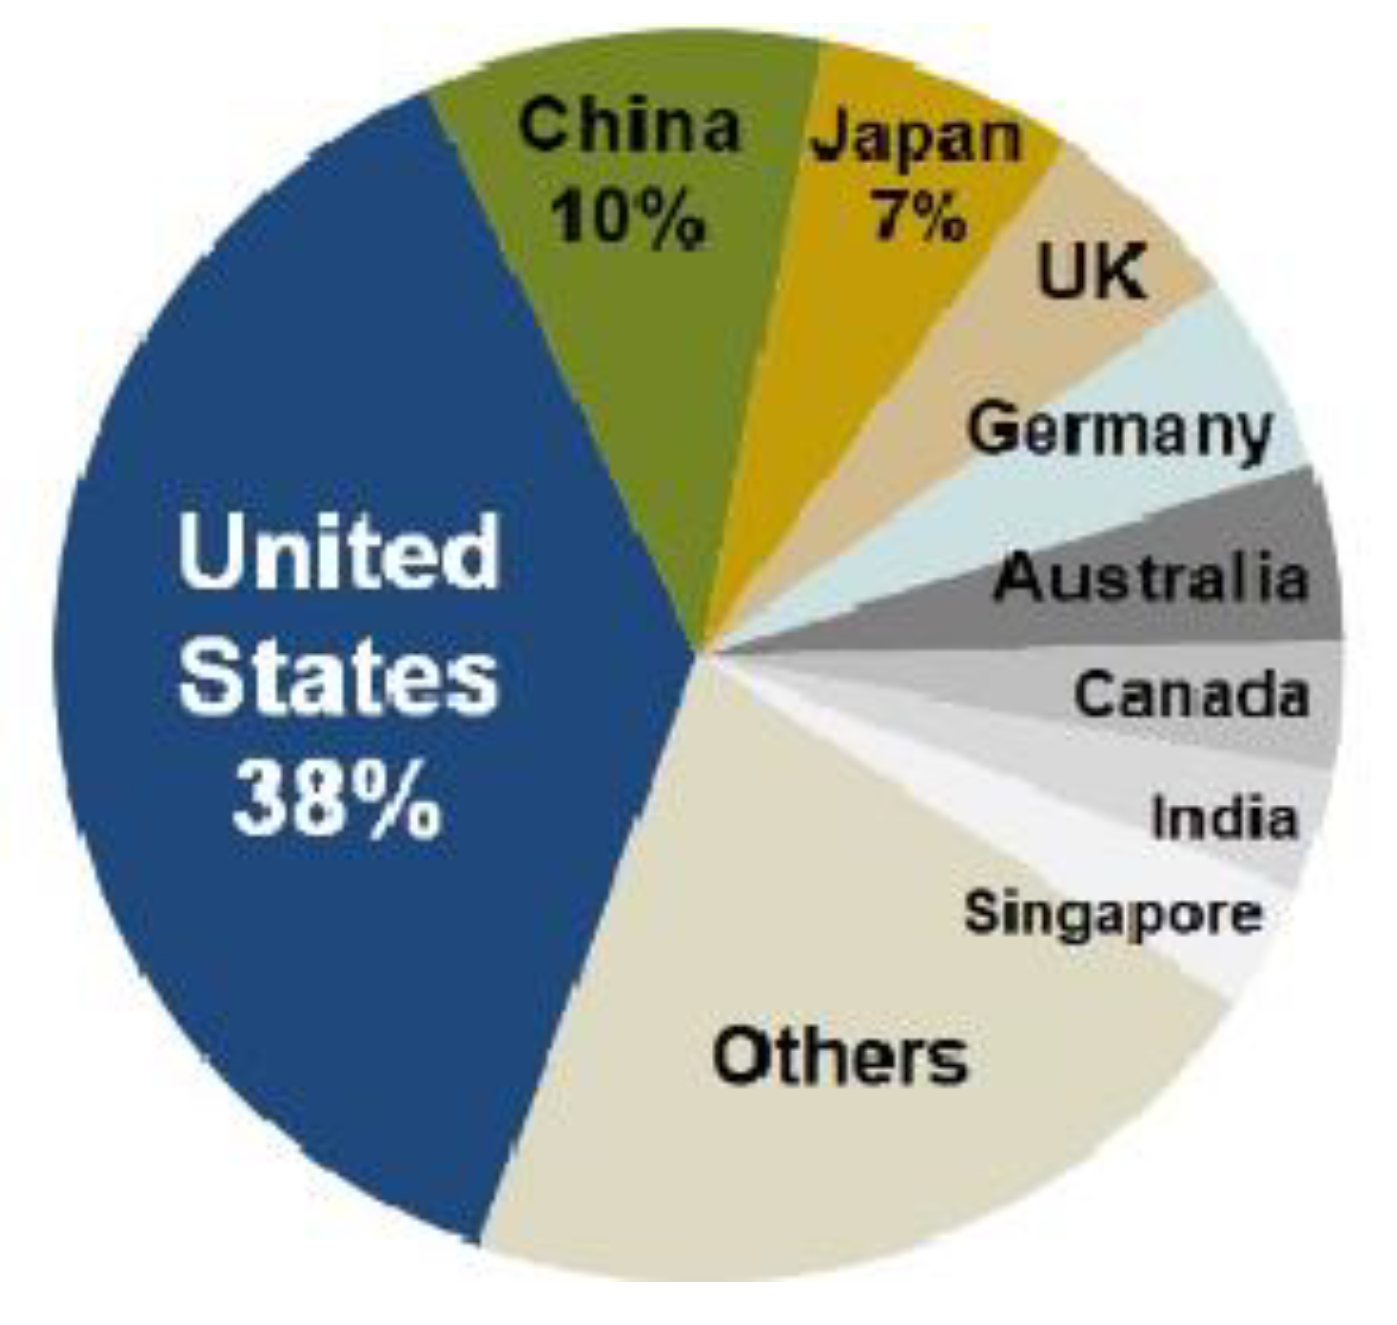
2]. As shown in
Figure 1, 40% of the world’s DC are located in the United States of America (USA). The highest growth rates have occurred in Europe and the Asia-Pacific. China, Japan, United Kingdom, Germany and Australia now account for 32% of the total [
2].
With the increasing number of DCs installed in recent years, energy consumption has significantly increased. In the USA, DCs used 91 TWh, with an increase of 53% in consumption (139 TWh) expected in 2020. The industry of information and communication technology (ICT) equipment continues to increase the equipment’s data storage capacity and simultaneously its computational efficiency. In support of the DC operation, several sectors, including information technology (IT) industries, providers of physical infrastructure projects, DC layout projects and operators are focused on reducing the consumption of the DC’s indirect energy, that is, of all the non-computational infrastructure, specifically energy and cooling systems [
3]. To measure the energy efficiency of this large machinery, a consortium of companies known as The Green Grid has developed and recommended best practices for energy efficiency and sustainability, such as CO
2 emissions. The metric created is an index known as Power Usage Effectiveness (PUE). The calculation is simple and is based on the relationship between the electrical energy consumed by the entire installation and the electrical energy consumed by the IT infrastructure equipment. The closer to 1.0 this index is, the better it is, that is the higher the energy efficiency is [
4].
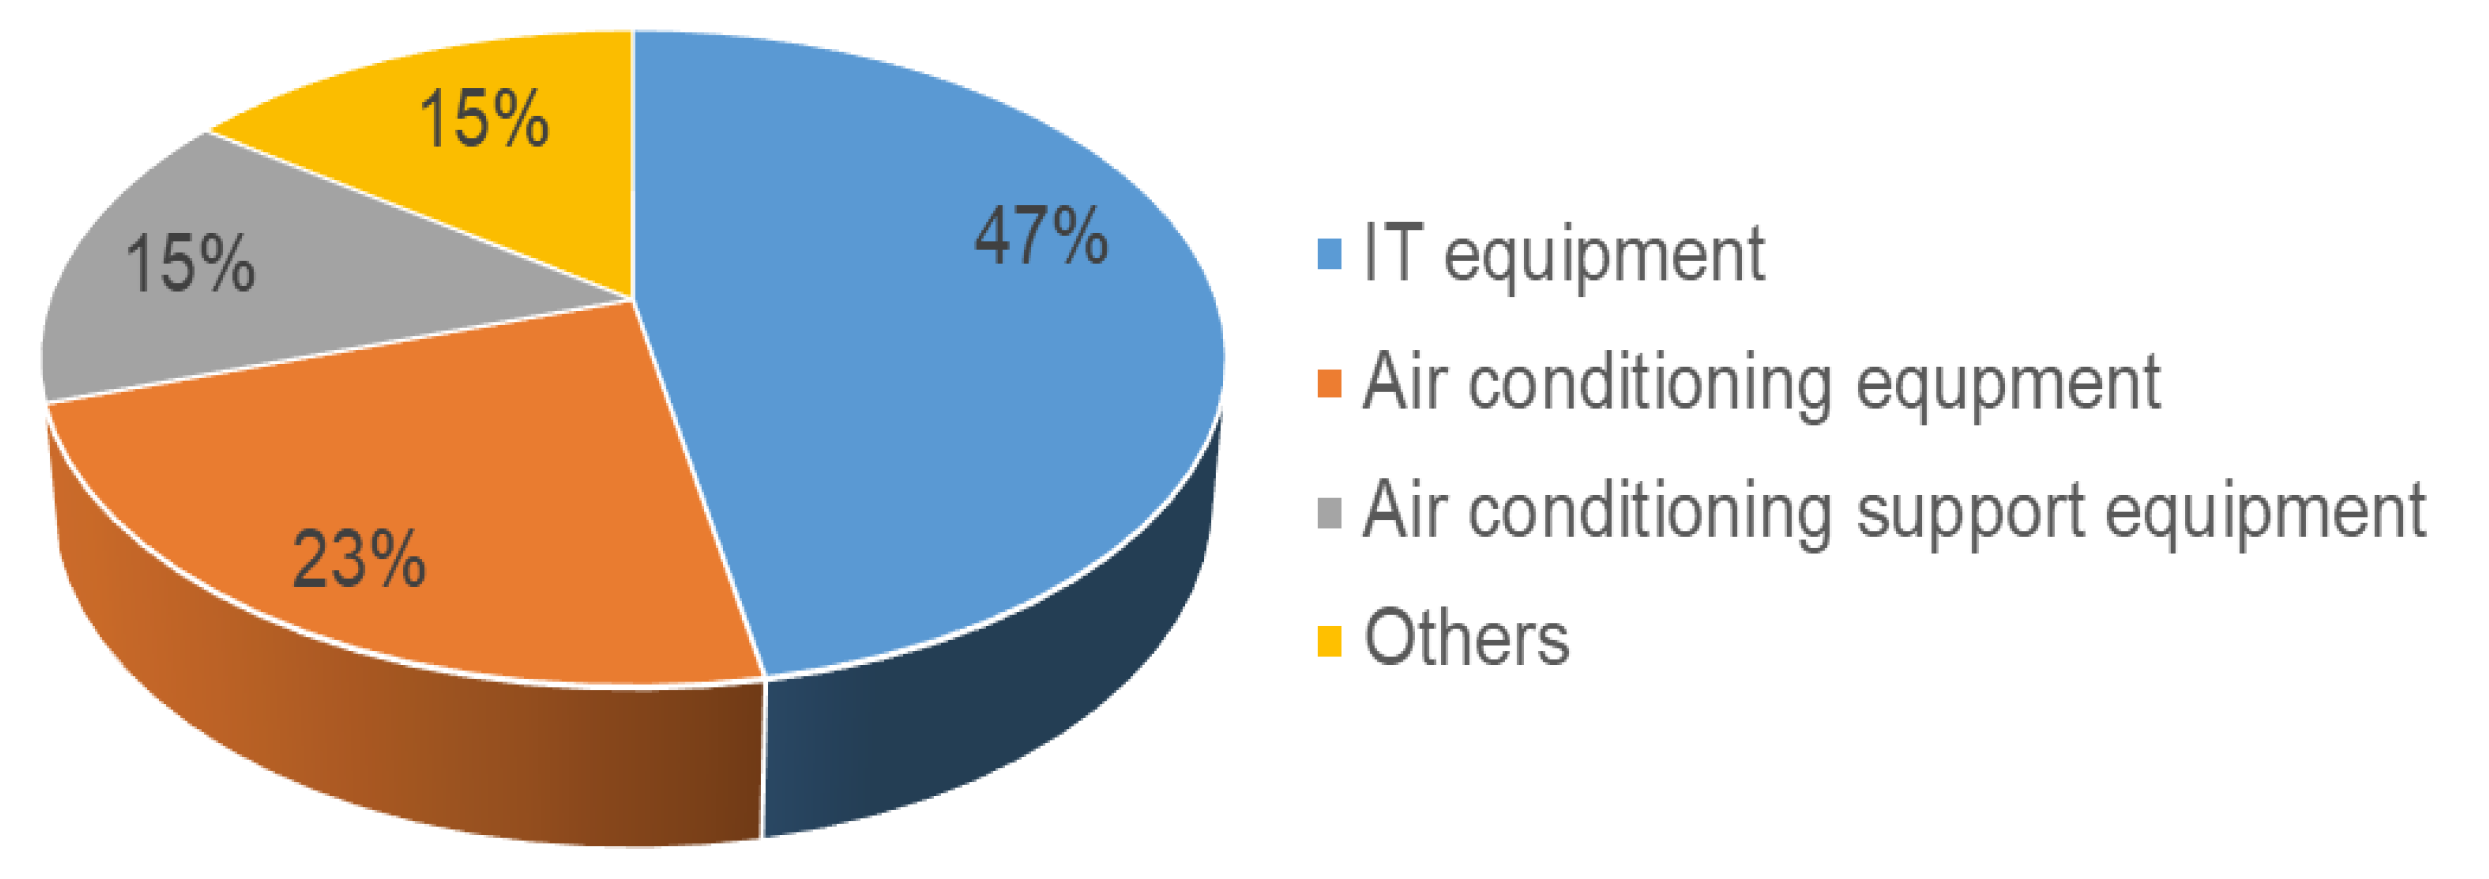
Other factors do not affect this index value, such as energy availability or seismic risk, with an exclusive focus on the area of greatest impact in addition to the IT equipment itself, which is the thermal area. A typical DC with PUE = 2.1 has the distribution of electricity consumption shown in
Figure 2 [
5].
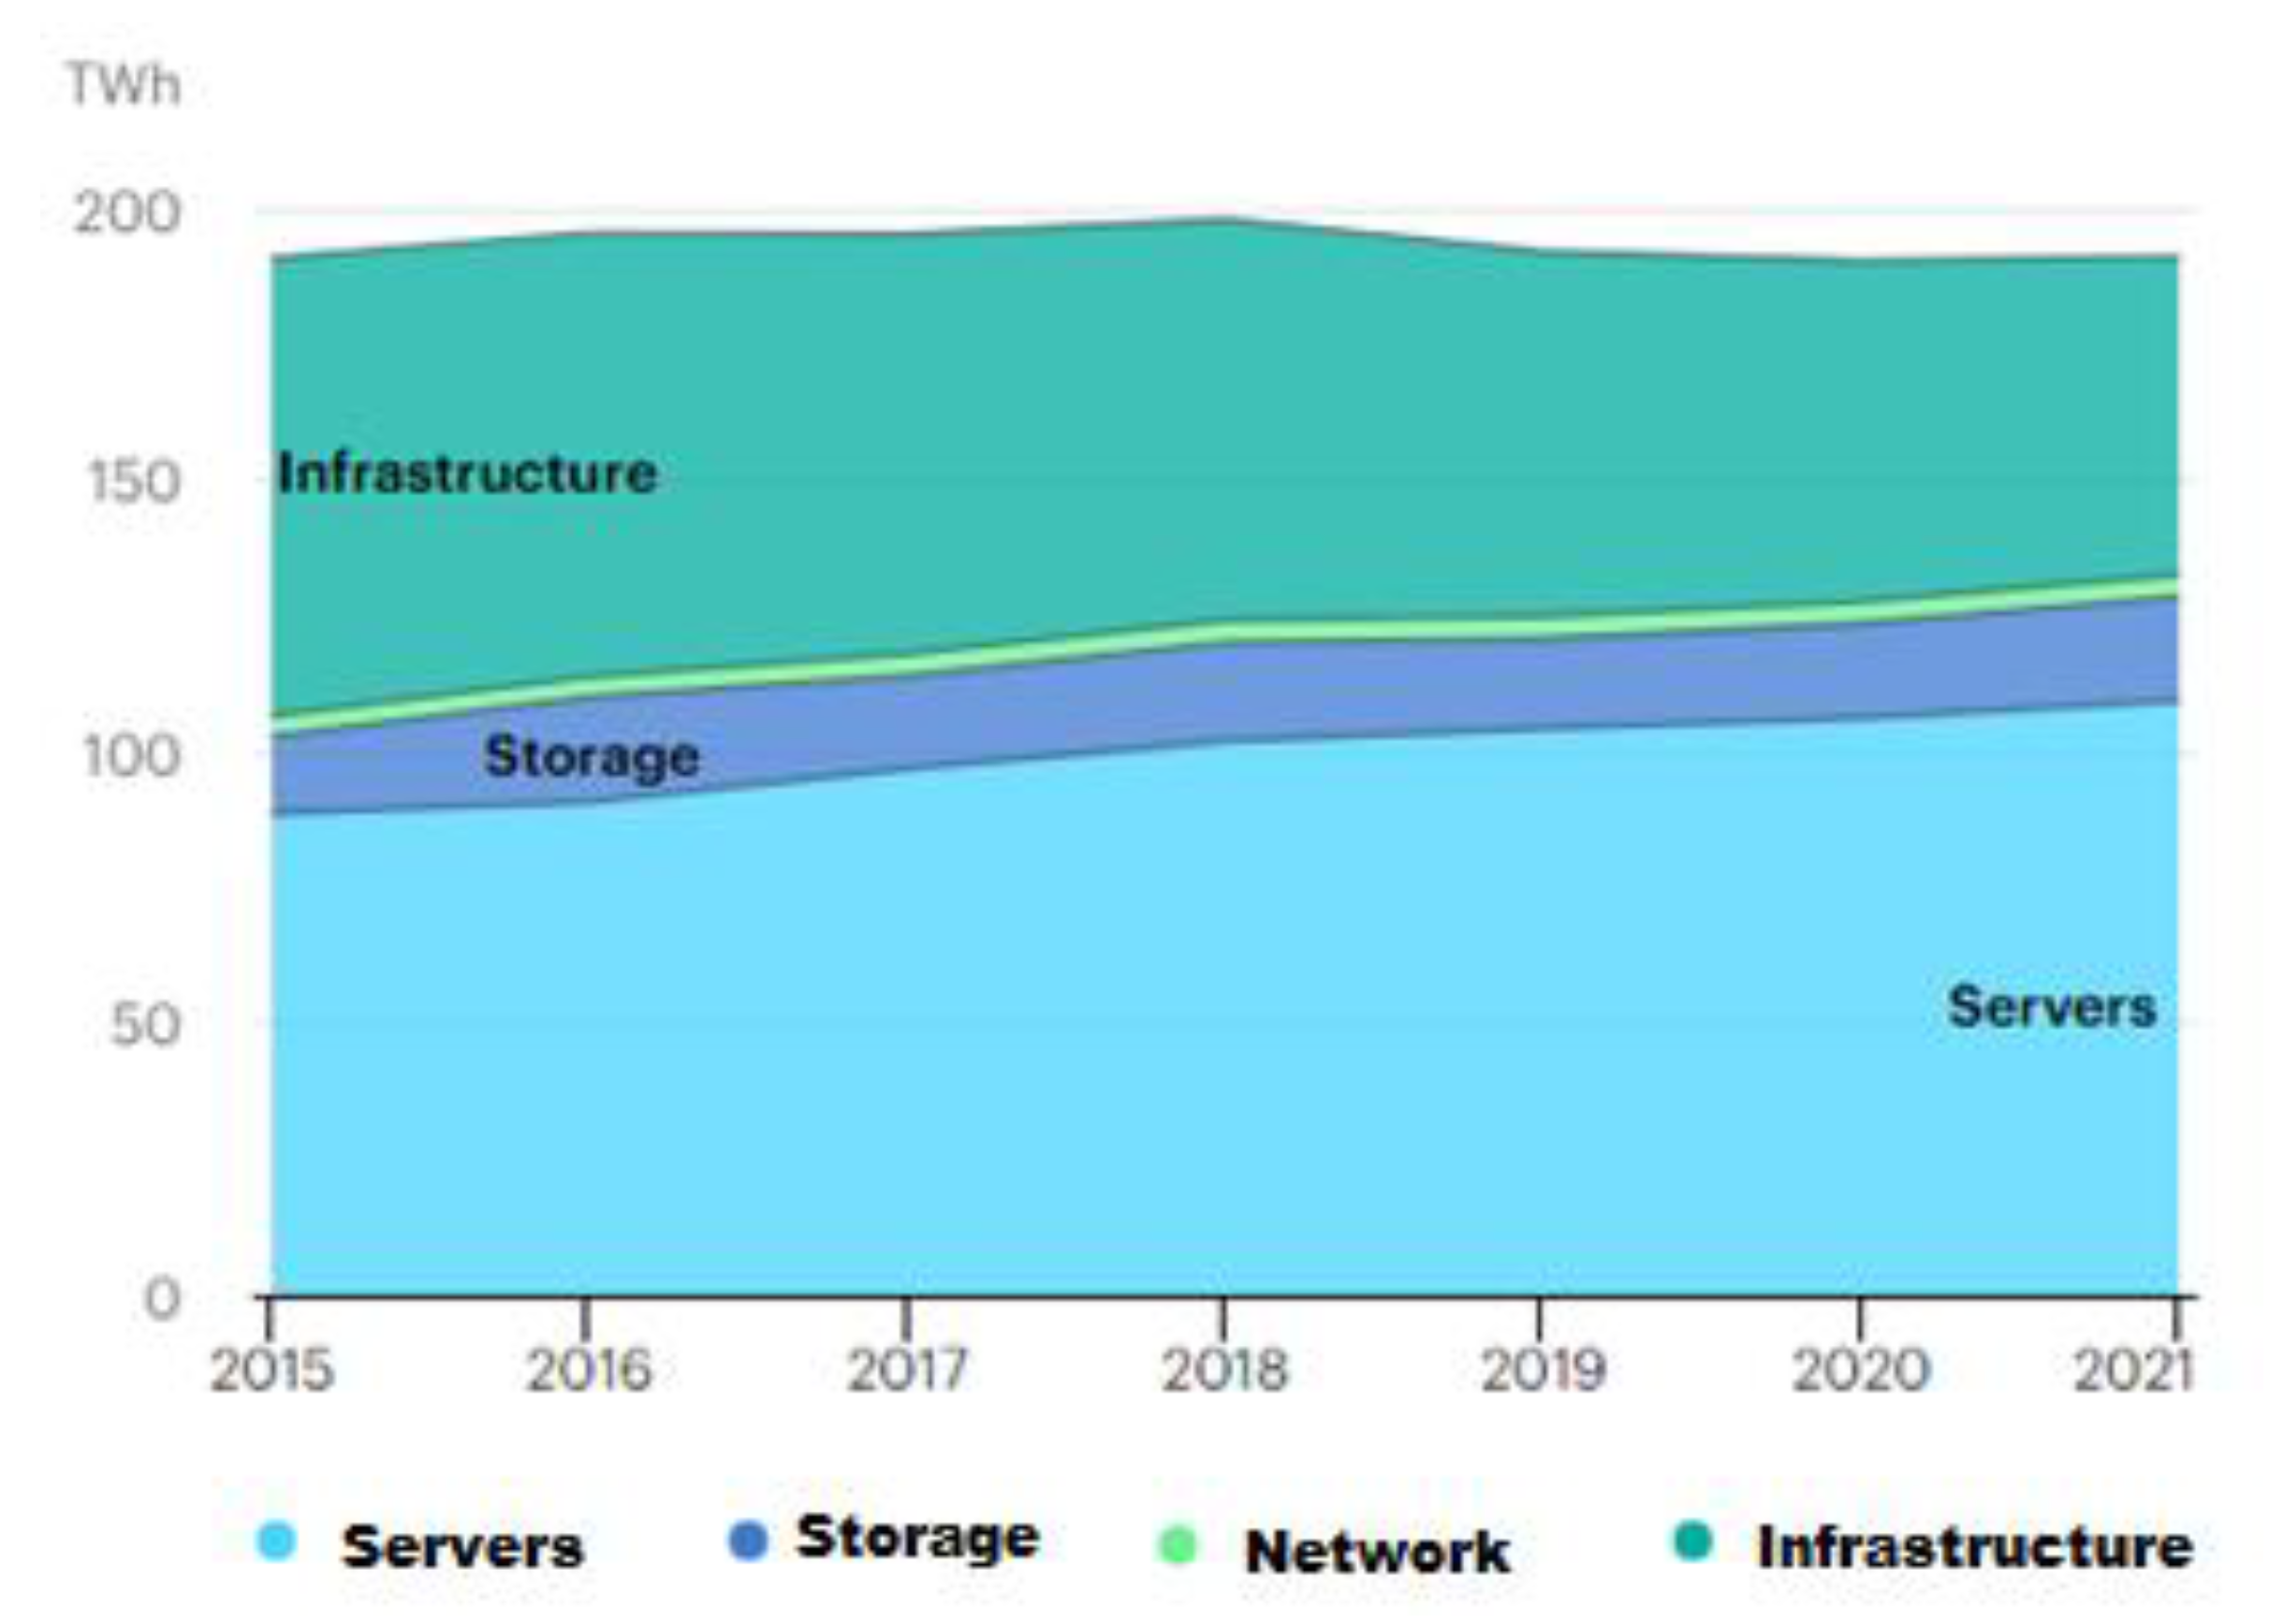
The global DC electricity demand in 2018 was estimated at 198 TWh or almost 1% of the final global demand for electricity [
6]. As shown in
Figure 3, based on current trends in the efficiency of the hardware infrastructure, by 2021 the global energy demand of the DC is expected to decrease slightly to 191 TWh [
6,
7,
8,
9], despite the predicted 80% increase in DC traffic and 50% in DC workloads over the next three years [
9].
Shehabi et al. [
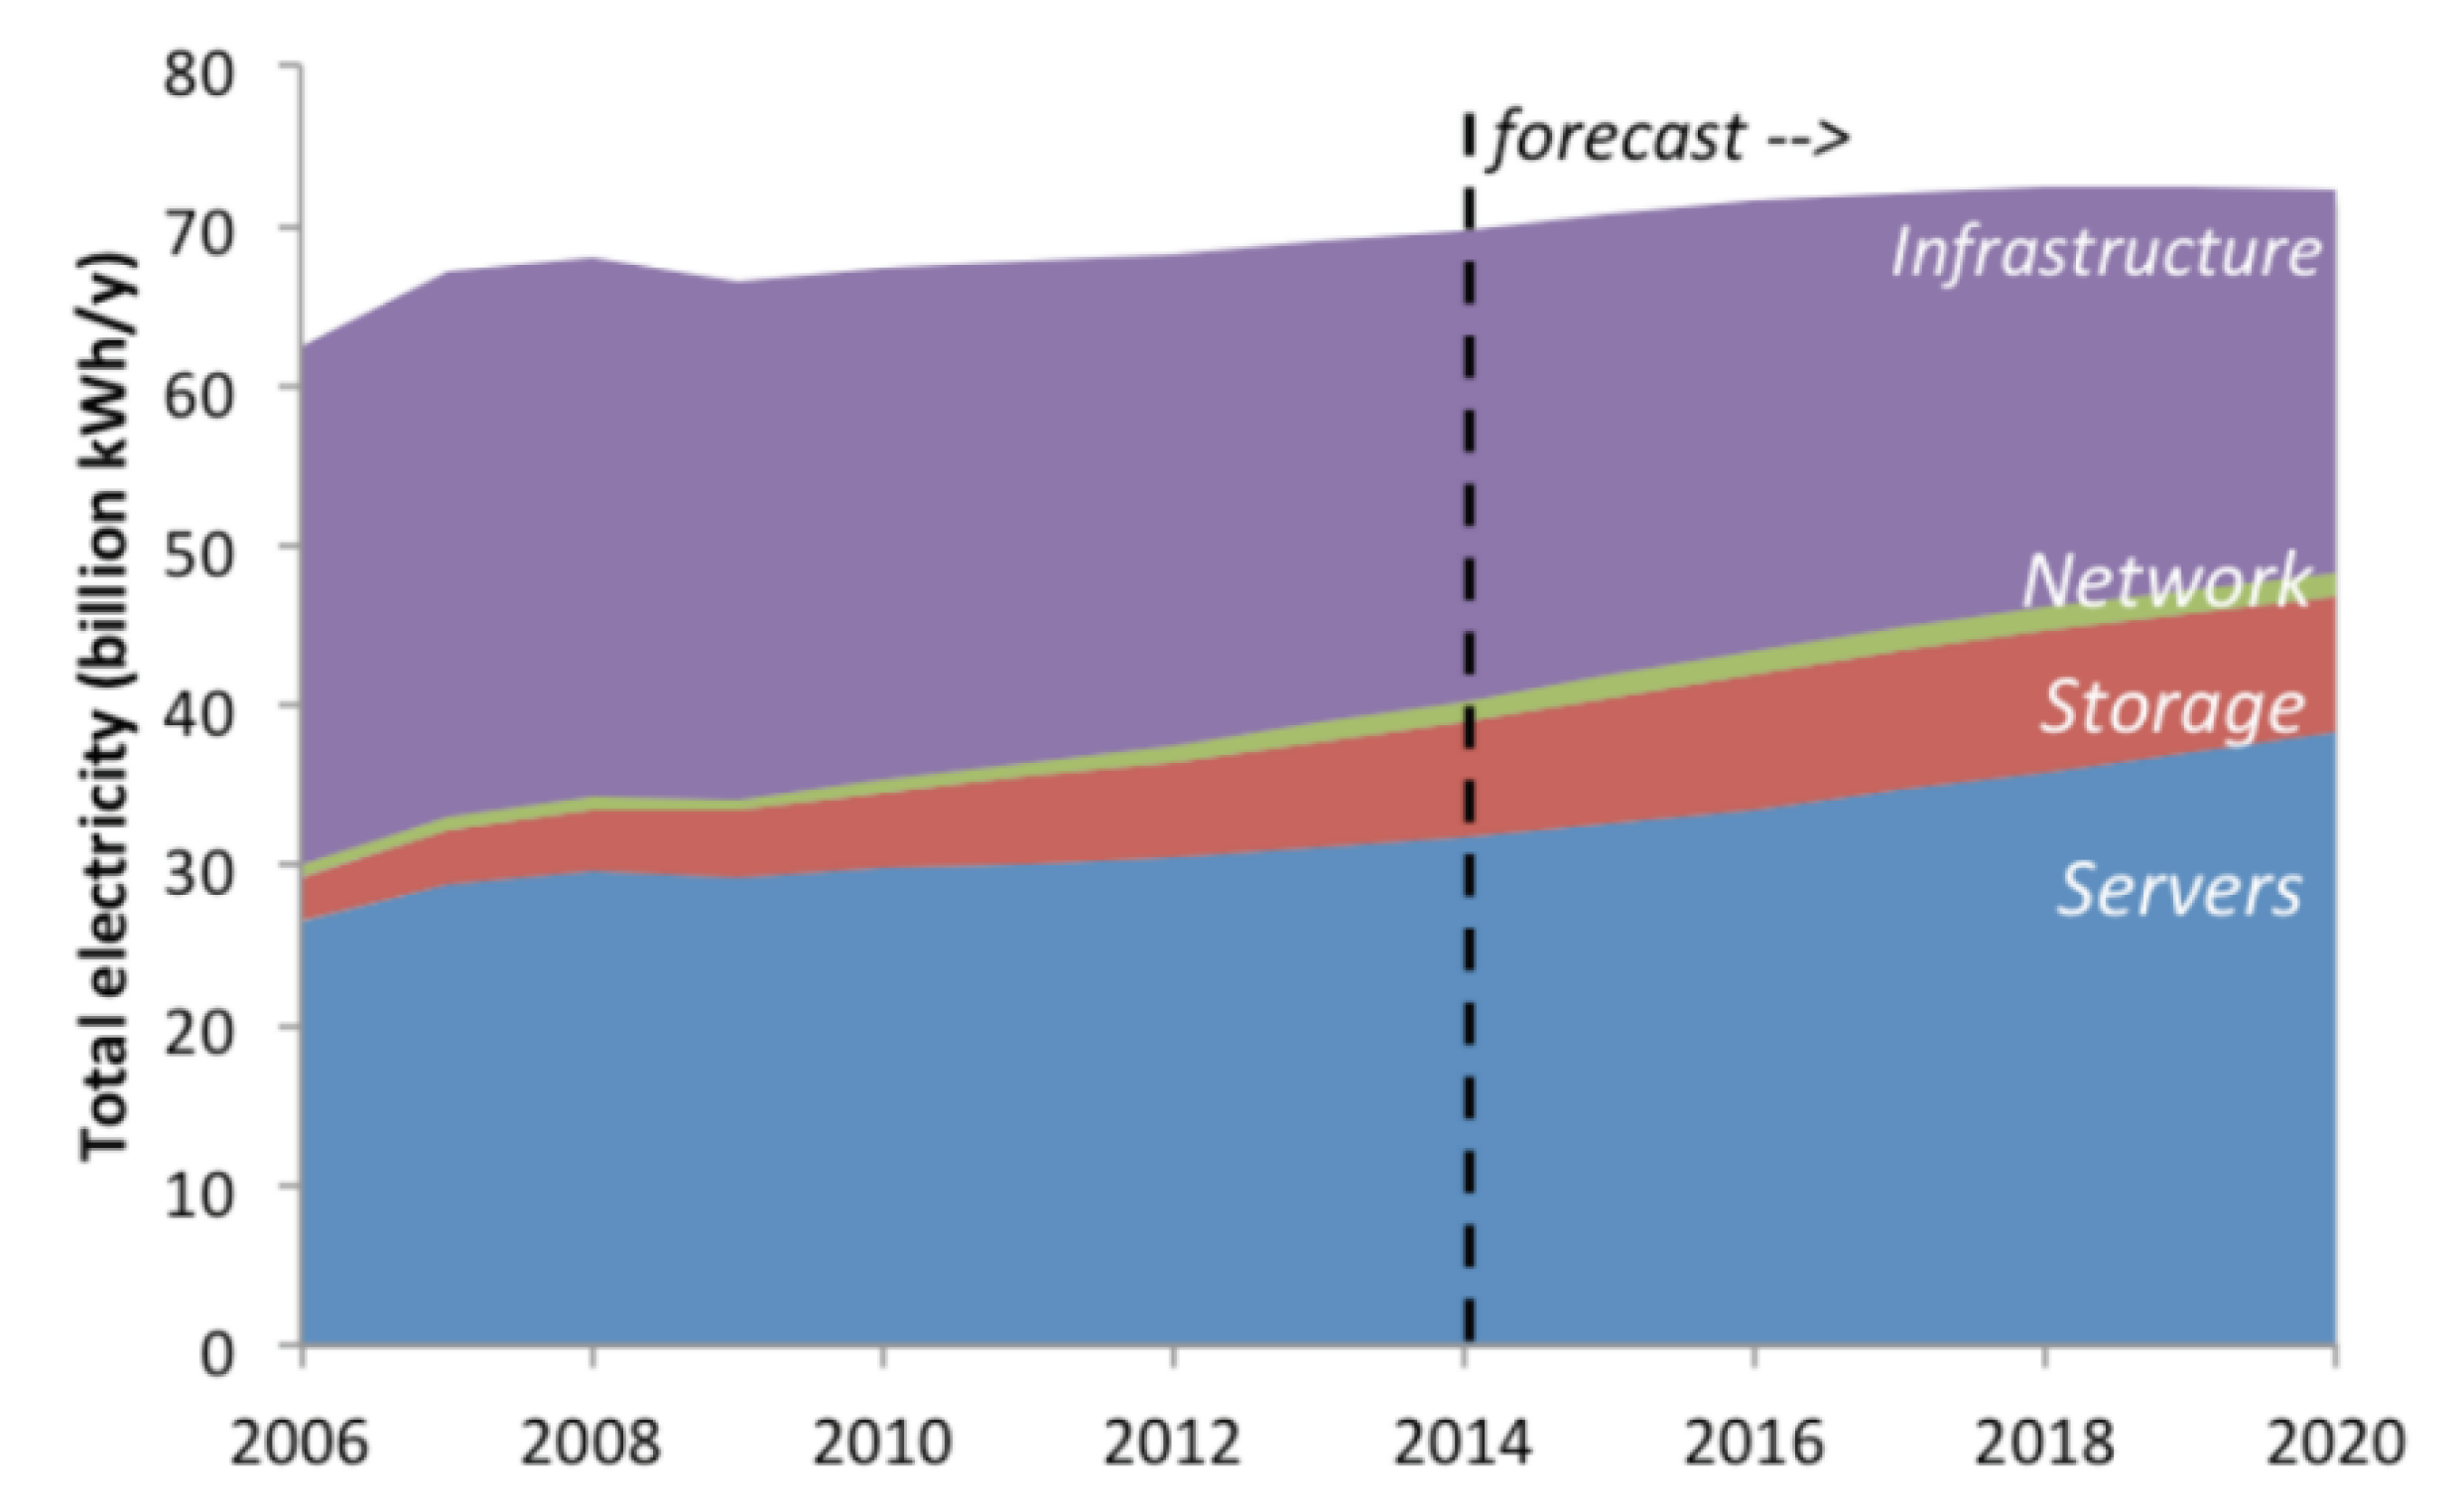
8] estimated the historical DC electricity consumption by 2020, based on previous studies and historical shipping data. The consumption prediction was based on new trends and the most recent data available.
Figure 4 provides an estimate of the total USA DC electricity usage (servers, storage, network equipment and infrastructure) from 2000 to 2020. In 2014, DCs in the USA consumed around 70 billion kWh, representing about 1.8% of total US electricity consumption. The results of that study show that electricity consumption in the DCs increased by 4% between 2010 and 2014, a major change from the 24% increase estimated in 2005–2010 and the almost 90% increase estimated between 2000 and 2005. It is expected that energy use will continue to increase slightly in the near future, increasing by 4% from 2014 to 2020, the same rate as in the last five years. Based on current trend estimates, DC in the USA are expected to consume approximately 73 billion kWh in 2020.
Today, PUE is the most used metric, which works with an emphasis on power and not on energy. In the design phase, the PUE uses concepts such as energies and others such as powers, both are correct, since in the design phase without simulation the metric uses a ratio between powers. In the application phase, that is with the project already executed and in operation, the PUE will be a mathematical ratio between energies. In recent years, a metric that will compare in the same type of air conditioning system, called Energy Usage Effectiveness Design (EUED) [
10,
11] has been studied. The EUED index uses the climatic data of 8760 h per year, using the wet and dry bulb data of those 8760 h. The method stipulates psychrometric conditions for the use of free cooling, evaporative systems, and variable coefficients of performance (COPs). Applying the method with the data from the American Society of Heating, Refrigeration and Air Conditioning (ASHRA)E Weather Data Viewer, it is possible to know which annual hours each air conditioning solution applies in a specific region to install a DC. The EUED allows a simulation in the design phase that would only be possible in the field with the data center already installed. Just as the Integrated Part Load Value ((IPLV), Air-conditioning, Heating and Refrigeration Institute (AHRI) Standards 550/590-2015) metric was a revolution for air conditioning, the same idea of EUED being an evolution for the simulation of where to install a DC [
12]. That index is used together with a new DC performance index, PDD (Perfect Design Data center). Both the EUED and the PDD indexes will be calculated for three different cities in the southern region of Brazil, with a similar PUE value. In addition to PUE, defined by The Green Grid, the Thermal Guidelines for Data Processing Environments [
4] already has some simulations for the use of “Free Cooling” for some cities. In this study adiabatic evaporative systems are included in the simulations to compare EUED and PDD in relation to PUE. This work includes data analysis of:
ASHRAE Thermal Guidelines for Processing [
13] ( with the data for three cities);
Geothermal temperature: from the cities Curitiba, Londrina, and Iguaçu Falls [
10,
11].
For the calculation of EUED, PDD and for the subsequent comparison with the values of PUE constant external air temperature (COA), the analysis and discussion of results aims to obtain a higher level of information for the decision making of where to place a DC. Specifically, the PUE measures the relationship between the total energy consumed by the installation and energy consumed by the IT equipment [
3] and the COA nomenclature means constant external air temperature using the average of the hottest 35.1 h of the year (0.4%) as a design value, given by the ASHRAE Standard. This index in the design phase simulates the equipment in the worst condition in the region, while the performance of the equipment in the AHRI 1361 [
14] condition simulates all equipment in a unique condition of 35 °C. This is the reason to emphasize the COP of the equipment with the air intake in the condenser at 35 °C [
14]. Note that a percentage comparison between the PUE COA and the EUED is interesting, since the EUED uses the wet and dry bulb temperatures of 8760 h of data given by the ASHRAE Weather Data Viewer [
15], while the PUE is based on Association Brazilian Standards Techniques (ABNT) Brazilian Standards (NBR) 16401 [
16].
The EUED is an index that instead of observing only one point with reference to the PUE (emphasis on air conditioning machines), provides a more comprehensive and global view of the whole, as it places emphasis on the environment as a whole. This analysis involves all the natural parameters of the regions that will be addressed in the course of deciding the location where to set the DC. The EUED given by Equation (1) is used in the design phase to predict a measure of the DC efficiency. The PDD (Perfect Design Data center) is an index that prioritizes efficiency in an increasing order, and is an index easy to interpret. In reality, PDD is a redefinition of EUED.
2. Chosen Cities and Characteristics
The calculation of these new indexes is based on a high-density DC that can be placed in the cities of Curitiba, Londrina and Iguaçu Falls located in the state of Paraná, Brazil, that have similar characteristics. The cities are close to large hydrographic basins and based only on Brazilian Association of Technical Standards (ABNT), using the annual frequency, wet bulb temperature (WBT), dry bulb temperature (DBT) and altitude [
15]. The difference between the dry bulb temperatures, DBT, (0.4% average of the hottest hours of the year—Freq. year (%)) of the cities Curitiba and Londrina is 46.1% and that of Curitiba and Iguaçu Falls is 51.3%, and for psychrometric effects of the altitude between the cities is Curitiba 908 m, Londrina 570 m and Iguaçu Falls 243 m, as shown in
Table 1.
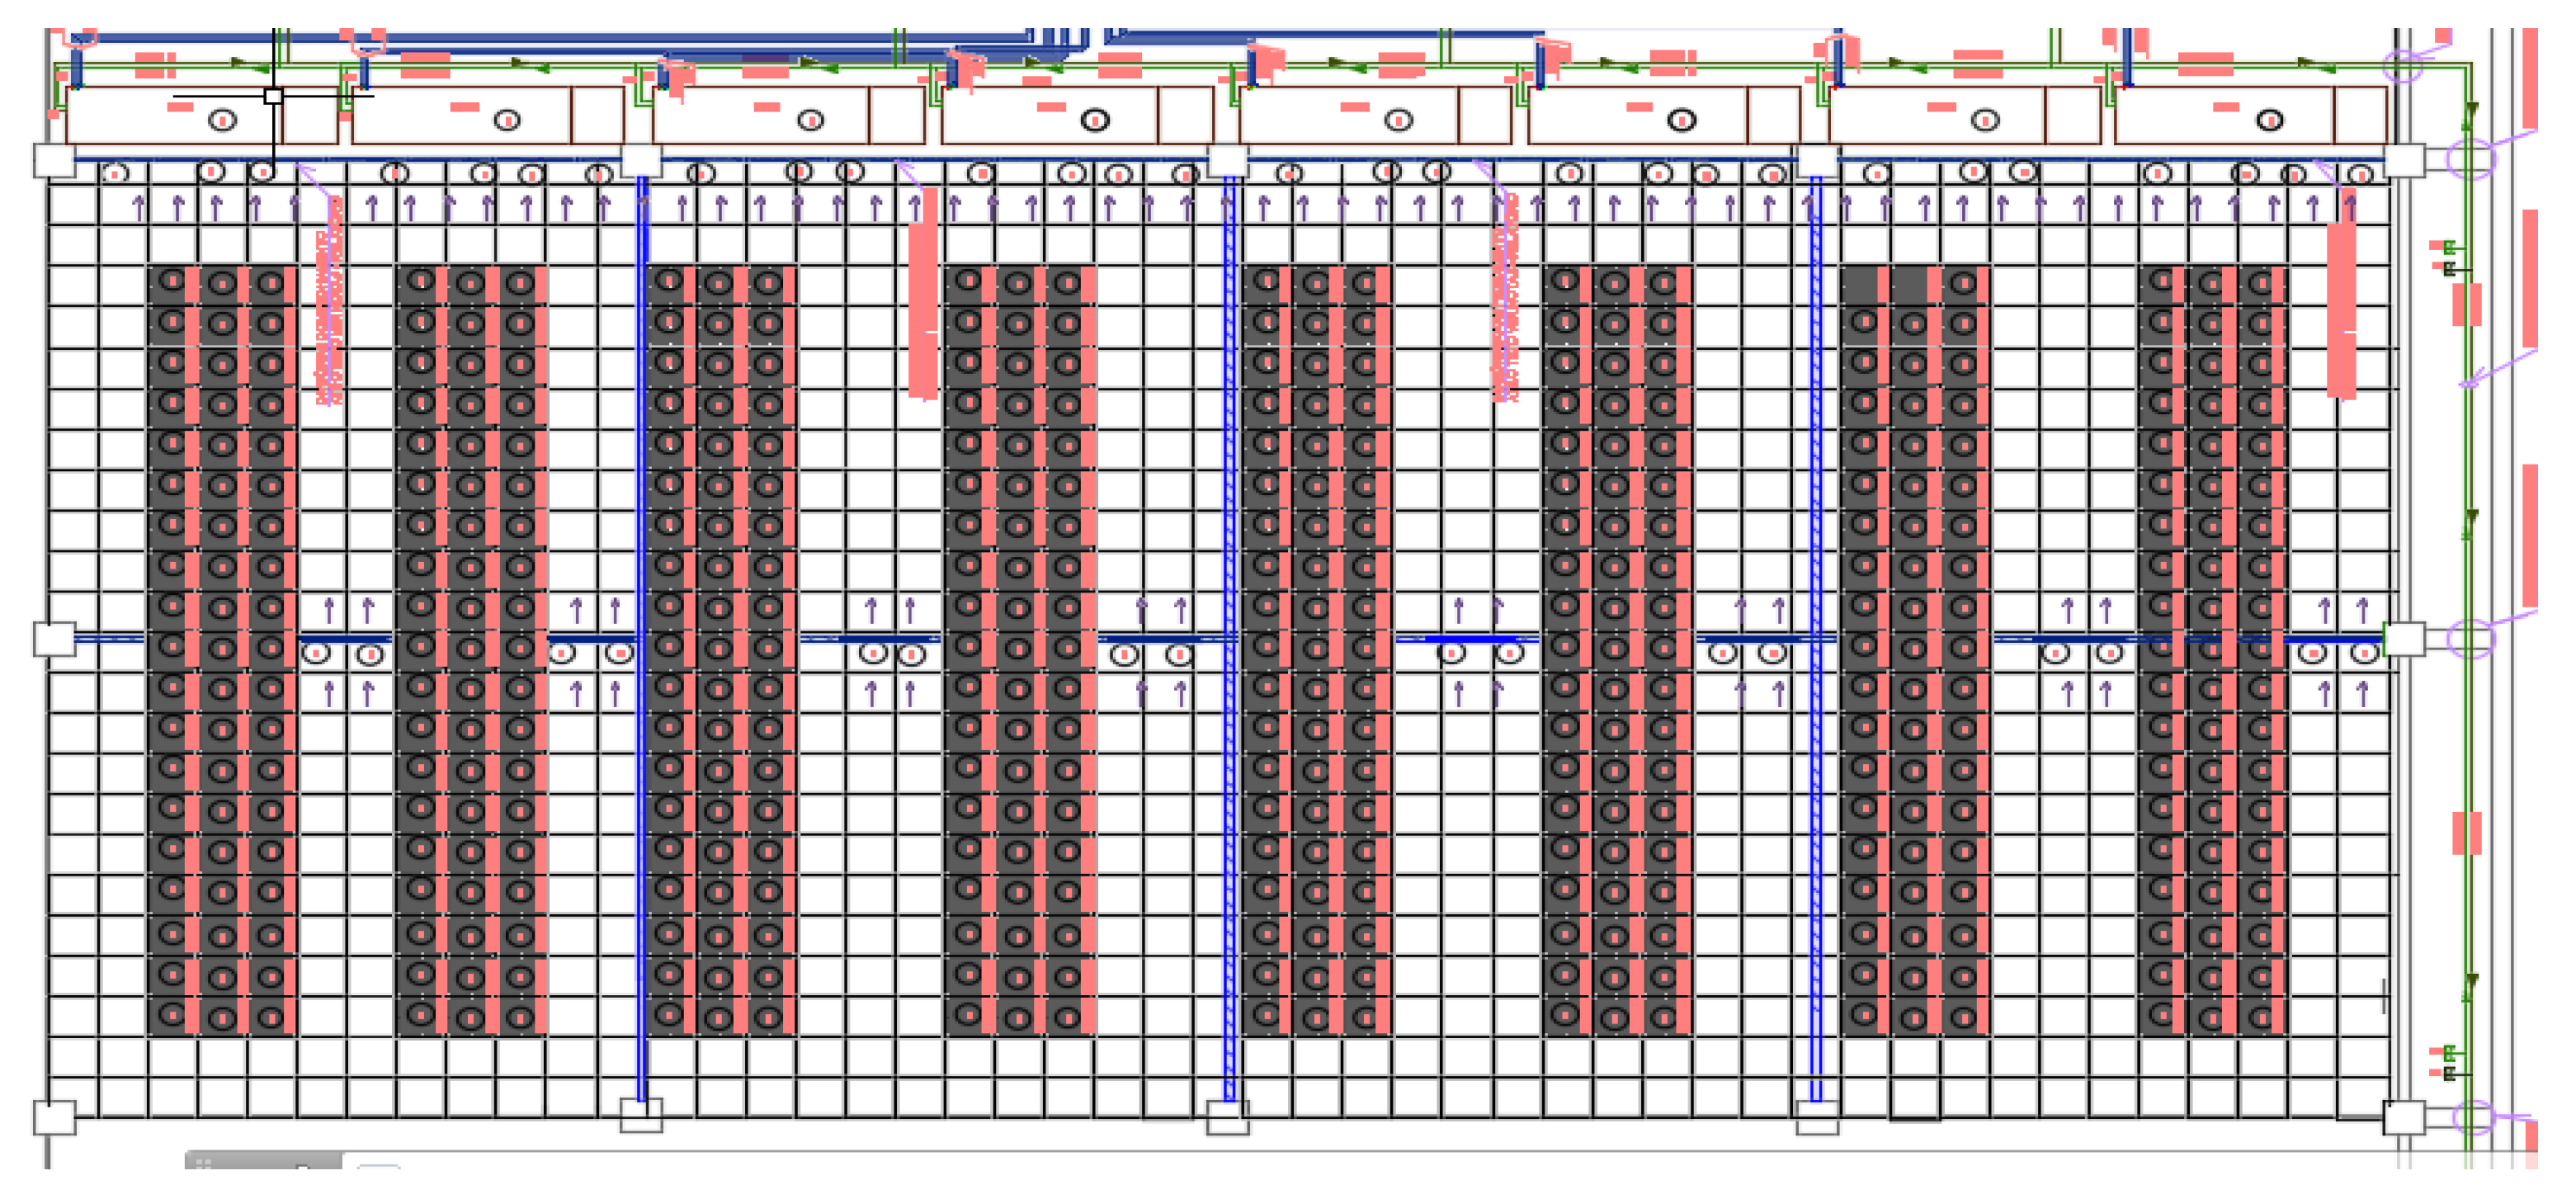
For comparison, a high density DC of 414.72 m² as shown in
Figure 5 was used with the heat dissipation equipment (347.3 kW of sensitive heat, that is, 0.84 kW/m²) added to the internal thermal load of 48 kW, composed of driving and lighting (8 kW), people and others (40 kW of Nobreak and others losses).
For this purpose, eight pieces of equipment (four effective and four reserve) with 30 Tons of Refrigeration (TR) “dual Fluid”, with 85% of the sensitive heat factor. A Ton of Refrigeration (TR) is a unit often used as a general term to indicate the capacity or size of a refrigeration plant. It is defined as the rate of heat transfer for freezing (or melting) of 1 ton (2,000 lb; 907 kg) of pure ice at 0 °C (32 °F) in 24 hours. ASHRAE defines 1 TR as equivalent to a refrigeration capacity of 3516.85 W or 3023.95 kcal/h. The dual fluid equipment has the technical specifications shown in
Table 2.
For the approximate capacity of 30 TR (Cooling ton of 104.6 kW, for each of the eight pieces of equipment, four effective and four reserve), the nominal Energy Efficiency Rate (EER) is 3.4 kW/kW (in the condition of direct expansion, considering a total nominal equipment consumption of 30.86 kW, for the temperature condition of 35 °C in the air intake of the condenser).
The energy efficiency data for DC air conditioning equipment are stipulated by AHRI 1361 (2017) [
14]. Thus, the nominal air conditioning consumption to meet the aforementioned thermal load will be 123.44 kW, of the four pieces of effective equipment. Therefore, the PUE will be:
A PUE of 1.50 kW/kW is an excellent value. The performance of the air conditioning equipment was based on an inlet air temperature in the condenser of 35 °C. To establish a comparison, a simulation was performed using the CoolPack software [
18] to determine the compressor’s isentropic coefficient. For this purpose, the power of the evaporator and condenser fans were neglected. In other words, for an EER of 3.4 kW/kW that includes the condenser and evaporator fans, the power of the fans (7.36 kW) was neglected, so the EER value = 104.6 kW/23.5 kW, will be 4.5 kW/kW (compressor specific).
3. Comparison of Indexes
The PUE COA is the same PUE index, but with an emphasis on the energy of the Constant Outdoor Air. The outside temperature is on average 0.4% of the current highest temperatures of NBR 16401.
The EUED index [
10,
11] works with 8760 h of data (use of energy instead of constant energy from outside air, which is already a suggestion for ISO 50006 [
19] used as a buildings metric in kWh/m²). Using the annual dry bulb temperature associated with the coincident dew point temperature (data from the ASHRAE Weather Data Viewer [
15]), the EUED index is classified as:
Free Cooling—a system that allows the use of the enthalpy characteristics of the outside air to acclimate rooms;
Evaporative—direct or indirect adiabatic cooling, which consists of cooling the ambient air using the wet bulb temperature;
A system for geothermal condensation (ground source) as a thermal bath option to condense the refrigerant fluid;
COP—a coefficient of performance, which is used to evaluate the relationship between the cooling capacities obtained and the work done to obtain it.
Based on an average air intake temperature of 20 °C, in the EUED methodology, the following systems were specified (using an altitude of 163 m corresponding to the average between the two cities in the study for an initial example, Iguaçu Falls and Manaus):
- A.
Free Cooling is used when the outside air temperature is below 20 °C and the enthalpy is below 42.797 kJ/kg.
- B.
An evaporative system is used when the temperature is between 15°C to 24°C and the enthalpy from 42.7979 kJ/kg to 55.8233 kJ/kg.
- C.
When the temperature is above 20 °C and enthalpy is above 55.8233 kJ/kg, the normal system is used under the following conditions:
COP1: Air intake temperature between 24 °C and 27 °C;
COP2: Air intake temperature between 27.1 °C and 30 °C;
COP3: Air intake temperature between 30.1 °C and 33°C;
COP4: Air intake temperature above 33.1 °C;
GEO: if a geothermal temperature is available, it will be used to determine the COP, with a 4 °C differential of the geothermal temperature.
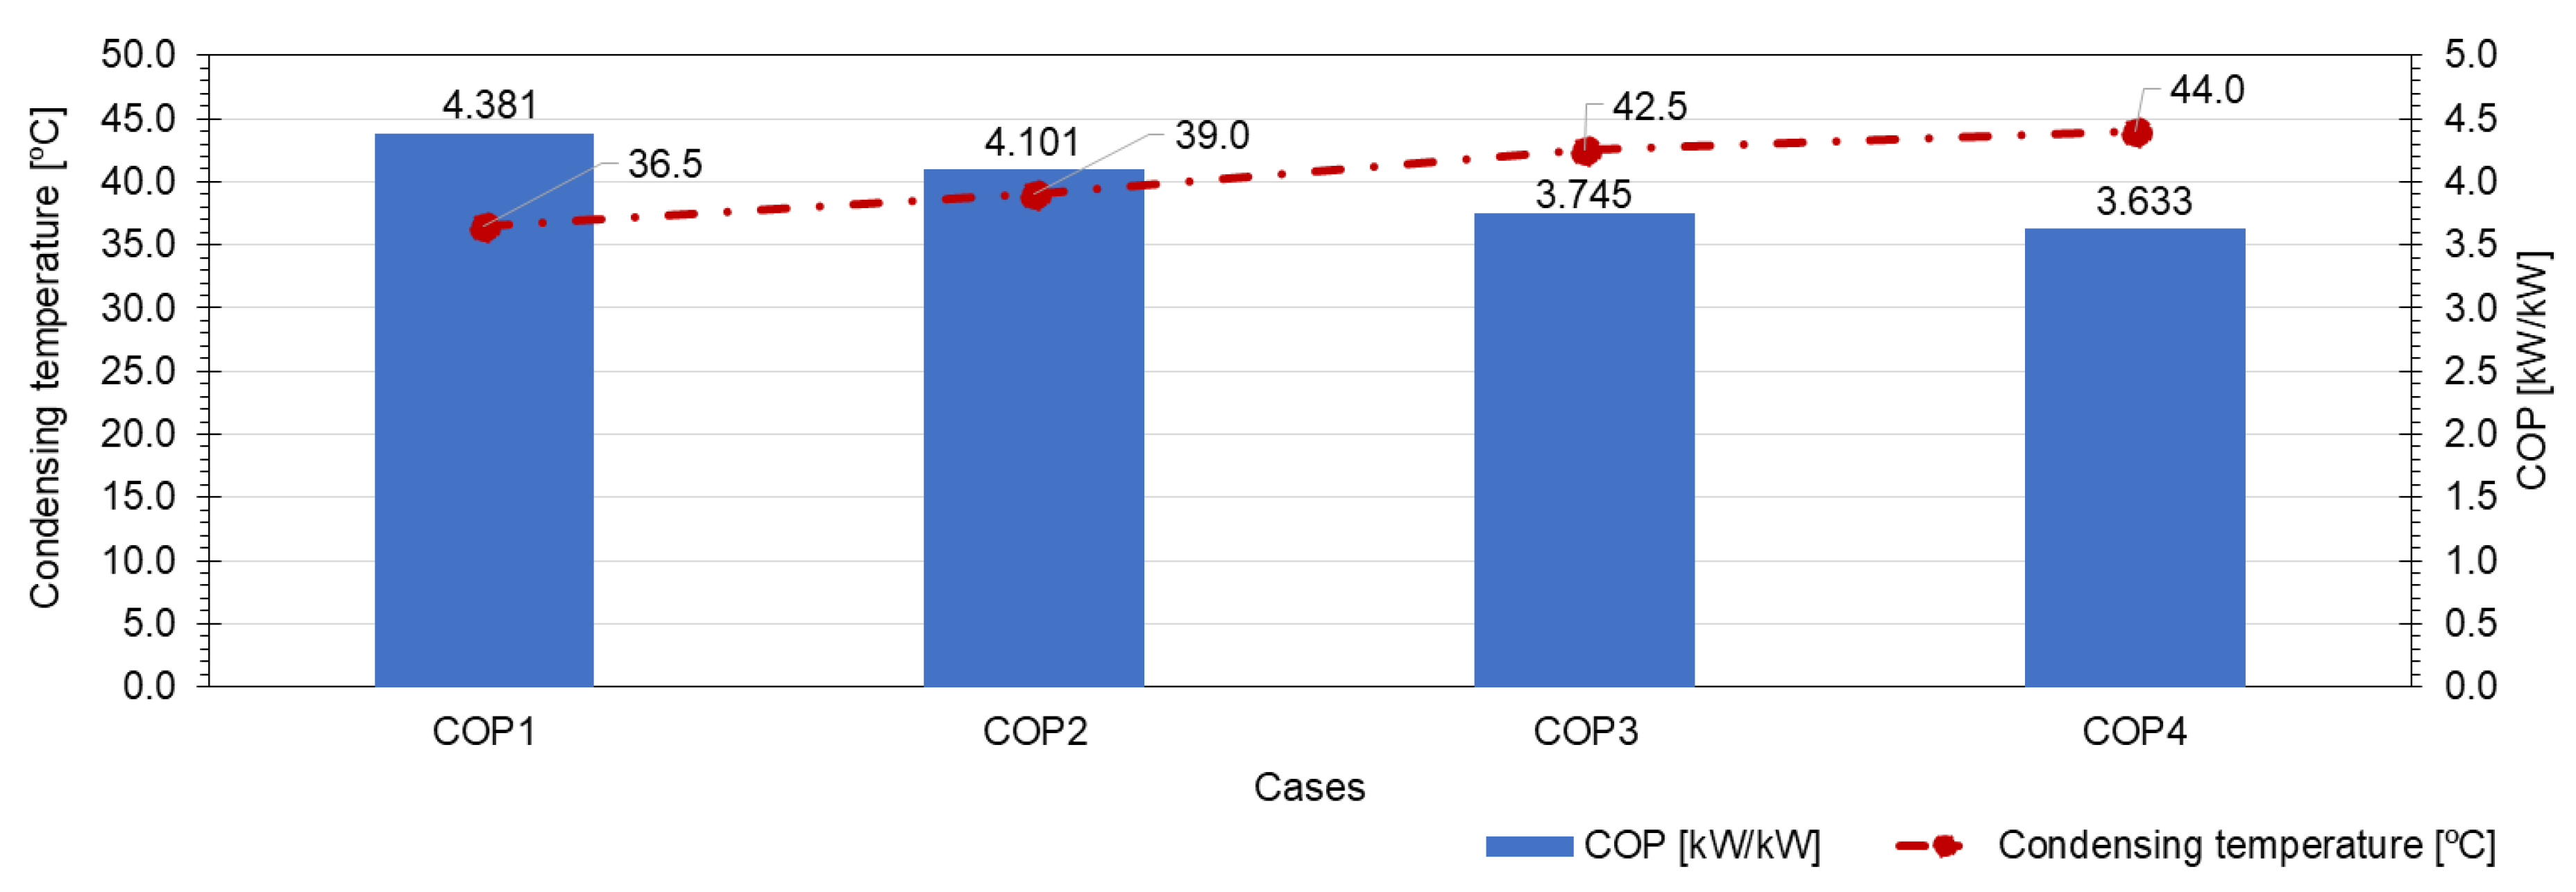
The CoolPack software [
18] was used to simulate the conditions of COP1, COP2, COP3, and COP4. The simulation started by condition COP4 to simulate a standard isentropic coefficient to be able to identify the COP with the variation in condensation temperatures. The effect of the condensation temperature was considered, adding 11 °C to the average air inlet temperature for each situation with the conditions shown in
Figure 6. The results obtained with the software are described below for the cases of COP4 to COP1 in decreasing order. For the geothermal water condensation system, the value of 6 °C was added [
11].
For each case study, COP is determined for two conditions, with or without the work of the fans.
From the COP values obtained by the CoolPack [
18] software and the basic data of the enthalpy system methodology for DCs, a system of wide psychrometric coverage was elaborated for all possible external temperature points, whether for “Free Cooling”, Evaporative or just Cooling. Using the ASHRAE Climate Data Viewer [
15], the association of dry bulb temperature frequencies with the dew point coincident temperatures was defined as the method. At each point, the enthalpies associated with this relationship were found in the following cumulative frequencies for each system and city as shown in
Figure 7.
Using the same software ASHRAE [
15], selecting the proposed EUED index, it classified the frequencies in hours of work for the three cities. It is worth mentioning that there are differences between cities. In Curitiba, using the evaporative system, when the temperature is between 15 °C and 24 °C and enthalpy between 42.7979 kJ/kg and 55.8233 kJ/kg, there is higher frequency, which is 3453.887 h; in Londrina there are 2054.839 h and Iguaçu Falls 2851.659 h of frequencies. With a Free Cooling system, with a temperature below 20 °C and an enthalpy below 42.7979 kJ/kg, Curitiba has 4410 h of frequency, Londrina 1631.256 h and Iguaçu Falls 2069.853 h.
Six levels were classified using the rules proposed in the EUED as shown in
Figure 7: Free Cooling; Evaporative; COP1; COP2; COP3; and COP4. The cities of Curitiba, Londrin, a and Iguaçu Falls have different air consumption energies according to their temperature and enthalpy. In a period of 8760 h, Londrina used 80.78% more energy than Curitiba, and Iguaçu Falls 84.77% more energy than Curitiba.
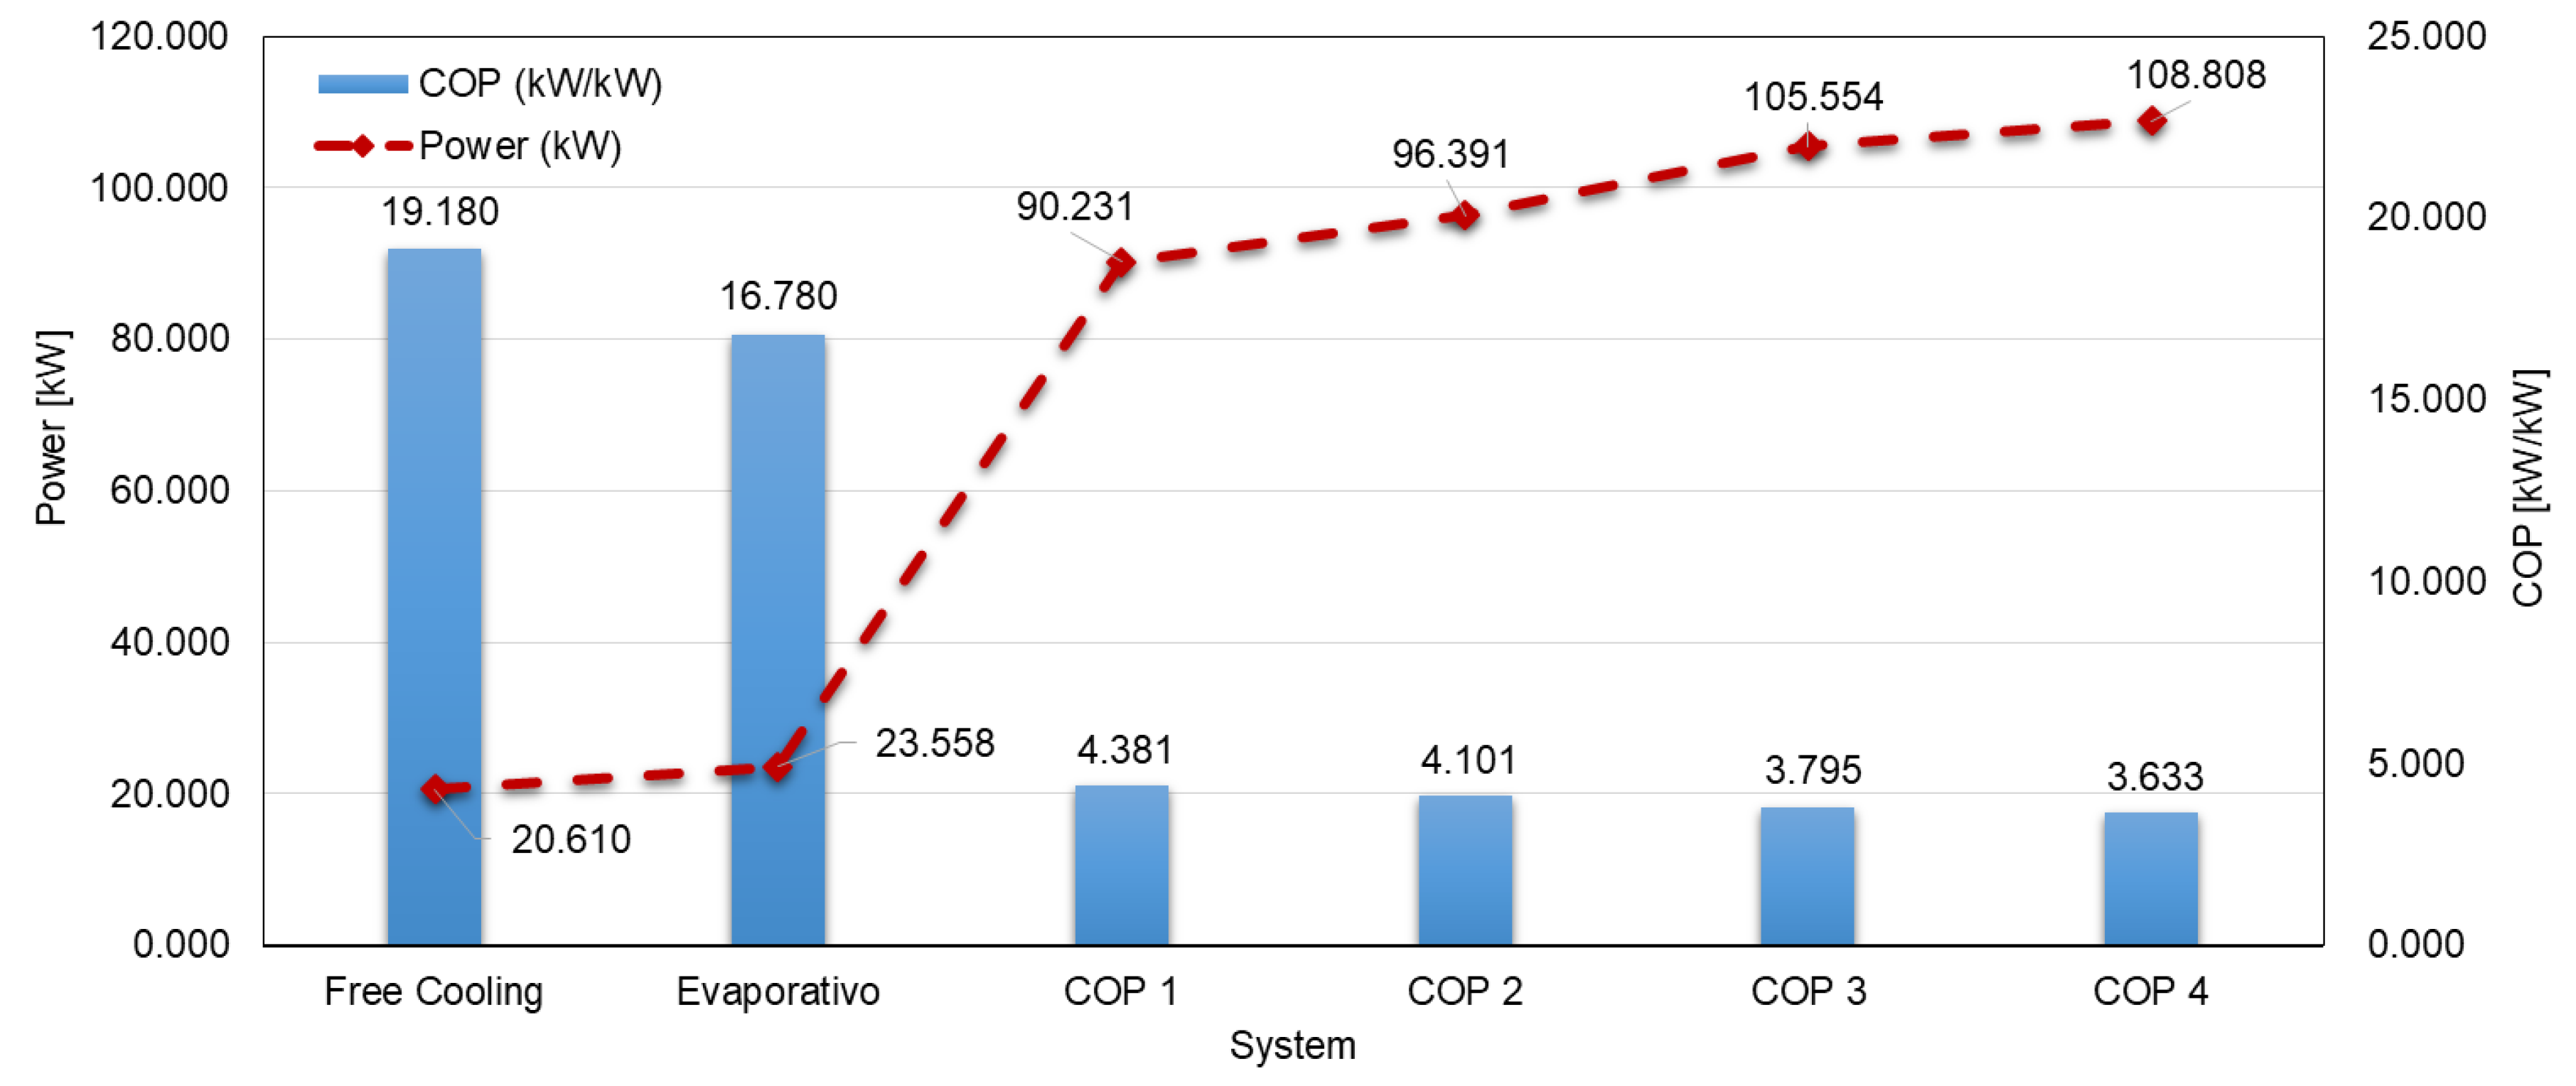
Table 3 shows the relationship between COP and energy. The higher the COP, the lower the energy consumption.
Table 4 gathers the final results in calculations using EUED index rules for the three possible locations for DC installation.
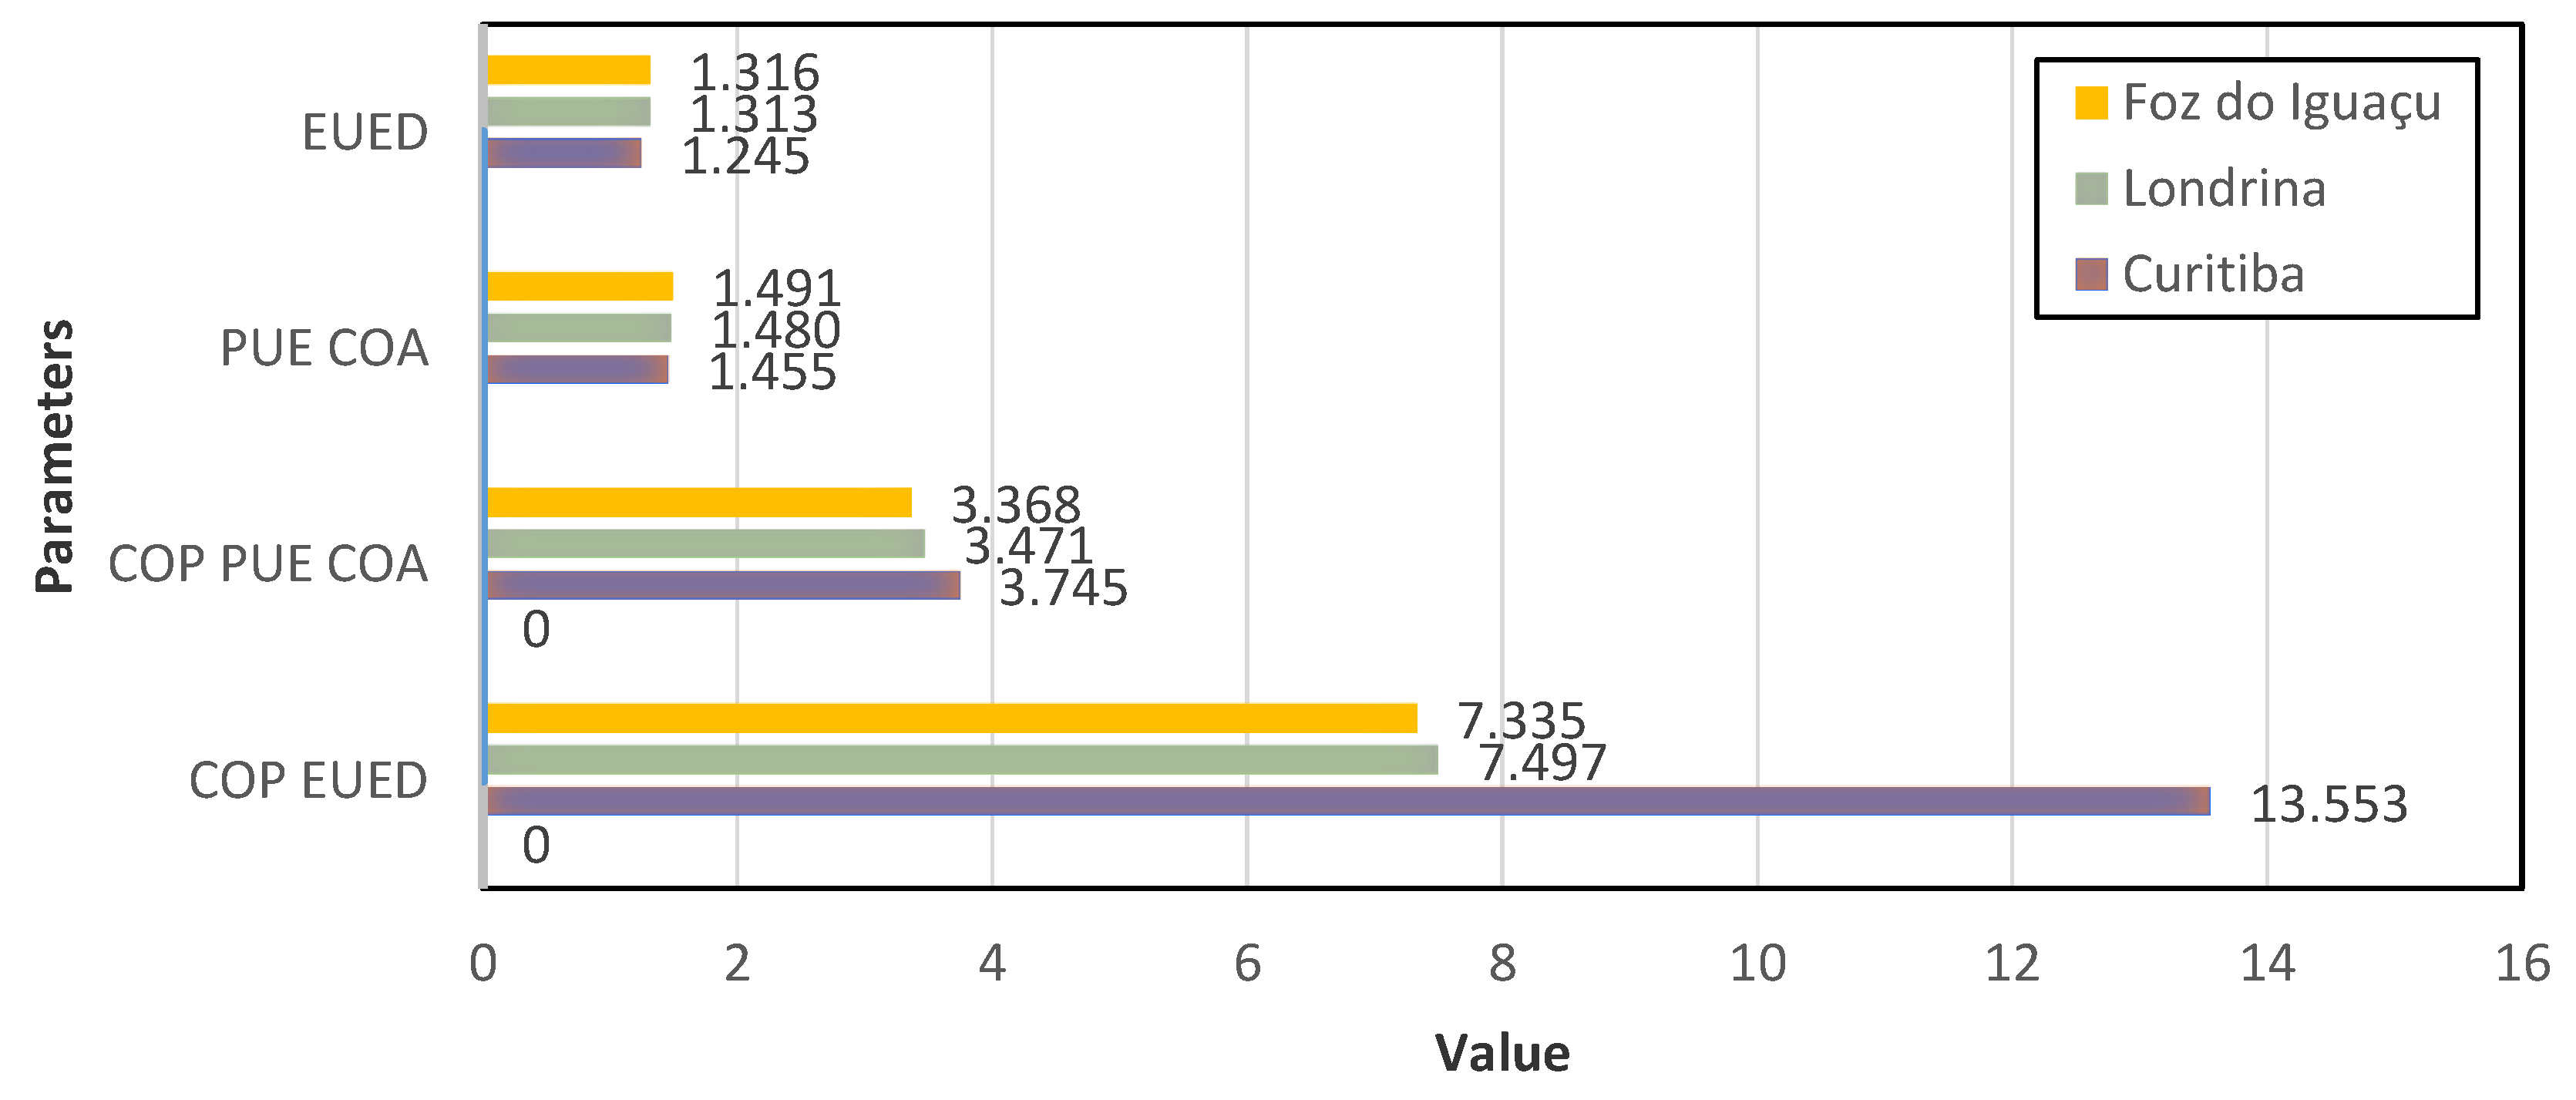
Figure 8 shows the comparative information of COP PUE COA and COP EUED. It shows that the COP EUED for Curitiba is larger than for the other cities (Londrina and Iguaçu Falls). Thus, it is the best way to map the possibilities in the project phase and have satisfactory results in the installation of new DC facilities.
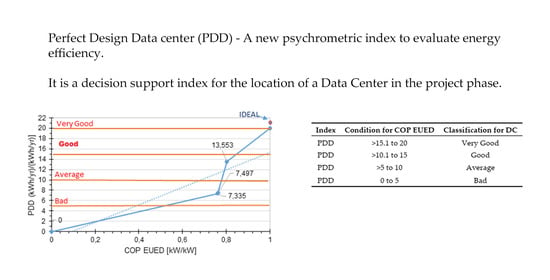
4. Using a New Index PDD (Perfect Design Data center) to Evaluate Energy Performance
The PDD—Perfect Design Data center index is a redefinition of EUED given by Equation (1). It is an index that prioritizes efficiency in increasing order and that is easy to interpret since it varies between 0 and 1, 1 being a “perfect design”. A decision abacus could be easily generated using the PDD that is given by Equations (12) and (13):
Obtaining the PDD value, Pearson’s linear correlation coefficient,
r, can be determined, providing the strength of the linear correlation between two variables. Analyzing its result, it is possible to determine whether the use of the linear model as given by Equation (14) for modeling the phenomenon is appropriate [
20].
The angular,
m, and linear,
b, coefficients of Equation (14) must be determined by Equations (15) and (16) to develop the mathematical correlation.
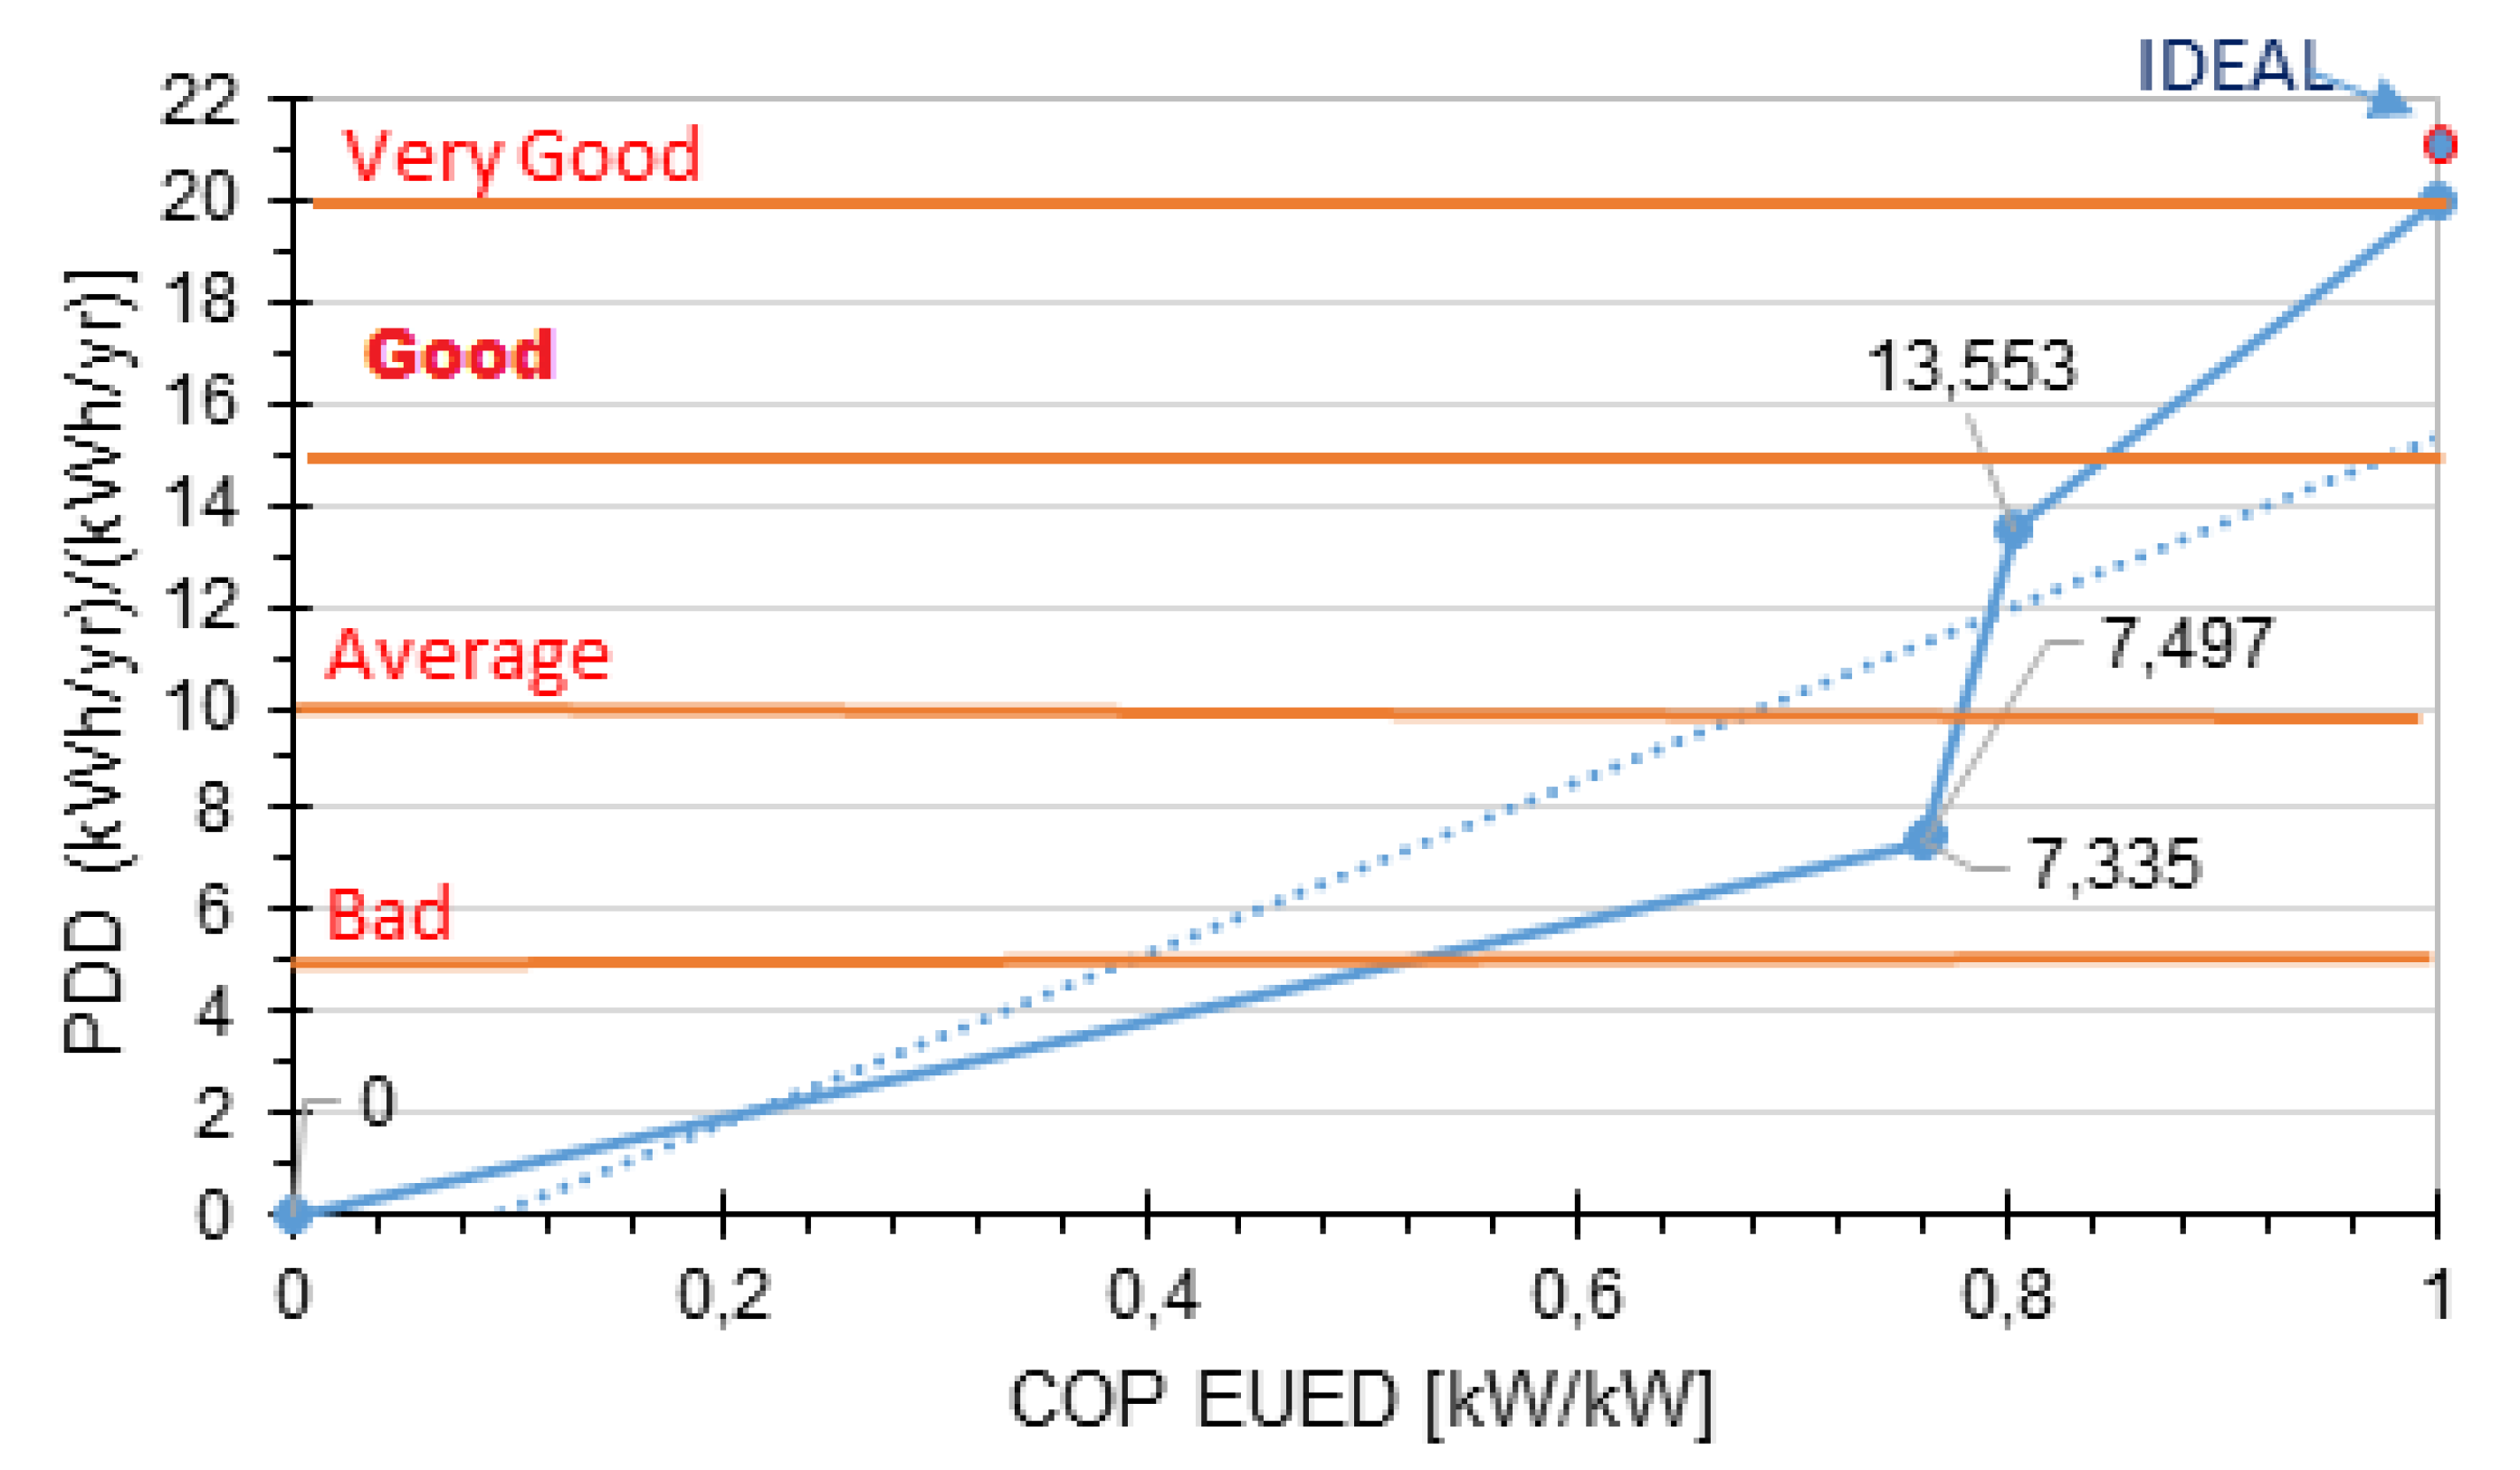
The linear mathematical equation of PDD value in terms of COP EUED is given by Equation (17), as shown in
Figure 9.
A ranking table was created for the PDD in relation to the COP EUED (
Table 5):
Figure 10 shows the three cities surveyed in this study according to the PDD index classification, for the development of a DC construction project. Using this index, the best city to place a DC would be Curitiba with 0.803 kW/kW of PDD (excellent classification).
5. Conclusions
The proposed EUED and PDD indexes are more reliable indices compared to the PUE COA, which is a metric that considers power in design. To analyze energy efficiency in new DCs, indexes were developed that use energy as a comparison element, making use of enthalpy utilization as a new methodology to obtain the results in the design phase (EUED). The PDD, a redefinition of EUED, is an index that prioritizes efficiency in increasing order and is easy to interpret. From a holistic point of view, enthalpy is an essential tool for choosing the best location to place a DC. Energy consumption of the infrastructure, which is the sum of energy consumption of air conditioning, equipment, lighting, and other equipment, between cities gives a difference of more than 5.45% in Londrina in relation to Curitiba and 5.72% from Iguaçu Falls in relation to Curitiba. The indexes obtained with the application of the EUED index were, respectively, 1.245 (kWh/yr)/(kWh/yr) for Curitiba, 1.313 (kWh/yr)/(kWh/yr) for Londrina and 1.316(kWh/yr)/(kWh/yr) for Iguaçu Falls, showing a difference of 16.86% for Curitiba, Londrina 13.33% and 13.30% for Iguaçu Falls in relation to the PUE COA.
The PDDs of these cities were 0.803 (kWh/yr)/(kWh/yr) for Curitiba, 0.762 (kWh/yr)/(kWh/yr) for Londrina and 0.760 (kWh/yr)/(kWh/yr) for Iguaçu Falls. This index was created as a linear correlation r to be easily used as a decision-making tool for the location of a DC in the project phase.
The current method of AHRI 1361 [
14] does not favor the varied COP, as in their conception it implies that due to the fixed thermal load of a DC there is no reason to measure efficiency in partial loads; this is a mistake because despite the fact that the thermal load is fixed, changes in the external temperature modify the compression ratios, favoring inverter and or digital scroll type equipment.
However, with the EUED index, there is an incentive for the DC Investor to use free cooling and an evaporative climatization system that can generate a lot of energy savings. In addition, the use of varied COP will favor digital or inverter type equipment that consumes less energy with the variation of air temperature intake in the condenser.
The emphasis used in this new method is for the installation of large DCs. While research [
21] describes how layout changes and increased use of wireless transmission can minimize heat dissipation in DCs, the research described in this article shows how external enthalpic conditions can influence the decision of where to install it.


