Article

Modeling of Soybean under Present and Future Climates in Mozambique

by
Manuel António Dina Talacuece
1,*,
Flávio Barbosa Justino
1,
Rafael De Ávila Rodrigues
2,
Milton Edgar Pereira Flores
1,
Jéssica Garcia Nascimento
1 and
Eduardo Alvarez Santos
3
1
Agricultural Engineering Department, Federal University of Viçosa, Avenue Peter Henry Rolfs, Viçosa Campus, Viçosa-MG 36570-900, Brazil
2
Geography Department, Goias Federal University, Regional Catalão, Avenue Dr. Lamartine Pinto de Avelar, 1120-Setor Universitário, Catalão-GO 75704-020, Brazil
3
Department of Agronomy, Kansas State University, Manhattan, KS 66506-0110, USA
*
Author to whom correspondence should be addressed.
Climate 2016, 4(2), 31; https://doi.org/10.3390/cli4020031
Submission received: 1 April 2016 / Revised: 25 May 2016 / Accepted: 26 May 2016 / Published: 17 June 2016
(This article belongs to the Special Issue Climate Change on Crops, Foods and Diets)

Abstract

:
This study aims to calibrate and validate the generic crop model (CROPGRO-Soybean) and estimate the soybean yield, considering simulations with different sowing times for the current period (1990–2013) and future climate scenario (2014–2030). The database used came from observed data, nine climate models of CORDEX (Coordinated Regional climate Downscaling Experiment)-Africa framework and MERRA (Modern Era Retrospective-Analysis for Research and Applications) reanalysis. The calibration and validation data for the model were acquired in field experiments, carried out in the 2009/2010 and 2010/2011 growing seasons in the experimental area of the International Institute of Tropical Agriculture (IITA) in Angónia, Mozambique. The yield of two soybean cultivars: Tgx 1740-2F and Tgx 1908-8F was evaluated in the experiments and modeled for two distinct CO2 concentrations. Our model simulation results indicate that the fertilization effect leads to yield gains for both cultivars, ranging from 11.4% (Tgx 1908-8F) to 15% (Tgx 1740-2Fm) when compared to the performance of those cultivars under current CO2 atmospheric concentration. Moreover, our results show that MERRA, the RegCM4 (Regional Climatic Model version 4) and CNRM-CM5 (Centre National de Recherches Météorologiques – Climatic Model version 5) models provided more accurate estimates of yield, while others models underestimate yield as compared to observations, a fact that was demonstrated to be related to the model’s capability of reproducing the precipitation and the surface radiation amount.

1. Introduction

Soybean (Glycine max (L.) Merrill) is one of the most cultivated crops in the world due to its demand in several industrial products (from oil production to paper). Due to their economic value, soybeans have been growing under different environmental conditions, which has led to constant technological developments [1]. The US Department of Agriculture (USDA) estimated that the world production of soybeans in the 2015/16 growing seasons will be 317.6 million tons, which will be nearly identical to the 2014/15 season production (318.3 million tons). The estimated soybean production in the US is about 104.8 million tons, 97 million tons in Brazil and 57 million tons in Argentina for the 2015–2016 growing seasons [2].
These high soybean yields observed in the American continent are not seen in Africa, Europe and Asia. In Africa, the largest areas planted with soybeans are located in Nigeria (601,000 ha), South Africa (150,000 ha) and Uganda (144,000 ha), which are the main soybean producers [3]. These countries combined account for almost 77% of total soybean production in sub-Saharan Africa. However, the production of soybeans in Africa is expected to increase from the current 1.5 million tons to 1.9 million tons in 2020 [4]. This is an important outcome considering the soybean importance as food source, animal feed and many industrial applications, thus the soybean crop has the potential to become an important crop in Africa. Additionally, the soybean seed is rich in protein and oil content, which could improve the nutritional value of the local population diet.
The Mozambique economy’s major sector is agriculture, which is responsible for about 25 percent of the gross domestic product (GDP), despite low crop yield and productivity [5]. In 2009, the agricultural sector employed more than 80 percent of the population in Mozambique [6]. The majority of agricultural activities (90%) are carried out by small farmers that plant crops on an average of 1.1 hectares of land using labor intensive techniques [7]. According to [8], 32,000 tons of grains were harvested in the 2011/2012 growing season in an area of approximately 30,000 ha by 27,000 farmers. In comparison to the 2010/2011 growing season, this represents an increase of up to 150% in grain production and a 115% increase in cultivated area. There was also an increase in average yield from 0.92 ton/ha (2010/2011) to 1.07 tons/ha in the 2011/2012 growing season.
Climate change is likely to affect the profitability of the soybean farming system in the future in Mozambique. Crop yield is highly dependent on meteorological variables such as temperature and precipitation. Authors of [9] found a 1.3% decrease in the soybean yield per 1 °C increase in minimal and maximal related to climate trends between 1981 and 2002. Authors of [10,11] reported an optimum temperature of 22 °C for soybean and a linear reduction for temperatures higher than 30 °C. Authors of [12] argued that, in addition to yield reduction, the larger climate variability, predicted for future climate scenarios, may result in larger inter-annual variability in the crop yield due to extreme climate events, such as dry spells and floods. On the other hand, C3 crops, such as soybeans, are expected to benefit from the high concentration of atmospheric CO2 [13].
Changes in global climate are seen as inevitable, therefore adaptation strategies should be adopted to minimize the negative effects of climate change on production. Crop models have been extensively used to predict crop response to different environmental conditions. Authors of [1] evaluated the potential for soybean cultivation in several African countries and concluded that a large part of East Africa and the Sahel region are suitable for growing soybeans. However, the use of crop varieties with distinct maturity time better could allow the optimization of sowing date selection to circumvent the effects of climate change on temperature and precipitation seasonal analysis. These optimization processes aim to select cropping periods in which the growing conditions are more favorable for the development of soybeans. Crop growth models can be applied efficiently for this purpose.
Despite advances in African agriculture in recent years, the use of crop models for planning agriculture activities and estimating yield is still incipient in Mozambique. Thus, this study aims to calibrate and validate the CROPGRO-Soybean model to estimate growth, development and yield for two soybean cultivars: Tgx 1740-2F and Tgx 1908-8F, with distinct maturity periods. In addition, we evaluated the effect of future climate scenario on the soybean sowing date to determine which sowing dates would lead to high yields.

2. Materials and Methods

The database used for the calibration of genetic coefficients of the CROPGRO-Soybean model was obtained from experimental trials carried out in Angónia, Mozambique in the 2009/2010 and 2010/2011 seasons. Soil and weather data were also collected in these trials. The District of Angónia is located in the north-northeast region of the Tete Province, central Mozambique, and it has a cultivable area of 3277 km2 to agricultural due to its fertile soils.
In the present study, 12 sowing dates were simulated beginning on 1 August for a 40-year time interval (1990 to 2030). Meteorological observations and global climate models output were combined with the Decision Support System for Agrotechnology Transfer (DSSAT) [14] to identify an optimum sowing window for the study location of Mozambique. To do that, a detailed description of DSSAT can be found in [15]. The CSM-CROPGRO-Soybean is part of the modular system called the DSSAT-CSM (Decision Support System for Agrotechnology Transfer—Cropping System Model). Version 4.5 of the DSSAT-CSM (DSSAT Foundation, Prosser, Washington, USA) was used in the present study [16]. The simulations for Tgx 1740-2F and Tgx 1908-8F cultivars for a future climate scenario were based on the CORDEX (Coordinated Regional climate Downscaling Experiment)-Africa output, as the climate station into DSSAT for modeling.
The CORDEX was established by the World Climate Research Program (WCRP), aiming to develop a coordinated international framework for generating Regional Climate Model projections (RCM). The framework of climate projection in CORDEX is based on the set of new Global Climate Model (GCM) simulations currently published by the Intergovernmental Panel on Climate Change (IPCC) in its fifth assessment report, referred to as the fifth Coupled Model Intercomparison Project (CMIP5). The CORDEX uses emission scenarios (Reference Concentration Pathways—RCPs) known as RCP 4.5 and RCP 8.5, which closely correspond to the IPCC emissions scenarios SRES (Special Report on Emissions Scenarios) B1 and A1B, respectively. Ideally, all simulations of regional models must cover the period of 1951–2100, to include a period of recent history, plus all of the 21st century. Additional details about the CORDEX are given by [17].
For Africa, CORDEX delivers an unprecedented opportunity to advance the understanding of regional climate responses to global climate change, which is crucial for climate adaptation, risk assessment research and policy planning in the region.

2.1. Meteorological Data and Climate Characterization

The CROPGRO-Soybean model requires the following input data: daily maximum and minimum air temperature (°C), rainfall (mm) and solar radiation (MJ·day−1·m−2). The meteorological data were provided by the National Institute of Meteorology in Chitedze-Malawi, collected in a homogeneous climatic region close to Angónia region.
The Angónia climate is characterized by two dominant seasons: the rainy and hot season from October to April and the dry and cool season from May to September. The total rainfall is up to 180 mm/month from December to March (Figure 1a). The air temperatures in the region are influenced by altitude that varies from 700 m to 1655 m, with an average of 20.9 °C (Figure 1b, [18]).

2.2. Soil Data

The texture class and physical and chemical analyses of the soil in the experimental area are shown in Table 1.

2.3. Description of Field Trials

The field experiment was conducted at the International Institute of Tropical Agriculture (IITA), Latitude 14°32′45.1″S, Longitude 34°11′10.79″E and 1223 m of altitude, at the Ntengo Umodzi Agronomic Station in the years of 2009 and 2010. Two cultivars were evaluated: Tgx 1908-8F (medium maturity) and Tgx 1740-2F (early maturity). The choice of these cultivars is justified by the fact that both have a distinct time of physiological maturity, but the same group of maturity (8.0), so they may shed some light on the soybean cycle length response to distinct climate conditions, including water and thermal stresses.
The soybean sowing was performed on the same day (11 December) in 2009 and 2010 for both cultivars in a randomized block 9 m long and 2 m wide, with four replications. The plot consisted of four rows spaced 0.5 m with a distance between plants of 10 cm. The experiment was carried out without fertilization, since soil chemical analysis indicated that the soil had an adequate level of phosphorus and potassium for the soybean crop, and nitrogen is fixed by symbiosis. Therefore, the other management practices for weeds and insect control were realized [19]. Crop parameters such as flowering date, physiological maturity and yield have been collected during the experiment.

2.4. Parameterization and Evaluation Model

The model results have been evaluated by calculations of the agreement index (d) proposed by [20], root mean square error (RMSE) and the percentage of deviation (PD). In order to evaluate the effect of climate change and climate variability on the crop productivity, seven CORDEX models’ outputs have been used with spatial resolution of approximately 50 km (see Table 2) based on the radiative forcing scenario RCP (Representative Concentration Pathways) 4.5.
The genetic coefficients have been selected [21] to be the same group that the maturing soybean cultivars used in this study. The author determined the genetic coefficients in three cultivars, two seasons with four sowing dates, and additionally used the GLUE (Generalized Likelihood Uncertainty Estimation) methodology of DSSAT 4.5 to verify the estimation of genetic coefficients. The values of the coefficients’ genetic references were set and compared with the observed values for each treatment to verify their adjustment. The adjustment was made by increasing or decreasing the value of the coefficient determined by the trial process until concordance between the estimated and observed was achieved. The adjustment was initially performed for the expected flowering dates, then for the expected date of maturity and finally for yield components (seeds per pod, pods per m2, flowers per m2, mass pods and seeds), as recommended by [15,16].
The Representive Concentration Pathway (RCP) 4.5 is a stabilization scenario where the radiative forcing total of 4.5 W·m2 would be stabilized before 2100 by the use of a range of technologies and strategies for reducing greenhouse gas emissions. The controls of the scenario and technological options are detailed in [22]. Additional details about the simulation of land use and carbon emissions are given by [23].
Model simulations were performed for the current climate (1990–2013) and future scenario (2014–2030). To evaluate the effect of CO2 fertilization, simulations under future weather conditions were performed with fixed value of CO2 concentrations equal to 380 ppm and 500 ppm. Following [33], we assumed that technology, management practices and stress tolerance will remain the same in the future as in the present day. This is a limitation of this study, but there is no clear methodology in the literature on technological advances to be included in the model simulations. Authors of [34] have proposed a linear factor associated to the increase in observed productivity for Southern Brazil, but this cannot be applied here because there are no studies on the rate of evolution of technology as well as a hierarchy of menu adoption of technologies that establish a linear factor that can be used for our study location.

2.5. Yield Percentage Change and Determining the Seeding Window

The calculation of the percentage of change in the average yield was calculated as follows:
V s ( % ) = Y F s Y A s × 100 100
where Vs (%) is the percentage of change of the average yield for the sowing time yield s stands for a specific date, YFs is the average future yield for sowing s and YAs is the current average yield for sowing s.

3. Results and Discussion

3.1. Calibration and Evaluation of CROPGRO-Soybean Model

The genetic coefficients of both cultivars based on the field work, soil, and climate conditions of Angónia obtained from the experimental data in the 2009/2010 and 2010/2011 seasons (Table 3). The CROPGRO-Soybean model [10,11] has been tested and used for a wide variety of soybean cultivars and environmental conditions in previous studies, which demonstrated the ability of this model to capture the variability of important physiological processes [35,36,37,38]. Nevertheless, the lack of accurate experimental data may result in discrepancies between the model and observations.
Table 4 shows the statistics of the CROPGRO-Soybean results and the field experimental data. The agreement indices (d) were 0.96 (TGx 1740-2F) and 0.99 (Tgx 1908-8F), demonstrating that the model was able to reproduce the observed values.
For the validation of the modeled data, the agreement indices ranged from 0.68 to Tgx 1740-2F and 0.71 for Tgx 1908-8F, with RMSE from 11.48% to 31.13% for Tgx 1740-2F and Tgx 1908-8F, respectively.
Differences between model simulations of 2010/2011 and the field trial are associated with DSSAT modeled genetic coefficients obtained during the 2009/2010 calibration. In some modeling experiments, the factors that can substantially affect performance are accounted for accurately. However, in other field trials, not all parameters needed for a better model simulation are available, hampering a good performance. Indeed, few parameters have been measured during the 2010/2011 field experiments as compared to the 2009/2010 season, leading to limitation for simulating the dry spells response during the grain filing period in 2010/2011, in particular for Tgx 1908-8F cultivar (Table 4).
Table 5 shows that simulated and observed number of days from emergence to flowering were similar for both soybean cultivars. The estimated occurrence date of different phenological stages is a very important parameter for planning agricultural activities, while the adjusted genetic factors are essential in simulating the growth and development of soybean, and to compare of observed and simulated yield.
In the following work, an evaluation is presented based on additional datasets, namely MERRA reanalysis, CORDEX-Africa, and climate data observations to assess the reliability of these datasets to simulate the current local climate, as well as the related crop yield.
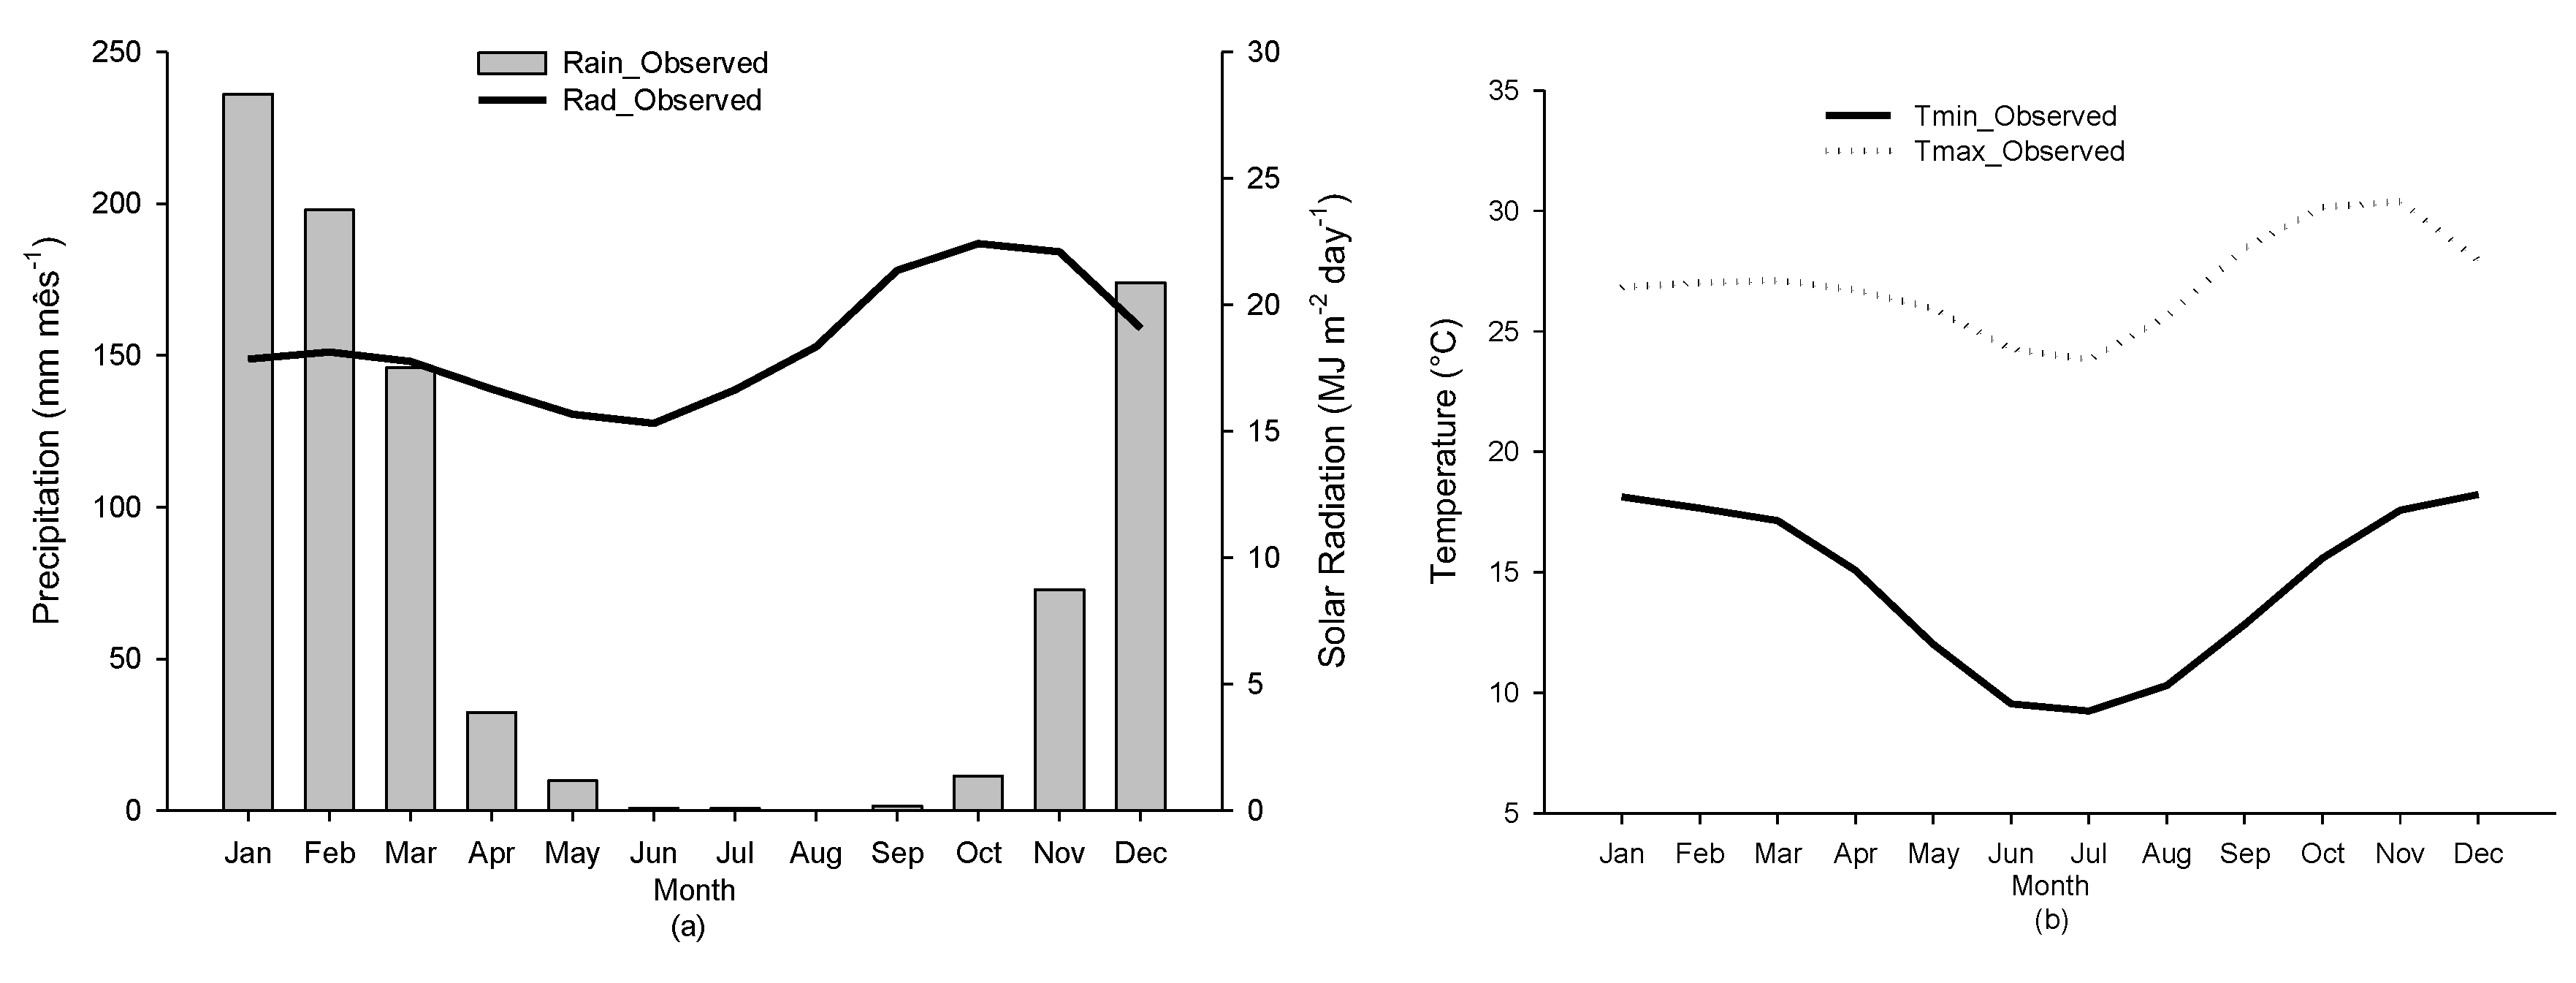
Figure 2 shows that the highest temperature value (30 °C) occurs in October/November, (Figure 2a). The coldest months are June and July, with average temperatures of 9.5 °C and 9.2 °C, respectively. Figure 2b shows the distribution of monthly precipitation in the 1980–2010 period. During the dry season, the rainfall was close to zero, while the highest value of 236 mm was recorded in January. This clearly demonstrates a strong seasonal dynamic that is characteristic of subtropical latitudes.
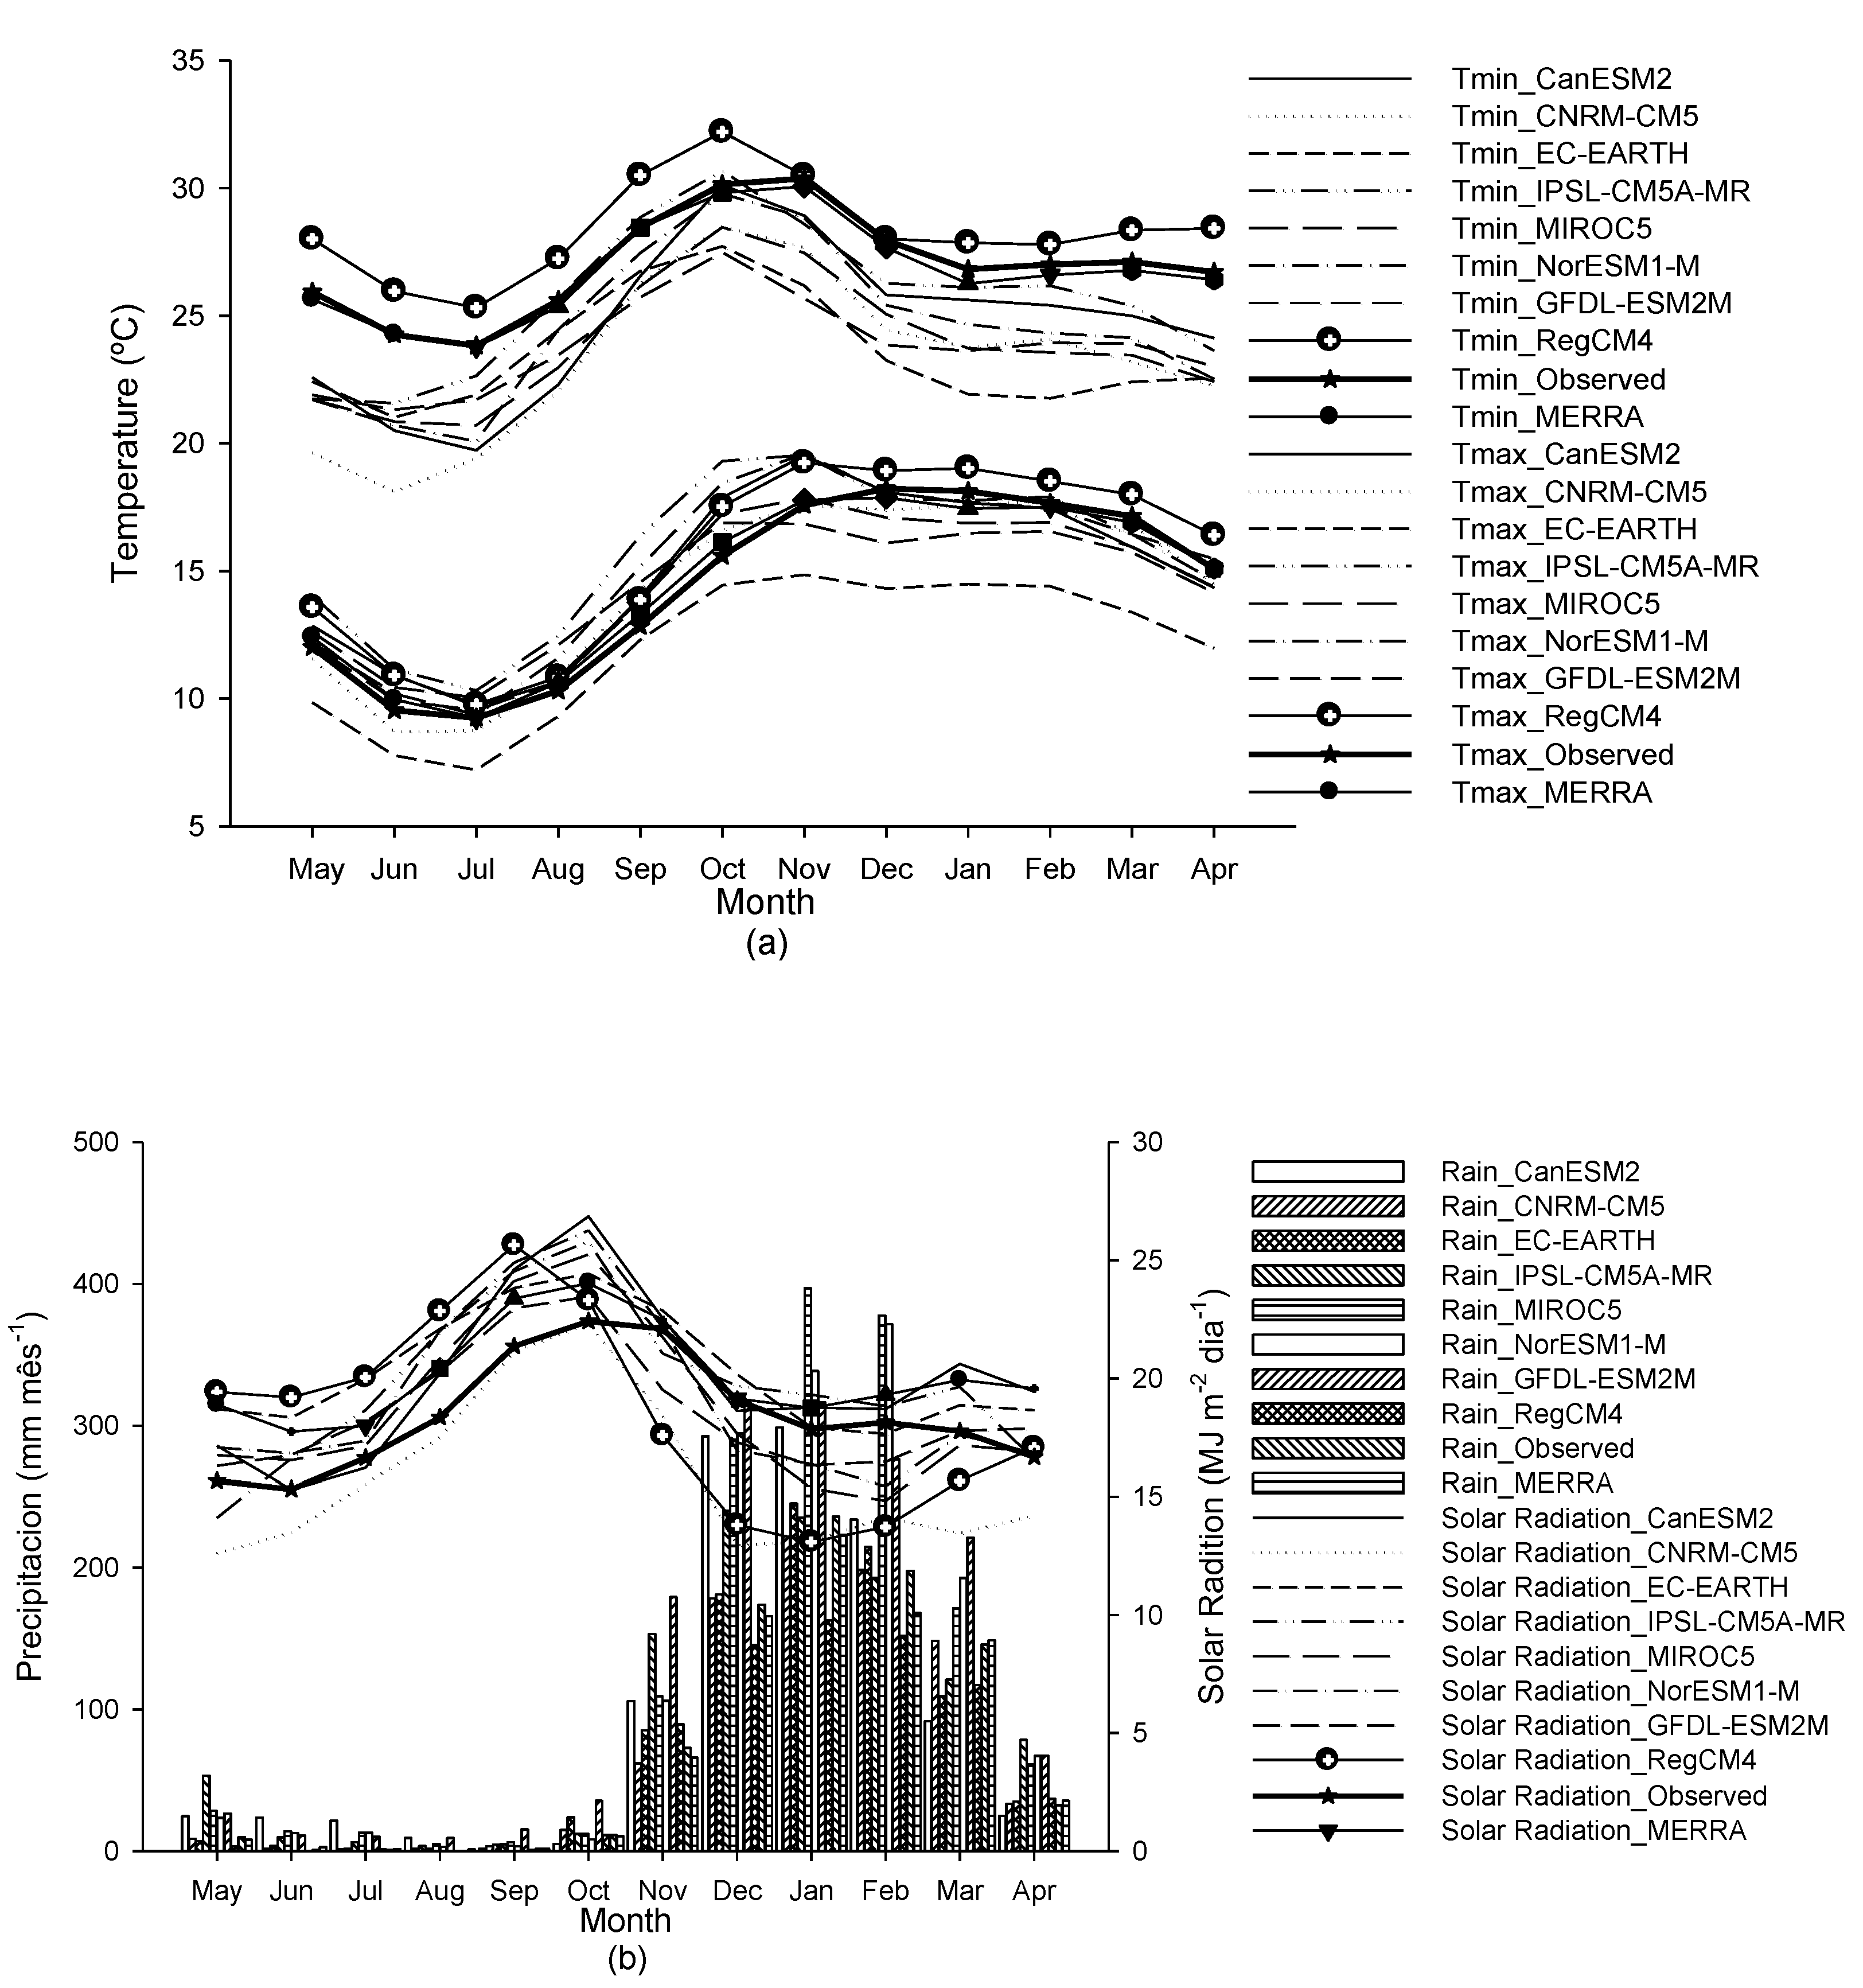
This region has a wide variation in annual rainfall of 725 mm to 1149 mm, with 90% occurring from late November to early April. The highest average values of solar radiation occurred in October and the lowest were observed in May. The MERRA and RegCM4 exhibited the smallest differences as compared to observations. The CORDEX simulations are also in agreement with observations considering the seasonal cycle and values of temperature, precipitation and radiation. Thus, they can be used to simulate initial conditions for driving the DSSAT model to evaluate the climate-crop yield relation.
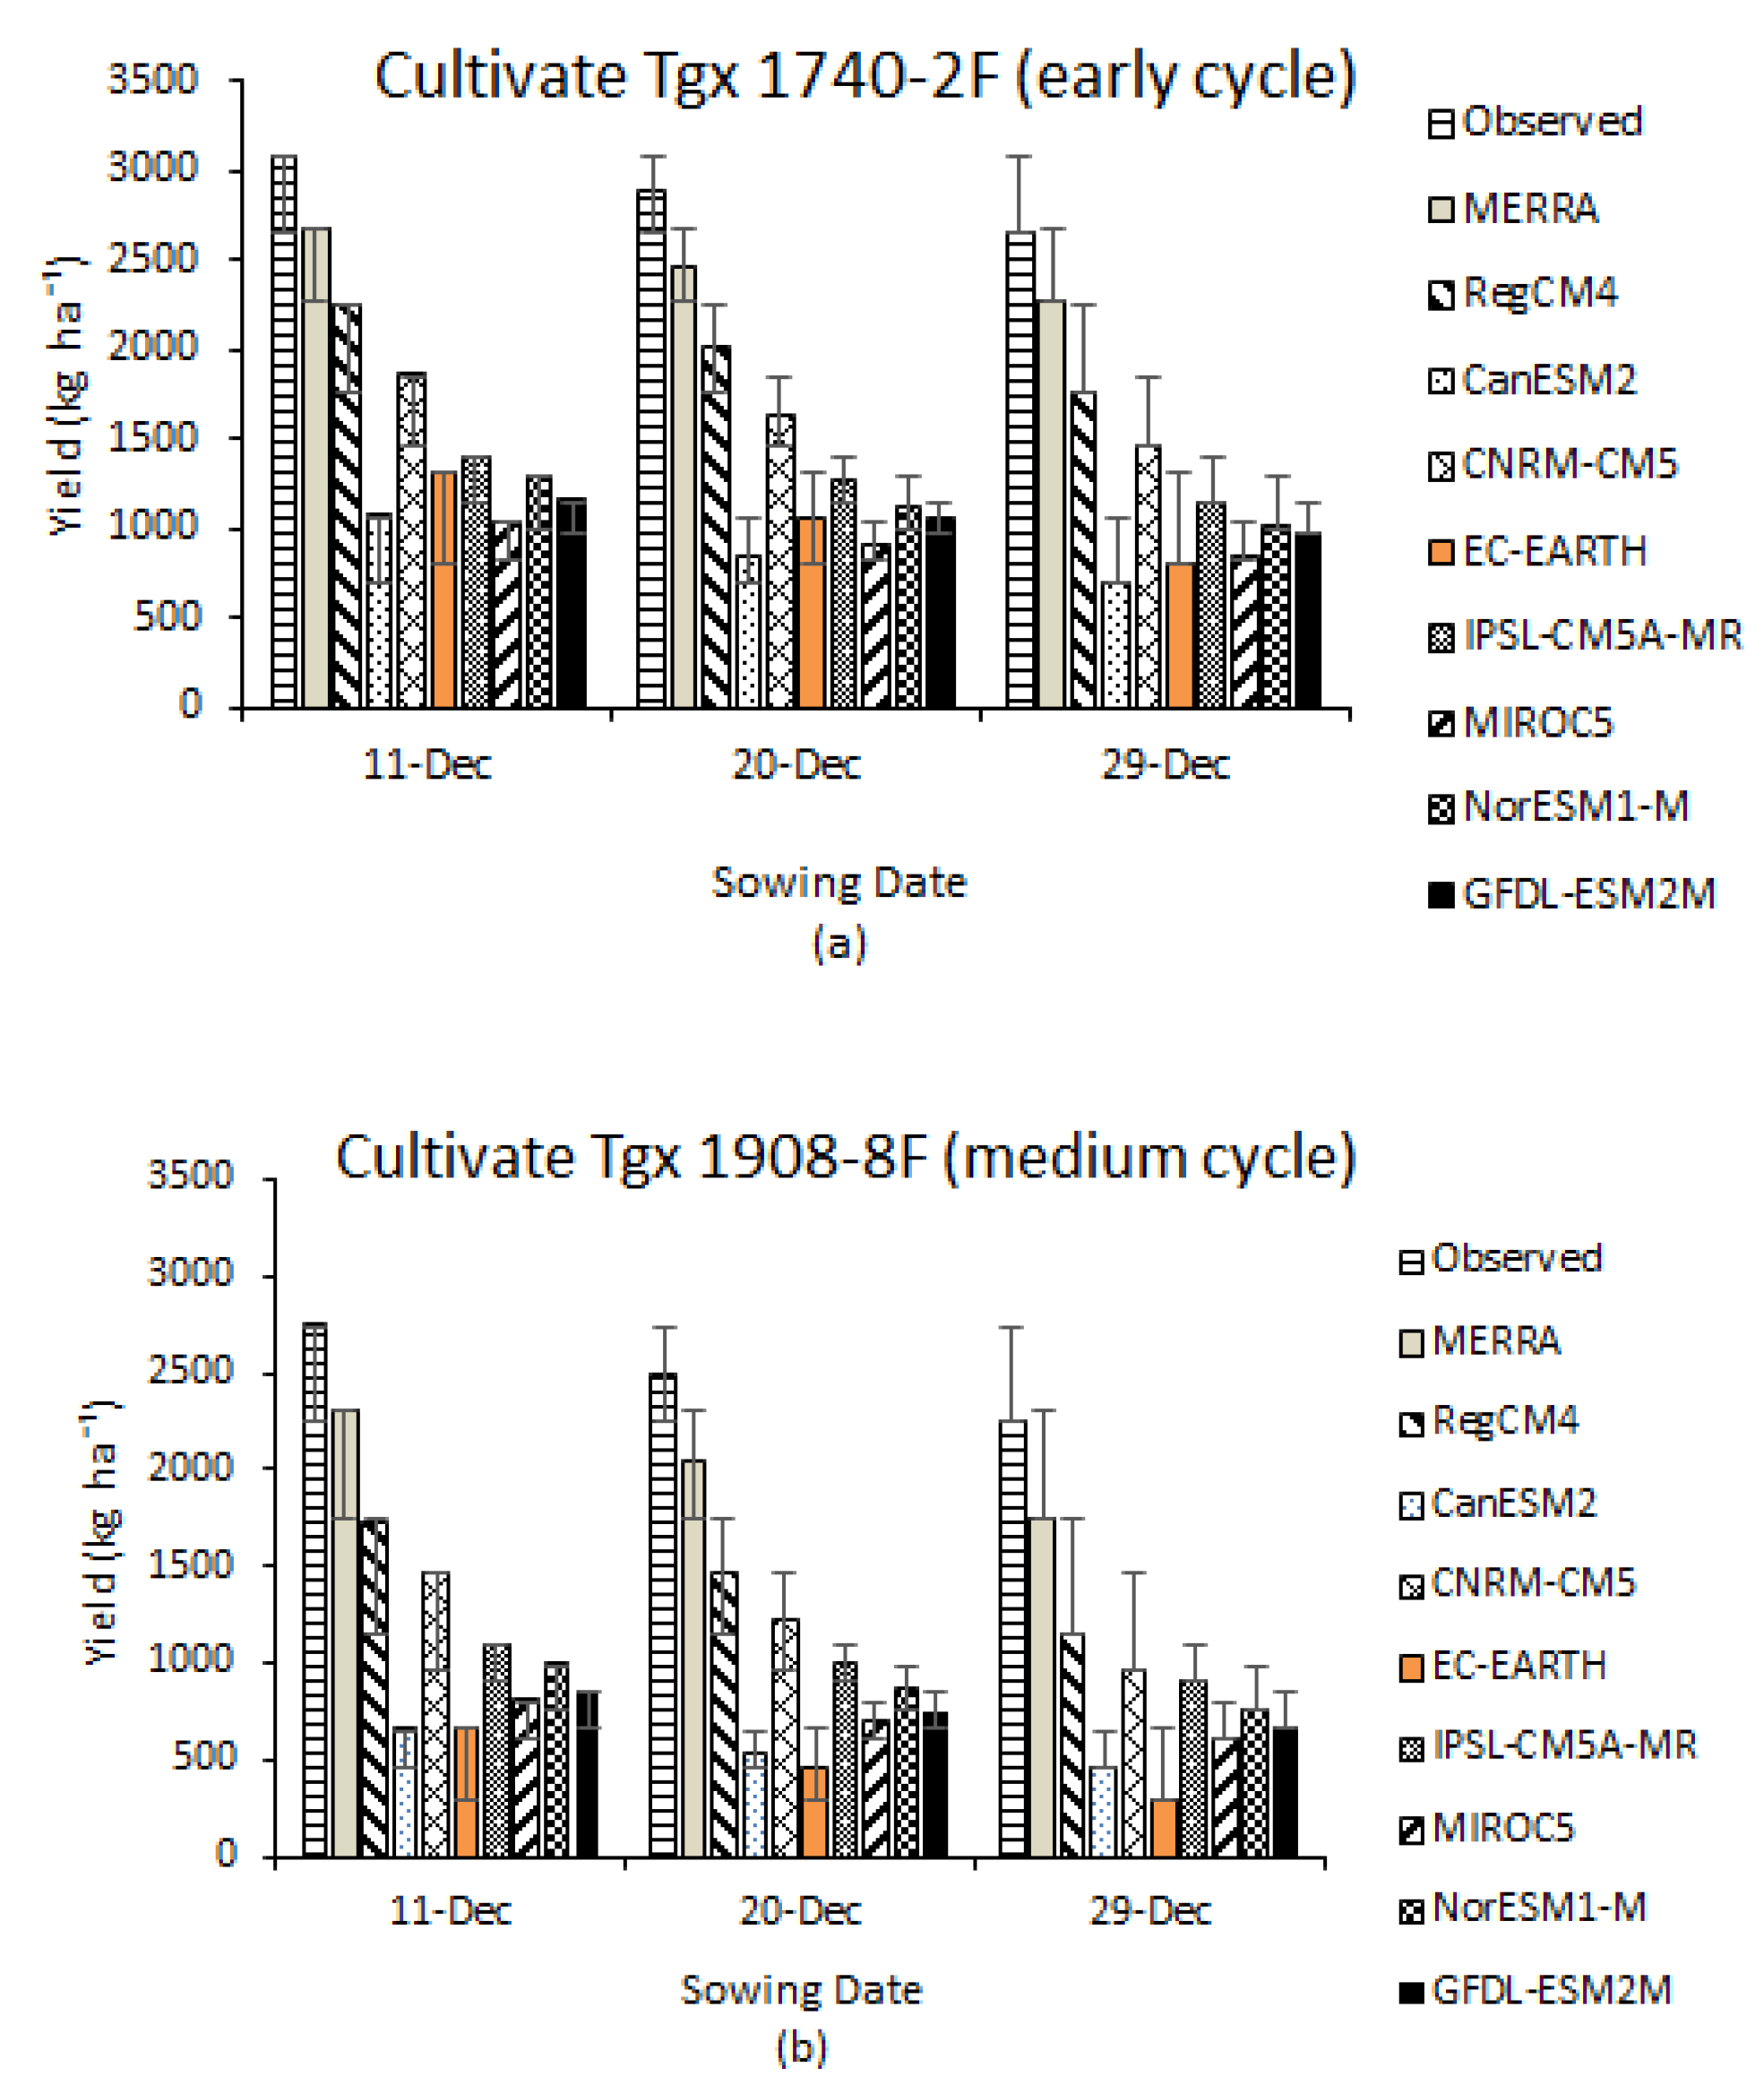
The lowest average yield occurred for the 29 December sowing date (Figure 3a,b). Increased precipitation is associated with cloudier atmosphere and subsequently weaker direct incoming solar radiation that provides the most energy absorbed by the plants. Results from MERRA reanalysis, our own observations, and based CORDEX- Africa simulations (Figure 3a,b), show a sharp drop in yield due to a reduction in solar radiation. It was also noted that, over the sowing dates, the use of DSSAT forced with a MERRA dataset demonstrated reasonable estimates of yield. For all datasets, Tgx 1740-2F (early maturity crop) delivers higher values of yield in relation to medium maturity cultivar Tgx 1908-8F (Figure 3a,b).
Based on the results from Figure 2a,b, the best sowing conditions occurred after 1 November due the favorable climatic conditions, i.e., the beginning of the rainy season and the occurrence of temperature and regimes favorable to crop germination, growth and development, consequently, to achieve elevated yield (Figure 4) with minor risk of failure by sowing in October due to the variability of rainfall observed in this month. The simulated yields for Tgx 1740-2F and Tgx 1908-8F cultivars are shown in Table 6.
Our results show that the RegCM4 and CNRM-CM5 models provided more accurate estimates of yield, while other models underestimate yield when compared to observations (Table 7). All models and MERRA underestimated the observed yield. It should be noted that the yield based on CORDEX results is not directly related to an individual forcing such as monthly changes in radiation or temperature. RegCM4 shows lower values of radiation but displays very reasonable simulated yield. We hypothesize that the modeled soybean response to simulated climate scenarios is closely related to the capability of the climate model to reproduce the daily variability of meteorological parameters, as opposed to representing accurately the monthly climatology.

3.2. Impact of Climate Change on Soybean Yields

In this section, we evaluated the potential influence of climate change on the yield of the cultivars TGX 1740-2F and TGX 1908-8F in Angónia. These simulations have been performed under two CO2 concentrations, 380 ppm and 500 ppm CO2 (2014–2030), under 12 different sowing dates for both cultivars.
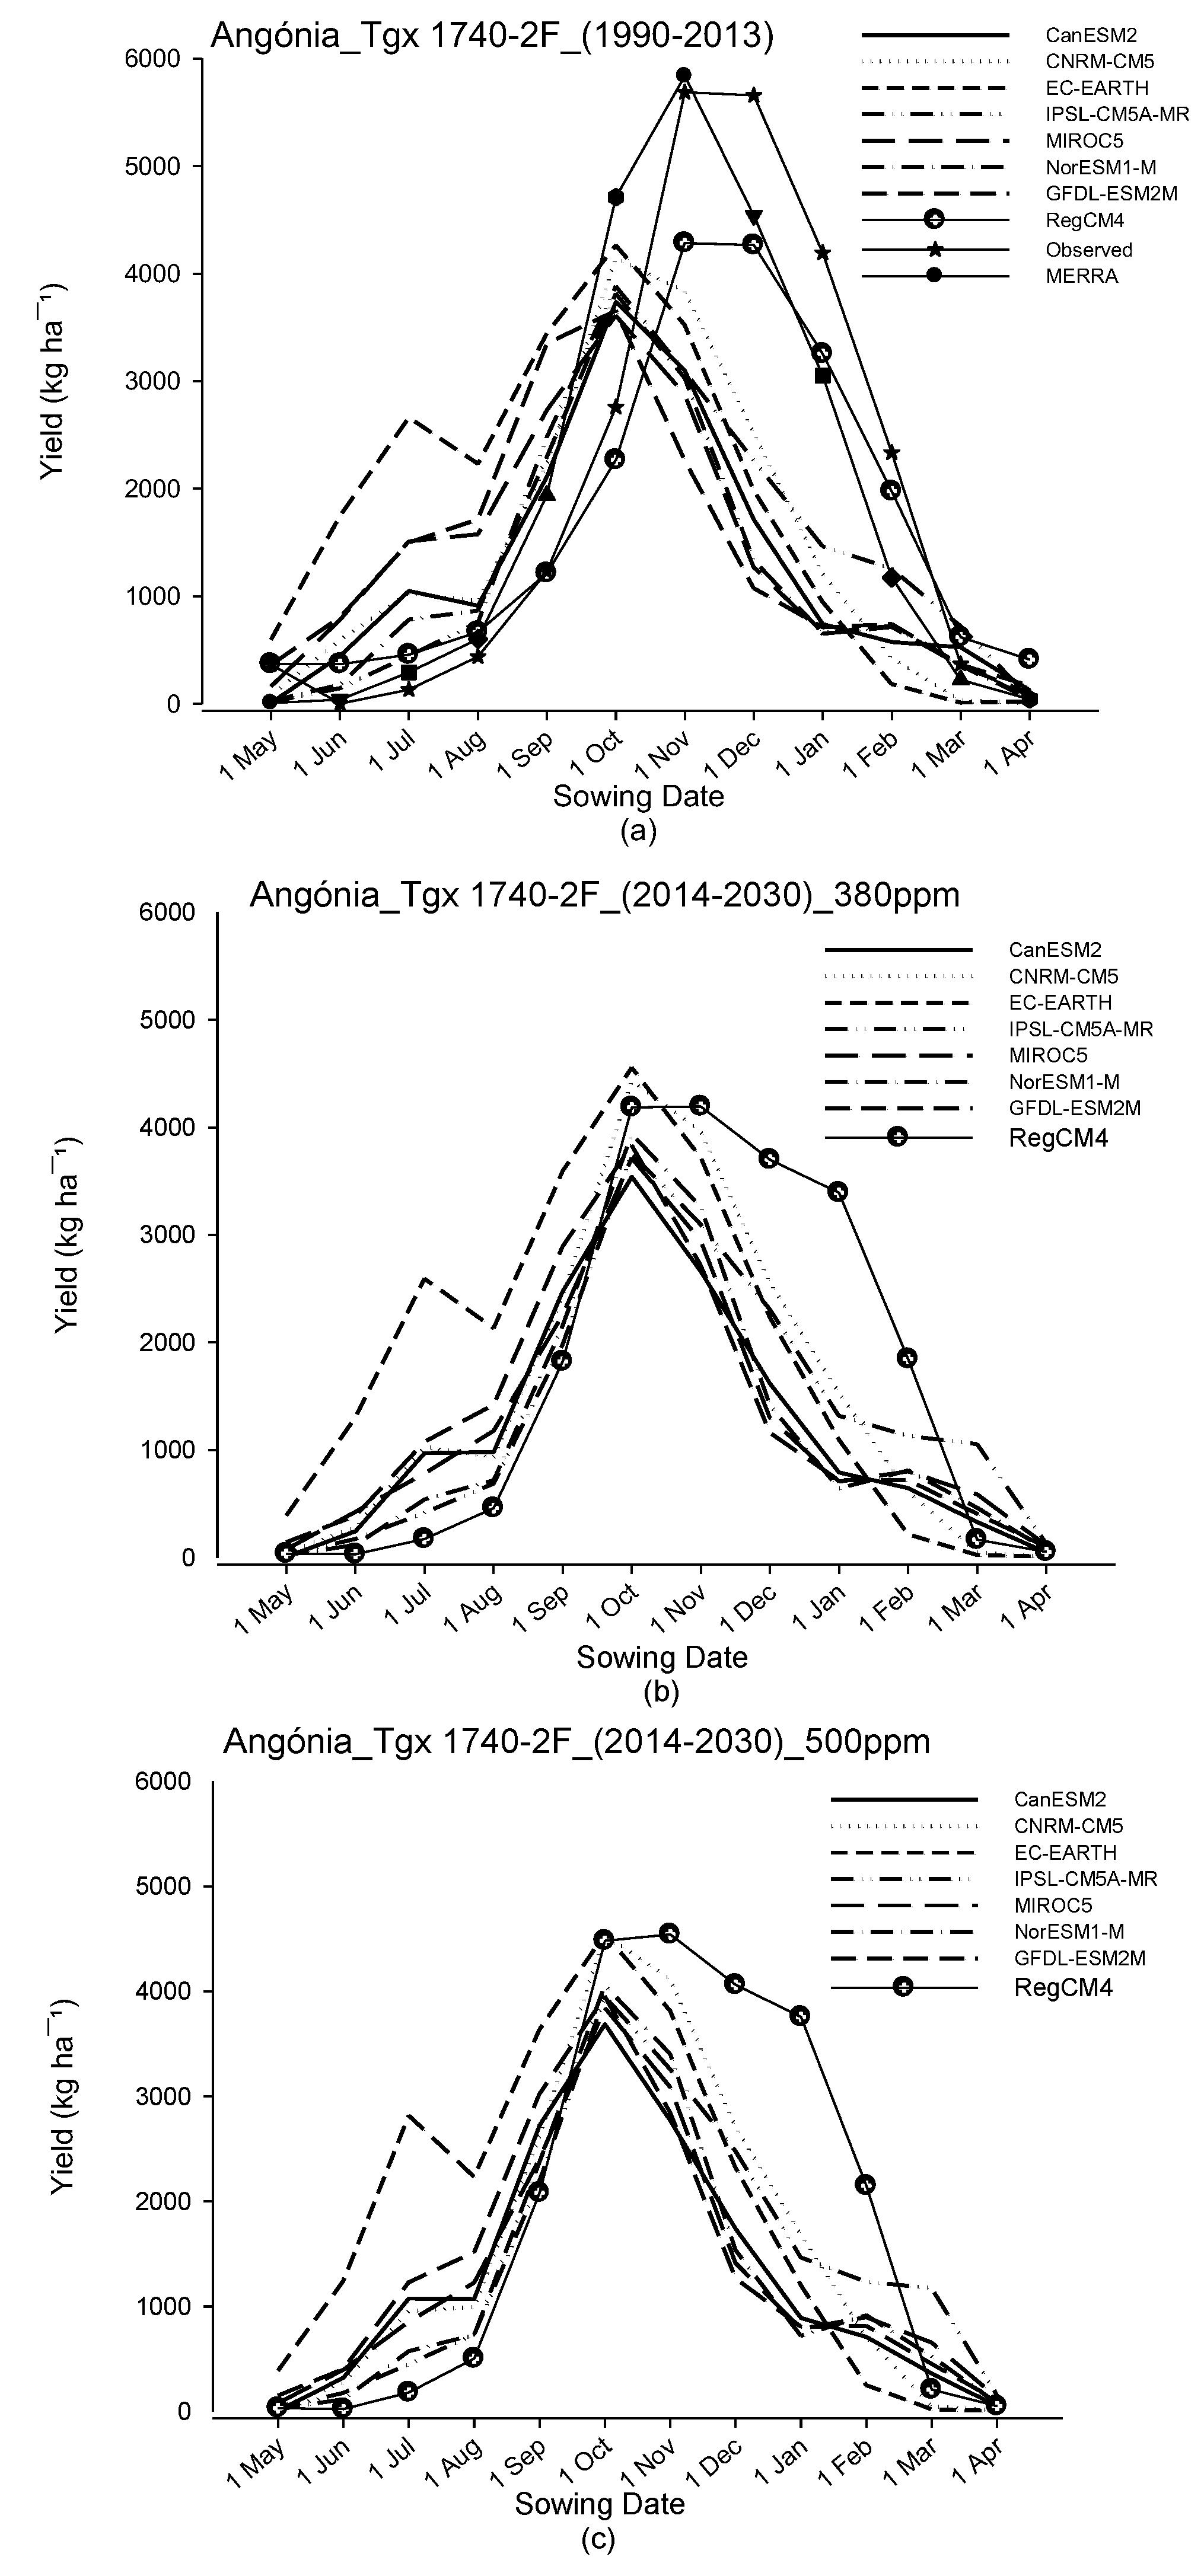
For all simulations (Figure 4), the highest yield in descending order was predicted by RegCM4, CNRM-CM5, CanESM2, IPSL-CM5A-MR, MIROC5, NorESM1-M, GFDL-ESM2M and EC-EARTH. Some models may allow earlier sowing in May such as CNRM-CM5, CanESM2 and IPSL-CM5A-MR. For present day conditions, the RegCM4 and MERRA simulated higher yield between October–December, and lower values are predicted by other CORDEX model results (Figure 4a). Drastic changes for both cultivars were not simulated when future climate conditions are implemented for both 380 and 500 ppm of CO2 concentration (Figure 4b,c). For brevity, we only show the cultivar Tgx 1740_2F. In fact, this may indicate that the increase in CO2 by 120 ppm under distinct climate forcing such as the RCP 4.5 does not result in non-linearities able to compromise the soybean productivity. Instead, it may induce increased yield as shown by [12] overcoming the weather factor.
Considering the sowing date (October–January) for the future period (Figure 4b,c and Table 8), the models indicated an increase in soybean productivity that is dependent on the CO2 concentration. This has also been found by [39]. The CanESM2 shows, however, a reduction of 5% if the predicted future CO2 concentration (500 ppm) is not taken into account. The highest productivity is predicted by RegCM4, CNRM-CM5 and CanESM2. In general, by comparing both cultivars, we concluded that the Tgx 1908-8F is more sensitive to climate and CO2 concentration changes showing higher increase in soybean yield. It is also interesting to note the high fluctuation among the models. Similar results for yield increase were found by [40,41].

4. Conclusions

Based on CROPGRO-Soybean modeling experiments, we have been able to simulate the impact of climate conditions on soybean yield in Mozambique. Several data were utilized in these simulations including climate model output and observations. Two soybean varieties were simulated from field trial experiments to allow for calibration and validation of the crop model in order to assure its reliability to predict future soybean yield.
The CROPGRO-Soybean simulations have shown distinct sensitivity of the genetic coefficients related to each of the two cultivars Tgx 1740-2F and Tgx 1908-8F. The yield increases due to increased atmospheric CO2 concentration predicted to occur in the future. In addition, higher temperature also favors higher yield as compared to current conditions. Our results indicate that Mozambique may experience gains for Tgx 1740-2F (500ppm) as high as 15.3% in the future, while for the cultivar Tgx 1908-8F (500 ppm), increases may be 11.4%. However, these increases will depend on daily meteorological variability, which greatly affects the production of biomass and grain production and, consequently, the crop yield.

Acknowledgments

This work is supported by Coordination for the Improvement of Higher Education Personnel (CAPES), the Federal University of Viçosa (UFV), the International Institute of Tropical Agriculture (IITA-Mozambique), the University Zambezi (UniZambeze), and Marine Cirino Grossi.

Author Contributions

Manuel António Dina Talacuece developed the research content and methodology, conducted data analysis and completed the writing. Flávio Barbosa Justino contributed to the overall direction and edited the paper. contributed to the methodology, content, and made corrections. Milton Edgar Pereira Flores contributed to the review, made corrections and completed analysis of the paper. Jéssica Garcia Nascimento contributed to data collection and analysis. Eduardo Alvarez Santos contributed to the review and analysis of the paper.

Conflicts of Interest

The authors declare no conflict of interest.

References

  1. Sinclair, T.R.; Marrou, H.; Soltani, A.; Vadez, V.; Chandolu, K.C. Soybean production potential in Africa. Glob. Food Secur. 2014, 3, 31–40. [Google Scholar]
  2. Information Deagro/Fiesp. World Soybean Harvest 2015/16—3rd USDA Survey; U.S. Department of Agriculture: Washington, DC, USA, 2015.
  3. Food and Agriculture Organization (FAO). Technical Compendium of Composite Flours; UN Economic Commission for Africa: Addits Ababa, Ethiopia, 2005. [Google Scholar]
  4. Abate, T.; Alene, A.D.; Bergvinson, D.; Shiferaw, B.; Silim, S.; Orr, A.; Asfaw, S. Tropical Grain Legumes in Africa and South Asia: Knowledge and Opportunities. Available online: http://www.icrisat.org/tropicallegumesII/pdfs/TropicalLegumes_20120217.pdf (accessed on 8 May 2013).
  5. International Fertilizer Development Center (IFDC). Mozambique Fertilizer Assessment; IFDC: Muscle Shoals, AL, USA, 2012. [Google Scholar]
  6. TIA. Trabalho de Inquérito Agrícola. MINAG/DE, Agriculture Surveys. Available online: http://fsg.afre.msu.edu/mozambique/caadp/pedsa_final_10out.pdf (accessed on 5 December 2013).
  7. CAP. Census of Agriculture and Livestock, MINAG 2009/2010. Available online: http://www.fao.org/fileadmin/templates/ess/ess_test_folder/World_Census_Agriculture/Country_info_2010/Reports/Methodology_4/MOZ_POR_MET_2009_2010.pdf (accessed on 20 October 2015).
  8. Pereira, L.; Yan, I. Participação da TechnoServe Moçambique no VI Congresso Brasileiro de Soja—Em Cuiabá/Mato Grosso. Available online: https://www.n2africa.org/sites/n2africa.org/files/images/images/%5BSoy%5D%5B2012%5D%20Boletim%20Soja%209.pdf (accessed on 10 May 2013).
  9. Lobell, D.B.; Field, C.B. Global scale climate—Crop yield relationships and the impacts of recent warming. Environ. Res. Lett. 2007, 2. [Google Scholar] [CrossRef]
  10. Boote, K.J.; Jones, J.W.; Hoogenboom, G. Simulation of crop growth: CROPGRO model. In Agricultural Systems Modeling and Simulation; Peart, R.M., Curry, R.B., Eds.; Marcel Dekker: New York, NY, USA, 1998; pp. 651–692. [Google Scholar]
  11. Boote, K.J.; Jones, J.W.; Hoogenboom, G.; Pickering, N.B. The CROPGRO model for grain legumes. In Understanding Options for Agricultural Production; Tsuji, G.Y., Hoogenboom, G., Thornton, P.K., Eds.; Springer: Dordrecht, The Netherlands, 1998; pp. 99–128. [Google Scholar]
  12. Justino, F.; Oliveira, E.C.; Rodrigues, R.A.; Goncalves, P.H.L.; Souza, P.J.O.P.; Stordal, F.; Marengo, J.A.; Silva, T.G.; Delgado, R.C.; Lindemann, D.S.; et al. Mean and interannual variability of maize and soybean in Brazil under global warming conditions. Am. J. Clim. Chang. 2013, 2, 237–253. [Google Scholar]
  13. Adhikari, U.; Nejadhashemi, A.P.; Woznicki, S.A. Climate change and eastern Africa: A review of impact on major crops. Food Energy Secur. 2015, 4, 110–132. [Google Scholar] [CrossRef]
  14. ICASA—International Consortium for Agricultural Systems Applications. 2007. Available online: http://icasa.net (accessed on 10 September 2010).
  15. Jones, J.W.; Hoogenboomb, G.; Portera, C.H.; Bootea, K.J.; Batchelorc, W.D.; Huntd, L.A.; Wilkense, P.W.; Singhe, U.; Gijsmana, A.J.; Ritchie, J.T. The dssat cropping system model. Eur. J. Agron. 2003, 18, 235–265. [Google Scholar] [CrossRef]
  16. Hoogenboom, G.; Jones, J.W.; Wilkens, P.W.; Porter, C.H.; Boote, K.J.; Hunt, L.A.; Singh, U.; Lizaso, J.L.; White, J.W.; Uryasev, O.; et al. Decision Support System for Agrotechnology Transfer (DSSAT) Version 4.5 [CD-ROM]; University of Hawaii: Honolulu, HI, USA, 2010; p. 130. [Google Scholar]
  17. Giorgi, F.; Jones, C.; Asrar, G. Addressing climate information needs at the regional level: The CORDEX framework. WMO Bull. 2009, 58, 175–183. [Google Scholar]
  18. Ministry of State Administration—MAE. Profile Angónia District, Tete Province. 2005. Available online: http://www.portaldogoverno.gov.mz/Informacao/distritos/tete/Angonia.pdf (accessed on 4 May 2013). [Google Scholar]
  19. PNISA—National Agriculture Investment Plan 2014–2018. Available online: http://www.resakss.org/sites/default/files/pdfs/Final%20PNISA%20Revised%20Version_0.pdf (accessed on 14 May 2016).
  20. Willmott, C.J.; Ackleson, S.G.; Davis, J.J.; Feddema, K.M.; Klink, D.R. Statistics for the evaluation and comparison of models. J. Geophys. Res. Ott. 1985, 90, 8995–9005. [Google Scholar] [CrossRef]
  21. Rodrigues, R.A.; Pedrini, J.E.; Fraisse, C.W.; Fernandes, J.M.C.; Justino, F.B.; Heinemann, A.B.; Costa, L.C.; Vale, F.X.R. Utilization of the cropgro-soybean model to estimate yield loss caused by Asian rust in cultivars with different cycle. Bragantia Camp. 2012, 71, 308–317. [Google Scholar] [CrossRef]
  22. Clarke, L.; Edmonds, J.; Jacoby, H.; Pitcher, H.; Reilly, J.; Richels, R. Scenarios of Greenhouse Gas Emissions and Atmospheric Concentrations; Department of Energy, Office of Biological & Environmental Research: Washington, DC, USA, 2007; p. 154. [Google Scholar]
  23. Wise, M.A.; Calvin, K.V.; Thomson, A.M.; Clarke, L.E.; Bond-Lamberty, B.; Sands, R.D.; Smith, S.J.; Janetos, A.C.; Edmonds, J.A. Implicações da Limitação de concentrações de CO2 para Uso da Terra e Energia. Science 2009, 324, 1183–1186. [Google Scholar] [CrossRef] [PubMed]
  24. Arora, V.K.; Scinocca, J.F.; Boer, G.J.; Christian, J.R.; Denman, K.L.; Flato, G.M.; Kharin, V.V.; Lee, W.G.; Merryfield, W.J. Carbon emission limits required to satisfy future representative concentration pathways of greenhouse gases. Geophys. Res. Lett. 2011, 38. [Google Scholar] [CrossRef]
  25. Voldoire, A.; Sanchez-Gomez, E.; Mélia, D.S.y.; Decharme, B.; Cassou, C.; Sénési, S.; Valcke, S.; Beau, I.; Alias, A.; Chevallier, M.; et al. The CNRM-CM5.1 global climate model: Description and basic evaluation. Clim. Dyn. 2013, 40, 2091–2121. [Google Scholar] [CrossRef]
  26. Hazeleger, W.; Severijns, C.; Semmler, T.; Ştefănescu, S.; Yang, S.; Wang, X.; Wyser, K.; Dutra, E.; Baldasano, J.M.; Bintanja, R.; et al. EC-Earth: A seamless Earth system prediction approach in action. Bull. Am. Meteorol. Soc. 2010, 91, 1357–1363. [Google Scholar] [CrossRef]
  27. Dufresne, J.-L.; Foujols, M.-A.; Denvil, S.; Caubel, A.; Marti, O.; Aumont, O.; Balkanski, Y.; Bekki, S.; Bellenger, H.; Benshila, R.; et al. Climate change projections using the IPSL-CM5 Earth System Model: From CMIP3 to CMIP5. Clim. Dyn. 2013, 40, 2123–2165. [Google Scholar] [CrossRef]
  28. Watanabe, M.; Suzuki, T.; O’ishi, R.; Komuro, Y.; Watanabe, S.; Emori, S.; Takemura, T.; Chikira, M.; Ogura, T.; Sekiguchi, M.; et al. Improved climate simulation by MIROC5: Mean states, variability, and climate sensitivity. J. Clim. 2010, 23, 6312–6335. [Google Scholar] [CrossRef]
  29. Zhang, Z.S.; Nisancioglu, K.; Bentsen, M.; Tjiputra, J.; Bethke, I.; Yan, Q.; Risebrobakken, B.; Andersson, C.; Jansen, E. Pre-industrial and mid-Pliocene simulations with NorESM-L. Geosci. Model Dev. 2012, 5, 523–533. [Google Scholar] [CrossRef] [Green Version]
  30. Donner, L.J.; Wyman, B.L.; Hemler, R.S.; Horowitz, L.W.; Ming, Y.; Zhao, M.; Golaz, J.; Ginoux, P.; Lin, S.-J.; Schwarzkopf, M.D.; et al. The dynamical core, physical parameterizations, and basic simulation characteristics of the atmospheric component AM3 of the GFDL global coupled model CM3. J. Clim. 2011, 24, 3484–3519. [Google Scholar] [CrossRef]
  31. Giorgi, F.; Coppola, E.; Solmon, F.; Mariotti, L.; Sylla, M.B.; Bi, X.; Elguindi, N.; Diro, G.T.; Nair, V.; Giuliani, G.; et al. RegCM4: Model description and preliminary tests over multiple CORDEX domains. Clim. Res. 2012, 52, 7–29. [Google Scholar] [CrossRef]
  32. Rienecker, M.M.; Suarez, M.J.; Gelaro, R.; Todling, R.; Bacmeister, J.; Liu, E.; Bosilovich, M.G.; Schubert, S.D.; Takacs, L.; Kim, G.-K.; et al. MERRA: NASA’s Modern-Era retrospective analysis for research and applications. J. Clim. 2011, 24, 3624–3648. [Google Scholar] [CrossRef]
  33. Grossi, M.C.; Justino, F.; Andrade, C.L.T.; Santos, E.A.; Rodrigues, R.A.; Costa, L.C. Modeling the impact of global warming on the sorghum sowing window in distinct climates in Brazil. Eur. J. Agron. 2013, 51, 53–64. [Google Scholar] [CrossRef]
  34. Costa, L.C.; Justino, F.; Oliveira L, J.C.; Sediyama, G.C.; Ferreira, W.P.M.; Lemos, C.F. Potential forcing of CO2, technology and climate changes in maize (Zea mays) and bean (Phaseolus vulgaris) yield in southeast Brazil Environ. Res. Lett. 2009, 4. [Google Scholar] [CrossRef]
  35. Colson, J.; Bouniols, A.; Jones, J.W. Soybean reproductive development: Adapting a model for European cultivars. Agron. J. 1995, 87, 1129–1139. [Google Scholar] [CrossRef]
  36. Ruiz-Nogueira, B.; Boote, K.J.; Sau, F. Calibration and use of CROPGRO-Soybean model for improving soybean management under rainfed conditions in Galicia, Northwest Spain. Agric. Syst. 2001, 68, 151–173. [Google Scholar] [CrossRef]
  37. Calvinõ, P.A.; Sadras, V.O.; Andrade, F.H. Development, growth and yield of late-sown soybeans in the southern Pampas. Eur. J. Agron. 2003, 19, 265–275. [Google Scholar] [CrossRef]
  38. Carbone, G.J.; Mearns, L.O.; Mavromatis, T.; Sadler, E.J.; Stooksbury, D. Evaluating CROPGRO-soybean performance for use in climate impact studies. Agron. J. 2003, 95, 537–544. [Google Scholar] [CrossRef]
  39. Grassini, P.; Torrion, J.A.; Yang, H.S.; Rees, J.; Andersen, D.; Cassman, K.G.; Specht, J.E. Soybean yield gaps and water productivity in the western U.S. Corn Belt. Field Crops Res. 2015, 179, 150–163. [Google Scholar] [CrossRef]
  40. Hao, X.; Ji, G.; Xue, H.; Zhanyun, M.; Andrew, M.; Hui, J.; Li, P.; Wanshen, Y.Z.G.; Lin, E. Effects of open-air elevated atmospheric CO2 concentration on yield quality of soybean (Glycine max (L.) Merr). Agric. Ecosyst. Environ. 2014, 192, 80–84. [Google Scholar] [CrossRef]
  41. Li, D.; Liu, H.; Yunzhou, Q.; Youning, W.Z.C.; Dong, B.; Changhai, S.; Yueyan, L.; Xia, L.; Liu, M. Effects of elevated CO2 on the growth, seed yield, and water use efficiency of soybean (Glycine max (L.) Merr.) Under drought stress. Agric. Water Manag. 2013, 129, 105–112. [Google Scholar] [CrossRef]
Figure 1. (a) average monthly rainfall and solar radiation; (b) maximum and minimum temperature observed (1980–2010).
Climate 04 00031 g001
Figure 2. (a) monthly maximum and minimum average temperatures and (b) monthly averaged precipitation and solar radiation in Angónia, Mozambique, for the period 1980–2010 for CORDEX models, MERRA reanalysis, and observations, and for 1990–2010 estimated by the RegCM4.
Climate 04 00031 g002
Figure 3. Simulated yield productivity values, (a) for Tgx 1740-2F and (b) Tgx 1908-8F cultivars in the period 1980–2010 for CORDEX models, MERRA reanalysis, observations and for 1990–2010 estimated by the RegCM4 (Regional Climate Model).
Climate 04 00031 g003
Figure 4. Ensemble average values yield for soybean cultivars: Tgx 1740-2F to Angónia, (climatic estimated data RegCM4, CanESM2, CNRM-CM5, EC-EARTH, IPSL-CM5A-MR, MIROC5, NorESM1-M and GFDL-ESM2M): (a) in the period from 1990 to 2013, (b) in the period from 2014–2030 (380 ppm CO2), (c) in the period from 2014–2030 (500 ppm CO2).
Climate 04 00031 g004
Table 1. Chemical and physical properties of the soil at the experimental site in Angónia, Tete.
Depth (cm)OC %OM %N Total %Available P (mg/kg)Physical CharacteristicsTexture
% Sand% Silt% Clay
051.252.20.00988272746Clay
101.522.60.01190302743Clay
151.402.40.01280272746Clay
201.522.60.01085273043Clay
251.743.00.01186431344Clay
301.252.20.01083273043Clay
OC—Organic Carbon, N—Nitrogen, OM—Organic Matter and P—Phosphorus.
Table 2. Climate models evaluated in this study and their attributes.
ModelCenterCountryReference
CanESM2 (1)Canadian Centre for Climate Modeling and Analysis (CCCma (2))Canada[24]
CNRM-CM5 (3)Centre National de Recherches Meteorologiques (CNRM-CERFACS (4))France[25]
EC-EARTH (5)Royal Netherlands Meteorological Institute—ICHEC (6)The Netherlands[26]
IPSL-CM5A-MR (7)Institute Pierre-Simon Laplace (IPSL)France[27]
MIROC5 (8)Atmosphere and Ocean Research Institute (The University of Tokyo), National Institute for Environmental Studies, and Japan Agency for Marine-Earth Science and Technology—MIROCJapan[28]
NorESM1-M (9)Norwegian Climate Centre (NCC)Norway[29]
GFDL-ESM2M (10)NOAA (11)/Geophysical Fluid Dynamics LaboratoryUSA[30]
RegCM4 (12)International Centre for Theoretical Physics (ICTP)Italy[31]
MERRA (13)NCAR/UCAR (14)USA[32]
Where: (1) CanESM2: Canadian Earth System Model version 2; (2) CCCma: Canadian Centre for Climate Modeling and Analysis; (3) CNRM-CM5: Centre National de Recherches Météorologiques—Climate Model; (4) CERFACS: Centre Européen de Recherche et de Formation Avancée en Calcul Scientifique; (5) EC-EARTH: a European Earth System Model, based European Centre for Medium-Range Weather Forecasts (ECWMF); (6) ICHEC: Irish Centre for High End Computing; (7) IPSL-CM5A-MR: Institute Pierre-Simon Laplace—Climate Model—Medium Resolution; (8) MIROC5: Model for Interdisciplinary Research on Climate; (9) NorESM1-M: Norwegian Earth System Model; (10) GFDL-ESM2M: Geophysical Fluid Dynamics Laboratory—Earth System Model level based using Modular Ocean Model (MOM); (11) NOAA: National Oceanic and Atmospheric Administration; (12) RegCM4: Regional Climatic Model; (13) MERRA: Modern Era Retrospective-Analysis for Research and Applications; (14) NCAR/UCAR: National Center for Atmospheric Research—University Corporation for Atmospheric Research.
Table 3. Genetic coefficients used for the CROPGRO-Soybean model, calibrated for cultivars planted in Angónia, Tete, in 2009/2010 grown season.
Genetic CoefficientsUnitCultivar
Tgx 1740-2FTgx 1908-8F
CSDL (1)Hours12.3312.25
PPSEN (2)1/h0.3200.330
EM-FL (3)Photothermal Days31.939.0
FL-SH (4)Photothermal Days10.09.20
FL-SD (5)Photothermal Days15.916.9
SD-PM (6)Photothermal Days37.6037.20
FL-LF (7)Photothermal Days19.0018.00
LFMAX (8)Rate1.0001.030
SLVAR (9)cm2355.0375.0
SIZLF (10)cm2170.0190.0
XFRT (11)Proportion1.0001.000
WTPSD (12)Grams0.1700.158
SFDUR (13)Photothermal Days24.021.5
SDPDV (14)Photothermal Days2.001.90
PODUR (15)Photothermal Days10.8010.40
CROPGRO-Soybean = Crop Model to Soybean culture of the Decision Support System for Agrotechnology Transfer (DSSAT). Where: (1) CSDL: Critical Short Day Length below which reproductive development progresses with no daylength effect (for shortday plants) (hour); (2) PPSEN: Slope of the relative response of development to photoperiod with time (positive for shortday plants) (1/h); (3) EM-FL: Time between plant emergence and flower appearance (R1) (photothermal days); (4) FL-SH: Time between first flower and first pod (R3) (photothermal days); (5) FL-SD: Time between first flower and first seed (R5) (photothermal days); (6) SD-PM: Time between first seed (R5) and physiological maturity (R7) (photothermal days); (7) FL-LF: Time between first flower (R1) and end of leaf expansion (photothermal days); (8) LFMAX: Maximum leaf photosynthesis rate at 30 °C, 350 vpm CO2, and high light (mg CO2/m2-s); (9) SLAVR: Specific leaf area of cultivar under standard growth conditions (cm2/g); (10) SIZLF: Maximum size of full leaf (three leaflets) (cm2); (11) XFRT: Maximum fraction of daily growth that is partitioned to seed + shell; (12) WTPSD: Maximum weight per seed (g); (13) SFDUR: Seed filling duration for pod cohort at standard growth conditions (photothermal days); (14) SDPDV: Average seed per pod under standard growing conditions; (15) PODUR: Time required for cultivar to reach final pod load under optimal conditions (photothermal days).
Table 4. Average values of observed and simulated yields by the CROPGRO-Soybean model for Tgx 1740-2F and Tgx 1908-8F soybean cultivars for the 2009/2010 and 2010/2011 seasons in Angónia, Tete Province, Mozambique.
CultivarVariablesSeasonObservedSimulatedPD %RMSE %d
Tgx 1740-2F (earry cycle)Yield (kg·ha−1)09/1042554090−3.8811.480.68
Yield (kg·ha−1)10/113199378118.19
Tgx 1908-8F (mid cycle)Yield (kg·ha−1)09/1044404298−3.2031.130.71
Yield (kg·ha−1)10/112061348569.09
PD—Percentage of deviation, RMSE—Root mean square error and d—agreement index.
Table 5. Average values of observed and simulated yields with CSM-CROPGRO-Soybean for Tgx 1740-2F and Tgx 1908-8F cultivars—sown in the harvest of 2009/2010 in Angónia, Tete Province, Mozambique.
CultivateVariablesUnitObservedSimulatedPD (%)d
Tgx 1740-2F (early cycle)FloweringDays5148−3.880.96
MaturationDays110112
Yieldkg·ha−142554090
Tgx 1908-8F (mid-cycle)FloweringDays6362−3.200.99
MaturationDays129132
Yieldkg·ha−144404298
PD—Percentage of Deviation and d—agreement index.
Table 6. Simulated average yield productivity values, for Tgx 1740-2F and Tgx 1908-8F cultivars in the 1980–2010 to the CORDEX model, MERRA reanalysis and observed data.
Meteorological DataYield Productivity (kg·ha−1)
Tgx 1740-2FTgx 1908-8F
Observed30762745
MERRA (1)26732306
RegCM4 (2)22491733
CNRM-CM5 (3)18581469
IPSL-CM5A-MR (4)14041089
EC-EARTH (5)1305663
NorESM1-M (6)1296993
GFDL-ESM2M (7)1154855
CanESM2 (8)1073657
MIROC5 (9)1041806
Where: (1) MERRA: Modern Era Retrospective-Analysis for Research and Applications; (2) RegCM4: Regional Climatic Model; (3) CNRM-CM5: Centre National de Recherches Météorologiques—Climate Model; (4) IPSL-CM5A-MR: Institute Pierre-Simon Laplace—Climate Model- Medium Resolution; (5) EC-EARTH: a European Earth System Model, based European Centre for Medium-Range Weather Forecasts (ECWMF); (6) NorESM1-M: Norwegian Earth System Model; (7) GFDL-ESM2M: Geophysical Fluid Dynamics Laboratory—Earth System Model level based using Modular Ocean Model (MOM); (8) CanESM2: Canadian Earth System Model version 2; (9) MIROC5: Model for Interdisciplinary Research on Climate.
Table 7. Statistical parameters for the relationship between observed and modeled soybean yield using Tgx 1740-2F and Tgx 1908-8F RegCM4 data 1990–2010, MERRA 1980–2010, CORDEX-Africa 1980–2010 and the meteorological observed dates of 1980–2010 used to compared with the models.
ModelTgx 1740-2FTgx 1908-8F
MB a (kg·ha−1)RMSE b (kg·ha−1)d cr2 dMB a (kg·ha−1)RMSE b (kg·ha−1)d cr2 d
MERRA−410.7411.10.820.99−473.1474.30.810.99
RegCM4−867.3867.80.760.99−1050.91051.80.740.99
CanESM2−2004.92005.30.710.99−1949.61953.10.720.99
CNRM-CM5−1226.81227.20.730.99−1283.41283.50.740.99
EC-EARTH−1825.81826.30.710.98−20312031.50.710.95
IPSL-CM5-MR−1605.21606.70.720.99−1501.41506.70.730.99
MIROC5−1951.31953.60.710.99−1796.91800.80.720.99
NorESM1-M−1736.917380.720.99−1630.21633.50.720.99
GFDL-ESM2M−1821.71824.30.710.99−1738.81743.40.720.99
a Average bias; b Root mean square error; c Agreement index; d Coefficient of determination. For the best efficiency in the simulation of observed data, these models were used in future simulations (submitted in response).
Table 8. Percentage change in productivity of the cultivar Tgx 1740-2F and Tgx 1908-8F for the 2014–2030 period compared to 1990–2013.
ModelTgx 1740-2F Vs (%)Tgx 1908-8F Vs (%)
380 ppm500 ppm380 ppm500 ppm
CanESM2−52−71
CNRM-CM510161928
EC-EARTH10151623
IPSL-CM5A-MR−34−44
MIROC5412413
NorESM1-M411414
GFDL-ESM2M8161019
RegCM46151020

