2.1. Research Area
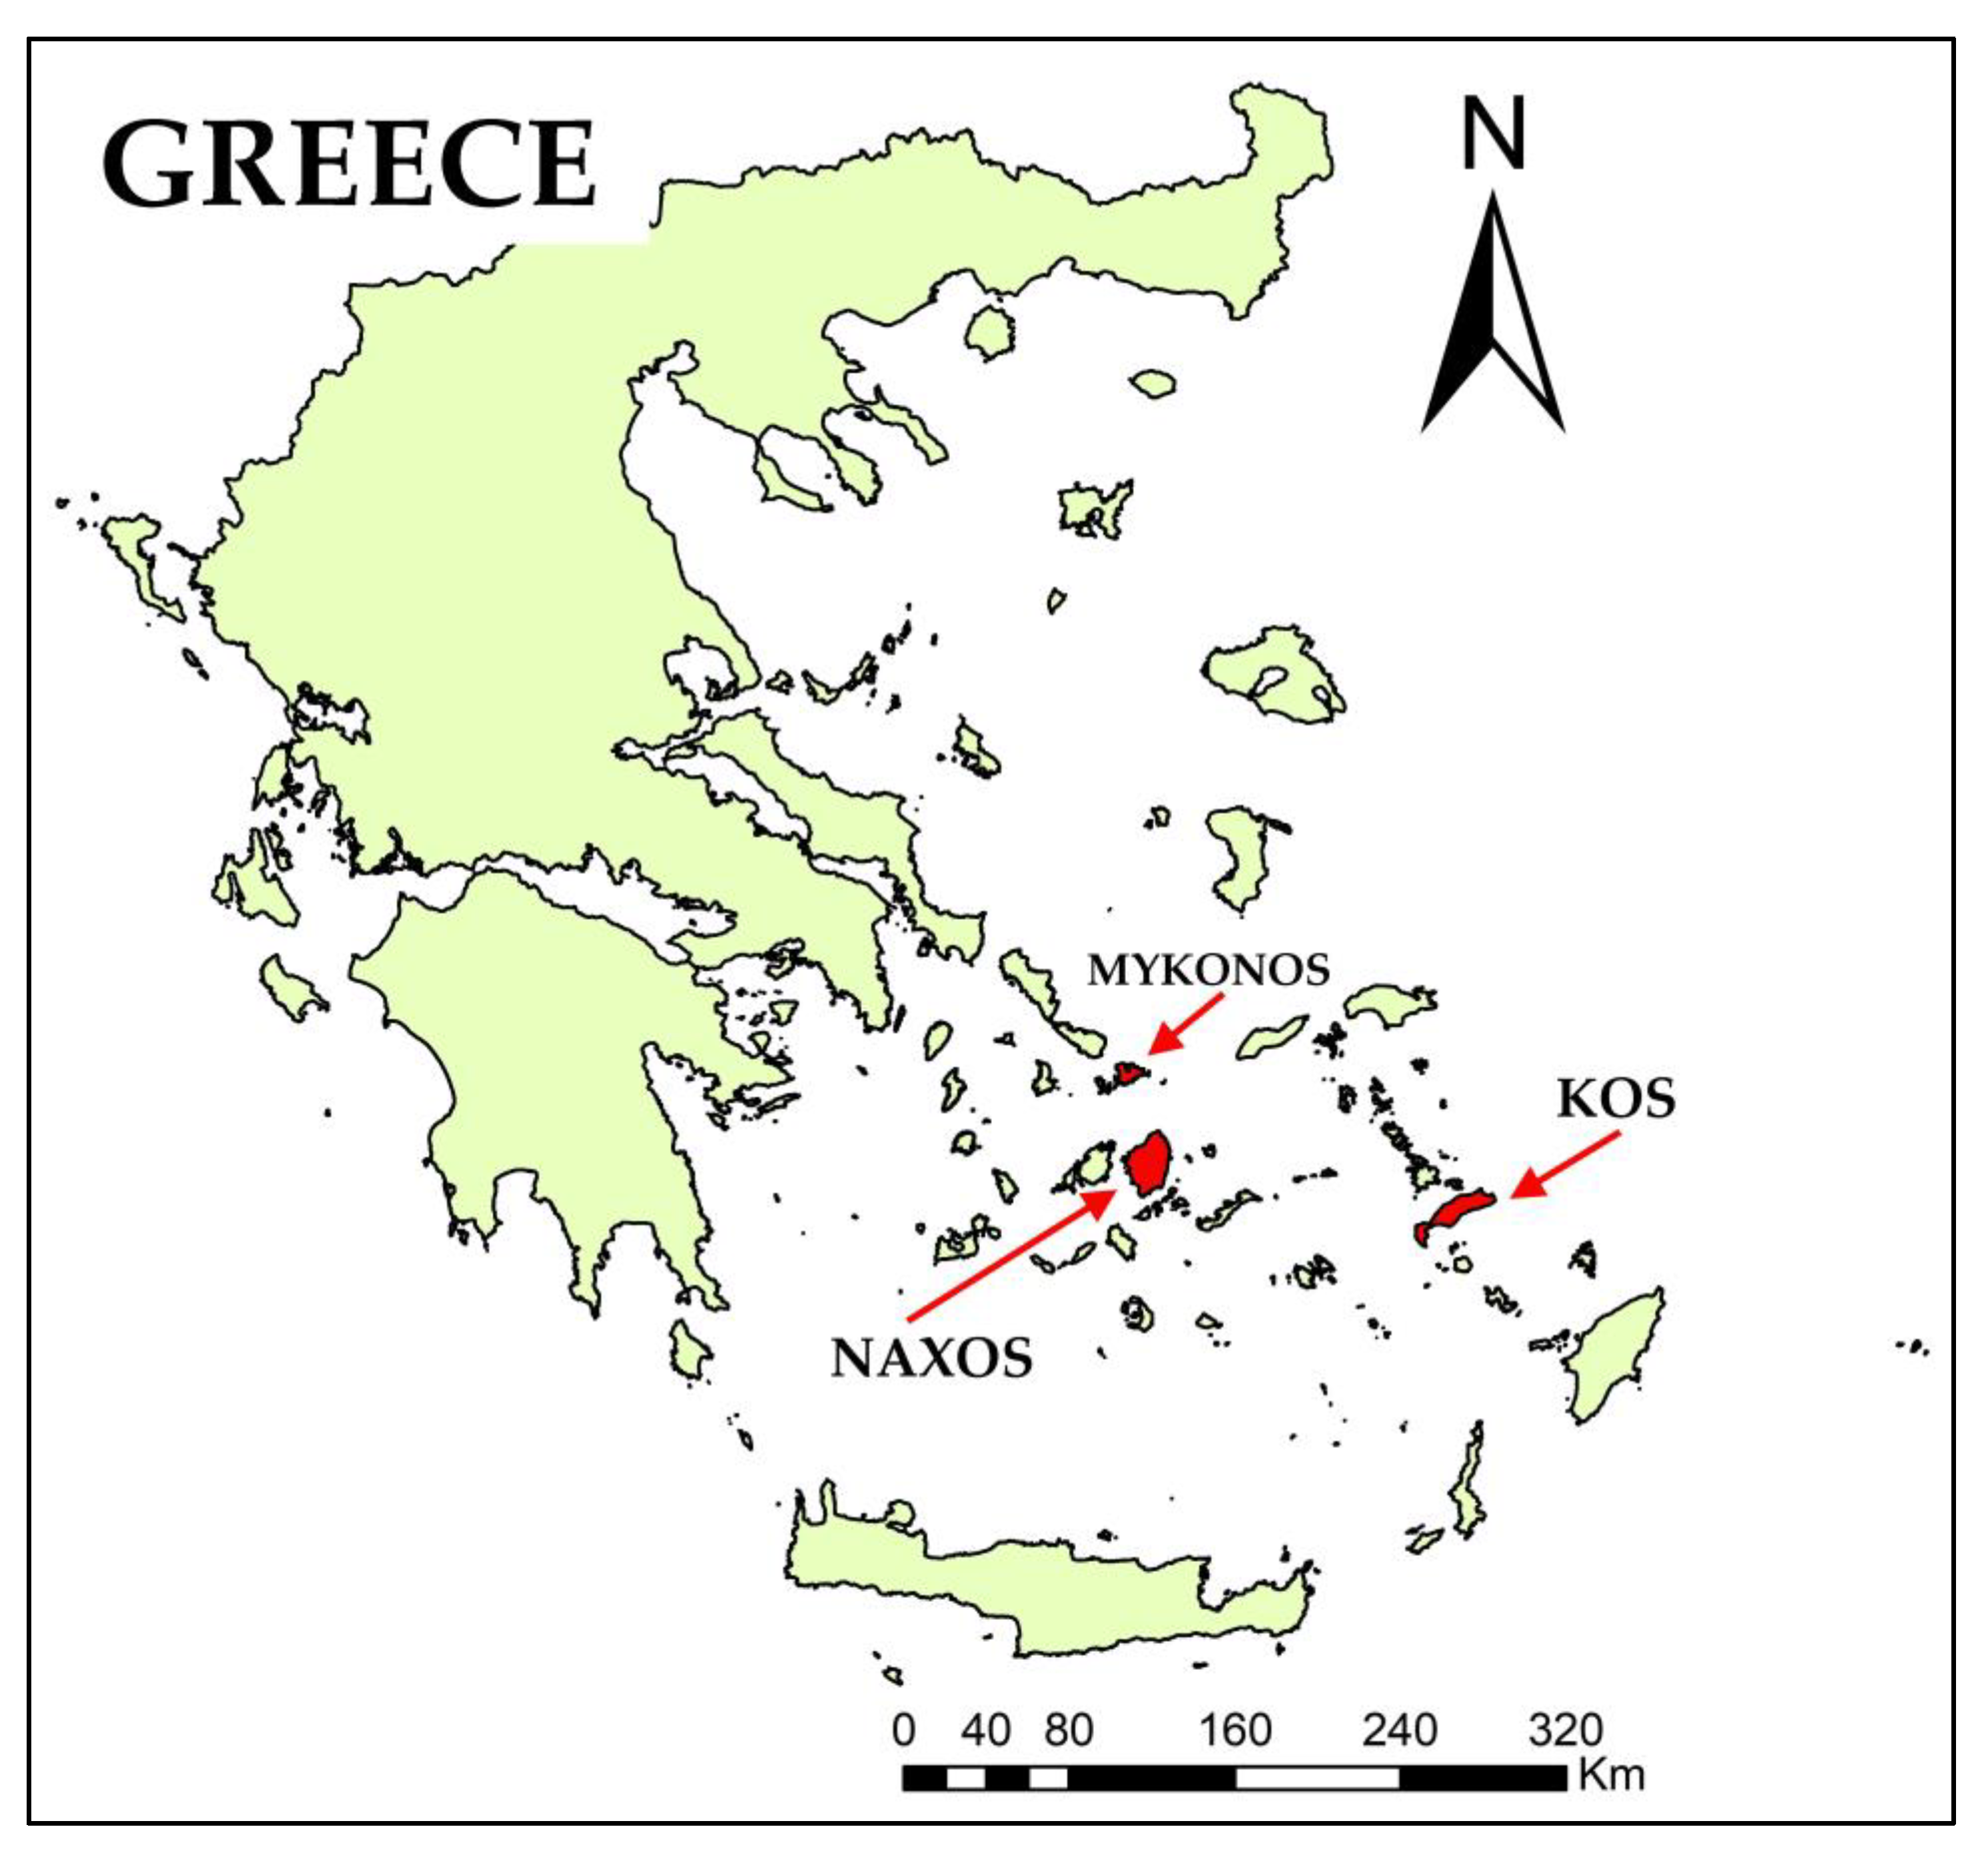
The study area consists of three islands of the South Aegean, namely Mykonos, Naxos and Kos (
Figure 1). The island of Mykonos is located in the central part of the Cyclades island complex and has an area of 85.5 km
2 (10,962 residents, 2021 census of Greece). Mykonos is the island with the mildest topography in the research area (maximum altitude 365 m a.s.l., mean altitude 100 m a.s.l.). Additionally, it is almost exclusively lowland, while only a small part could be considered as hilly. There are no forested areas in Mykonos, and most area is covered by agricultural crops (43.54%) and pastures (37.64%) and a smaller percentage by settlements (16.99%) [
27]. The dominant geological formation is igneous (65.23%), while there are alluvial depositions (25.16%) and schist formations (9.08%).
Naxos is the largest and most fertile island of Cyclades with an area of 430 km
2 and is located south of Mykonos (24,098 residents, 2021 census of Greece). The topography of Naxos is formed by Mount Zas, a low mountain range that crosses it from north to south, with the highest peak being Naxos Dias or Za (989 m a.s.l.), while the mean altitude is 263 m a.s.l. Most of the island is characterized as hilly, while there are several plains and some semi-mountainous areas. There are no forested areas and most areas are covered by pastures and shrublands (64.15%) and agricultural crops (34.98%) [
27]. In Naxos, the limestone (48.11%) and igneous rock formations (43.88%) are dominant.
The island of Kos, with a total area of 282.5 km
2 (35,829 residents, 2021 census of Greece), has a particularly elongated shape, consisting of a long and densely populated lowland zone in the north, and a steep uninhabited mountainous axis in the south. The mountain range of this section is arranged along the southern coast and the highest peak is Mount Dikaios (840 m a.s.l.), while the mean altitude is 127 m a.s.l. Kos is the only island of the research area, where there are some forested areas (6.11%), with most of the watersheds covered by pastures and shrublands (48.89%), agricultural crops (40.89%) and also a small percentage covered by settlements [
27]. In Kos, igneous formations dominate (61.58%), followed by sedimentary formations (25.12%), while the schist (7.34%) and limestone formations (5.83%) are also found in smaller percentages.
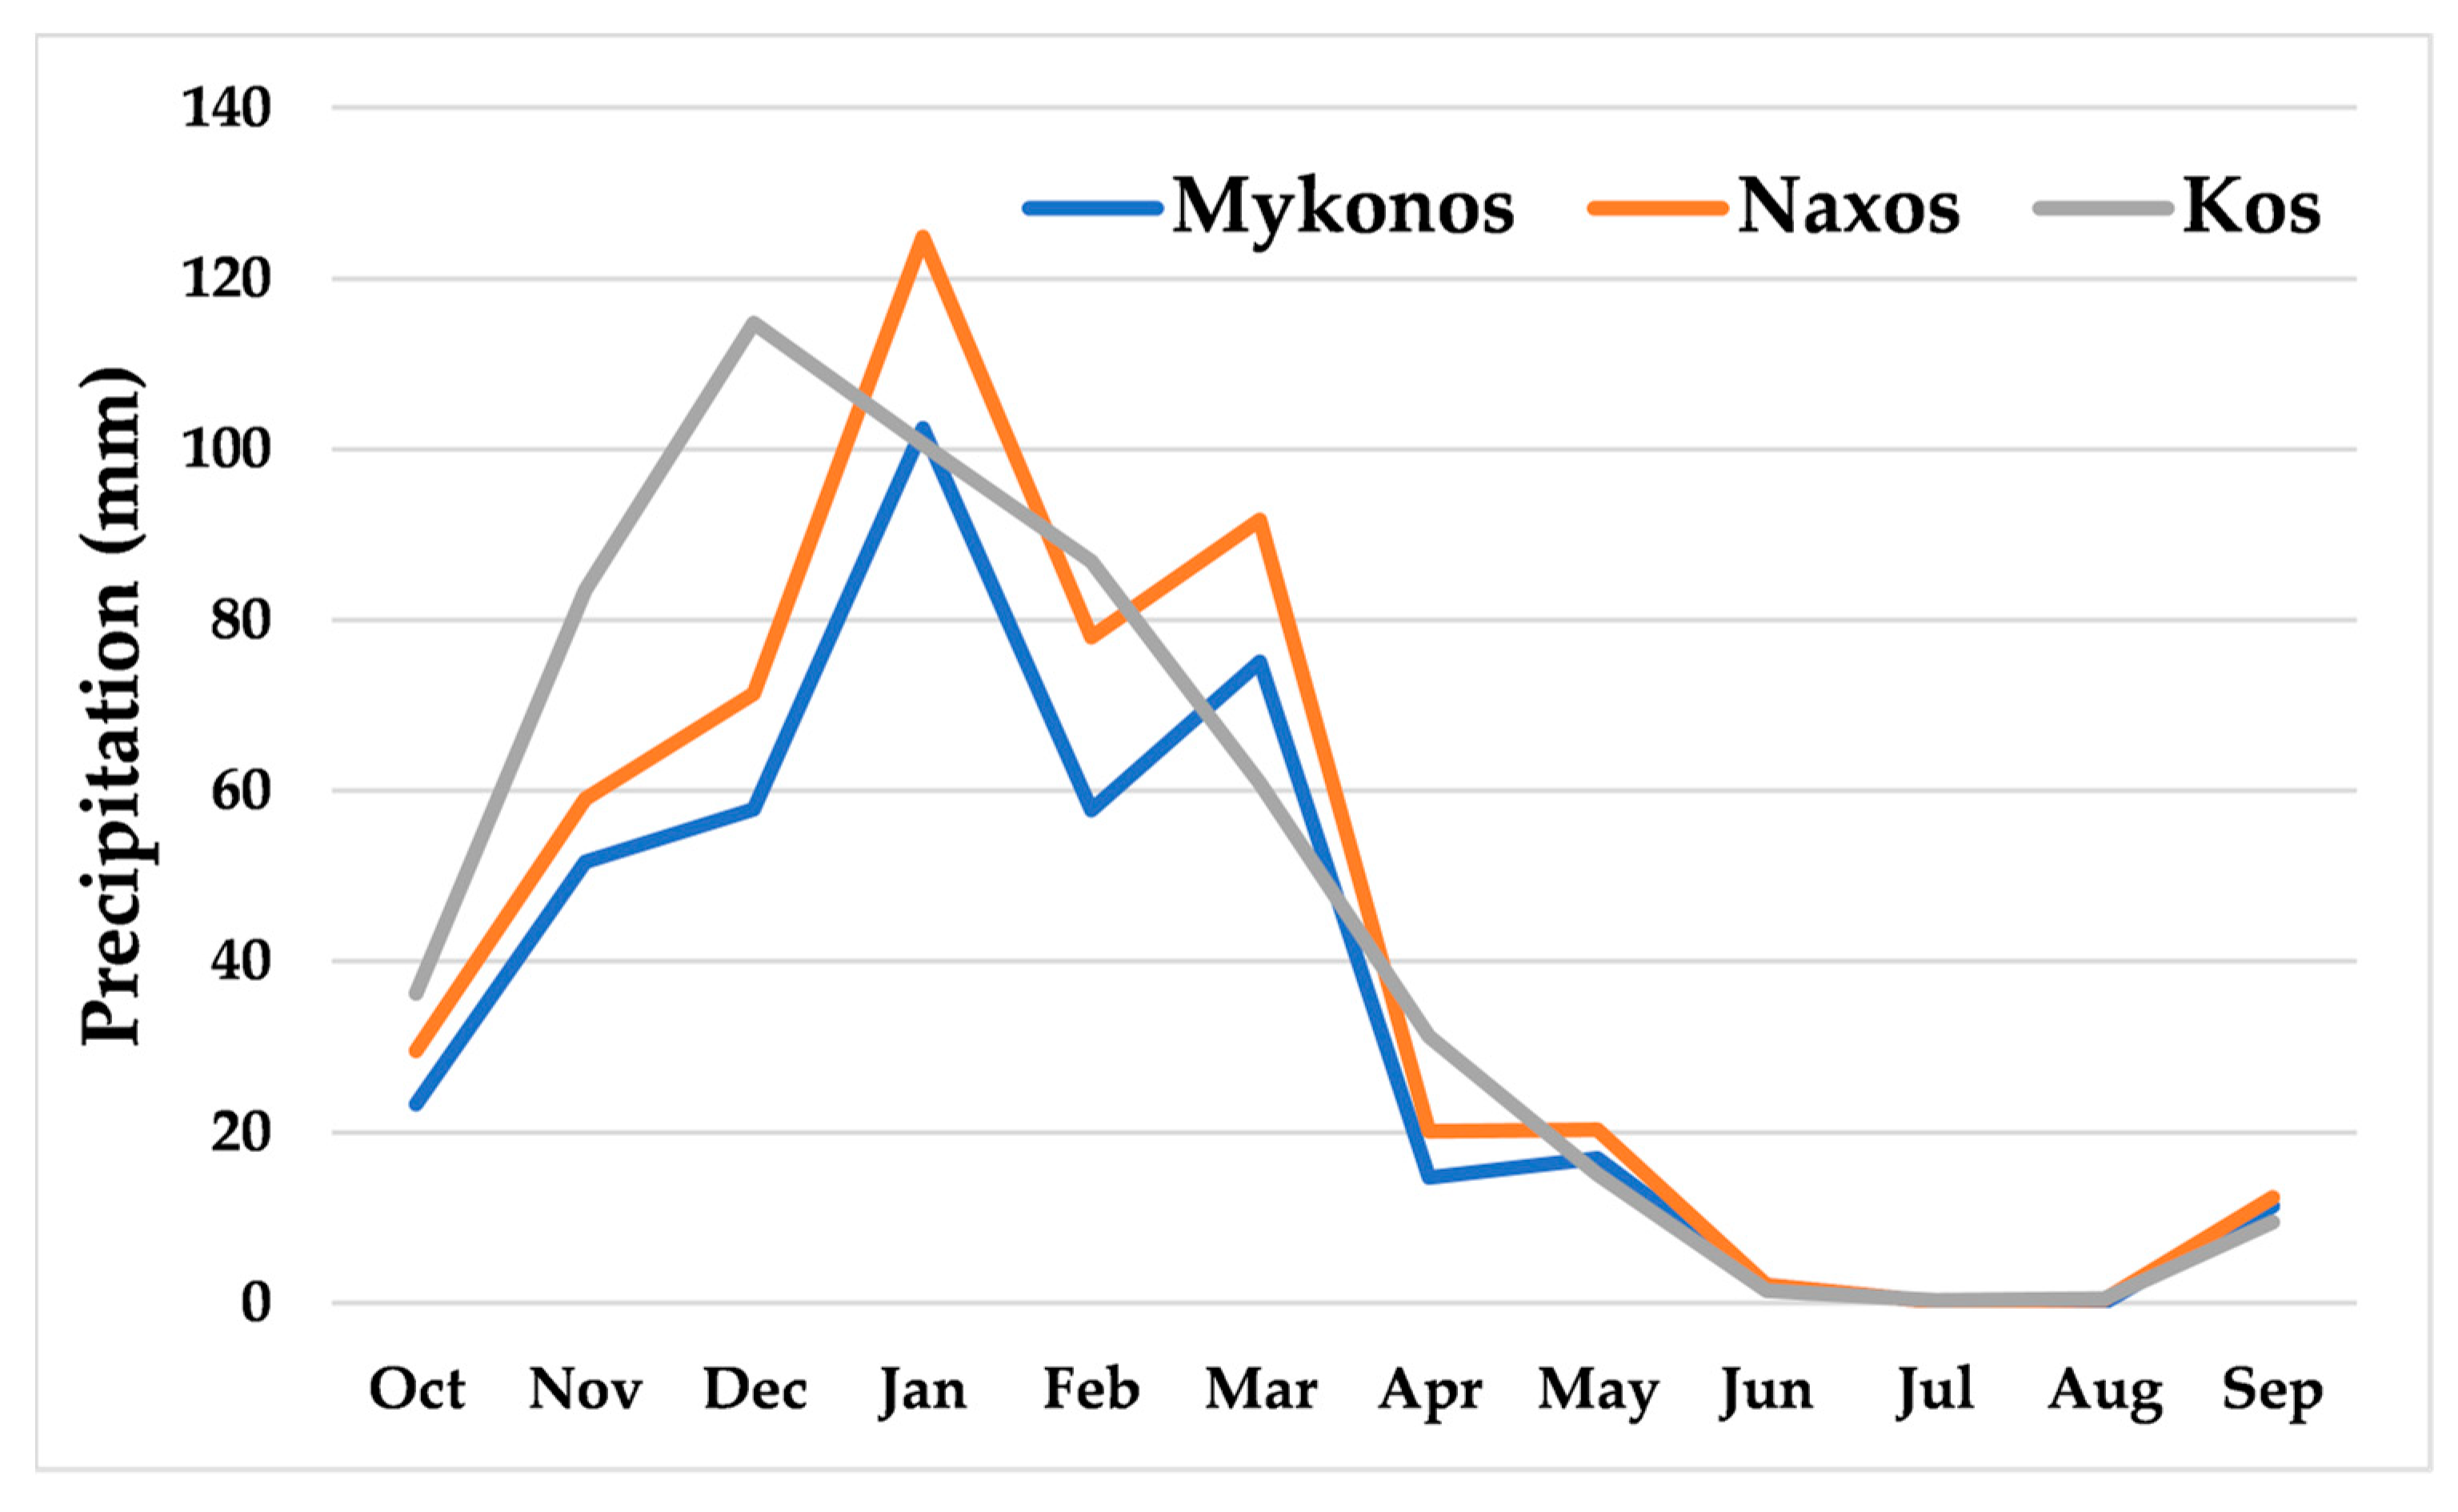
According to Koppen climate classification, the climate of the area is Mediterranean, characterized by long dry summers and mild winters, while strong winds occur throughout the year [
15]. Three meteorological stations (MS) (Mykonos, Naxos and Kos) are being operated by the Hellenic National Meteorological Service (HNMS), providing a long time-series, while in the last decade there have also been meteorological stations of the National Observatory of Athens (NOA) [
28]. In
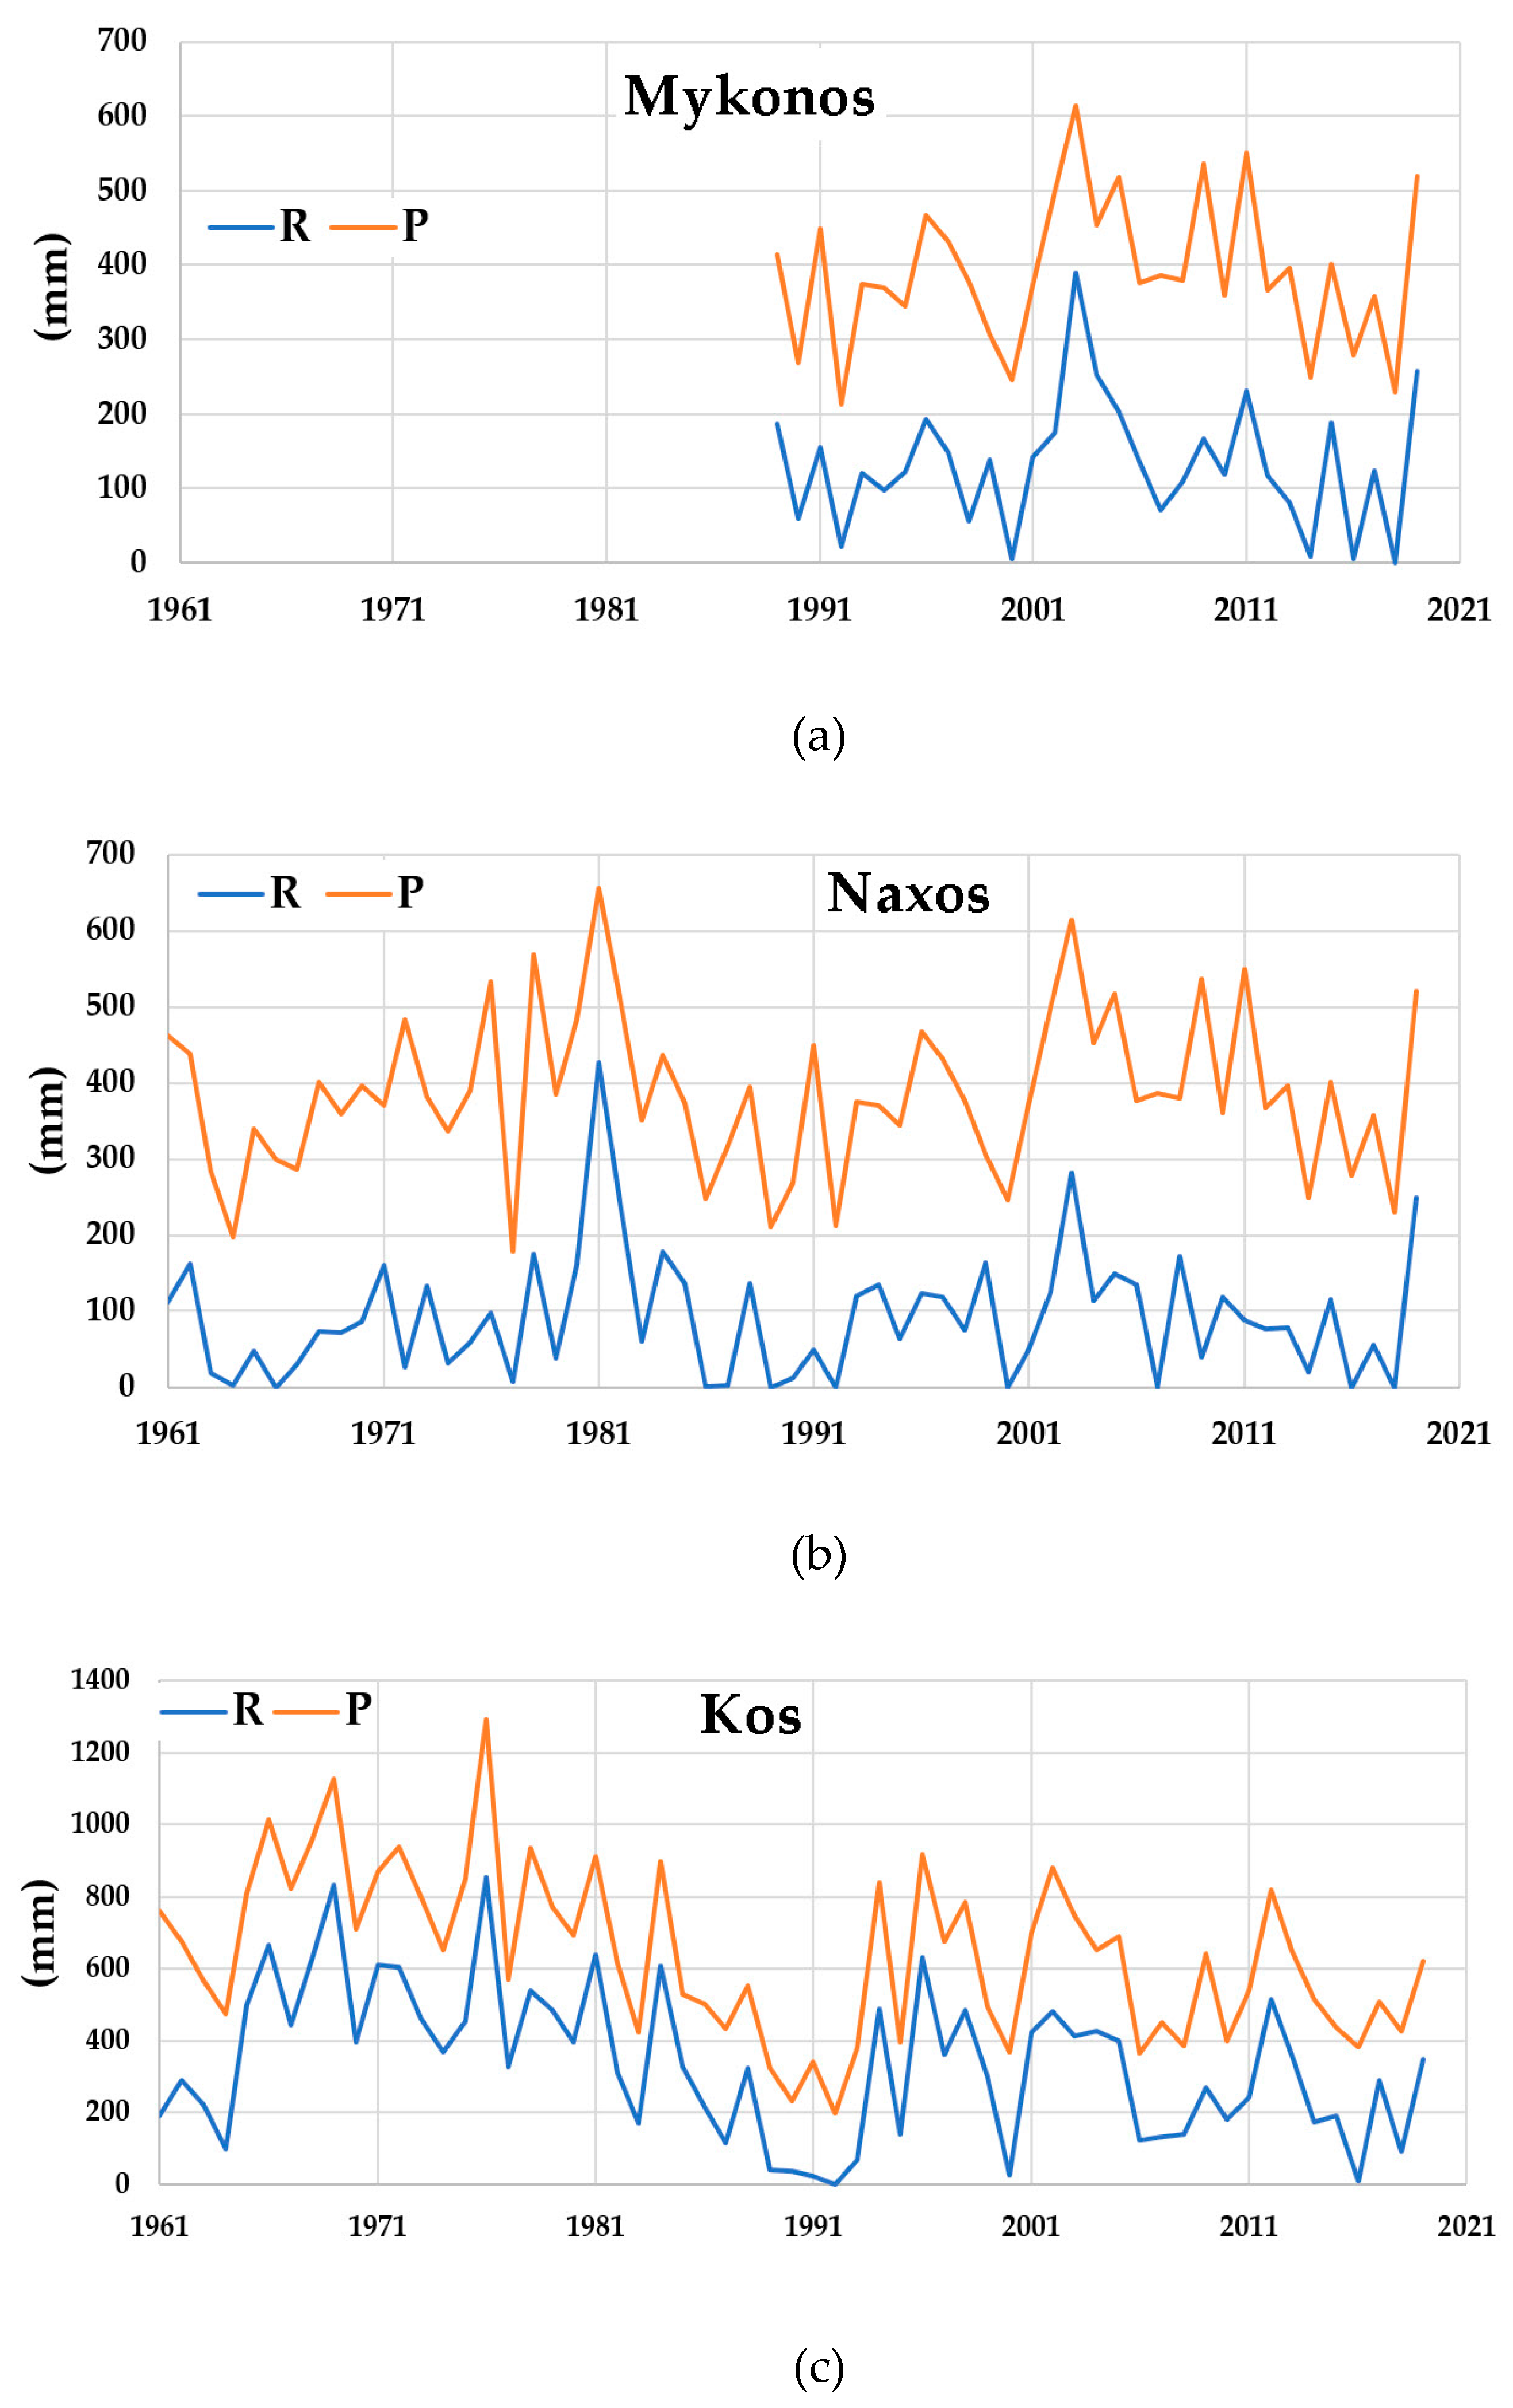
Table 1, the names and details of the stations (altitude, observations duration etc.) are provided. In the current research, the longest time-series were further analyzed. The data of precipitation and temperature were analyzed in monthly time steps, based on the modified Thornthwaite–Mather monthly hydrological balance model, which was applied in this study. Due to the ephemeral nature of the streams in the study area, there are no runoff data in the study area. More details about the analysis of the climate, geomorphology and land uses at a catchment level, are available in the respective thesis link [
29].
2.2. Water Balance Analysis
The modified Thornthwaite–Mather monthly hydrological balance model was used to determine the water balance [
15,
20,
22,
23,
24,
25,
30,
31,
32,
33,
34,
35]. Penman’s method [
36] is preferable in terms of accuracy [
37], and that is why multinational organizations frequently employ it in this way [
2,
38,
39]. However, since some of the meteorological parameters necessary for the Penman calculation (humidity, wind speed, solar radiation) are in many cases missing in many parts of the world, as well as in the current work, the calculation is usually performed using the simpler Thornthwaite approach [
40,
41,
42]. It has been proved that in Greek climate conditions the modified Thornthwaite–Mather model could provide acceptable water balance values, and the accuracy is similar to Penman’s method [
43]. On the other hand, Turc’s method [
44] demonstrates satisfactory results mainly for a high annual rainfall index (higher than 700 mm), while in Greece it did not prove to be applicable in all cases, as well as for the present study area [
45]. The analysis was performed at a catchment level and then summarized for each island separately. The spatial distribution of precipitation and temperature was performed using Thiessen polygons and the methodology proposed by Mimikou et al. [
46] was applied to incorporate the influence of altitude.
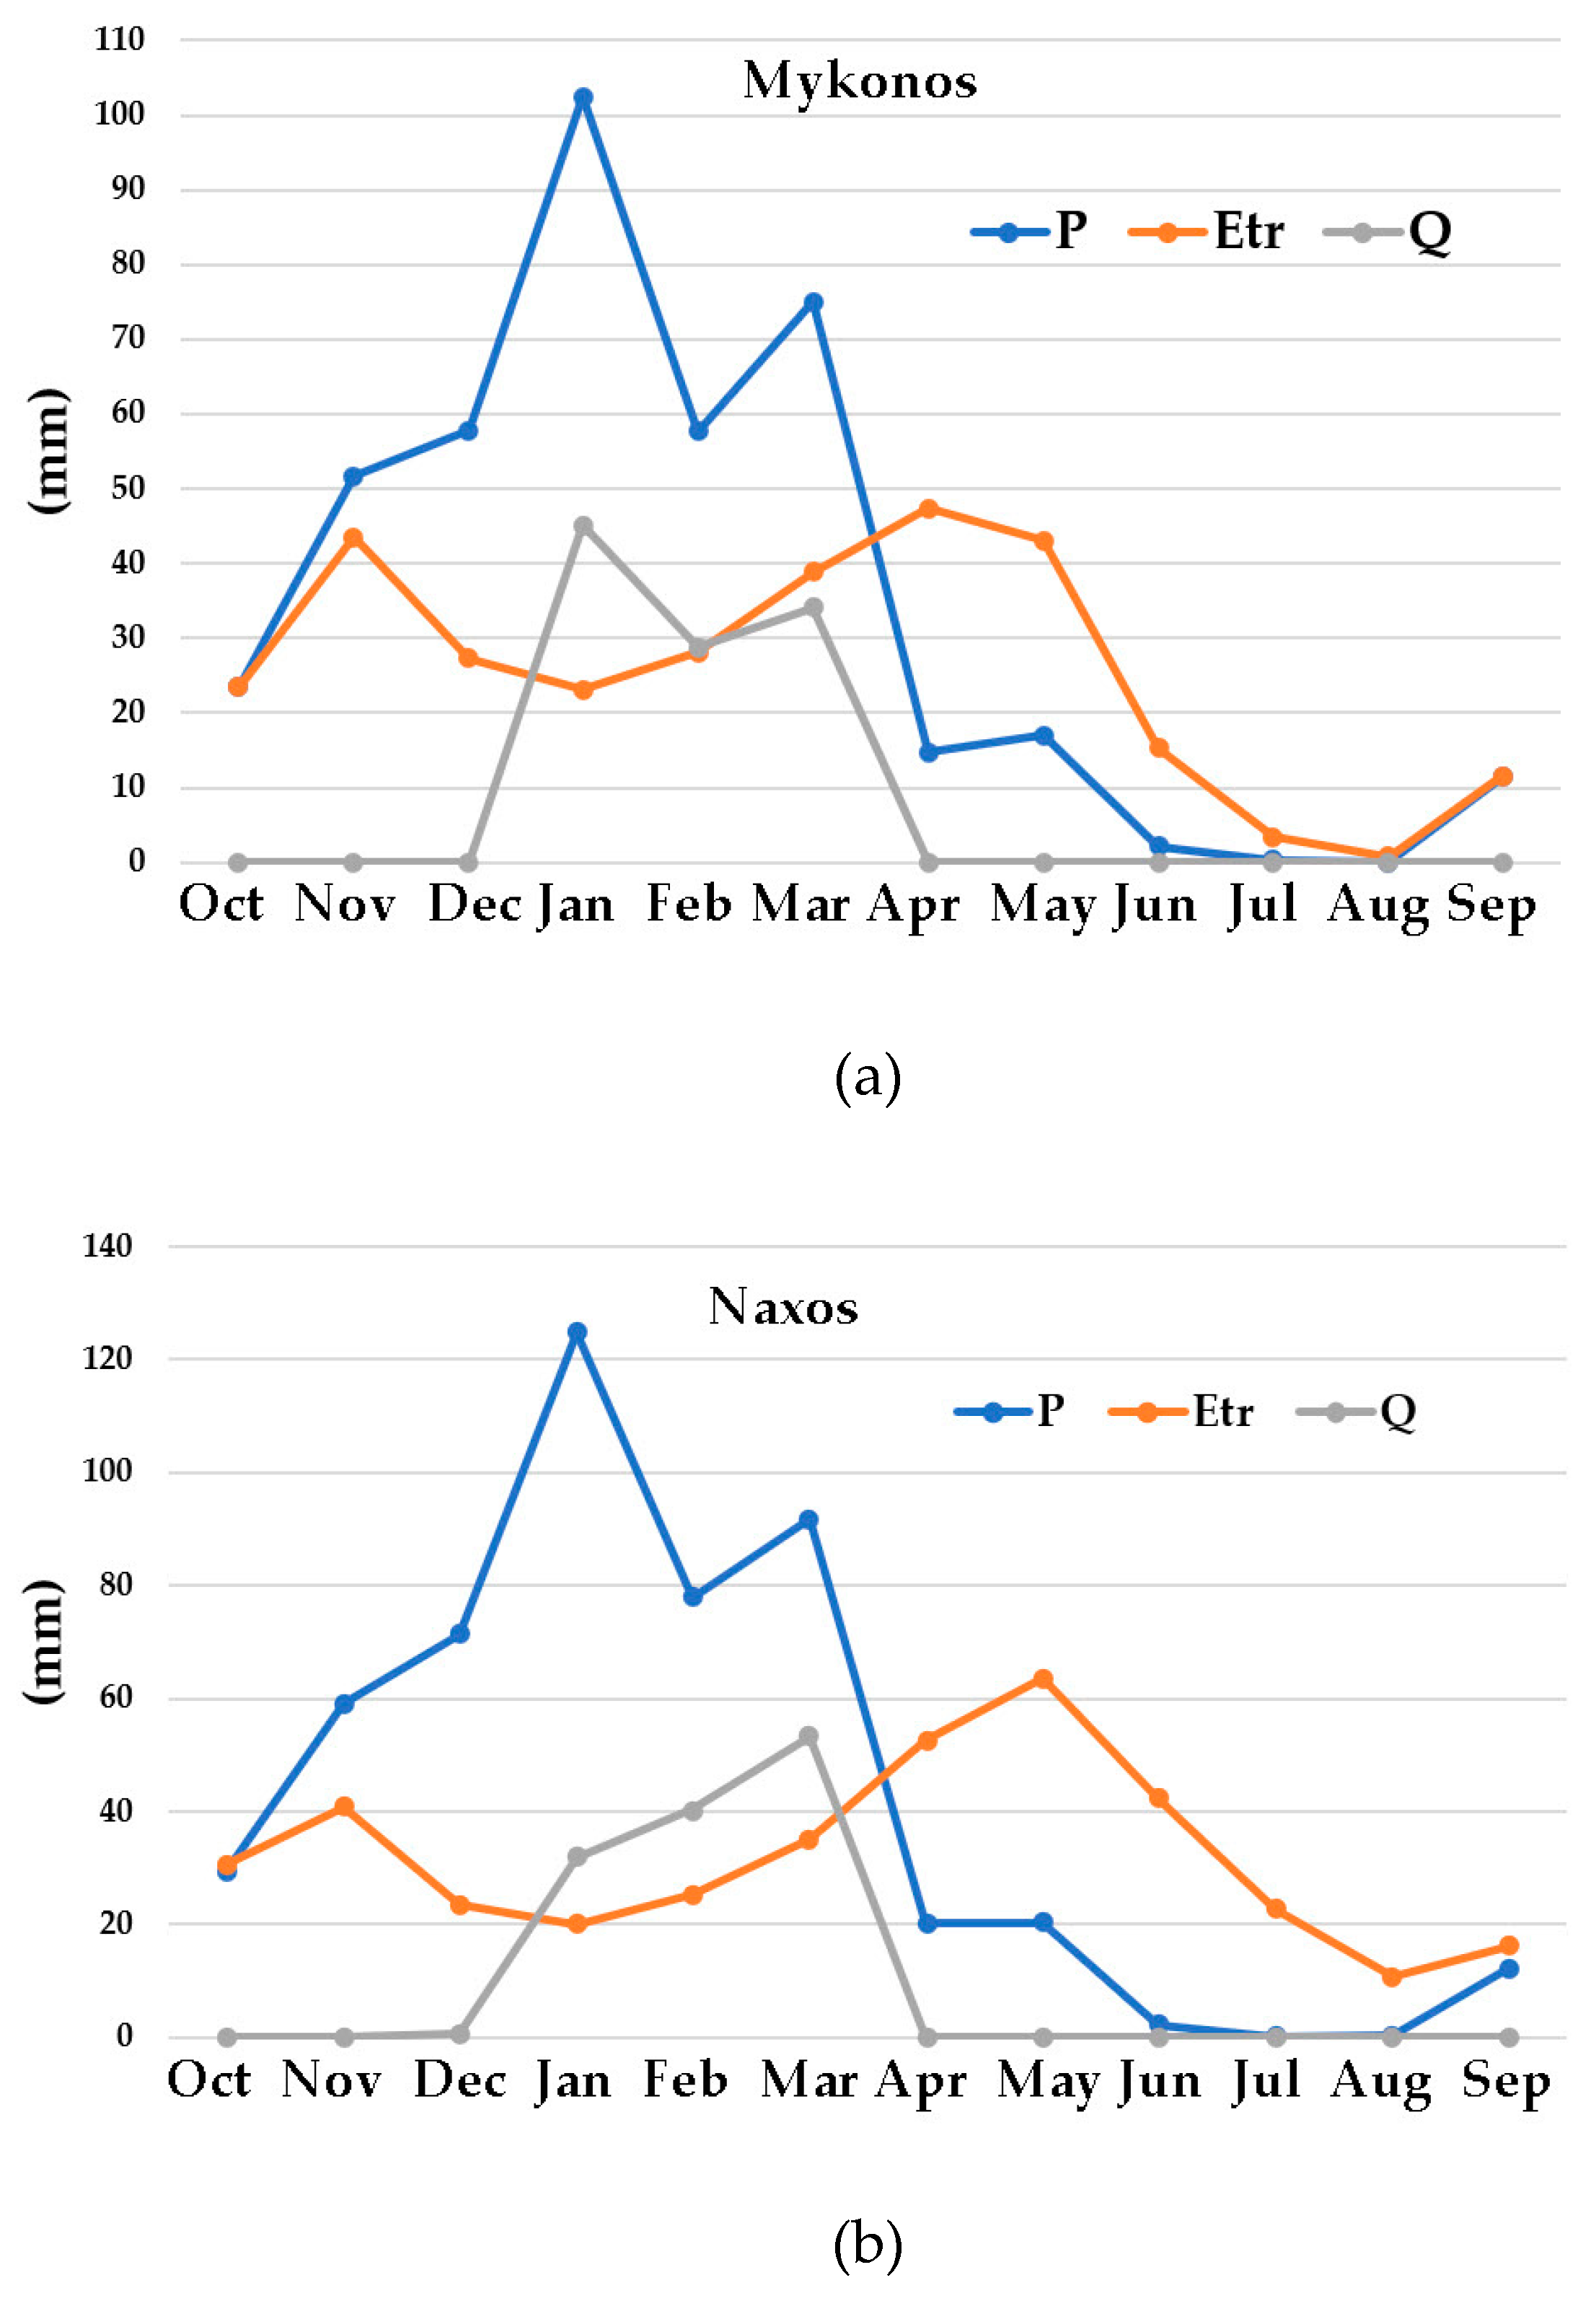
The Thornthwaite–Mather model uses the maximum soil capacity (K) as a parameter and combining the precipitation and potential evapotranspiration as inputs, provides the results of runoff and actual evapotranspiration. The mathematical description of the monthly model is presented below [
20]:
where:
ΔS = change in stored water
Ρ = rainfall (mm)
ΕΤ = evapotranspiration (mm)
Q = excess water (infiltration and surface runoff) (mm)
The corresponding equation of the monthly water balance is as follows:
where:
ΔS = Sn−1 − Sn
QAn = a·(Qn + QAn−1)
if Pn > ETp then Sn = min(Sn–1 + Pn − ETp, K) and Qn = max(Sn−1 + Pn − ETp − K, 0)
if Pn < ETp then and Qn = 0
n = month
Pn = mean monthly precipitation
ΕΤp = mean potential evapotranspiration
ΕΤα = mean monthly actual evapotranspiration
Sn = stored water in the soil
Qn = excess water in the soil
QAn = surface runoff
Dn = filtered water
α = surface runoff coefficient
Potential evapotranspiration
where:
α = 0.016·J + 0.5
ΕΤp = mean monthly potential evapotranspiration (mm)
tn = mean monthly temperature (°C)
J = annual heat index
Ld = correction factor calculated through meteorological tables in terms of month and latitude
α = empirical parameter
The modified Thornthwaite–Mather monthly hydrological balance model assumes that the water that is stored in the soil near the surface (root zone) could be used by the plants [
47]. Therefore, this amount of water is considered part of evapotranspiration (ETr). According to the model, surface runoff and infiltration movement to the aquifer are calculated when the stored water in the soil exceeds the maximum soil moisture capacity (Κ).
2.2.1. Maximum Soil Moisture Capacity (Κ)
This represents the potential maximum moisture (K) that the soil can hold and is expressed by the following equation:
where:
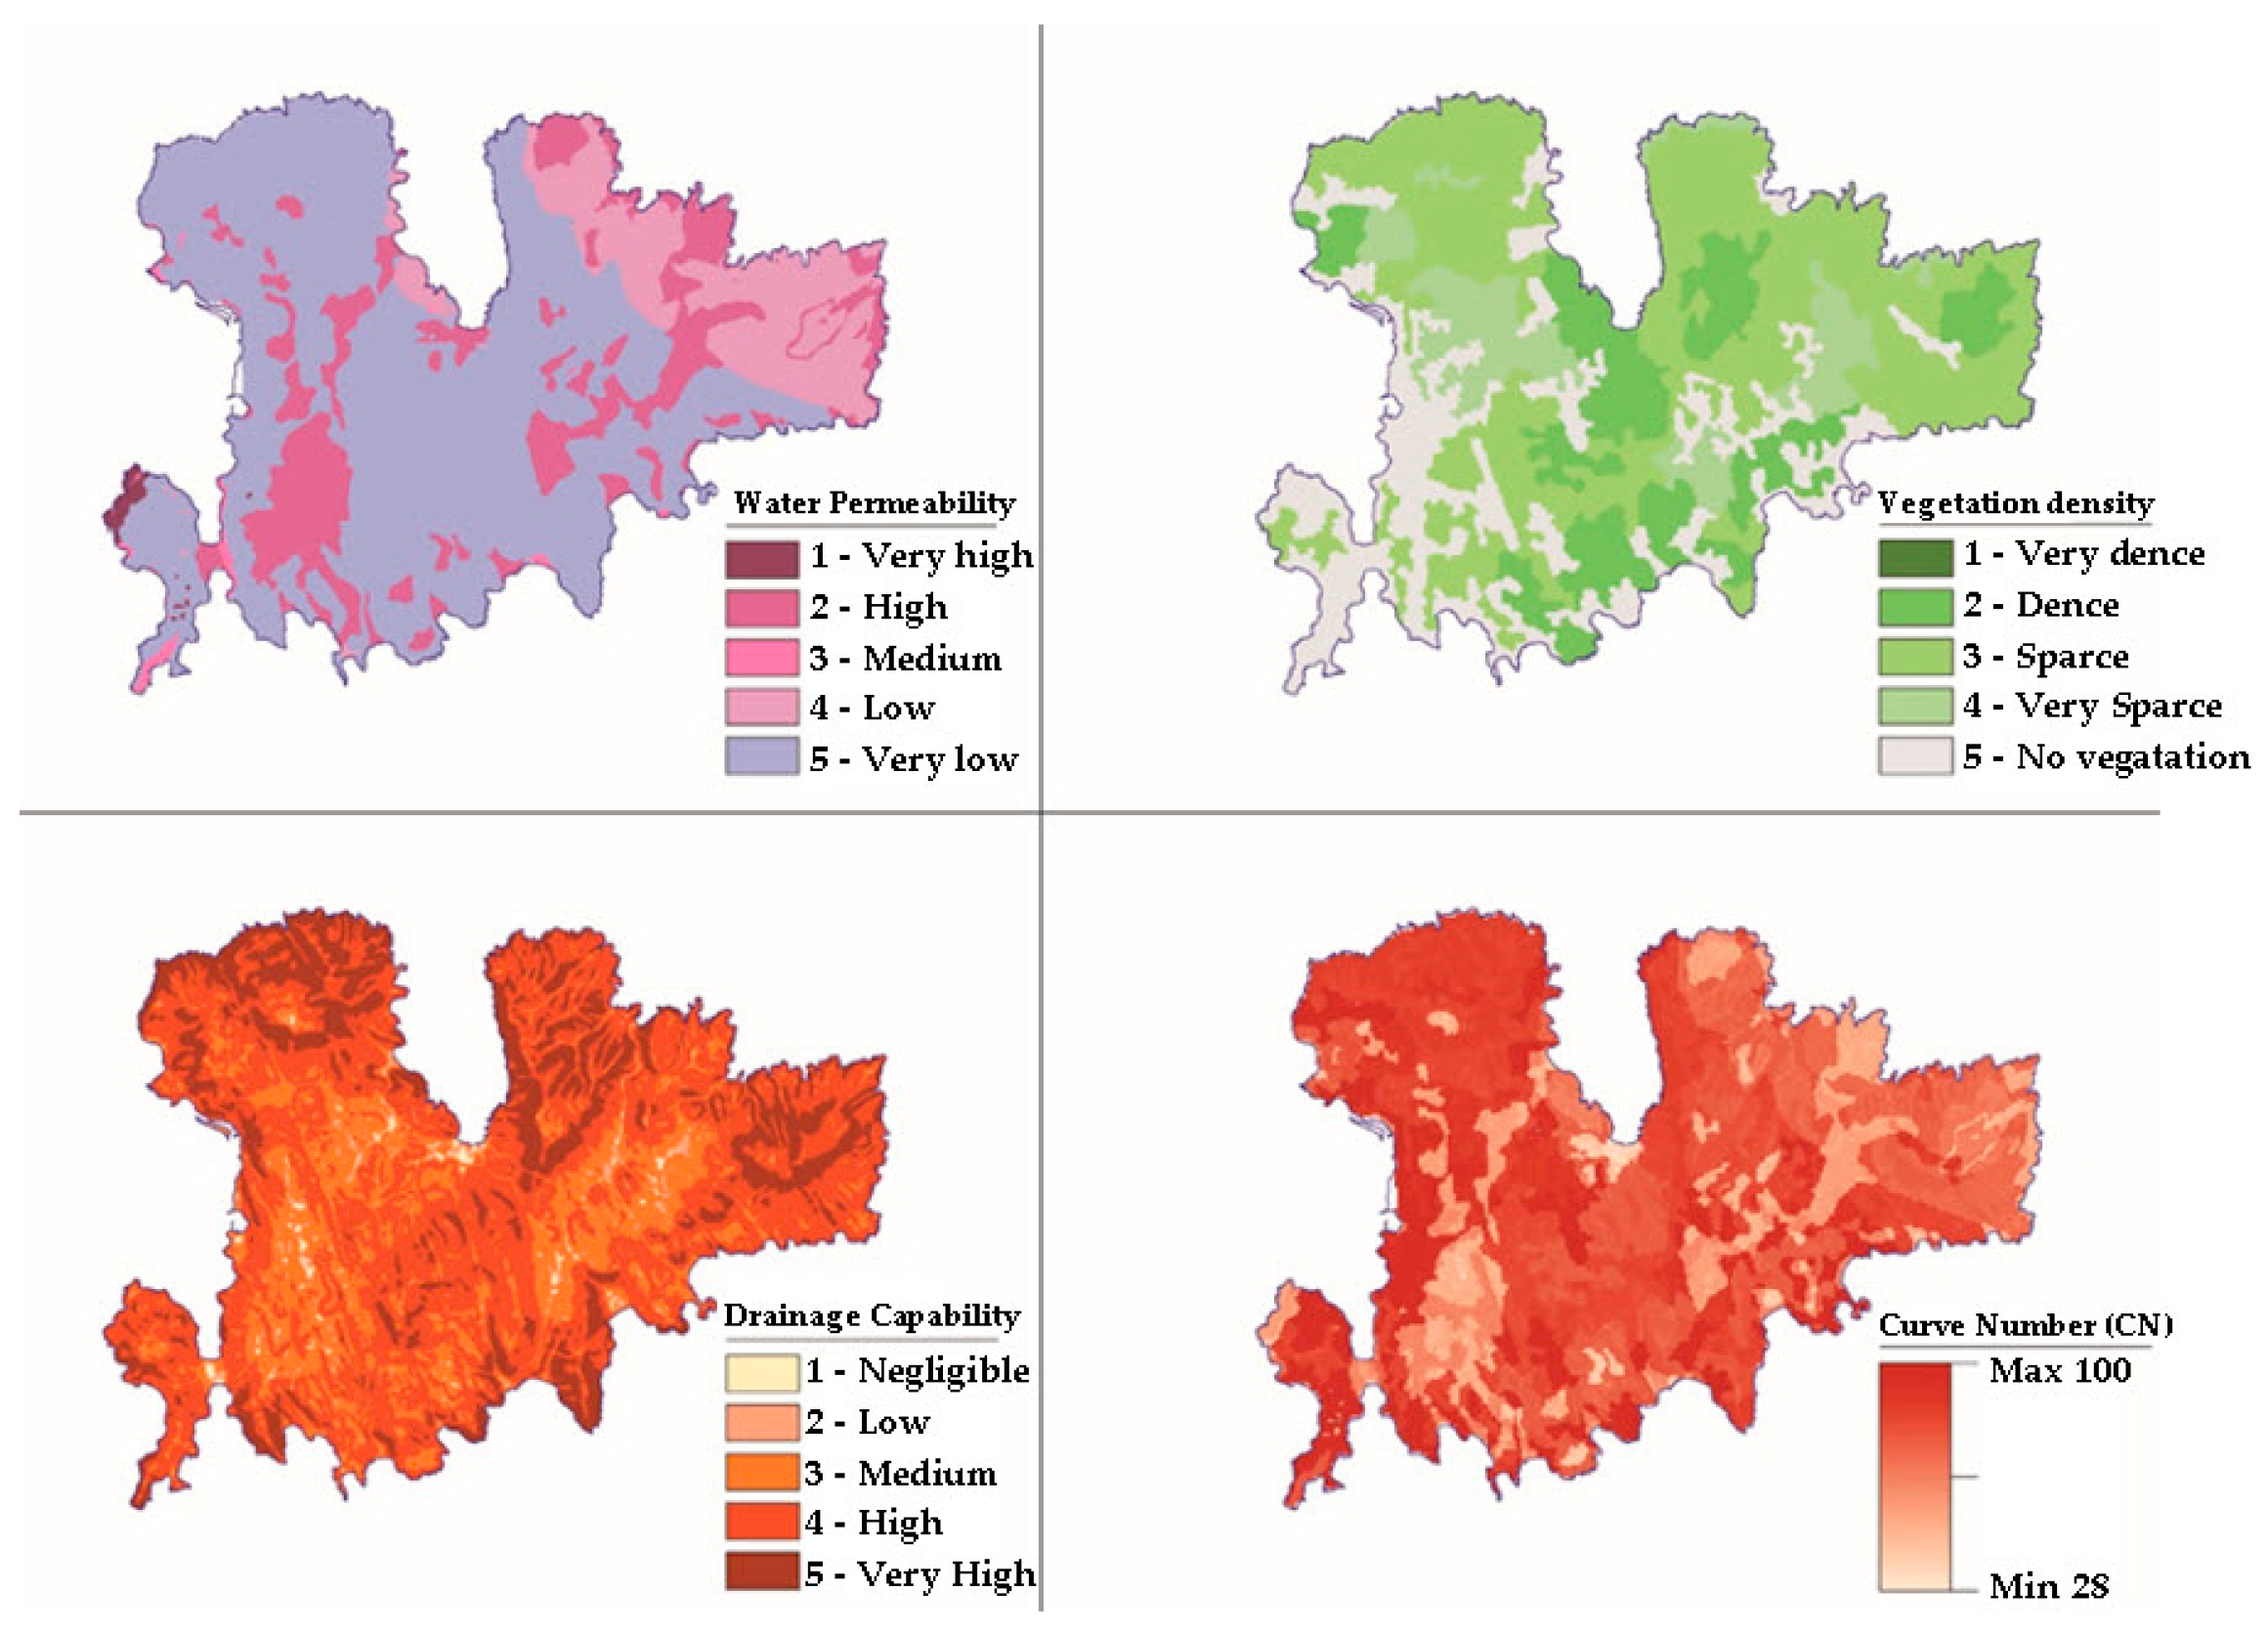
CN = the Curve Number runoff factor that depends on the soil characteristics and land uses of each watershed.
2.2.2. Runoff Coefficient CN (Curve Number)
In cases where there are no simultaneous measurements of rain and runoff for the calculation of infiltration, the estimation of runoff is implemented using the CN (Curve Number) runoff coefficient introduced by the Soil Conservation Service [
48]. This factor depends on the soil characteristics and land uses that prevail in each catchment area. In addition, in the estimation of the CN, the hydrological behavior of the various forms of land use is taken into account, i.e., the percentage of vegetation coverage or canopy density.
The Soil Conservation Service (SCS) has developed tables with the soil classification system consisting of four hydrologic soil groups, designated by the letters A, B, C and D [
49]. Additionally, in order to determine the CN parameter for areas with olive groves, the results of surveys from Mediterranean areas were taken into account [
50,
51,
52,
53]. Based on the above tables, raster files were created in a GIS environment, in order to spatially analyze the combinations of land uses and soil types.
2.2.3. Hydrological Model Calculation Parameters
After running the water balance model for the hydrological basins of the research area, it is possible to export the results in the form of tables. The results include the calculation of various parameters for each main hydrological basin. The parameters calculated by the hydrological model are the following [
20]:
where:
P: Precipitation height (mm).
Ε: Actual evapotranspiration (mm).
R: Surface runoff (mm) and
I: Infiltration (mm)
2.2.4. Infiltration
Infiltration is the process by which water enters the surface layers of the soil and then moves to the deeper layers. This amount of water primarily supplements the soil moisture deficit, while the excess moves deeper and feeds the underground aquifer.
Factors affecting infiltration are mainly the soil moisture, rainfall intensity and distribution, geological formations and vegetation. In an area (or catchment), where various geological formations occur, the mean (or uniform) infiltration rate is calculated based on the relationship [
20]:
where:
Ιμ = the mean infiltration rate of the catchment
Ε1. Ε2. … Εn = the surface area of individual geological formations
Ι1. Ι2. …. Ιn = the corresponding infiltration coefficients
Εsum = the total surface area of the catchment.
2.3. Water Demand
The demand for water was estimated based on the consumers’ needs. The data of the actual water availability from the network of the respective Municipal Water Supply and Sewerage Service (MWSSS) was also used with caution, as it became clear from the data collected that there is not complete recording and monitoring of the quantities used (given the existence of illegal drilling, network losses. etc.) in the study area.
2.3.1. Water Supply
The estimation of the current water needs for the water supply of the residents can be calculated either based on the water consumption data of the MWSSS, or based on the actual population. The calculation of water supply through the measured consumption values, provided by the MWSSS, presents significant problems. For this reason, the water supply for domestic use was calculated based on the population data recorded by the Hellenic Statistical Authority and specifically, the actual population of the latest census. For the agricultural processing units (small industries) and large hotel facilities, the MWSSS data was used.
The current mean daily water consumption in Municipalities with a population similar to that of the majority of the Aegean islands is estimated to range from 100 to 150 lt/cap/day. This estimation is based on many recent water supply studies and on consumptions calculated by the various MWSSS of the area. Water supply studies often use as a basis, mean daily water consumptions of 200–250 lt/cap/day [
13,
18]. The use of these increased consumptions is usually conducted with the aim of avoiding the possibility of underestimating the water supply network capabilities (in particular the main pipelines’ dimensions).
The network losses resulting from poor construction are in the range of 5% to 10%. For each Municipal District, network losses were approximated both for the existing condition and for the future requirements, taking into account on a case-by-case basis the information available from the MWSSS on any particular characteristic of the respective local network.
To calculate the water supply needs of the seasonal population, the data of overnight stays provided by the Institute of the Association of Greek Tourist Companies [
54], were used, as well as daily water consumption coefficients per vacationer. For the calculation of the total water demand of the seasonal population, visitors to the islands who do not use hotel accommodation for their stay, as well as those who stay in rooms that are not certified by the Institute of the Association of Greek Tourist Companies, were also taken into account (a 10% increase in overnight visitors of the islands is regarded). Five months from May to September, is the period widely accepted as the tourism season’s duration.
2.3.2. Irrigation
The Blaney–Griddle method [
55] was used to calculate the amount of water required for crop irrigation. This methodology has been applied to all the Agricultural Technical studies that have been drawn up for the Aegean islands by the Ministry of Agriculture. It is adapted to a satisfactory degree to the conditions that prevail in Greece and it closely approximates the actual water needs of the crops [
56].
To calculate the amount of water required by the crops, the recently approved plant coefficients by the Ministry of Agriculture were used. In the calculations, the North Geographical Latitude was used, which corresponds to approximately the center of each island, which is considered sufficient, given that the percentages of daylight hours available are given per entire degree. Unfortunately, in this work it was not possible to determine irrigation water demand using the more precise generalized Penman [
36] approach, since most islands lack data of solar radiation and wind speed.
The main method of irrigation in the study area is the drip irrigation. The drip irrigation is applied to a part of the soil and specifically, to the area of the plants root system. The water supply from the drippers is very low, 2–3 lt/h, and as a result, most of the water volume is filtered into the ground and does not runoff on the surface. Since irrigation is repeated daily for 2–3 h to cover the evaporated water, there is no water loss resulting from deep seepage.
The irrigation season is defined by the meteorological data and the water demand of the crops. For all kinds of crops, the period between March 15 and October 15 is determined as the irrigation period. Finally, it should be noted that despite the use of methods that have resulted from many years of experience in the implementation of Greek Agricultural Technical studies, and which are generally accepted by the Ministry of Agriculture, the calculated total consumptions are usually higher than those measured by the organized irrigation services. This is evident for the reasons listed below: (a) the planned or recorded irrigated areas are not irrigated every year, and (b) olive trees and grapevines could use winter rainfall or runoff instead of summer irrigation with a relatively slight decrease in productivity.
