Article

Temporal and Spatial Distribution of Lightning Activity over Bulgaria during the Period 2012–2021 Based on ATDnet Lightning Data

National Institute of Meteorology and Hydrology, Bulgarian Academy of Sciences, 66 Tsarigradsko Chaussee, 1784 Sofia, Bulgaria
*
Author to whom correspondence should be addressed.
Climate 2022, 10(11), 184; https://doi.org/10.3390/cli10110184
Submission received: 20 October 2022 / Revised: 11 November 2022 / Accepted: 13 November 2022 / Published: 21 November 2022
(This article belongs to the Special Issue Feature Papers for Section "Climate Dynamics and Modelling")

Abstract

:
In the present study, lightning activity based on data from ATDnet over the territory of Bulgaria for the 10-year period between 2012 and 2021 is evaluated. This analysis shows the highest lightning activity with the greatest number of thunderstorm days in June. December is the month with the lowest number of flashes and thunderstorm days. It was found that more than 30% of thunderstorm days annually are in the cold half of the year over the southern part of the considered domain. The average diurnal distribution showed a maximum of lightning activity between 12 and 15 UTC, while over some mountainous and sea regions it is between 03 and 06 UTC. The spatial distribution of flash density (fl km−2 y−1) reveals that the number of flashes and the number of thunderstorm days increase with altitude up to 1800 m and then decrease for higher altitudes.

1. Introduction

The use of lightning location systems (LLS) across Europe and the wider world for operational meteorology and research purposes is well established. The number of studies on the long-term characteristics of lightning activity over different parts of Europe increased in recent years [1,2,3,4,5]. It has been objectively demonstrated that lightning in Europe is most intense (dense and frequent) in summer and that higher latitudes experience less lightning than lower latitudes [6]. Thunderstorms are more frequent in continental than in maritime climates. However, in [1] it was established that flashes with higher peak currents occur in greater proportion over sea than over land.
The aim of the present study is to evaluate lightning data from the Arrival Time Differencing NETwork (ATDnet) over the region of Bulgaria for the last ten years with the purpose of obtaining yearly, monthly, and daily norms of lightning density. Bulgaria is a relatively small country in the eastern Balkan peninsula but has varying topography. Plains occupy about 35% of the territory, while plateaus and hills represent 41%. The eastern border of the country is the Black Sea. The lowest point is at sea level, while the highest is at 2925 m (Musala), which is also the highest peak on the Balkan peninsula. Bulgaria has a dynamic climate, resulting from its position at the meeting point of Mediterranean and continental air masses and the barrier effect of its mountains. Recent studies provide insight into the regional climate of Southeast Europe in the context of contemporary climate change [7,8,9]. Southeast Europe is among the most thundery regions in Europe [6]. Previous studies on thunderstorms over Bulgaria based on visual observations at the meteorological stations below 800 m [10,11] showed that the mean number of registered thunderstorm days increased during the period 1991–2010 in comparison with 1961–1990, especially in the north-eastern part of the country and for the months of August and September. The majority of thunderstorm days was observed in the warm half of the year between May and August. However, since 1991 a significant increase in thunderstorm events during the winter months of December, January, and February has been established [11]. In the present study, lightning activity over Bulgaria will be considered based on ATDnet. It has to be stressed that there is still no evaluation of the system detection efficiency for the considered region, so presumably, there should be an unknown number of missed flashes. Hence, looking at the long-term aspects of lightning activity, even based only on ATDnet over the region, would be of interest not only for internal use but also for the international scientific community.

2. Lightning Data

In the present study, lightning activity based on data from ATDnet (Arrival Time Differencing NETwork) over the territory of Bulgaria for the 10-year period between 2012 and 2021 is considered. ATDnet is the most recent version of the VLF (very low frequency) lightning location network of the Met Office that has operated since 1987 [12]. It takes advantage of the long propagation paths of the VLF spherics emitted by lightning discharges, which propagate over the horizon via interactions with the ionosphere. The differences in the arrival times of these strokes at the outstations are used to calculate the lightning’s location. ATDnet predominantly detects spherics created by cloud to ground (CG) strokes, as the energy and polarization of spherics created by CG return strokes mean that they can travel more efficiently in the Earth-ionosphere waveguide, and so are more likely to be detected at longer ranges than typical inter-/intracloud (IC) discharges [6]. Data are collected every minute and BUFR encoded using the ‘Universal BUFR template for lightning data’ with 15 min of data combined into one file, which is then sent by the UK Met Office on behalf of the World Meteorological Organization to member states through its Global Telecommunication System.
ATDnet lightning data over the domain that covers 41N–44.5N and 22E–29E (shown in Figure 1) are evaluated with a resolution of 0.05 × 0.05 deg for the period 2012–2021. For the flash density plots, ATDnet fixes that occurred within 5 km of and within 1 s after another fix were grouped together as a single flash. These criteria should capture the majority of fixes that occur within spatially extensive flashes, or strokes within the same flash where the error on one or more of the strokes was mislocated by a few kilometers [6].The location and time of the first fix in the group of fixes were used as the location and time of the flash. Days determined as “days with flashes” are days with at least one flash detected.

3. Results

3.1. Temporal Distribution of Thunderstorm Activity over the Region of Bulgaria

3.1.1. Annual Cycle

In Figure 2, the annual distribution of the detected flashes is presented. The figure shows an increase in detected flashes for the first three years (from 2012 to 2014), followed by a slight decrease (until 2016). The years 2017 and 2018 show a higher number of flashes (close to 800,000), followed by a decrease in lightning activity. Based on the studied ten years, the mean annual number of flashes detected over the domain of interest is 620,763 flashes per year. Similar is the trend of the number of days with at least one detected lightning–thunderstorm day (TD) (Figure 3). The mean annual number of thunderstorm days is 237 days. The year with the lowest number of TDs is 2015 (198 days). However, during 2015, a relatively high number of flashes is detected (close to 700,000 flashes), which shows that, during this year, relatively fewer but more severe thunderstorms formed in comparison to other considered years. By contrast, the high number of TDs during the last three years, 2019 (which is the year with the highest number of TDs—263 days), 2020, and 2021, when considered with the corresponding relatively low number of detected flashes, shows that during this period a relatively high number of thunderstorms formed, but they were weaker with low lightning activity. It has to be mentioned that, in other regions, a decrease in lightning activity during COVID-19 lockdown and the following periods was established [13,14,15], when a reduction in non-essential activities and mobility coincided with a significant drop in pollutant concentrations and lightning, especially during 2020. It could be speculated that the decrease in flashes detected by ATDnet over Bulgaria after 2019 could be also due in part to the reduction in surface pollution in the thunderstorm environment. The summer season being the time of year when most of the lightning activity takes place naturally reflects in high annual and summer monthly density and frequency of flashes.
More than 95% of the flashes (Figure 4) are detected during the warm half of the year (between April and September), when land surface heating becomes the main source of instability leading to thunderstorms. The highest percentage of flashes is in June (32.7%), followed by July (22%). The lowest percentage is in December. Around 50% of cases detected in December occurred during 2012, when the first days of the month were relatively warm and a cyclone passed over the Balkans. June 2014 is the month with the highest number of detected flashes from the studied time period, with a total of 351,119 flashes. About 65% of days with thunderstorms occur during the warm half of the year (Figure 5). The days with detected flashes between April and September are spread out with around 11% per month from the total thunderstorm days during the year, while about 6% per month occur during the cold half of the year. The relatively high percentage of days with detected flashes in the cold half of the year (about 35% of all days with thunderstorms) in comparison to the very low percentage of number of detected flashes during this period (about 5% of all detected flashes) is not surprising. Thunderstorms that form during the cold half of the year are isolated, fewer, and weaker in comparison to those forming during the warm half of the year. Thunderstorms form relatively frequently in winter in Bulgaria, when the atmospheric dynamics are favorable but tend to be weak and produce few discharges.
The main reason for the interannual variability of lightning activity in a region the size of Bulgaria is the variability of the atmospheric circulation. Thunderstorms are widespread in the high season between April and September if the cyclonic type of circulation dominates the Balkans in the middle troposphere. By contrast, if anticyclonic circulation persists, the thundery activity is suppressed. The composite maps of geopotential height at 500 hPa isobaric surface would illustrate that dependence. For example, the summer of 2012 was hot and dry, (with a mean monthly temperature for the summer months of about 3–6 oC above normal and monthly precipitation mostly between 0 and 80% of normal amounts), with long periods of heat and drought in July and August due to persistent anticyclonic conditions over the region. This is best illustrated with the seasonal (three-month average for the three driest months of the year—July, August, and September) anomaly of the geopotential height at 500 hPa (Figure 6a). The year 2014 is among the three most thundery for the studied 10-year period, both in terms of the number of thundery days and the number of flashes. July 2014 was very thundery, with more than 400,000 detected flashes. During the period between May and September 2014, several natural disasters (such as devastating hailstorms, floods, hurricane winds, and tornadoes) causing human deaths and serious material damage occurred in Europe [16] and in Bulgaria [17]. The spring–summer of 2014 was slightly warmer than normal but very wet, with seasonal rainfall between 100 and 400% of the normal amount for most of the country. This was due to persistent cyclonic activity in the region and is best illustrated with the seasonal (three-month average for the three wettest months of the year—April, May, and June) anomaly of the geopotential height at 500 hPa (Figure 6b). The summer season being the time of year where most of the lightning activity takes place naturally reflects in high annual and summer monthly density and frequency of flashes. Figure 6c shows the anomaly of 500 hPa geopotential in the period of June–July 2018, which was very thundery. There was frequent cyclonic activity over the Balkans, coupled with anticyclonic anomaly over Northwestern Europe.

3.1.2. Diurnal Cycle

For convenience, the diurnal distribution in the present study is evaluated according to the Coordinated Universal Time (UTC). Bulgaria is in the Eastern European Time zone (EET), which means that the local time in the cold half of the year is 2 h ahead, and in the warm half of the year, 3 h ahead of UTC. Figure 7 shows the diurnal distribution of detected flashes over the studied domain for the period 2012–2021. About a third of all flashes (31.3%) were detected between 12 and 15 UTC. It is almost universally valid for the studied years and for most months. The only exception is the month of December, when the highest percentage of flashes (more than 35%) are detected between 18 and 21 UTC, while only 10% are between 12 and 15 UTC. The number of days with lightning activity in the time interval between 12 and 15 UTC is also the highest (Figure 8). However, the situation is not the same for all months. In the winter months of January and December, the time interval with the highest number of days with detected flashes is between 21 and 24 UTC, and in November, between 03 and 06 UTC. In July, the highest number of TD flashes is between 15 and 18 UTC. The inter-month variations of the daily lightning maximum are related to the nature of thunderstorms in different seasons. In summer, the day heat is a major driving factor in the case of larger scale atmospheric dynamics favoring instability. That is why the lightning maximum falls in afternoon. In winter, only intense weather systems, such as cold fronts usually coming from the Mediterranean providing a source of energy and water vapor for generating convection, can allow thunderstorms to build up and provoke out-of-season lightning. Such weather systems are not day-time dependent, which results in random average daily maximum time.

3.2. Spatial Distribution of Thunderstorm Activity over the Region of Bulgaria

For the evaluation of the spatial distribution of lightning activity, lightning data were separated upon a grid with a resolution of 0.05 deg. Figure 9 shows the annual distribution of flash density (number of flashes per km2 on a grid of 0.05 × 0.05 deg per year). It is visible that over a large part of the domain the flash density is below 1 fl/km2 during 2012. However, in 2012, the maximum of the flash density is relatively high (15 fl/km2) in comparison to those in 2013 (12 fl/km2), 2015 (13 fl/km2), and 2020 (11 fl/km2). In 2012, thunderstorms were fewer but more severe, concentrated mainly over the mountains of Stara Planina and Rhodopes. During 2013, flashes are distributed over a larger part of the domain, but the maximum flash density is low in comparison with the other considered years. The year densest with lightning is 2018, mostly over mountainous regions, with considerably high flash density (19 fl/km2). However, 2016 is the year with the highest flash density (21 fl/km2), mainly due to a severe thunderstorm that formed over the Romanian coast during the night of 19 September. The mean (2012–2021) annual flash density distribution shows that more lightning is detected over mountains (with a maximum of 6.3 fl/km2), while less (about 1 fl/km2) occurs over the sea.
Figure 10 shows the number of days with detected flashes (TD) over each square of 0.05 × 0.05 deg (~5 × 5 km). The number of TDs over the mountains is greater than over other regions. The year with the highest number of TDs, 2019 (Figure 2), is with a relatively low maximum of TDs per 25 km2–31 TD per 25 km2, which is almost the same for 2015, the year with the lowest number of TDs (max = 30 TD per 25 km2). This shows that in 2019 thunderstorms formed over more spread-out regions, while in 2018, the year with the highest number of TDs per 25 km2 (44 TD per 25 km2), they were more concentrated over the western mountainous regions.
As the results for the spatial distribution of lightning activity showed approximately a good correlation between flash density and terrain orography, ATDnet lightning data were considered to see additionally their relationship with terrain altitude. In order to accomplish this task, the average altitudes of the considered pixels of 0.05 × 0.05 deg of the grid were connected with the lightning data corresponding to these pixels and were evaluated. Topography is taken from the 30 arc seconds (1 km) digital elevation model [19]. Figure 11 shows a box and whiskers plot of the number of detected flashes as a function of the average altitude on a grid of 0.05 × 0.05 deg. The width of the boxes corresponds to the number of the pixels at a given average altitude to the square root of the sample size. The bottom and top of the boxes show the first and third quartiles, the band inside the boxes shows the median, and the ends of the whiskers, respectively, the lowest and highest data within 1.5 IQR (interquartile range) of the lower and upper quartiles. From the figure, it is visible that there is an increase in the number of detected flashes with the increase in the average terrain altitude until 1800 m, followed by a slight decrease in number of flashes at altitudes above 1800 m. Similarly, the number of thunderstorm days (TD) increases with the increase in terrain altitude until 1900 m, and then decreases for altitudes above 1900 m (Figure 12). This behavior of lightning activity over Bulgaria could be explained by the dependency of lightning activity on the terrain slope established in [20]. The mountainous regions favor the development of thunderstorms by the rising of warm moist air from the surface up the slope of the mountain. Then, the formed thunderclouds tend to precipitate on the windward side of the mountain without crossing it, which could explain the decrease in lightning activity above 1900 m.
Figure 13 shows the mean monthly spatial distribution of lightning flash density. During the cold half of the year (January, February, March, October, November, and December), the highest flash density is over the Greek side of the Rhodopes. For December, all flash densities over Bulgaria are below 0.1 fl.km−2. During the warm half of the year (April–September), lightning is spread over the whole considered region, and is denser over land and over the western part. The highest flash densities are in June (2.6 fl.km−2 over the Rhodopes) and July (2.5 fl.km−2 over Stara Planina). The number of TDs per 25 km2 (Figure 14) during the cold half of the year is higher above the southern part of the domain, precisely over the Rhodopes, due to moist and warm air masses from the Mediterranean. The maximum of days with thunderstorms migrates within the warm half of the year. In May, it is over the northern part of Bulgaria. In June and July, most thunderstorms occur over the western part of the studied domain, in August, over the southwestern part, and in September, over the southern and southeastern part and over the sea (due to relatively warm sea water in late summer and early autumn).
Figure 15 shows the diurnal distribution of flash density over the domain for the period 2012–2021. The highest flash density is between 09 and 12 UTC (19.2 fl.km−2—over the Rhodopes). However, the densest graph is that for 12–15 UTC, with more pixels with flash density above 10 fl.km−2. The maximum flash density detected between 00 and 03 UTC is over the southern coastline. Between 21 and 06 UTC, the flash density is below 0.4 fl.km−2 over a large part of the land, while between 09 and 21 UTC, it is above 1 fl.km−2 over almost the whole domain. The bottom right graph from Figure 13 shows the diurnal distribution of the maximum flash density for the studied domain. It is visible that over the larger part of the domain, the maximum flash density is between 12 and 15 UTC. However, over some regions from the northern, central, southwestern, and southeastern parts, the highest flash density occurred between 15 and 18 UTC. Over a part of the Rhodopes, the maximum flash density is between 09 and 12 UTC, while over the mountain of Rila, it is between 03 and 06 UTC. During the same time interval, the highest flash density is above the southern coastline, which is in accordance with the assumption in that the early morning flash density peak is associated mainly with flashes over sea [21]. However, over the northern part of the sea, the highest flash density is between 15 and 18 UTC.

4. Conclusions

In the present study, the lightning activity based on data from ATDnet over the territory of Bulgaria for the 10-year period between 2012 and 2021 is evaluated. Data were considered as number of detected flashes and number of days with at least one detected flash—thunderstorm days (TD). Our results show that:
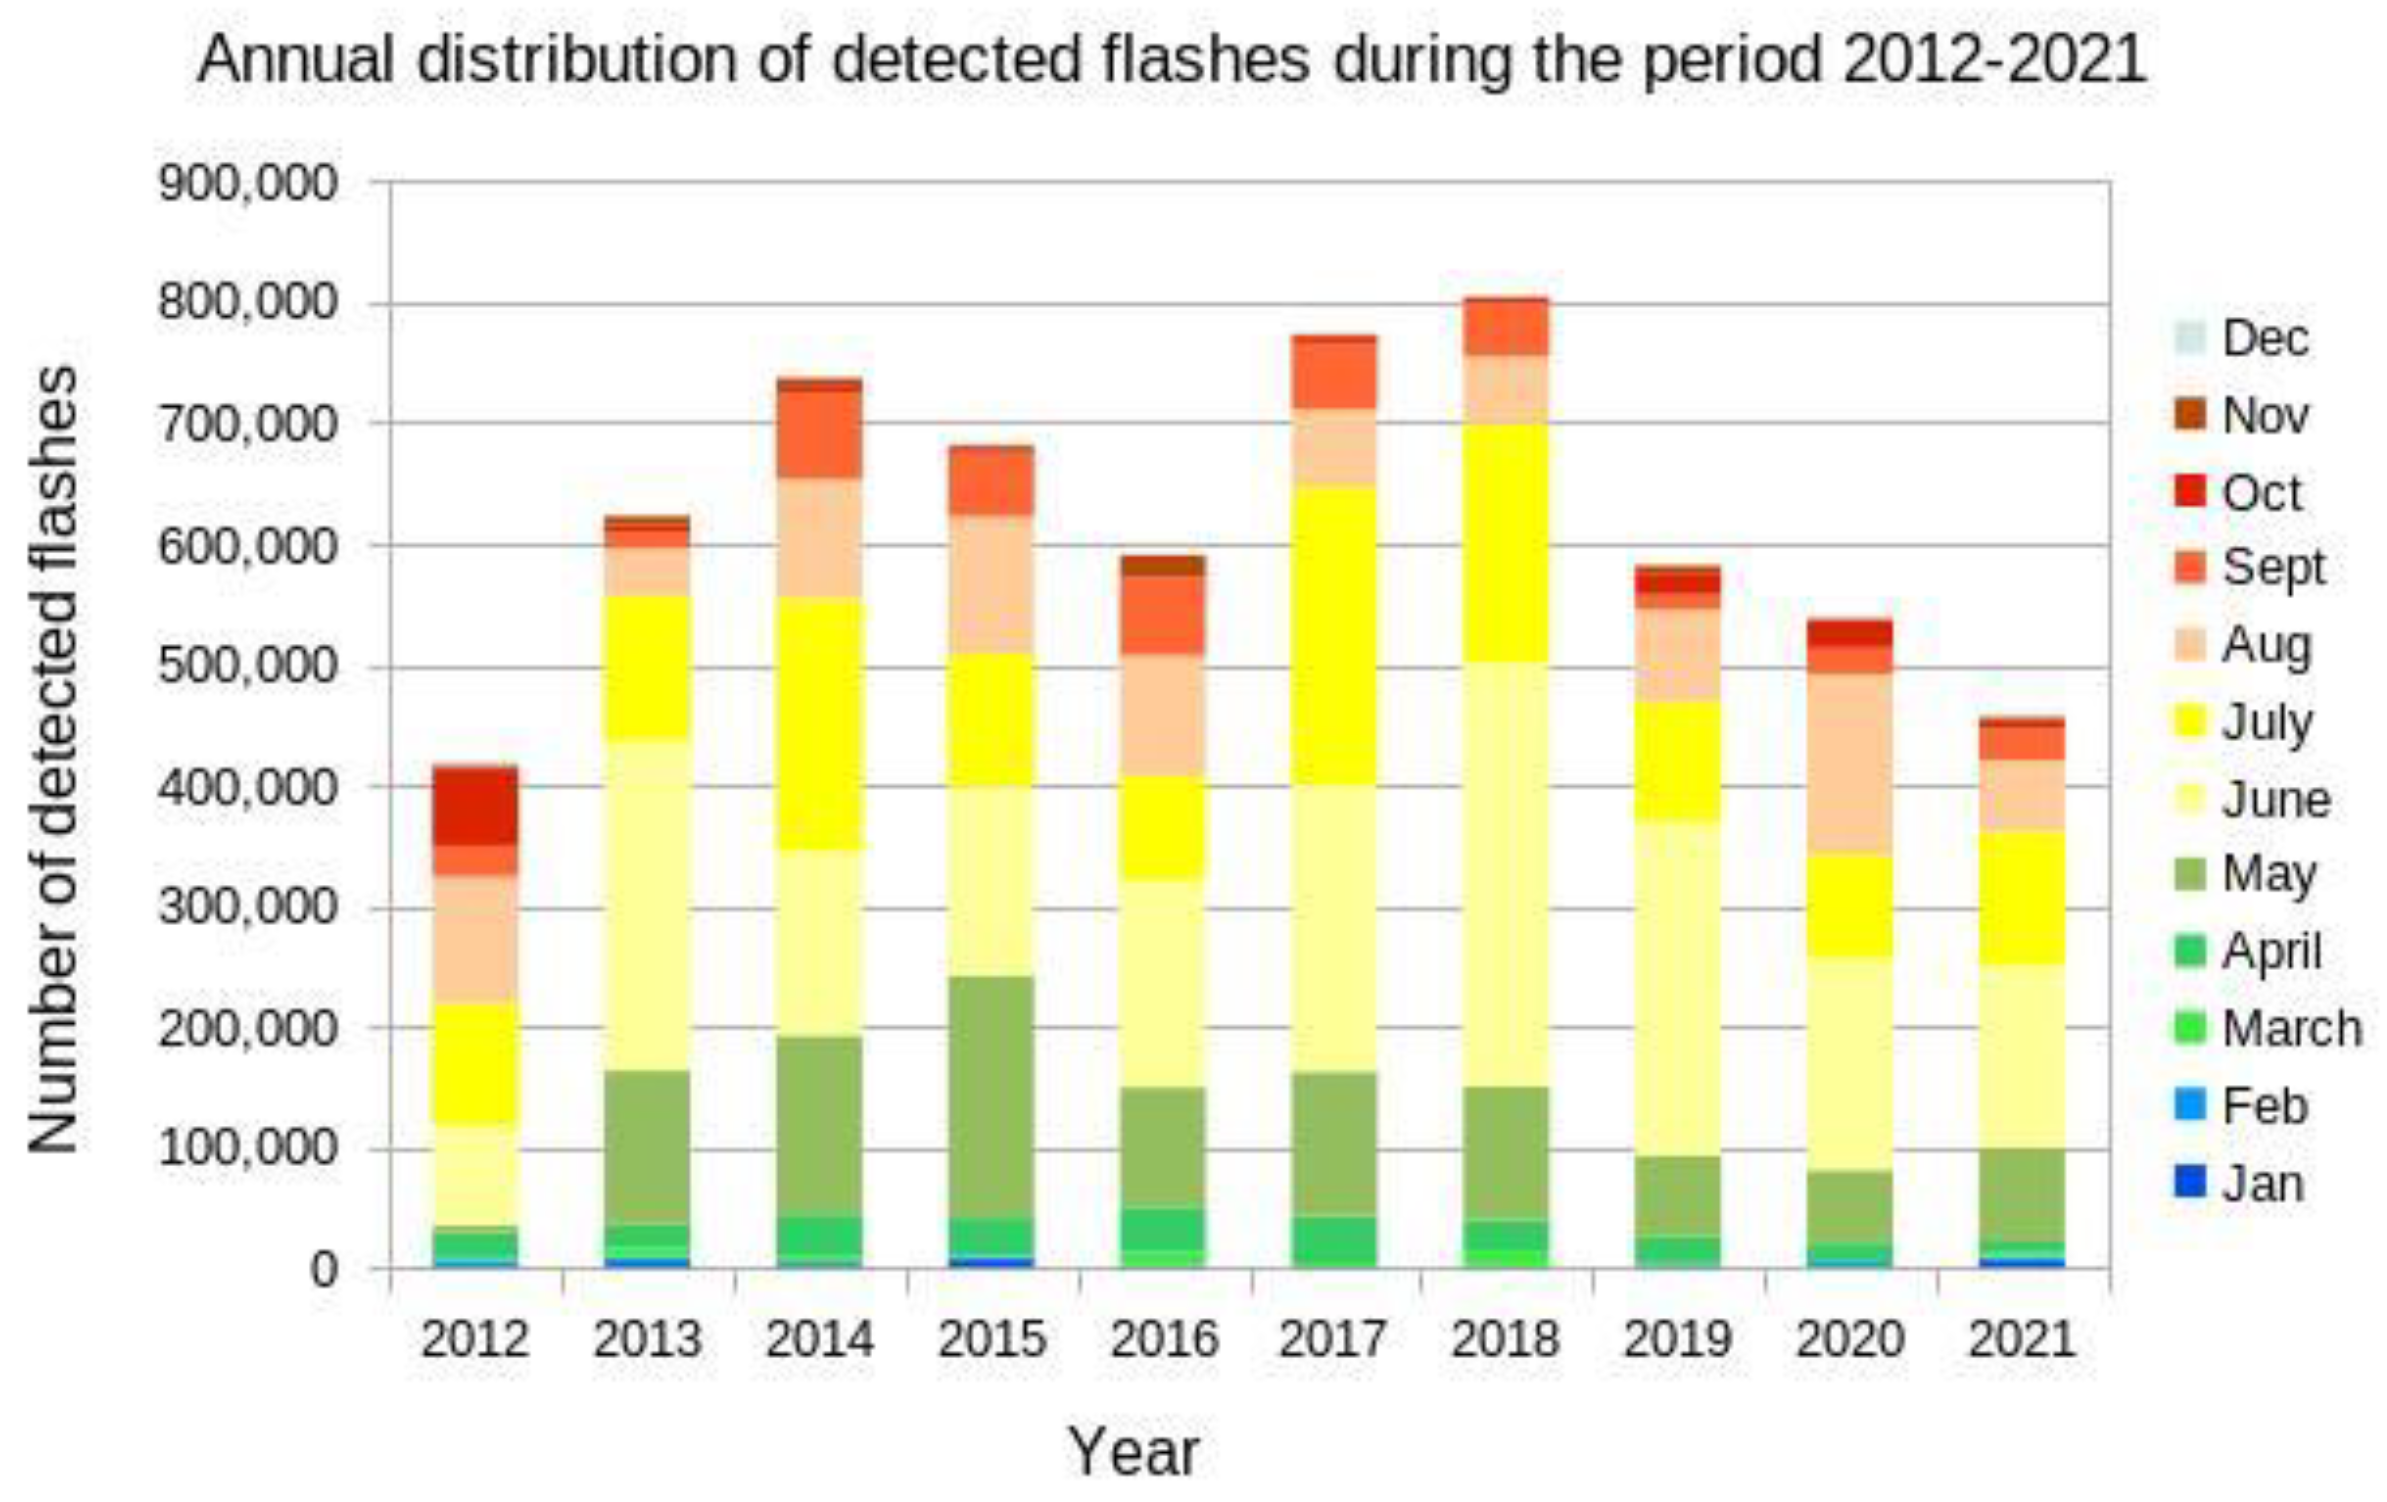
  • The mean number of detected flashes over the studied region is around 600,000 (exactly 620,763) flashes per year;
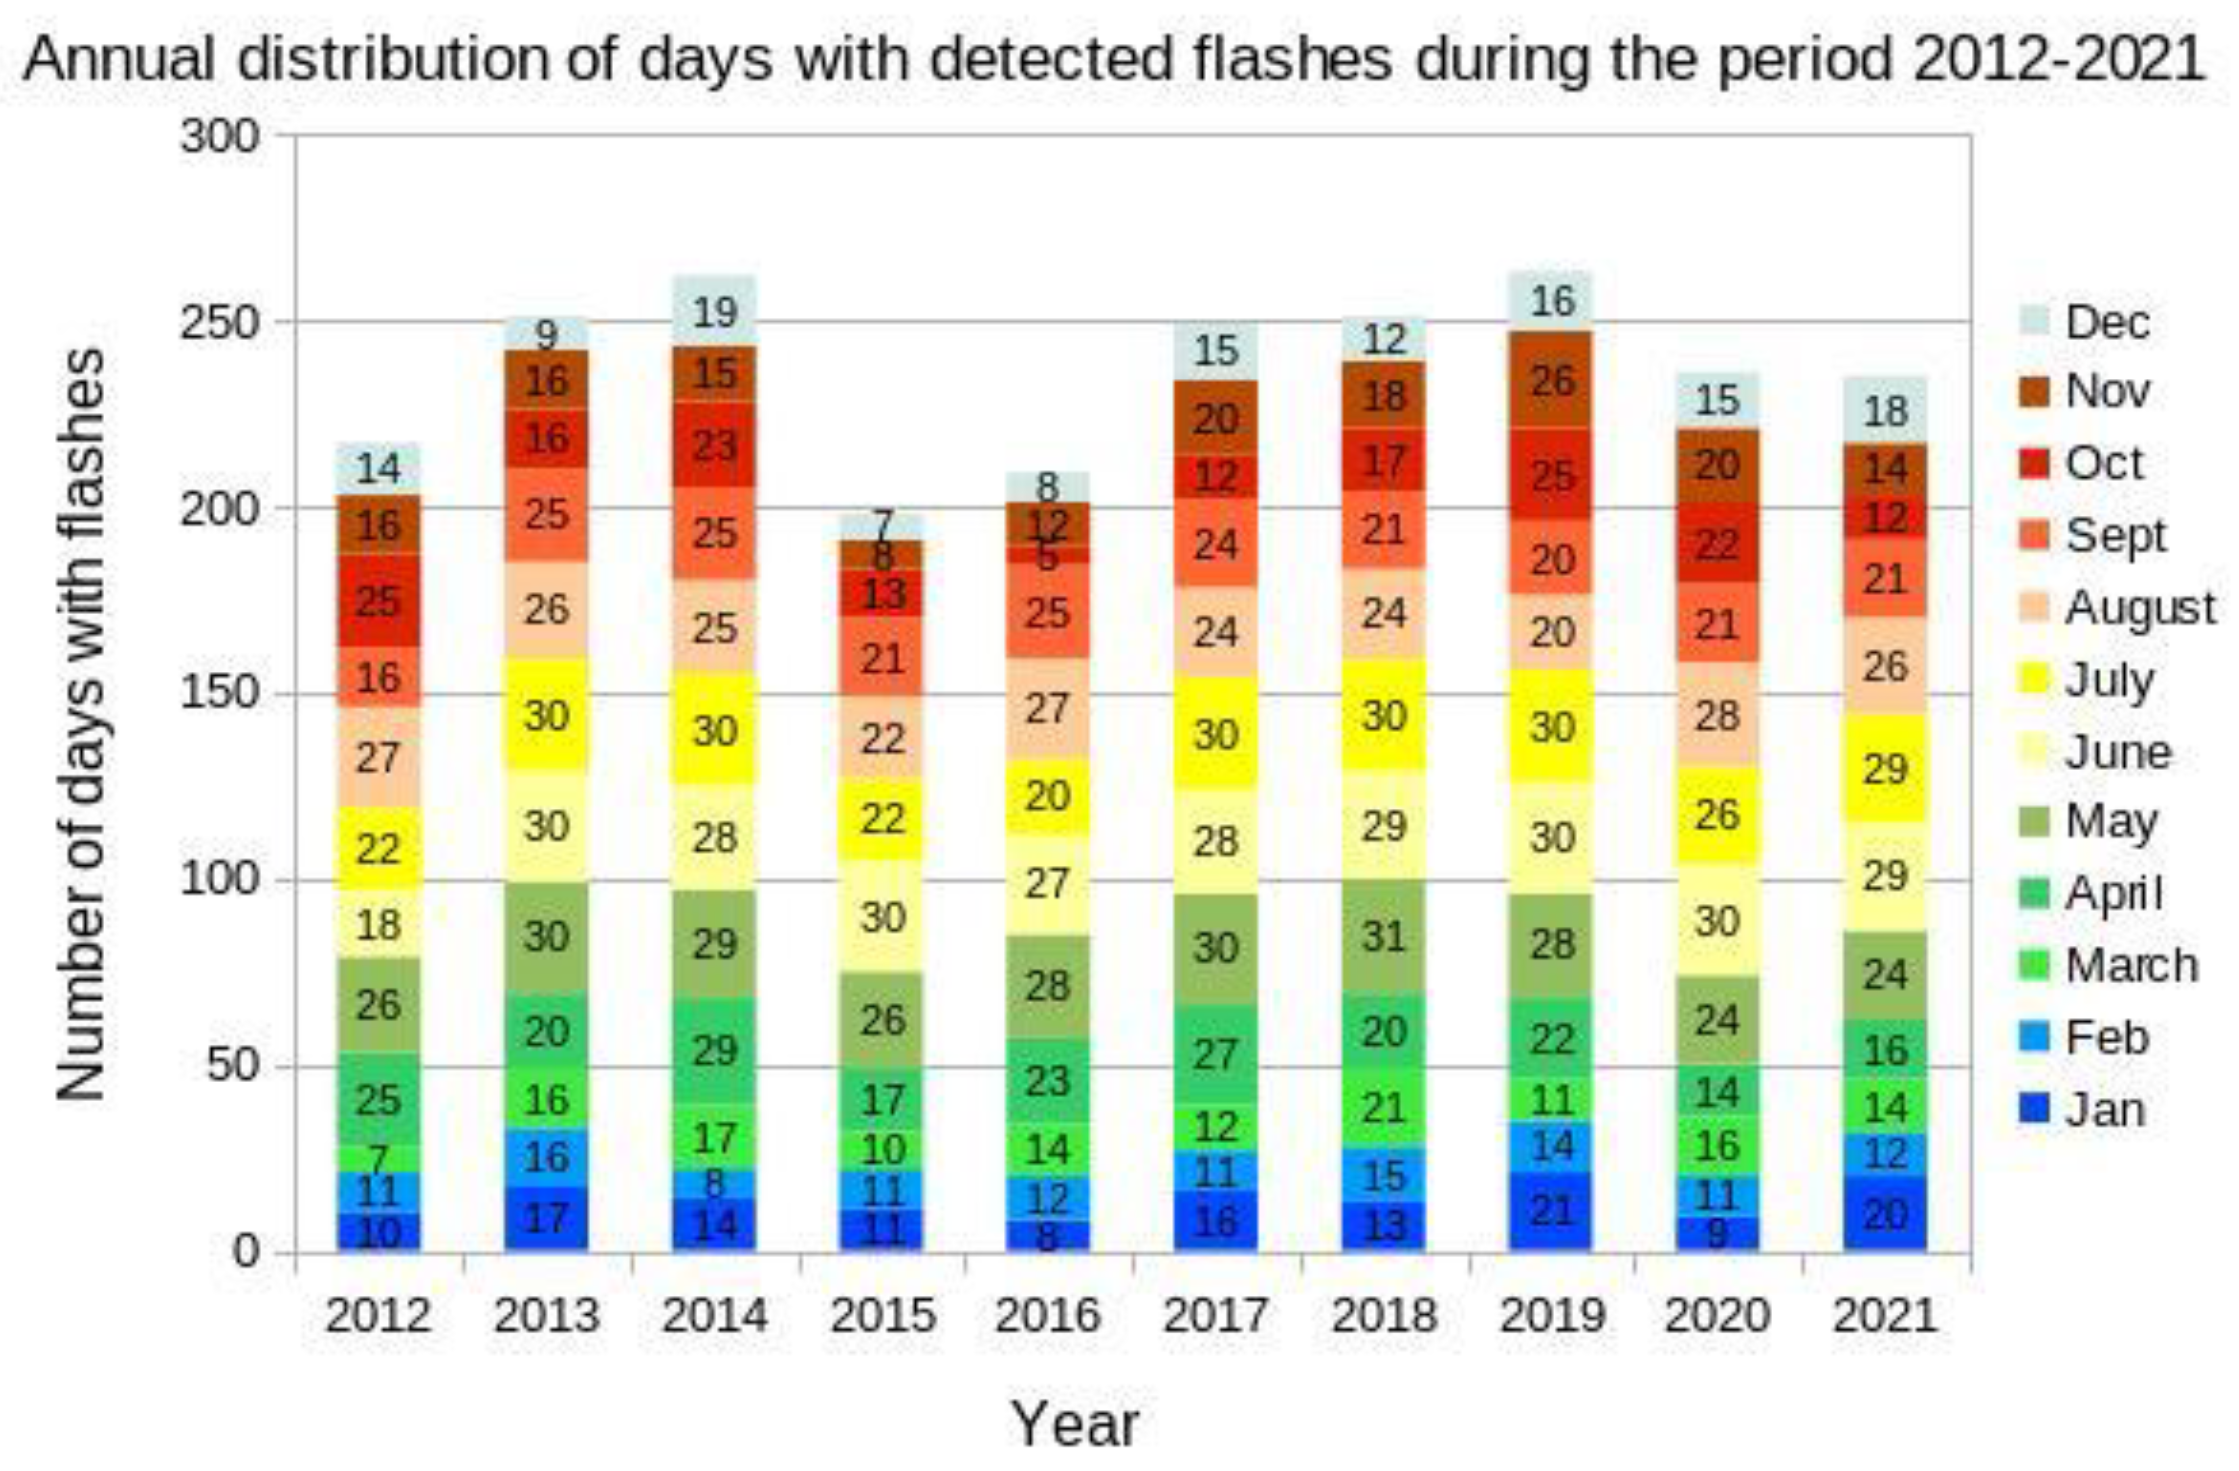
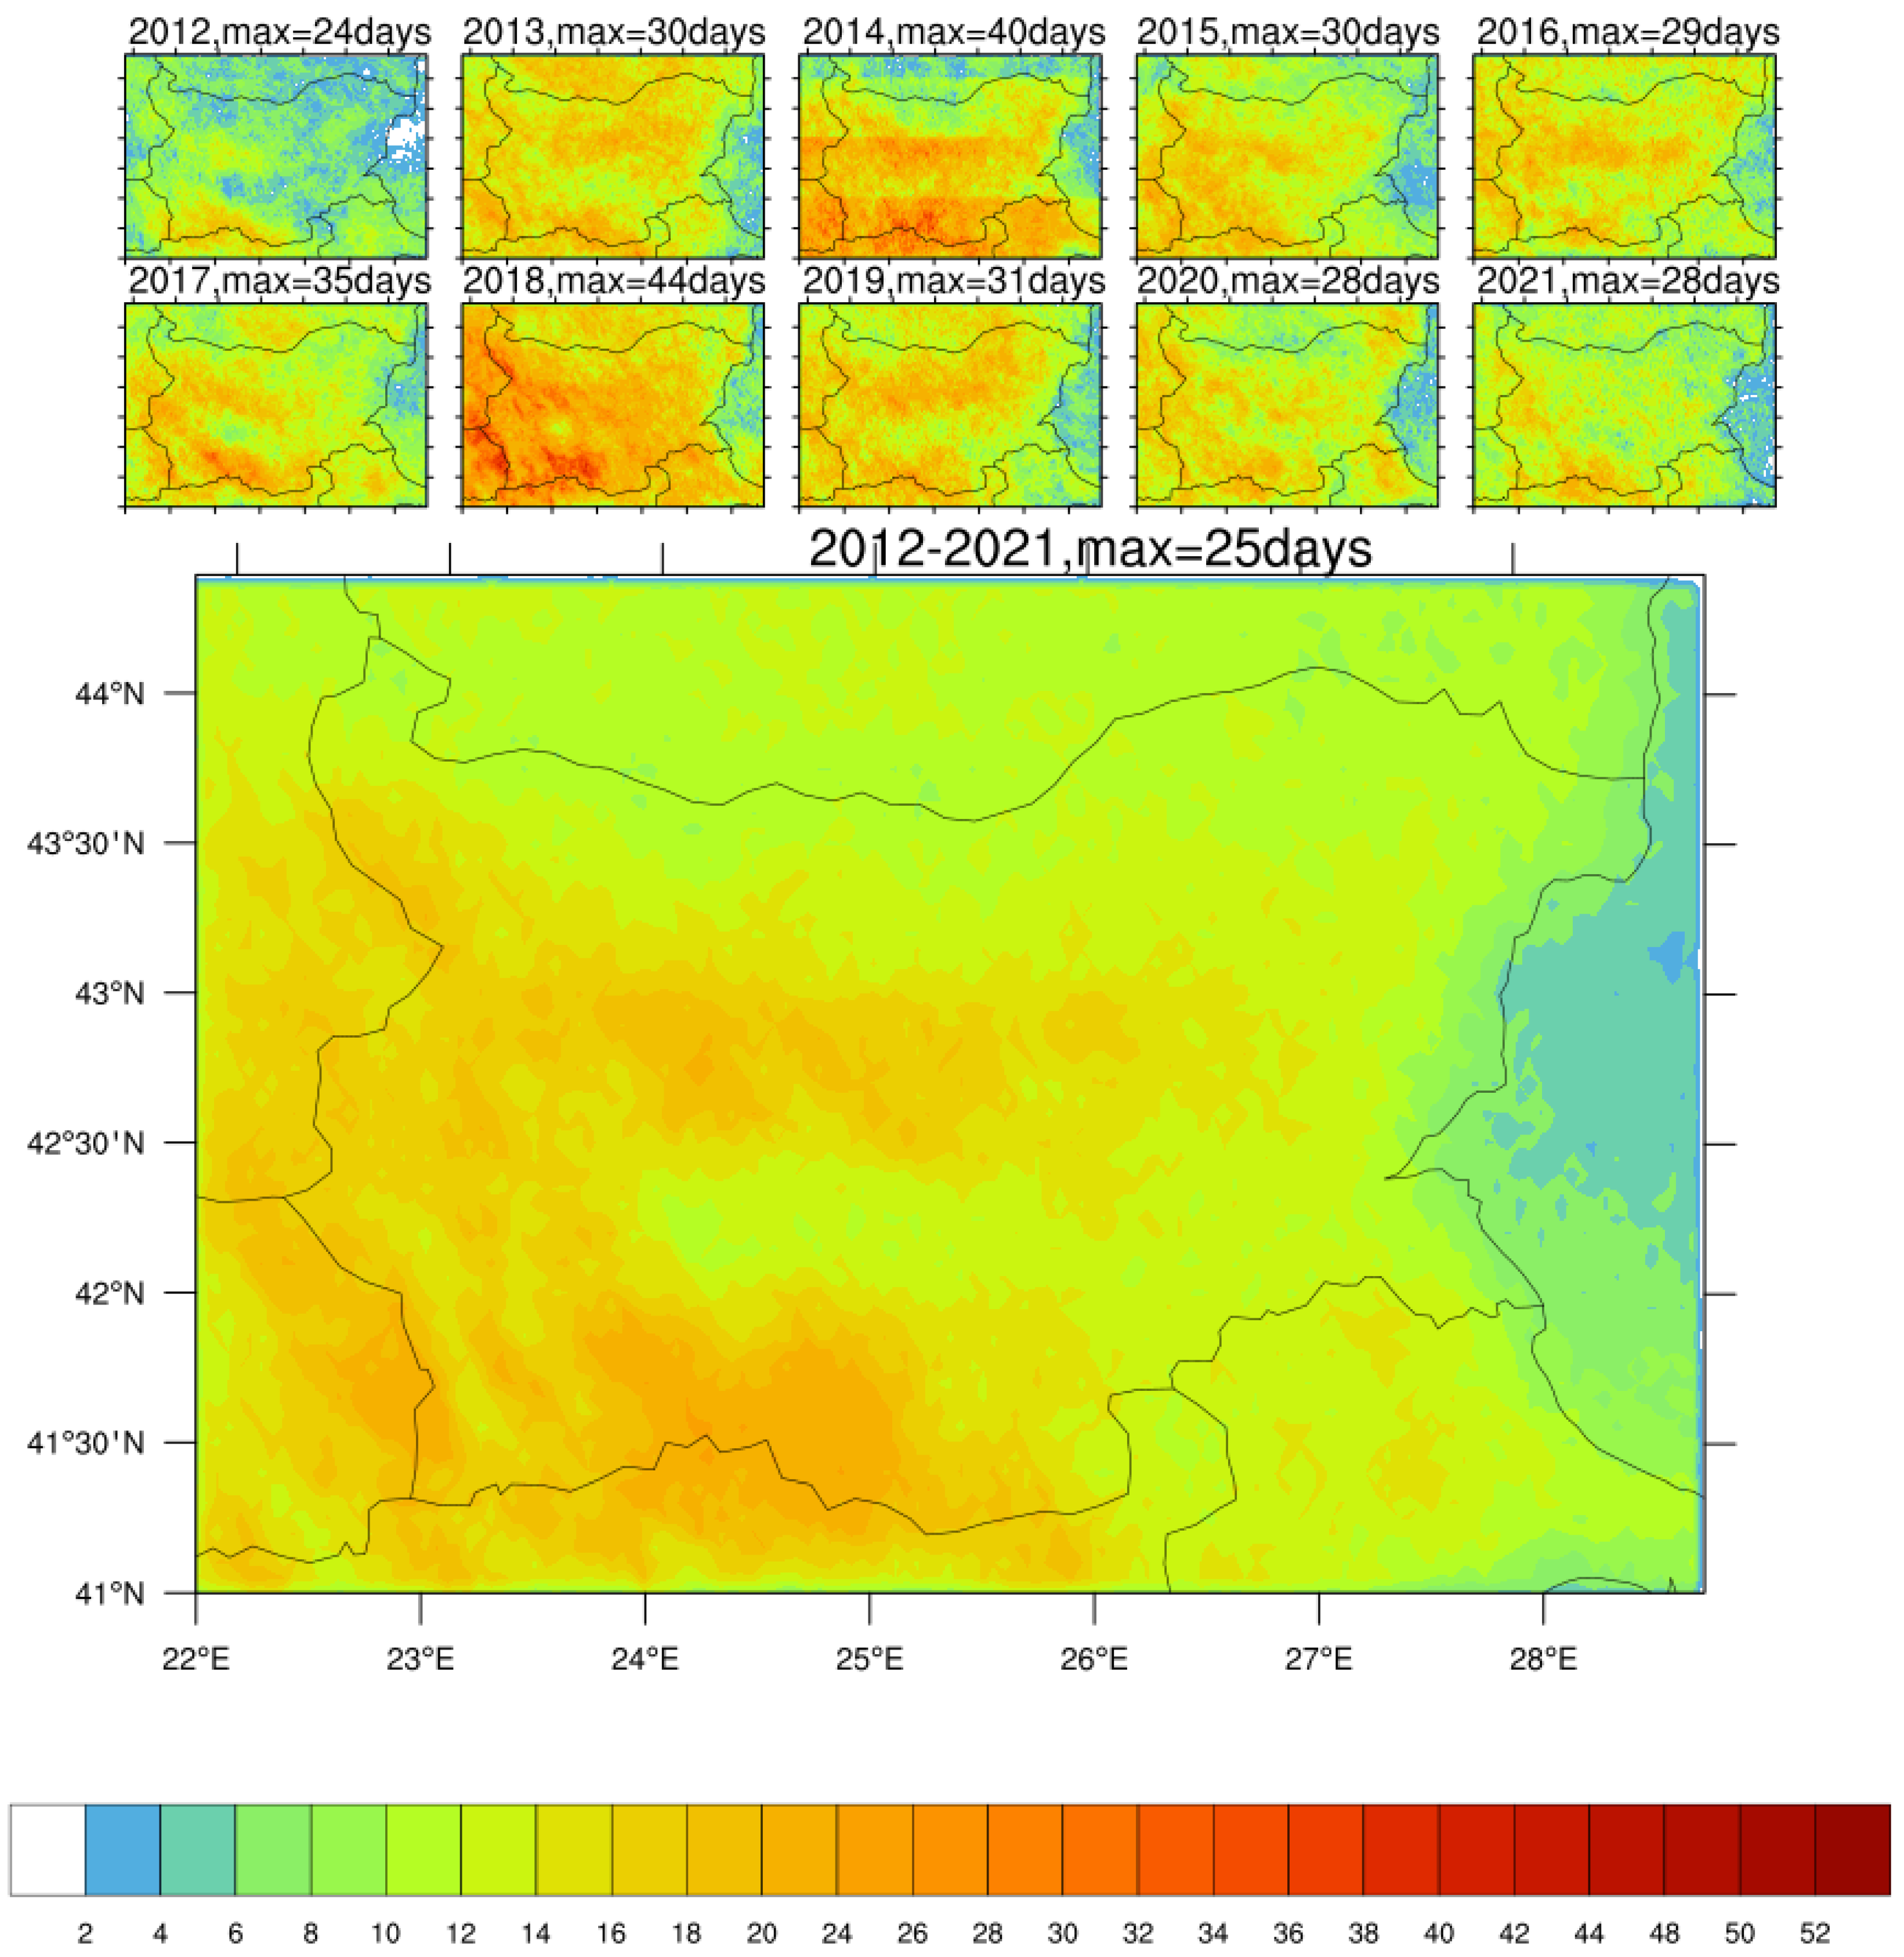
  • The mean number of thunderstorm days (TD) over the studied region is 237 TD per year;
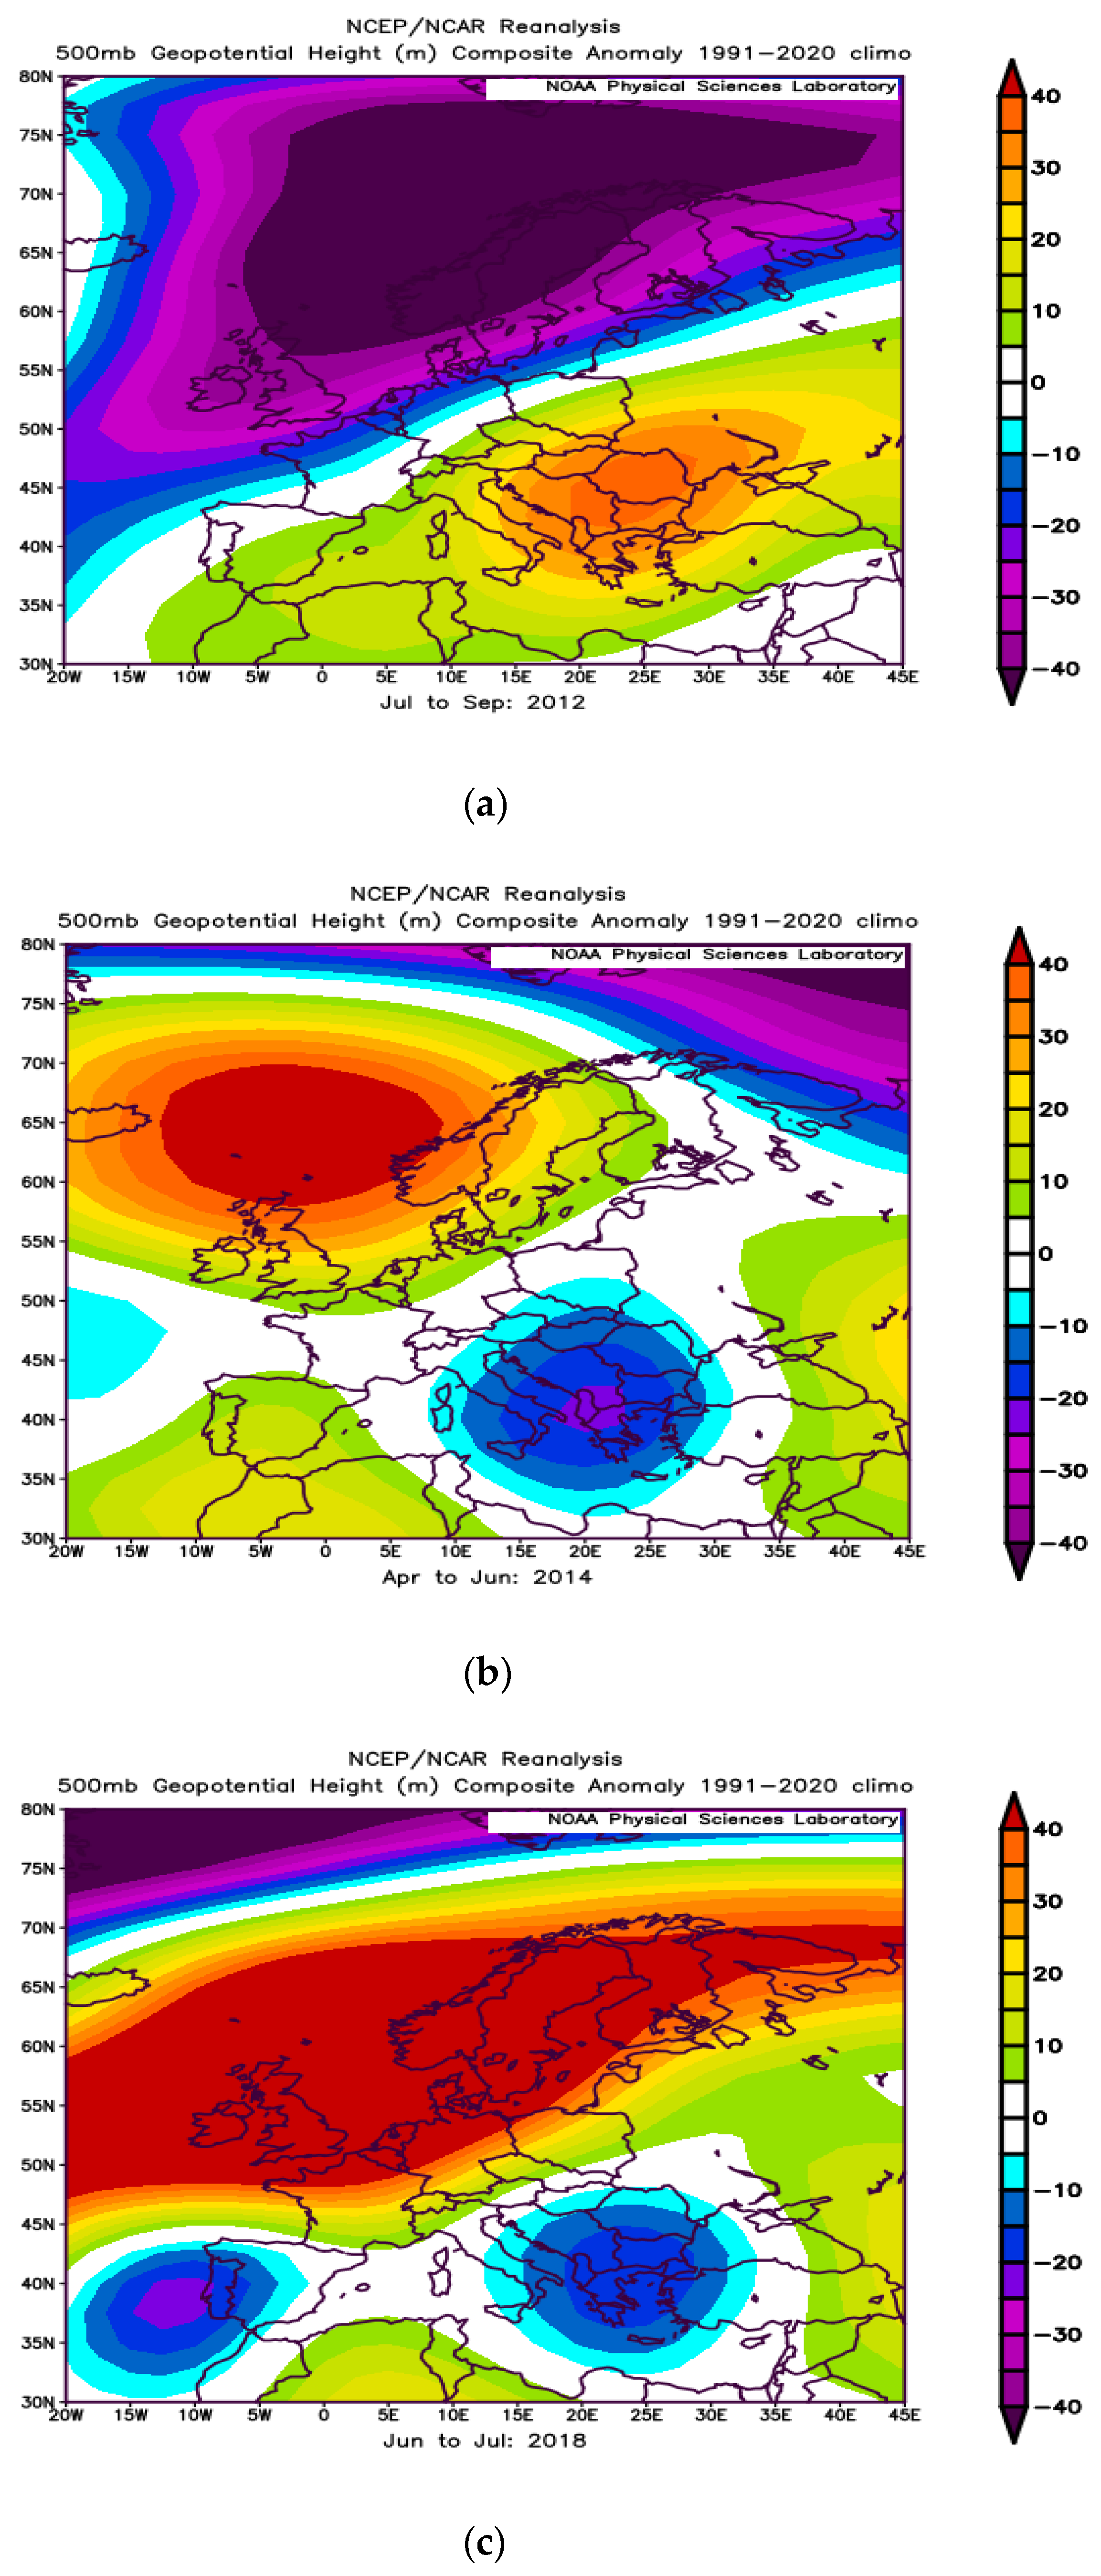
  • From the considered period, 2018 is the year with the highest number of detected flashes (~8,000,000 flashes), and 2019 is the year with the highest number of TDs (263) over Bulgaria;
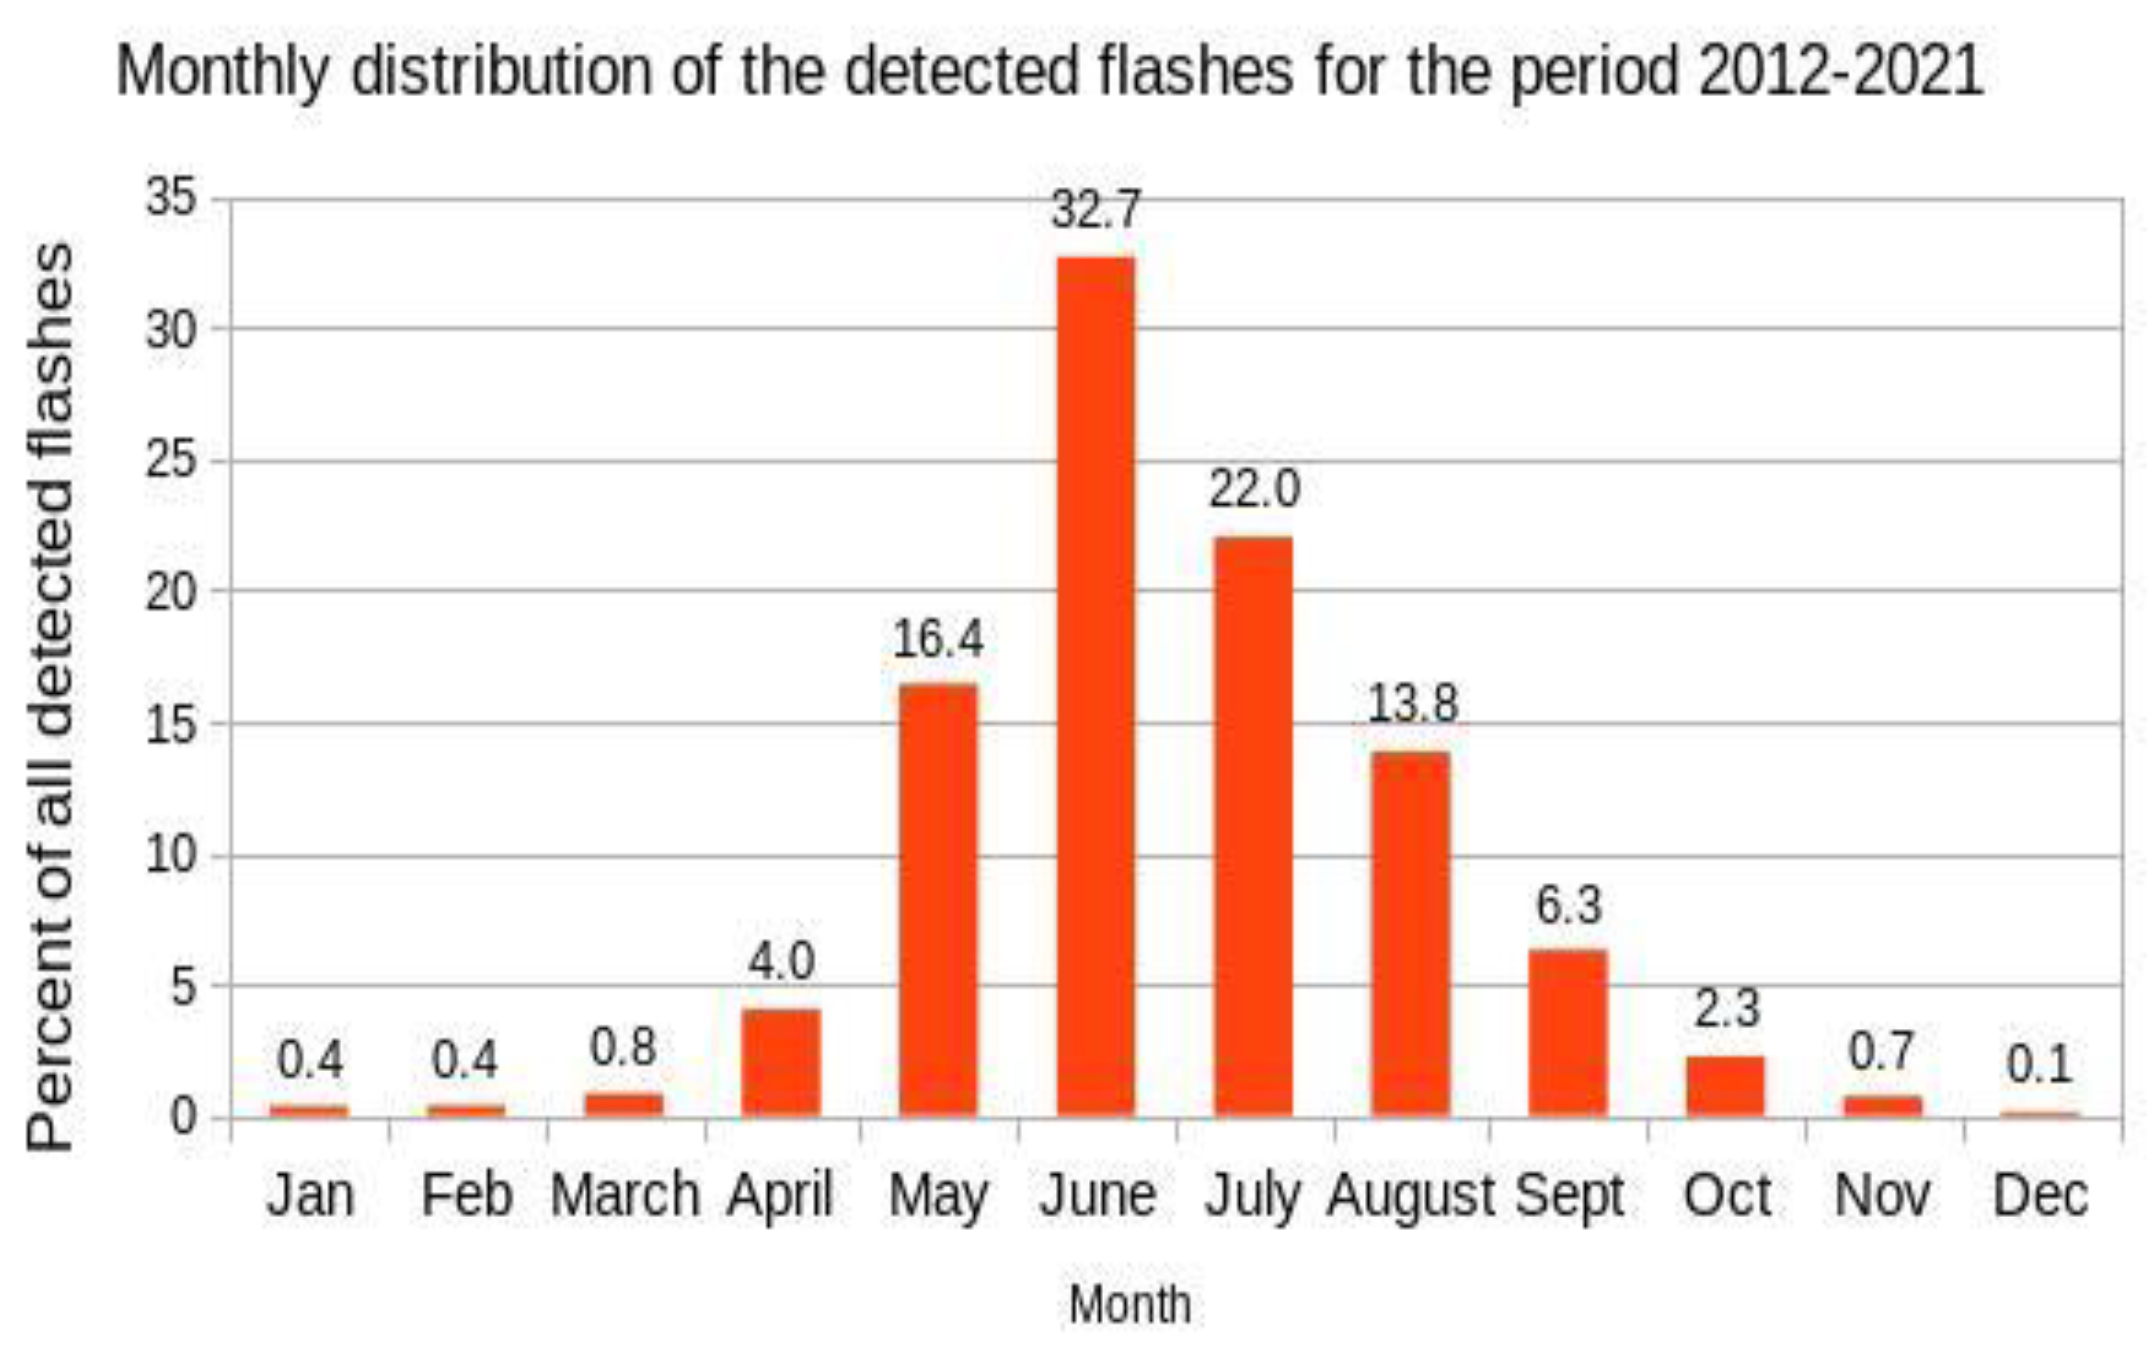
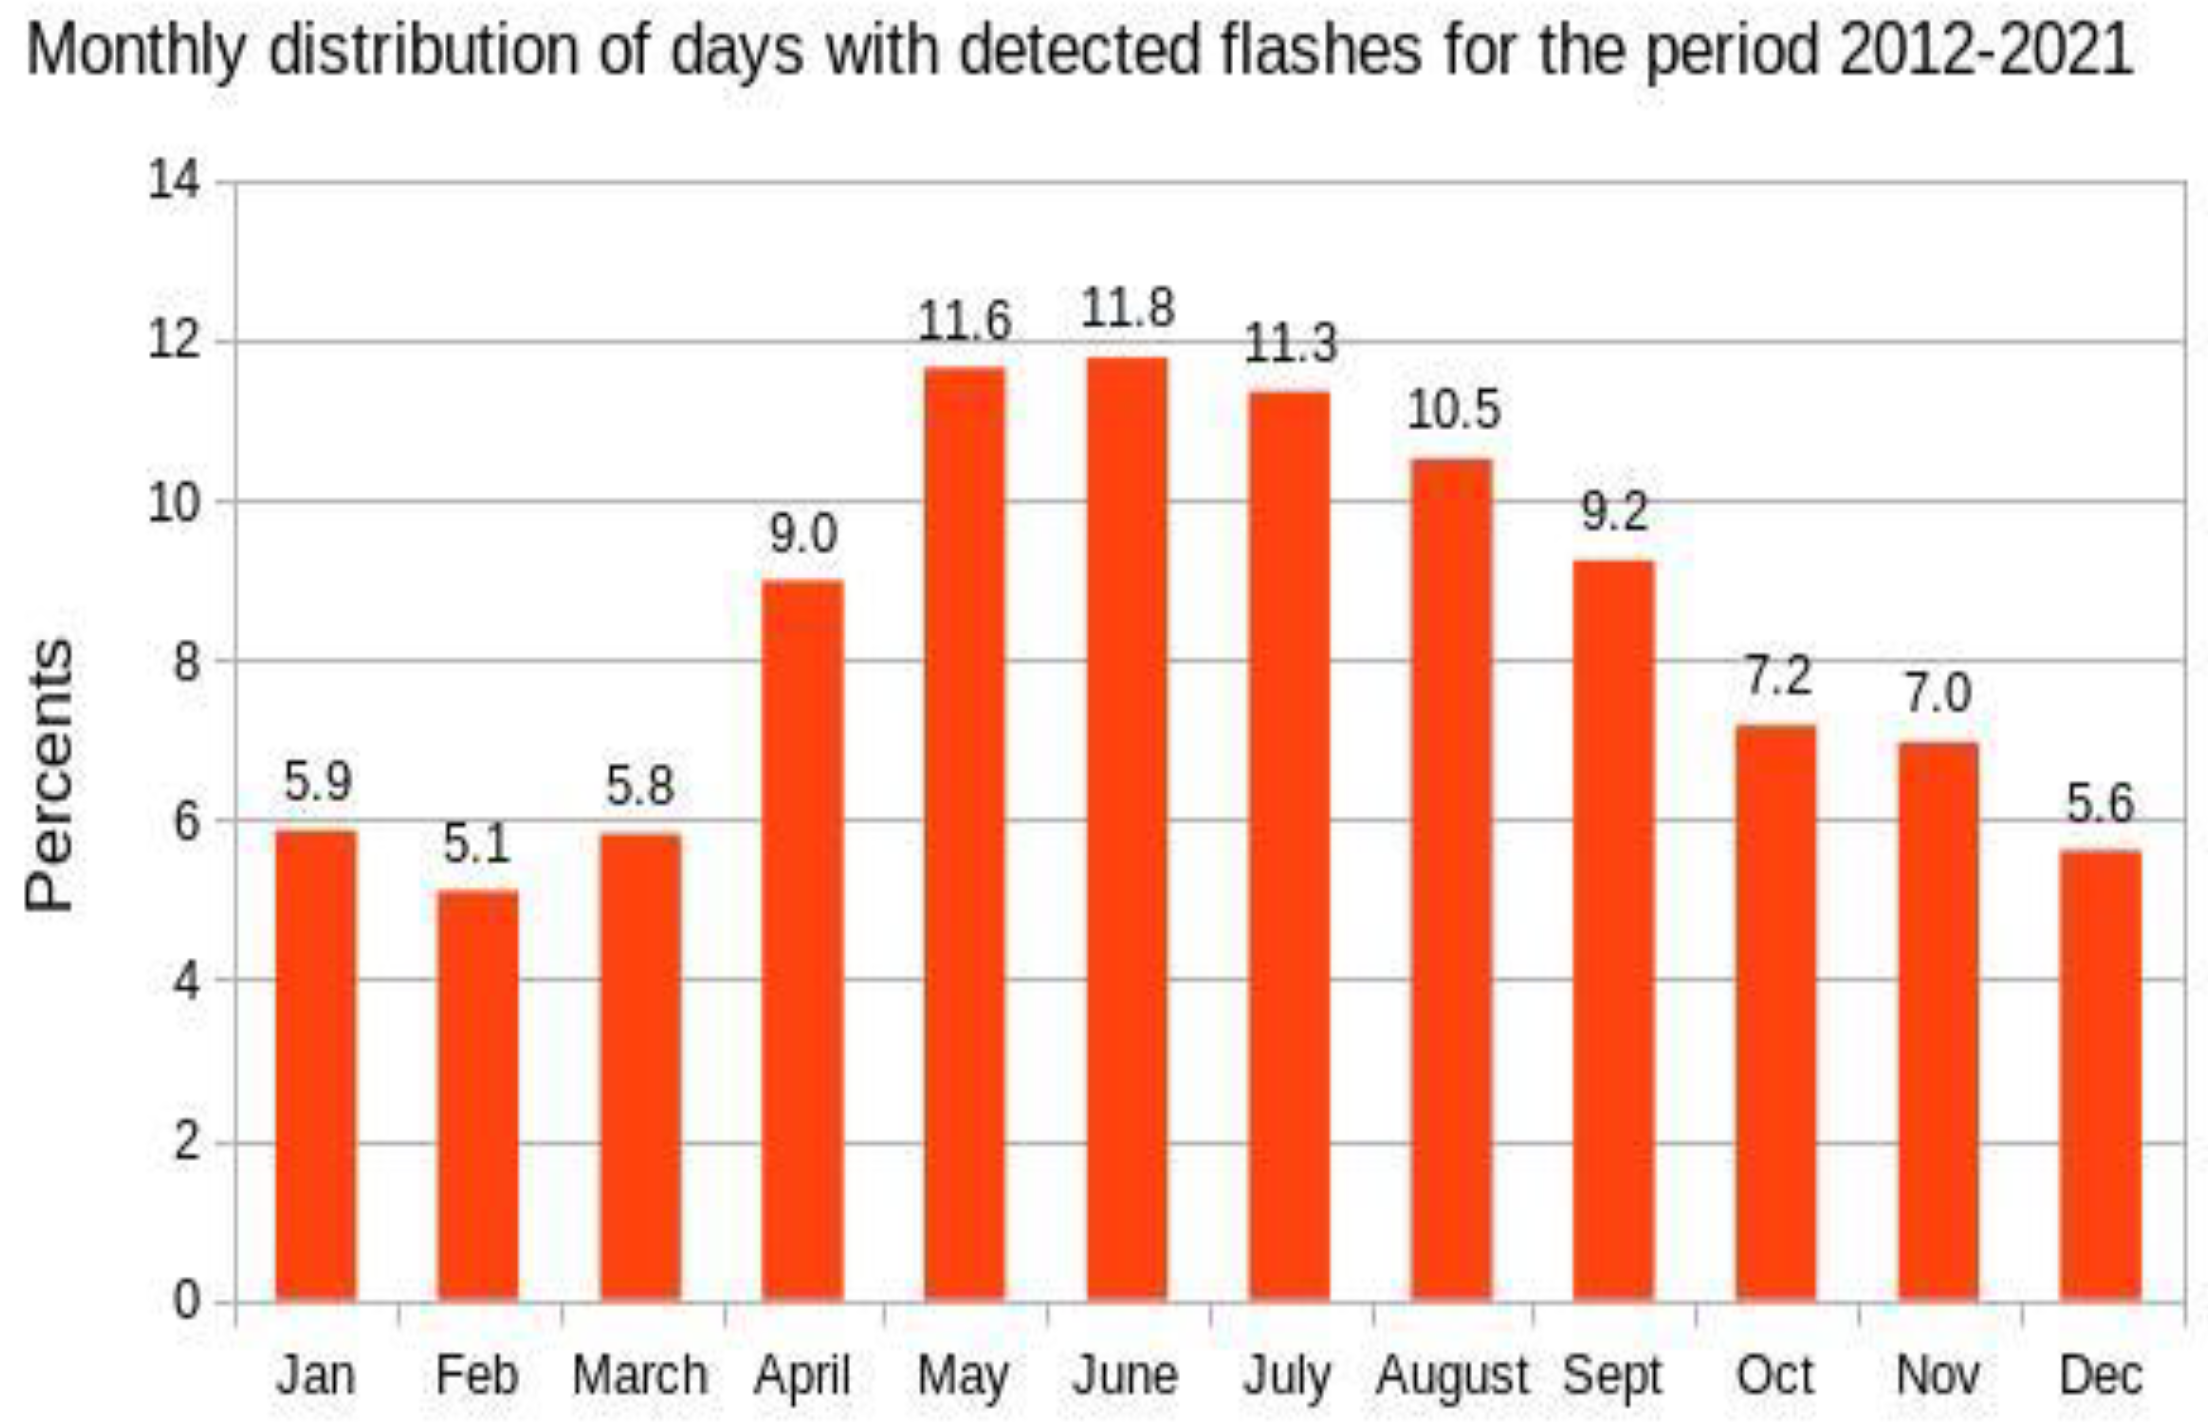
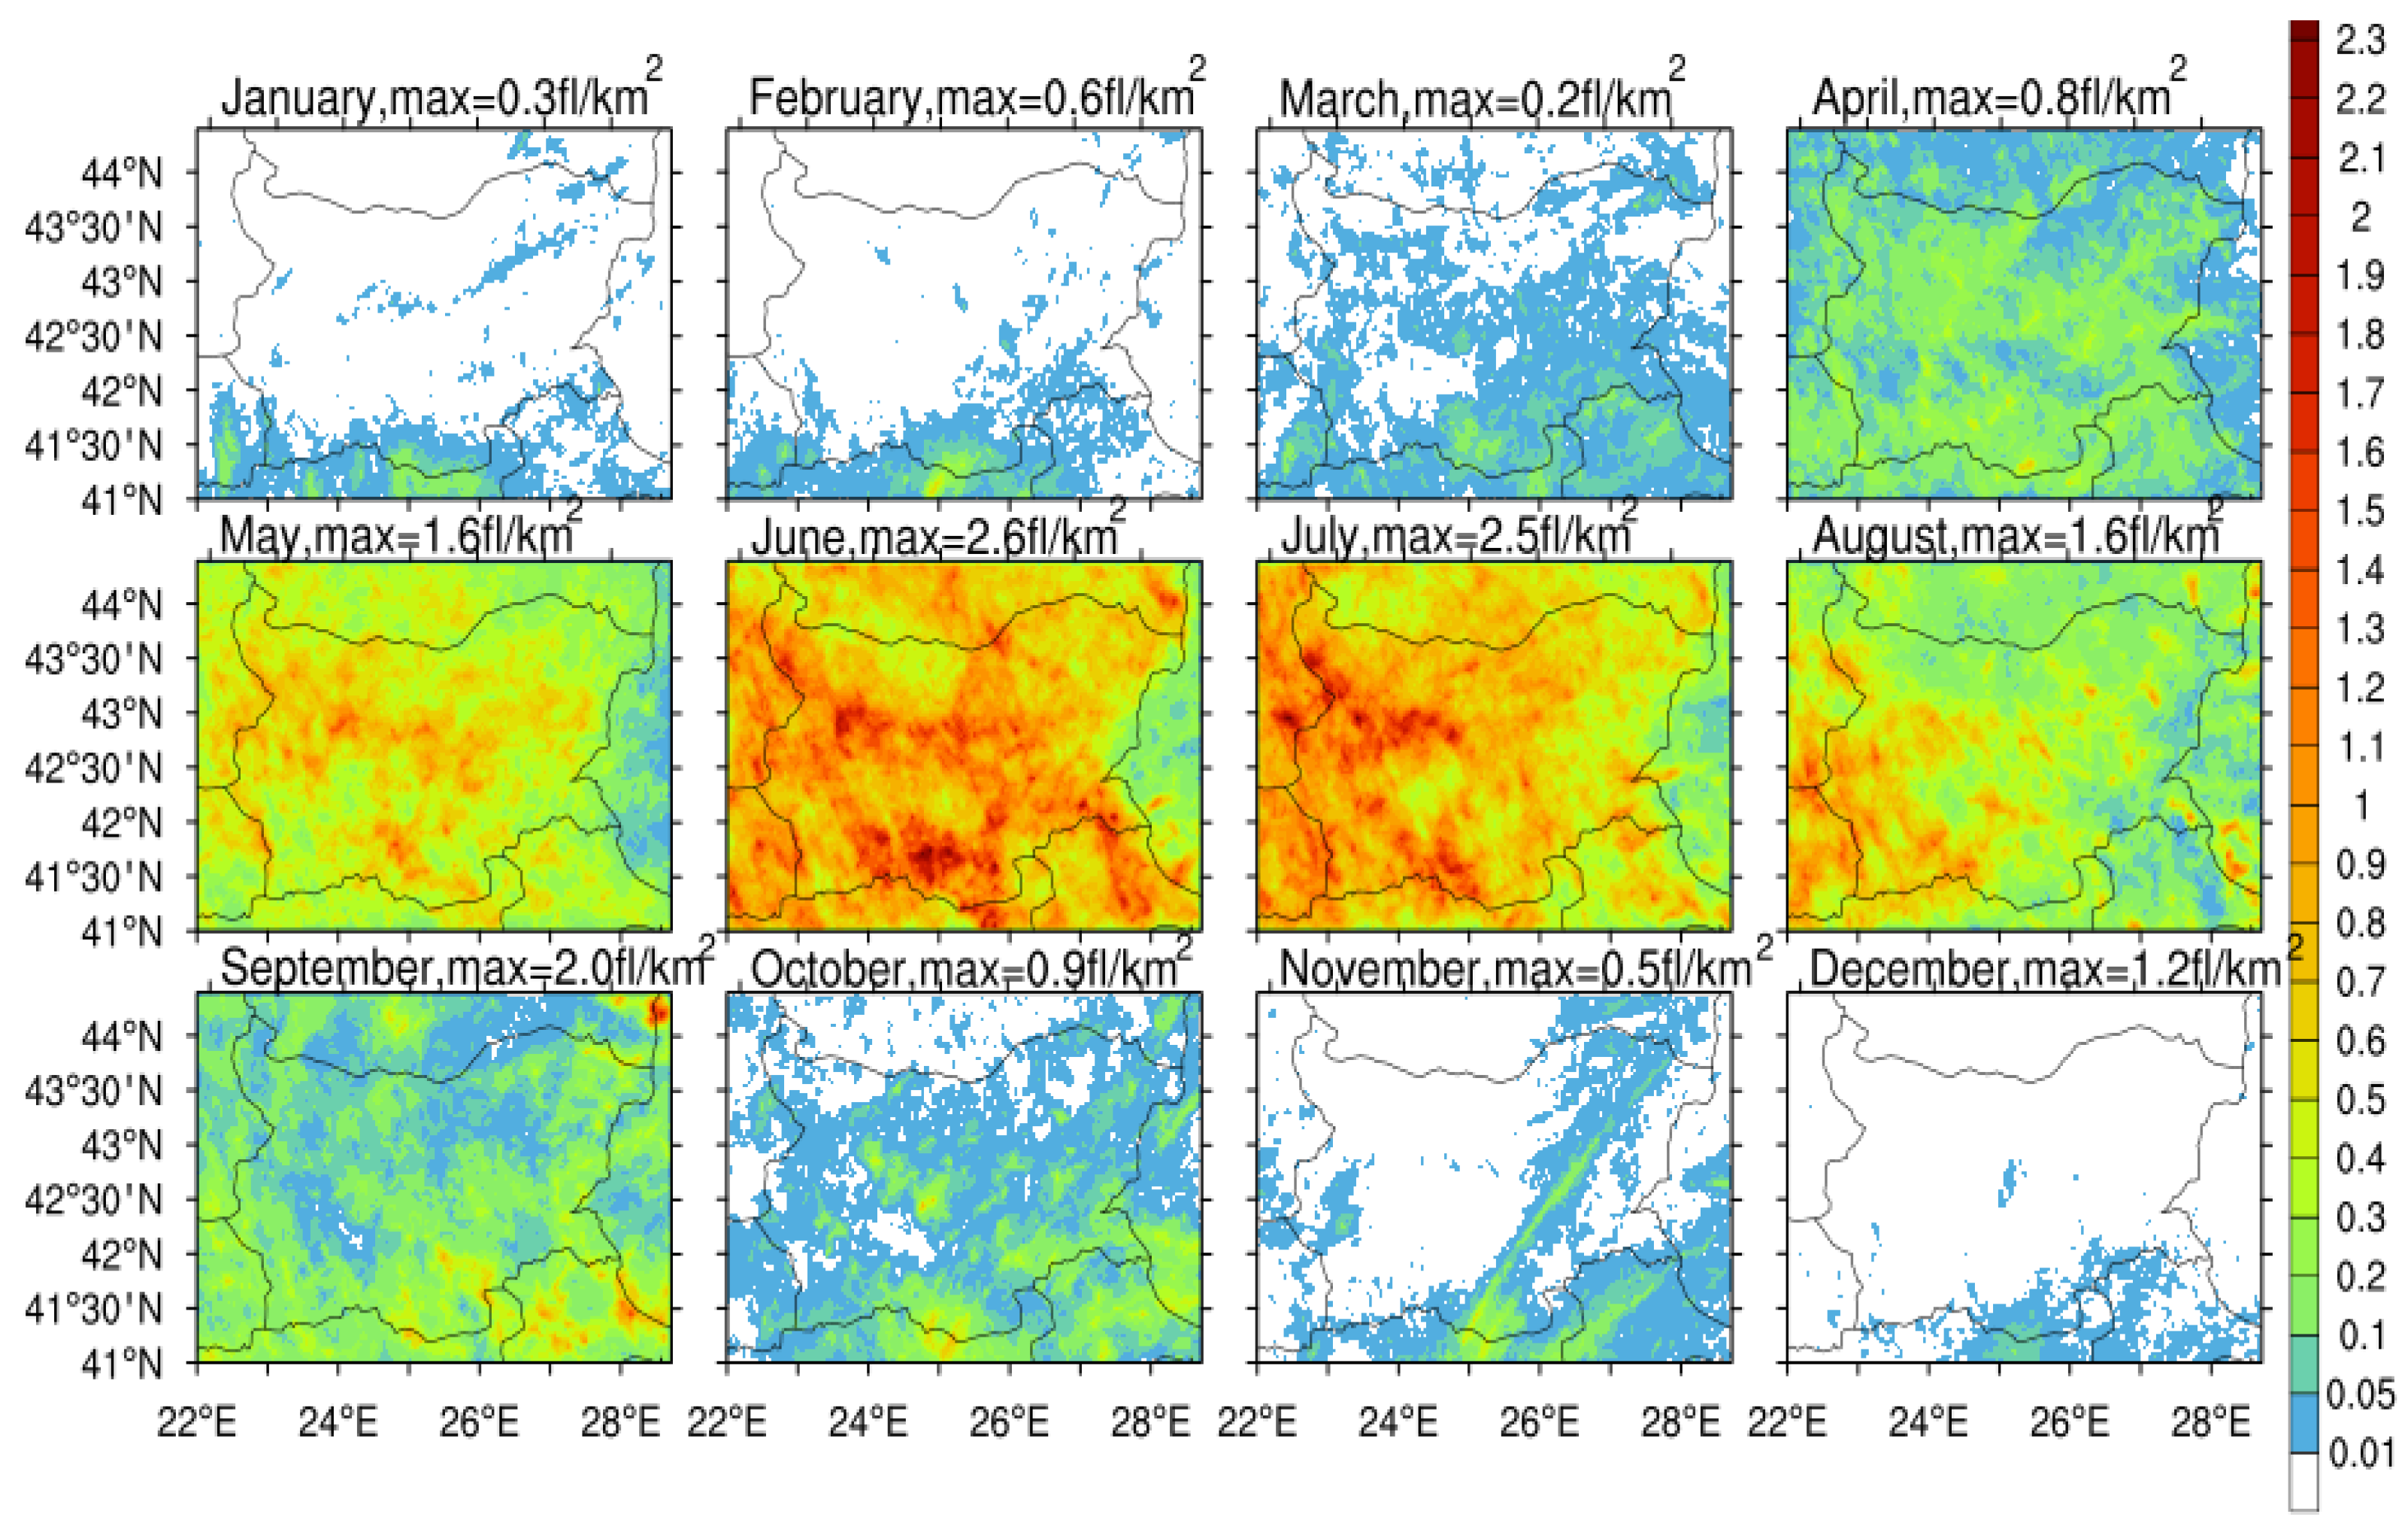
  • More than 95% of the flashes over Bulgaria are detected during the warm half of the year (about 60% during June and July);
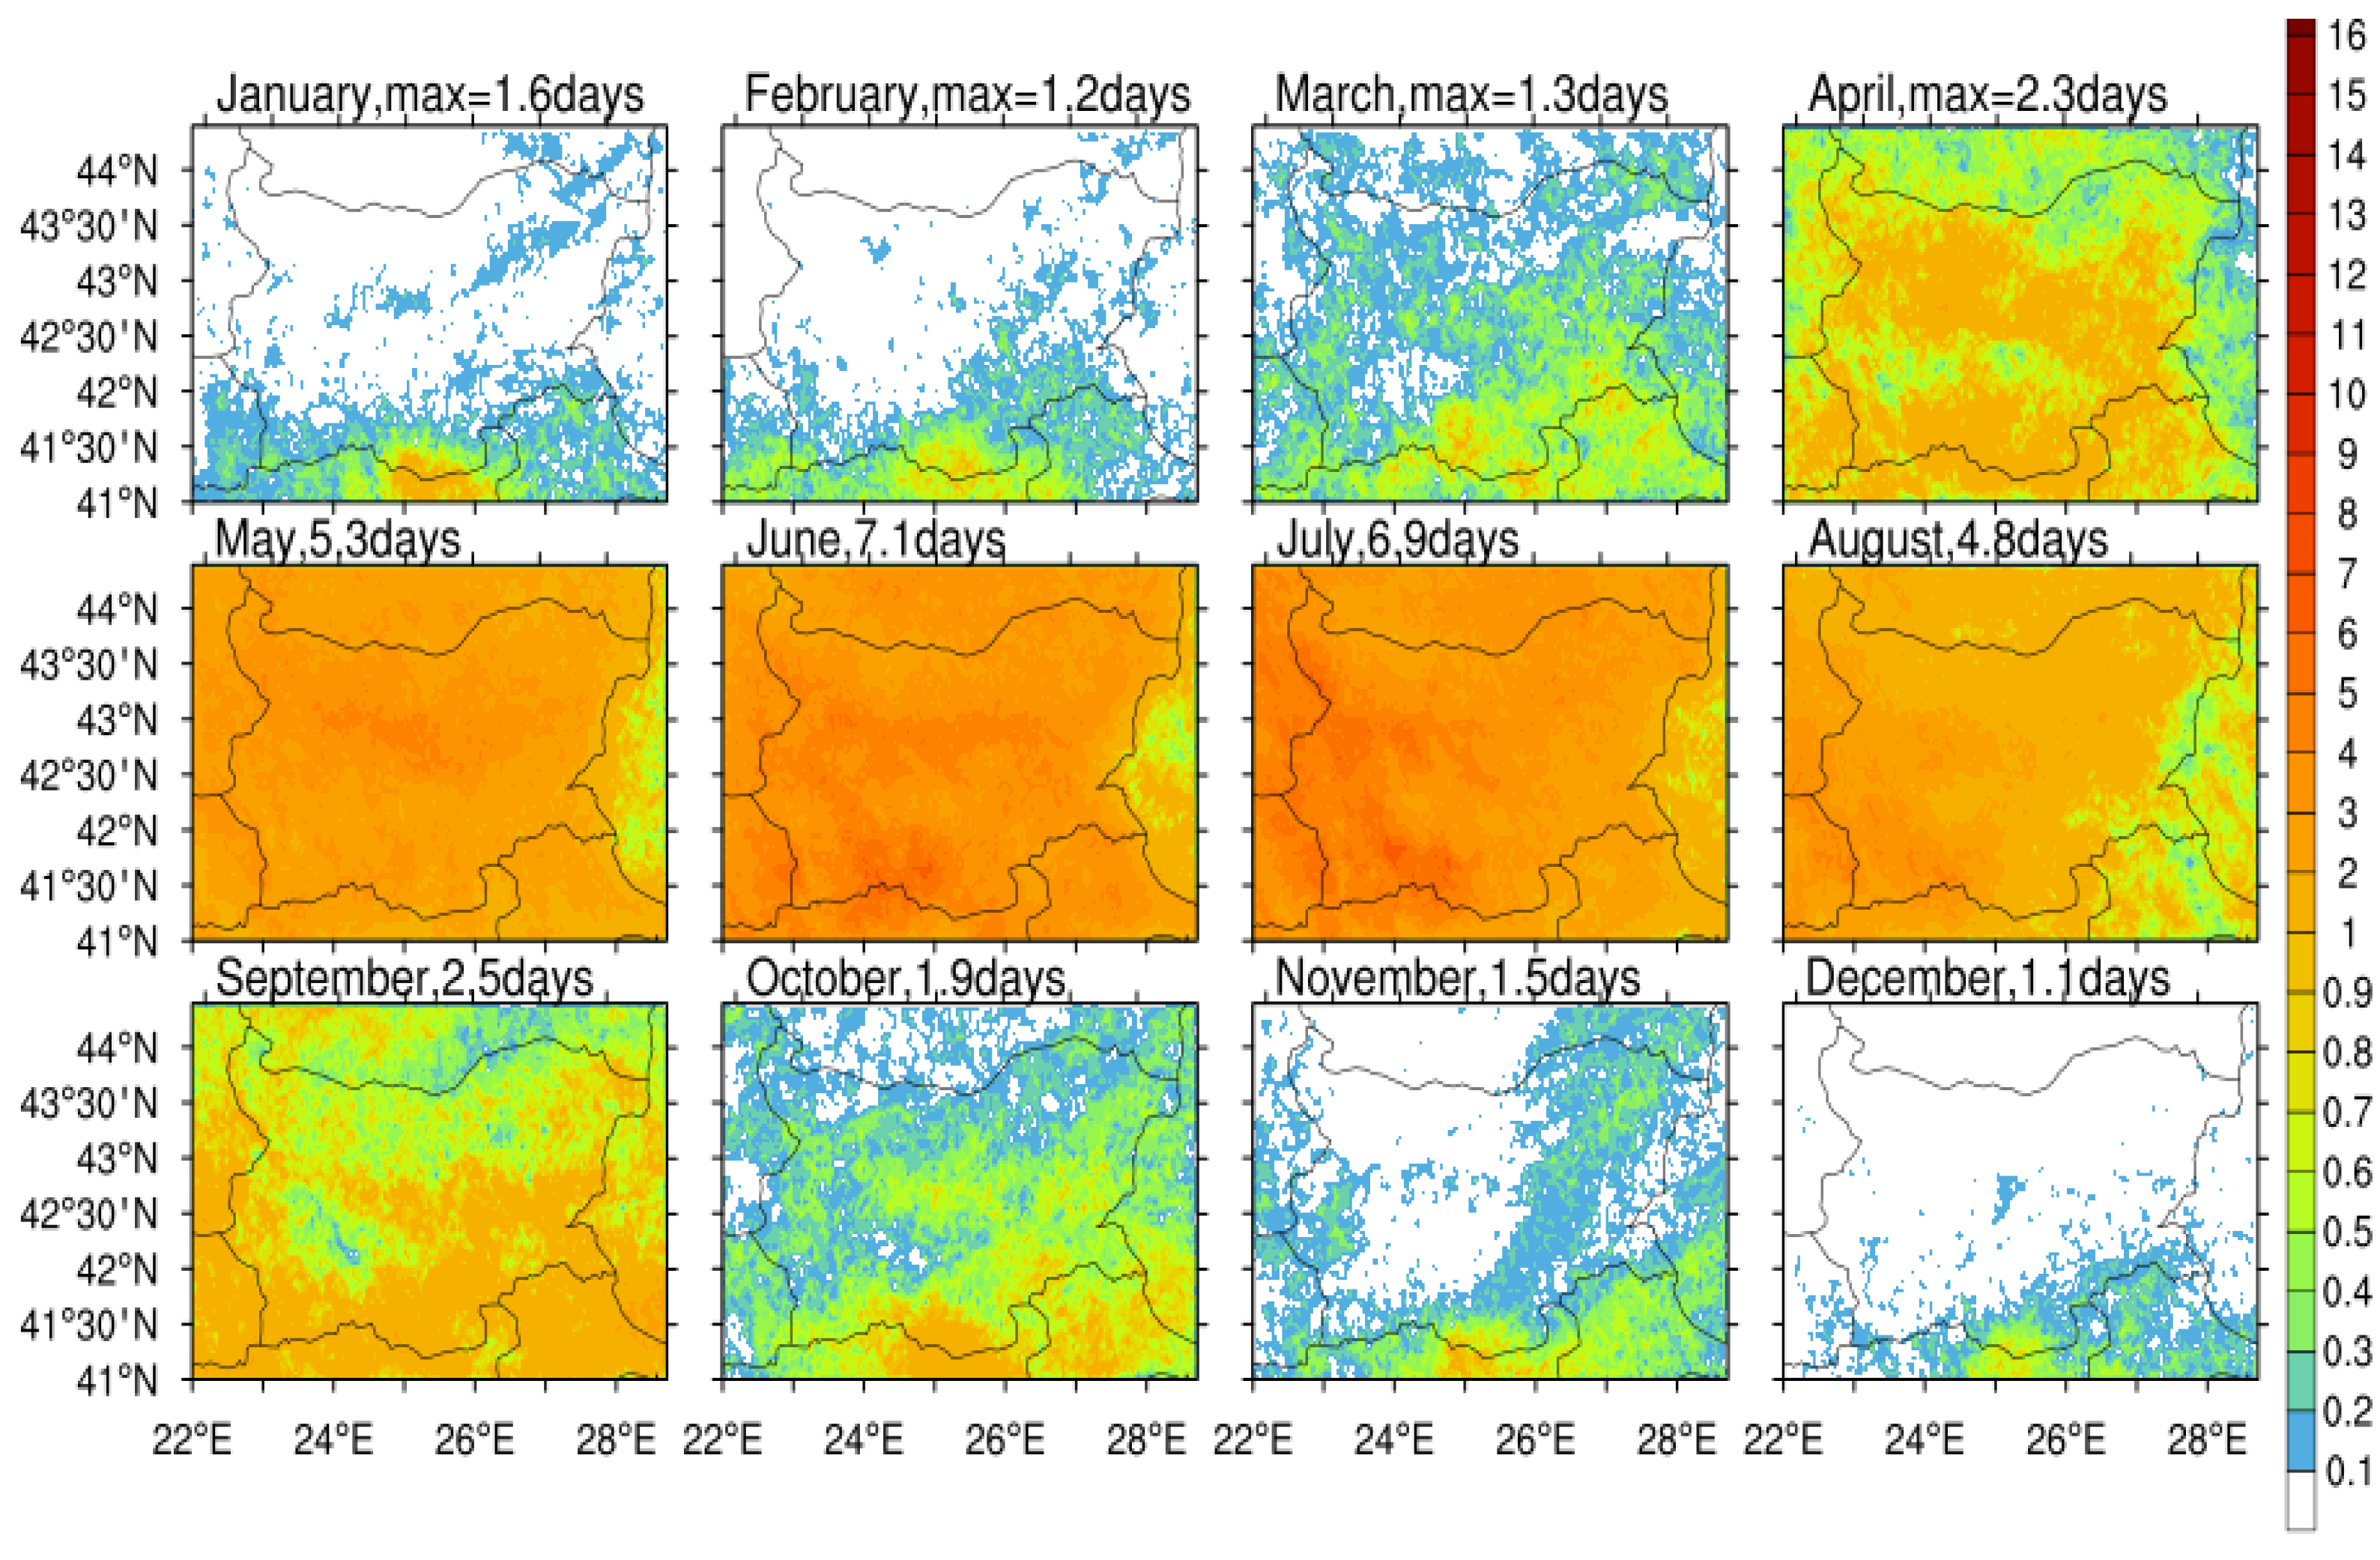
  • About 65% of TDs over Bulgaria occur during the warm half of the year;
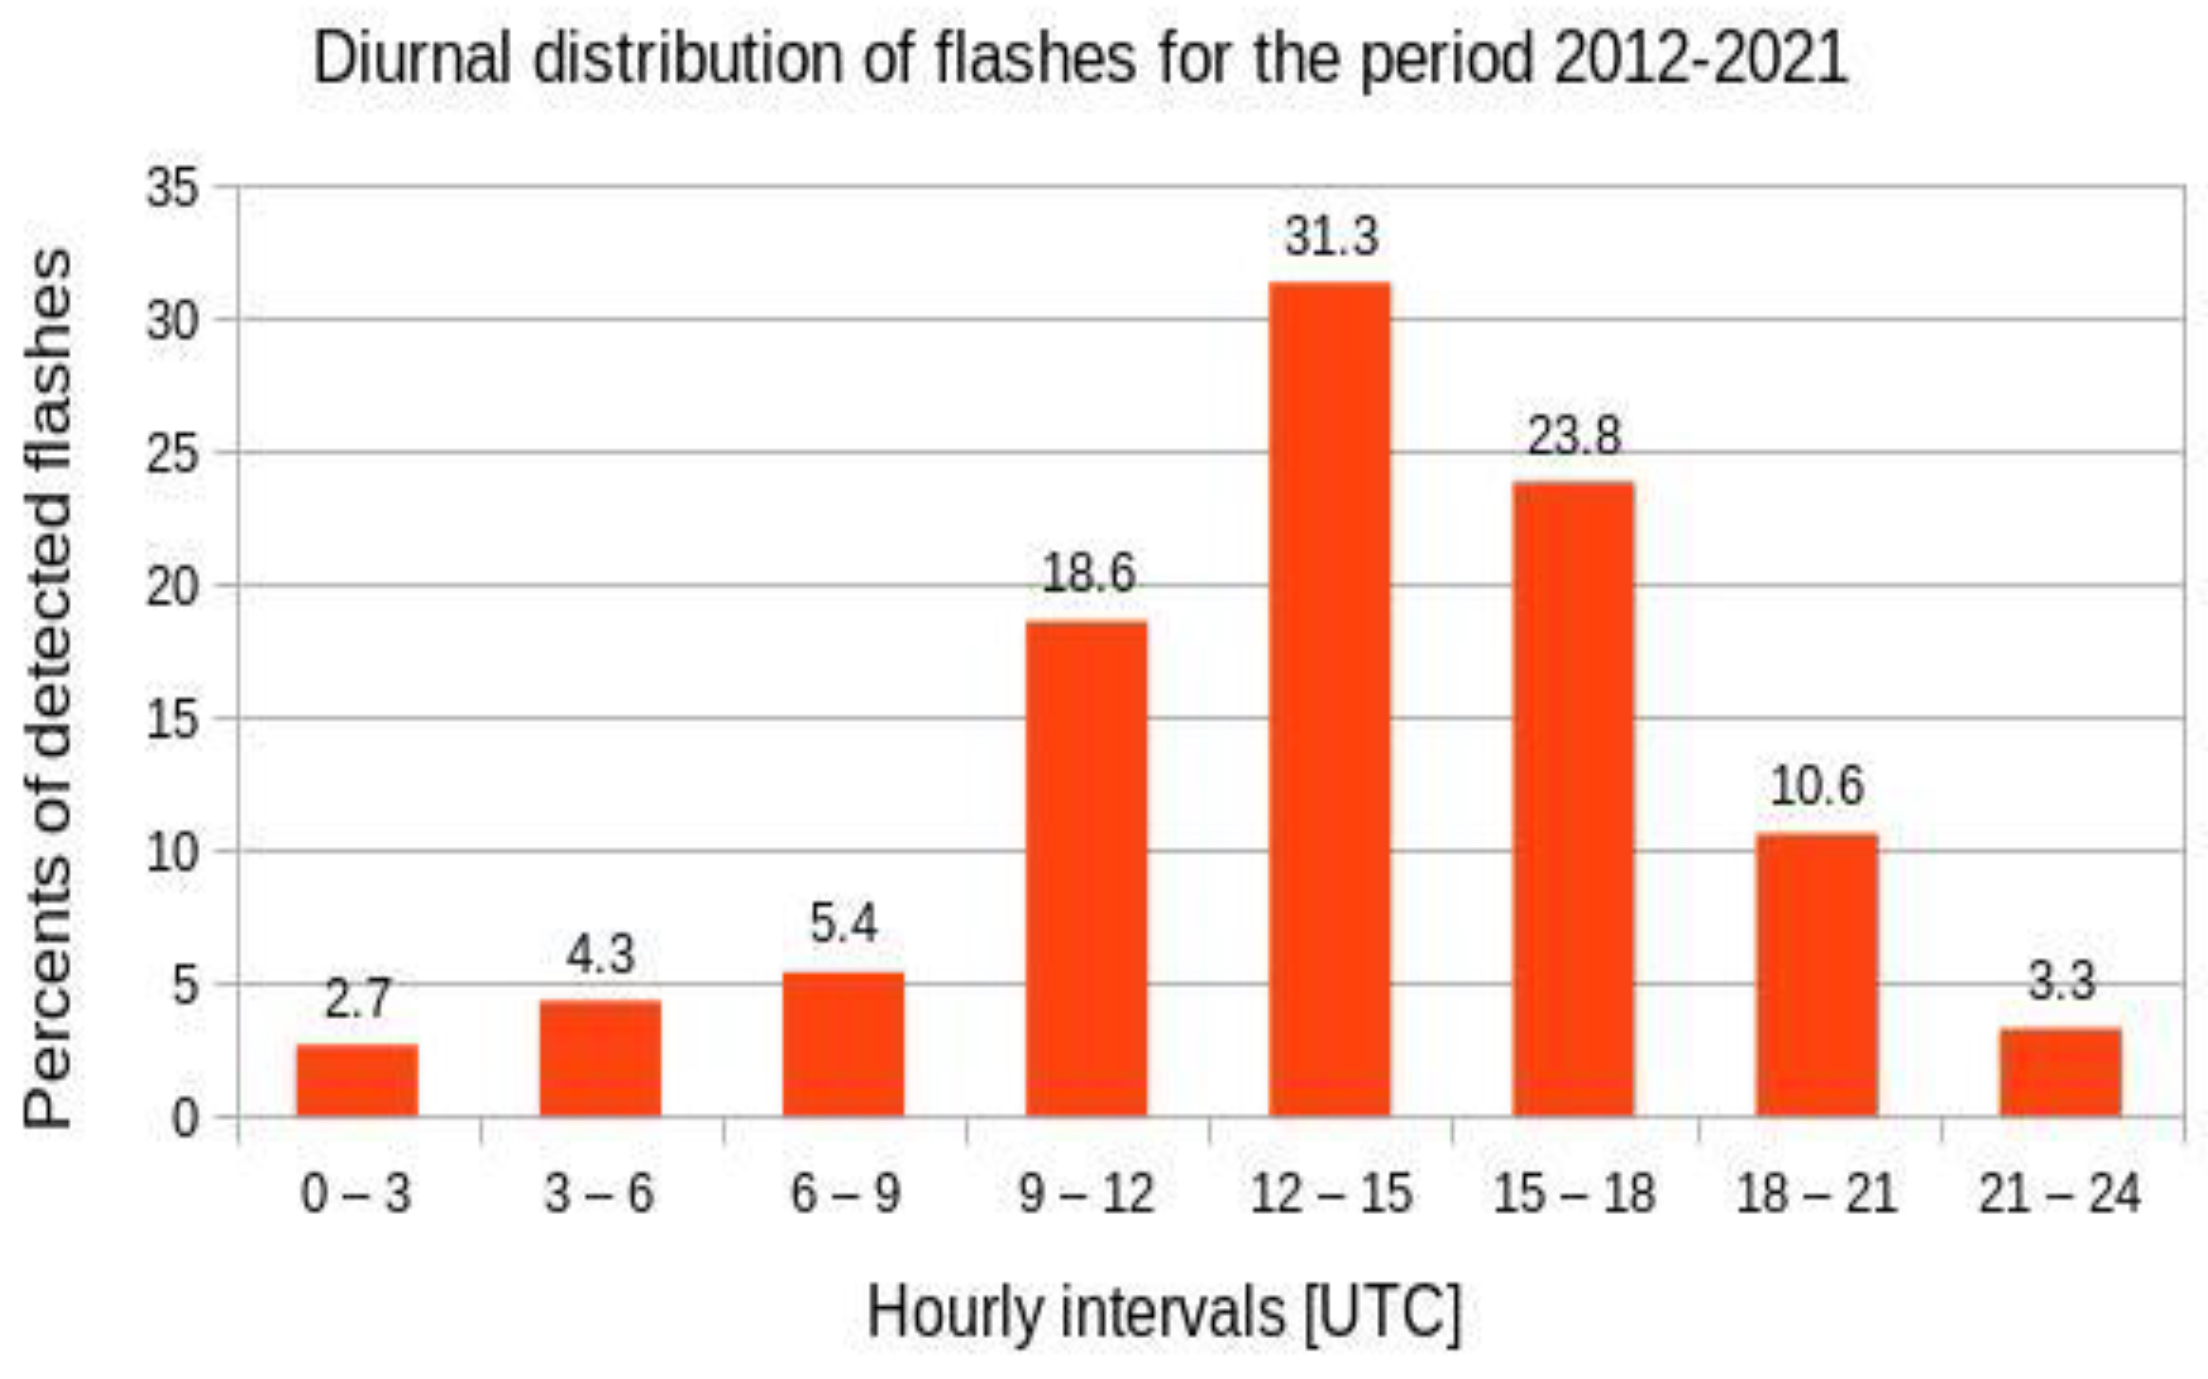
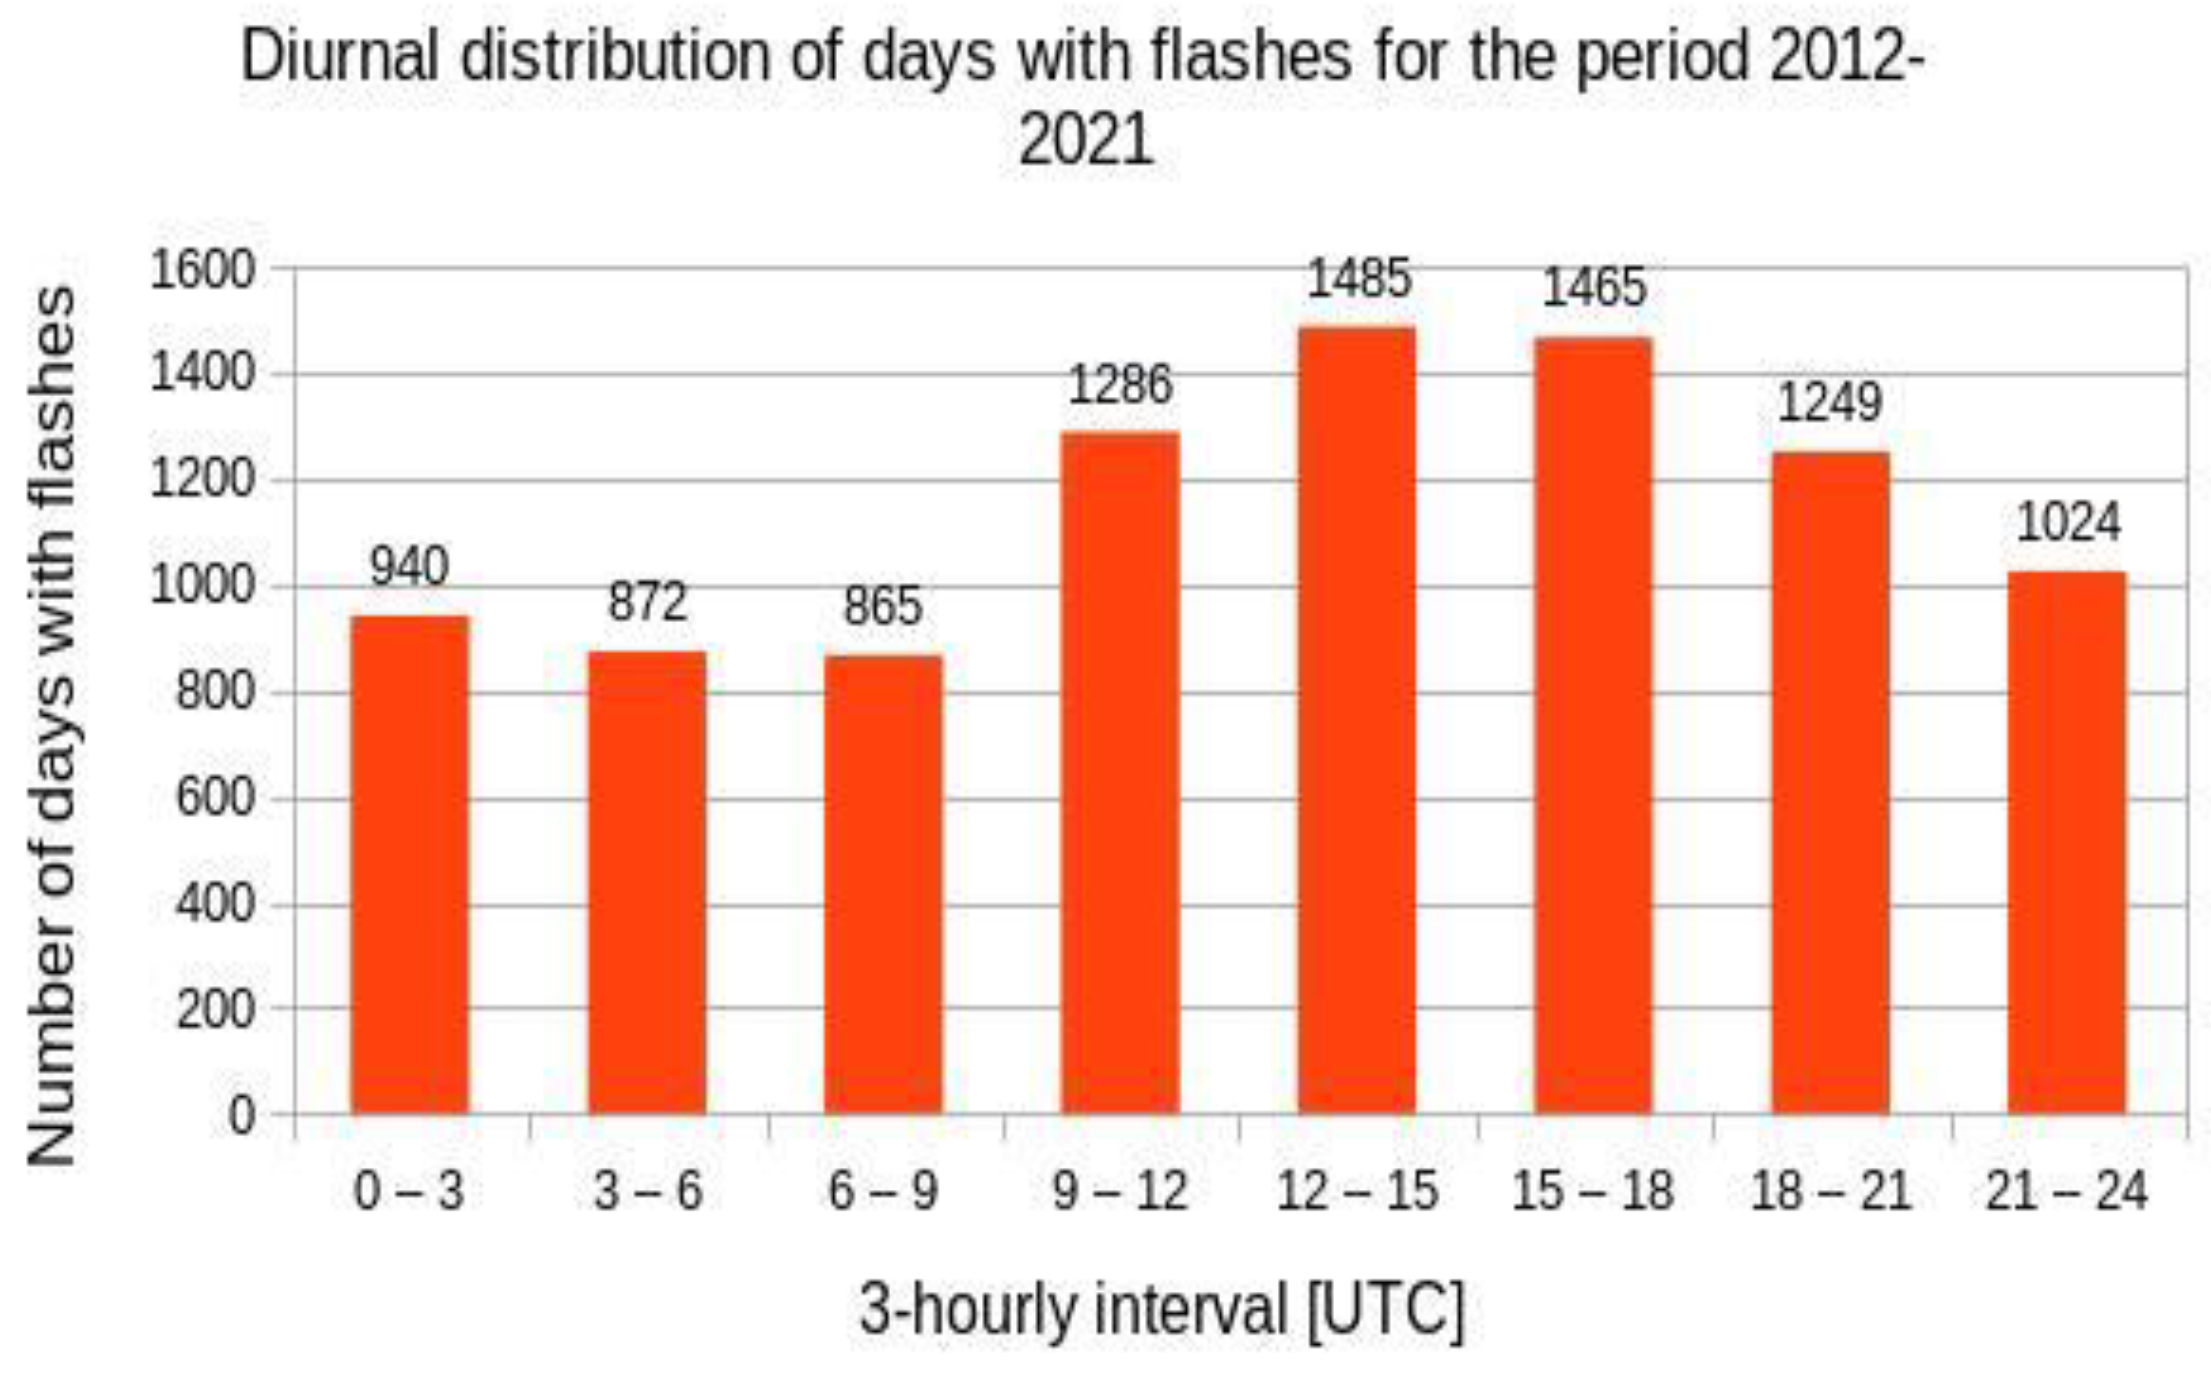
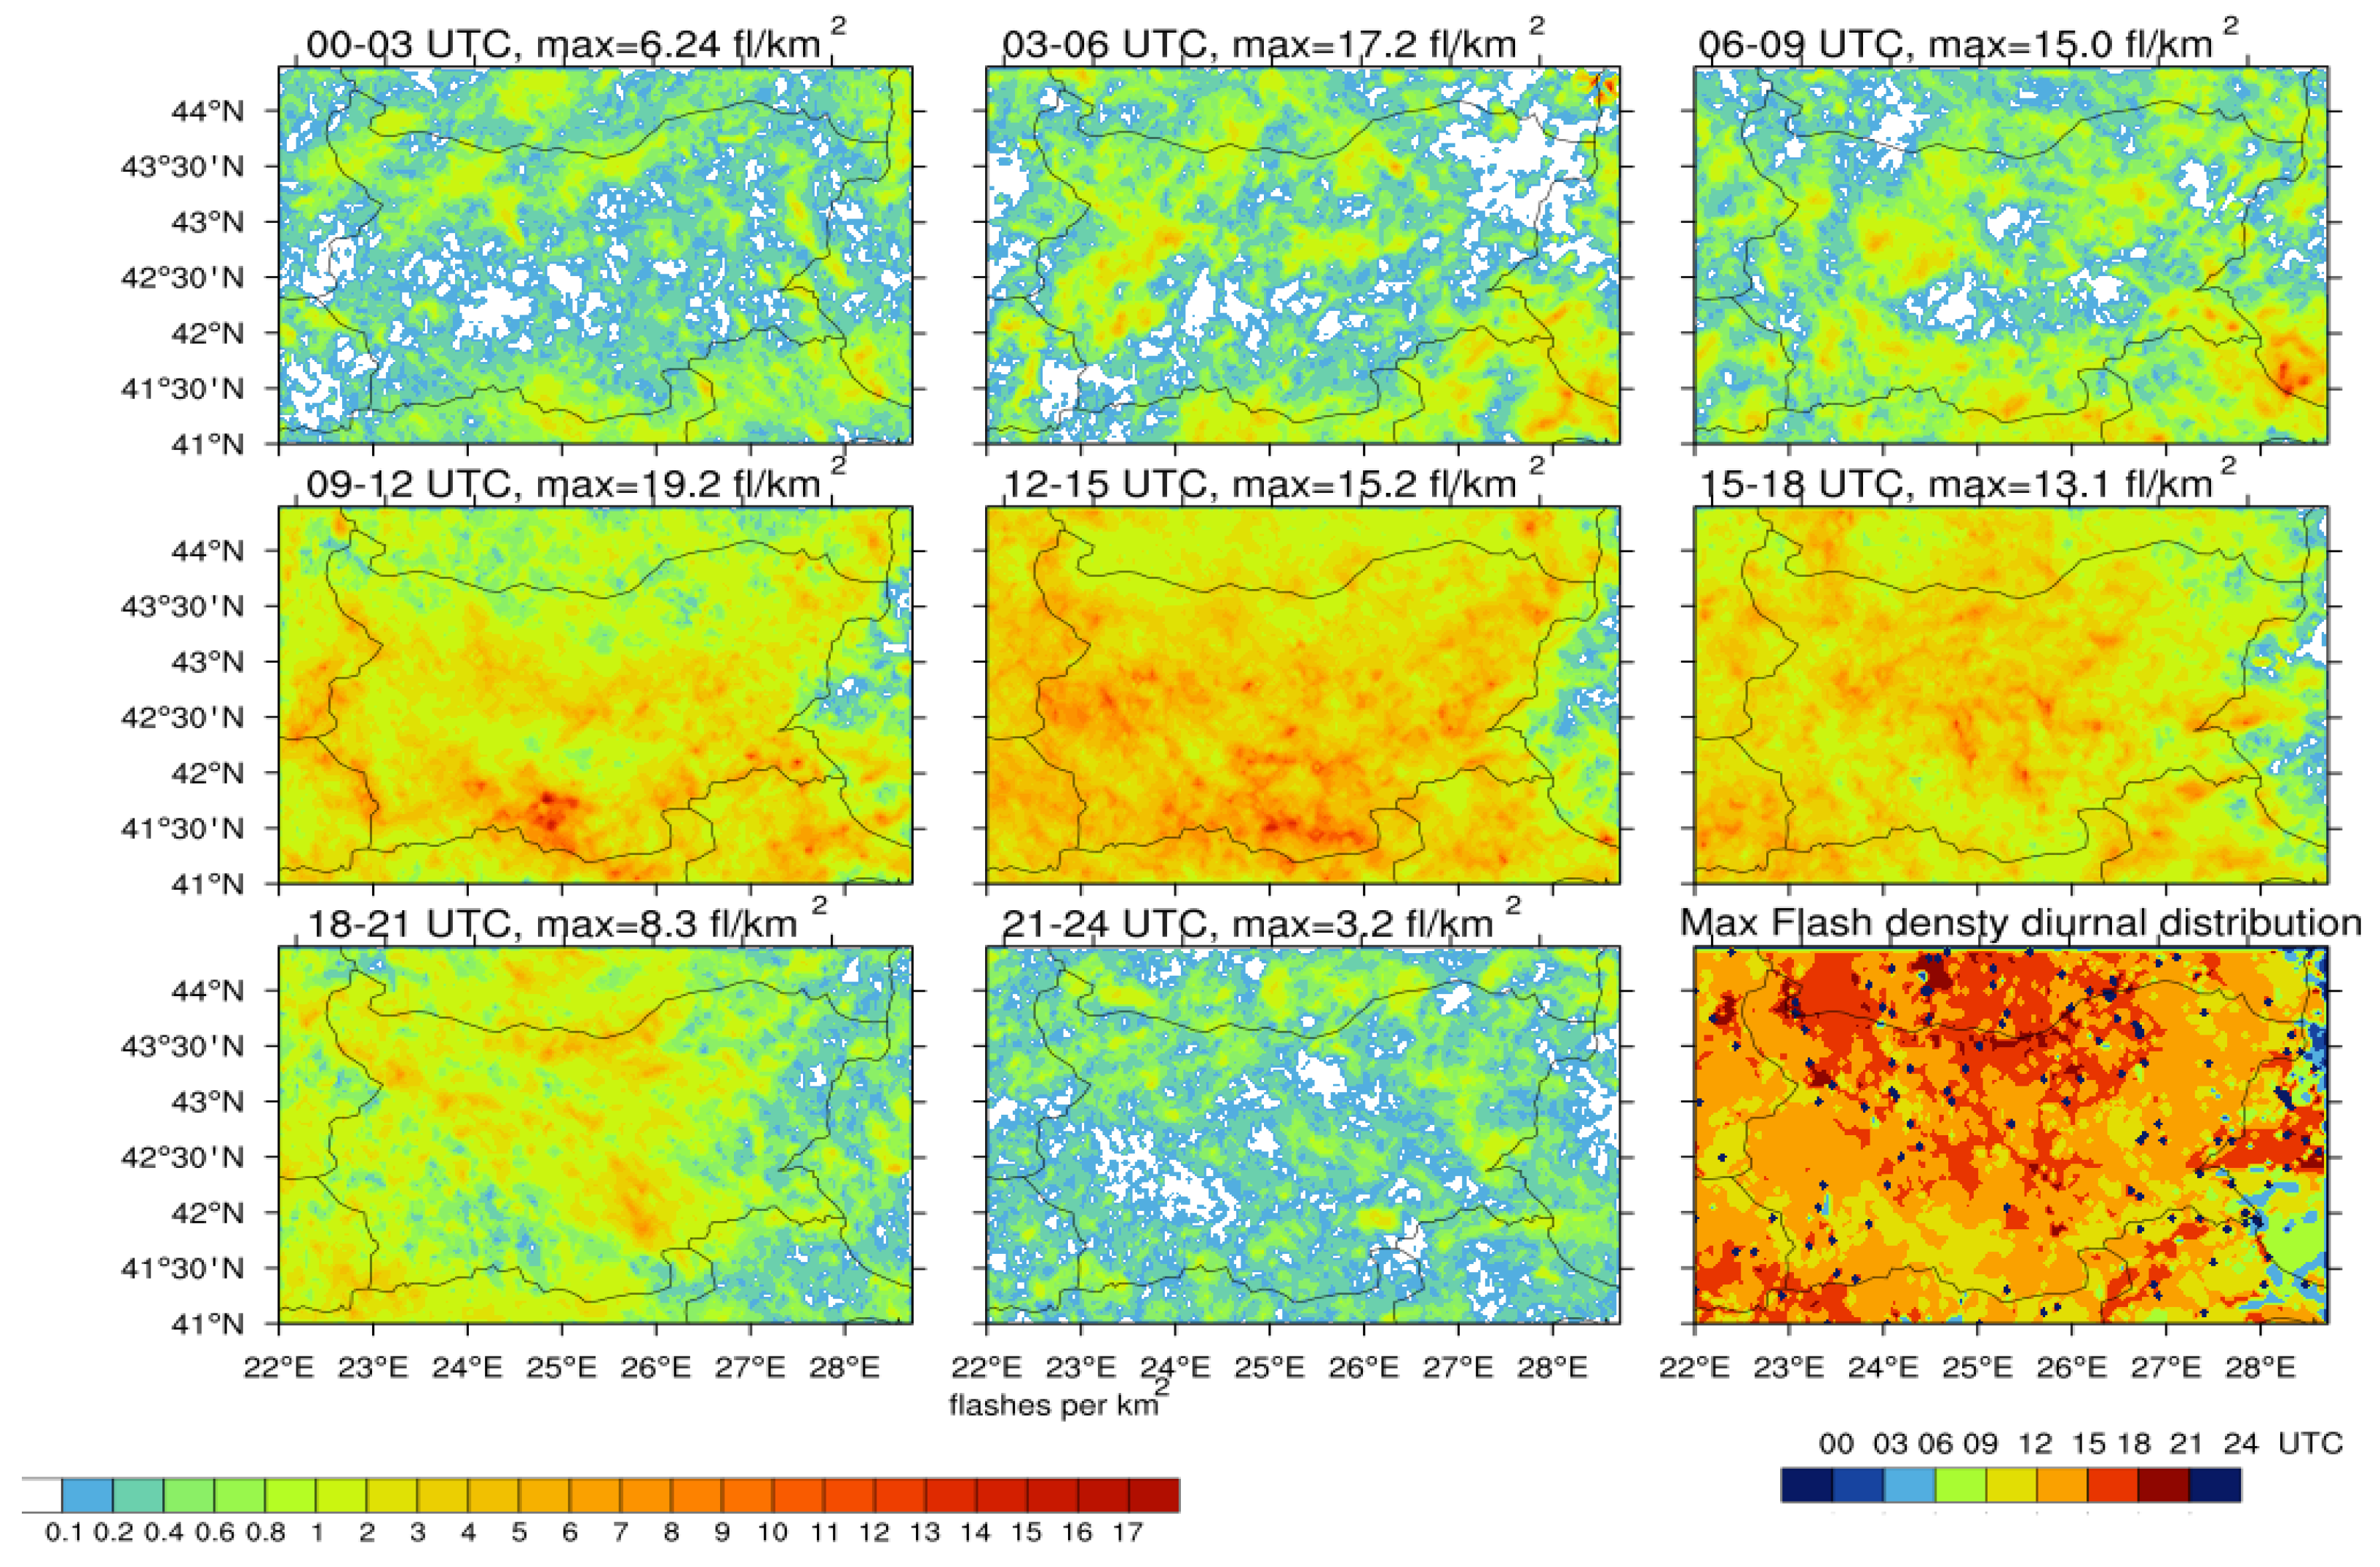
  • More than 30% of detected flashes and most TDs over Bulgaria occur between 12 and 15 UTC;
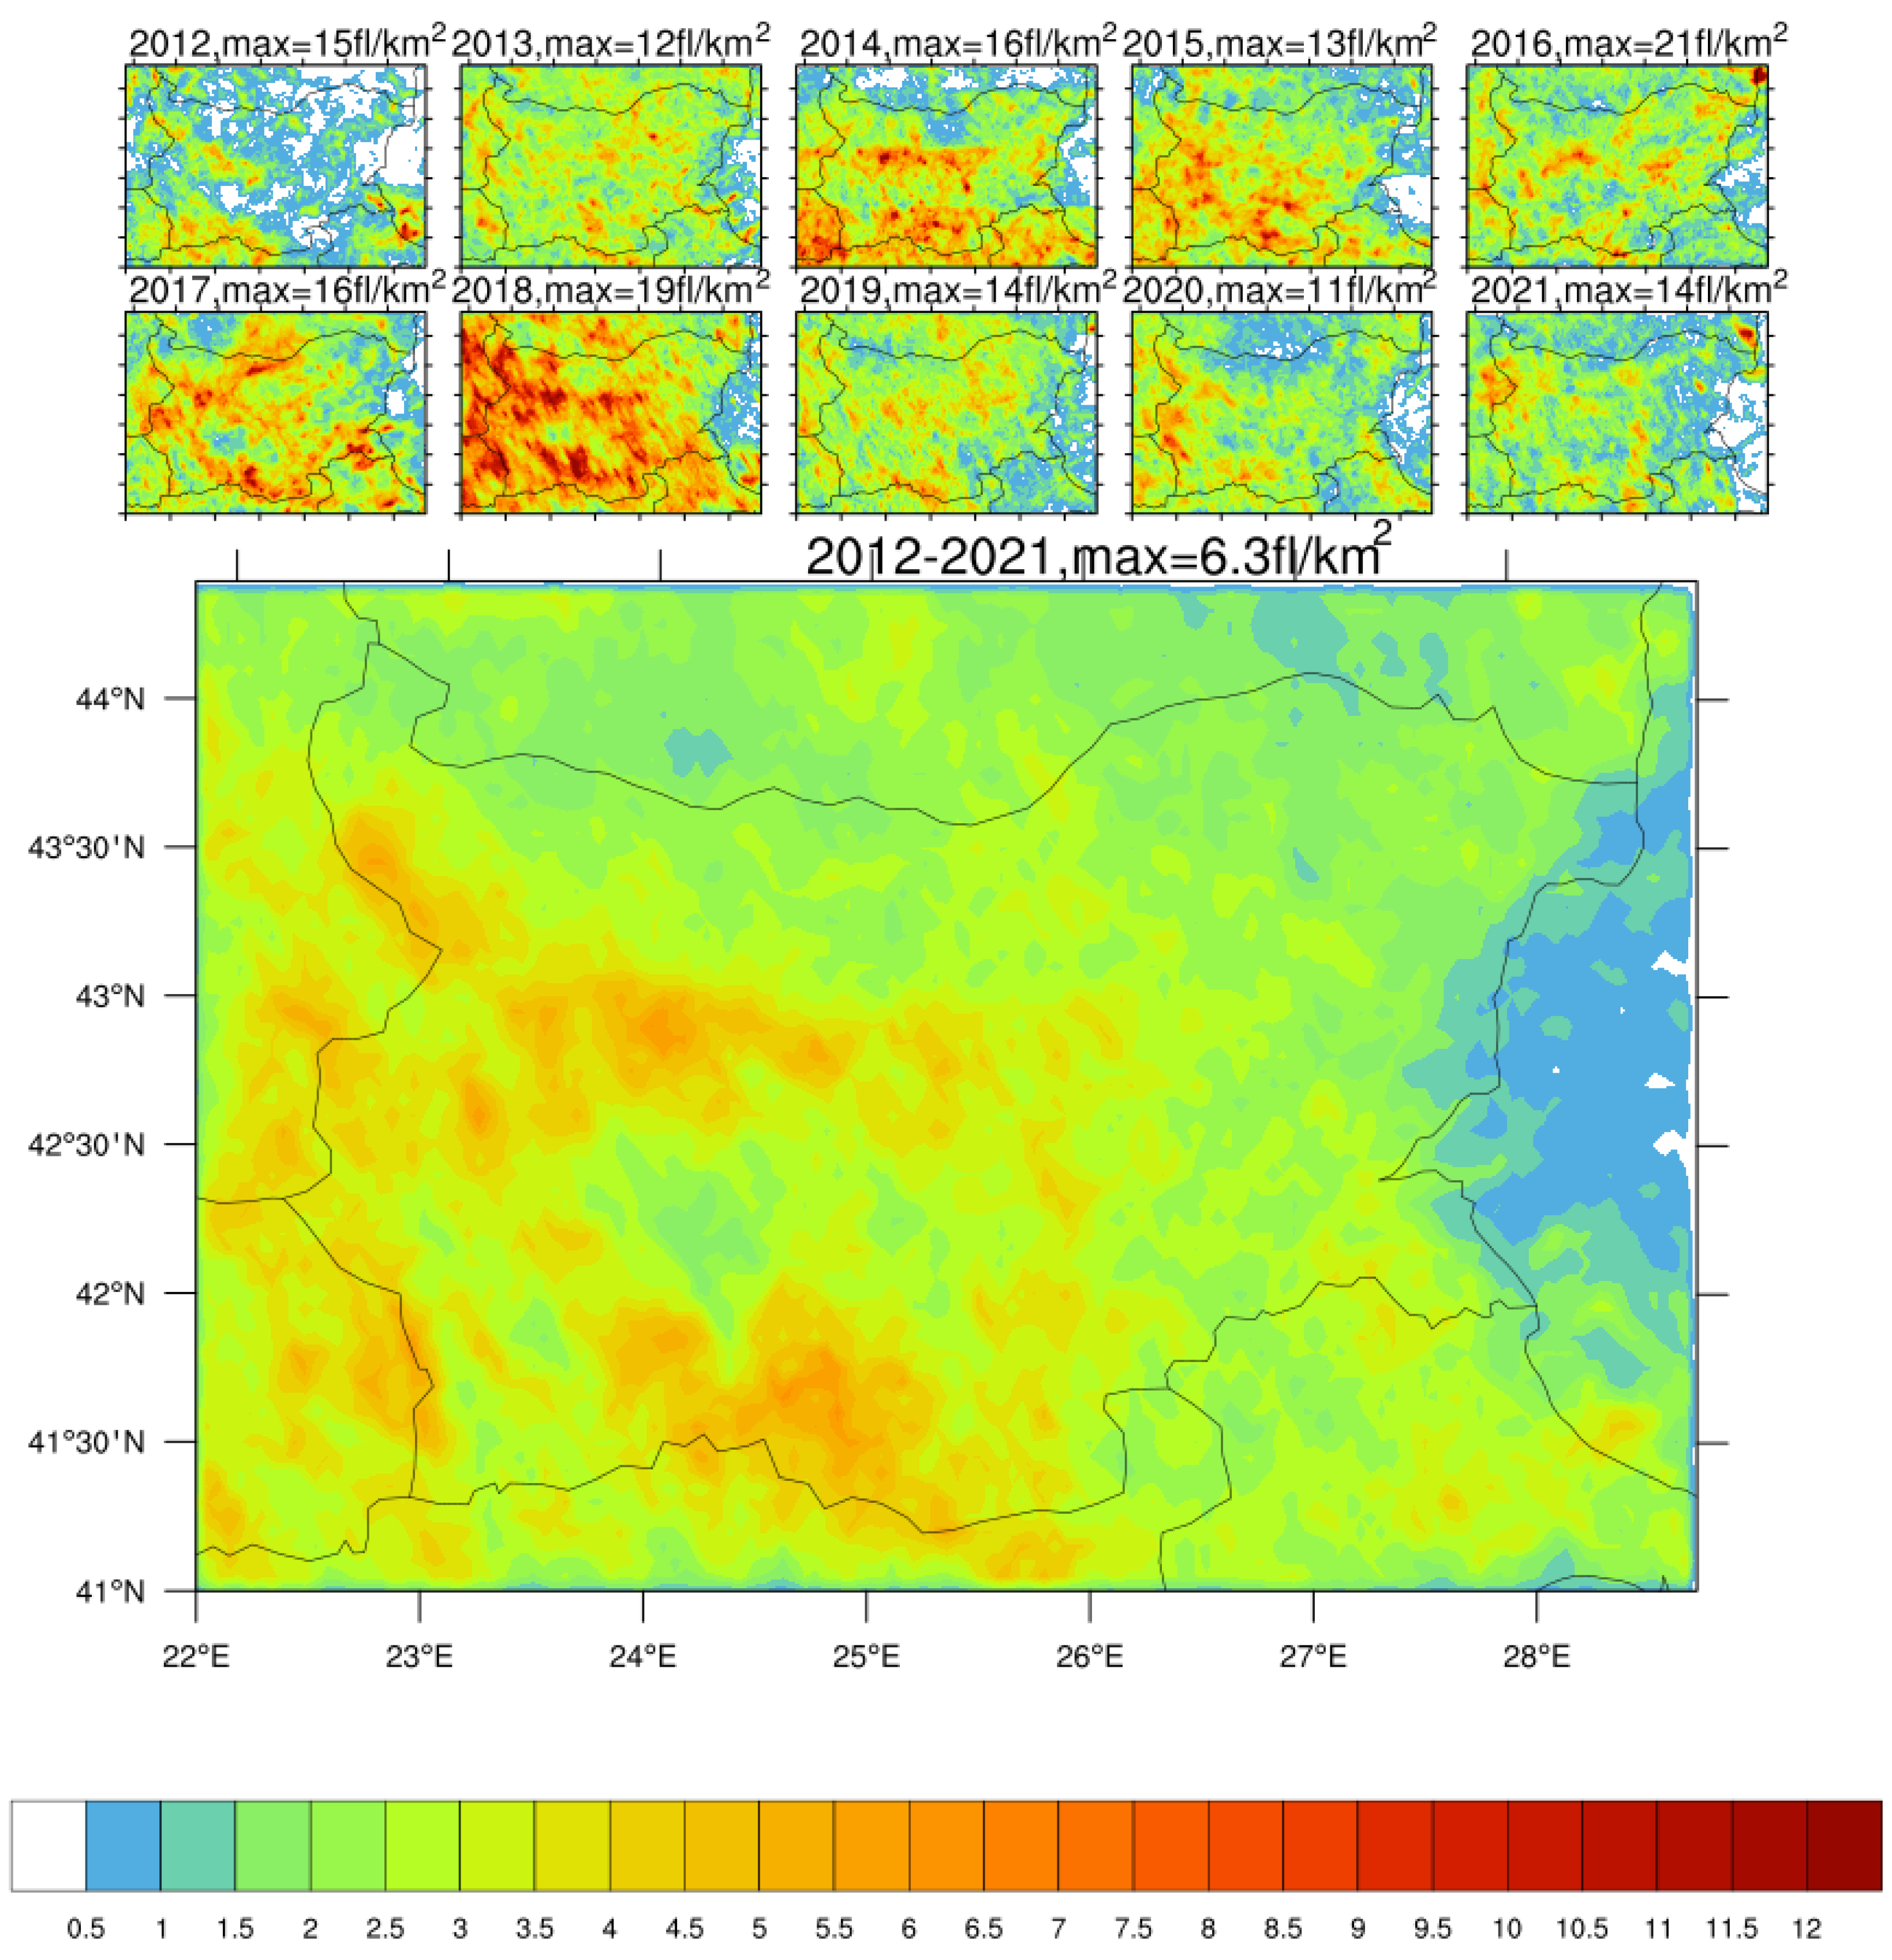
  • Detected flashes and TDs are denser over mountainous regions and rarer over the sea;
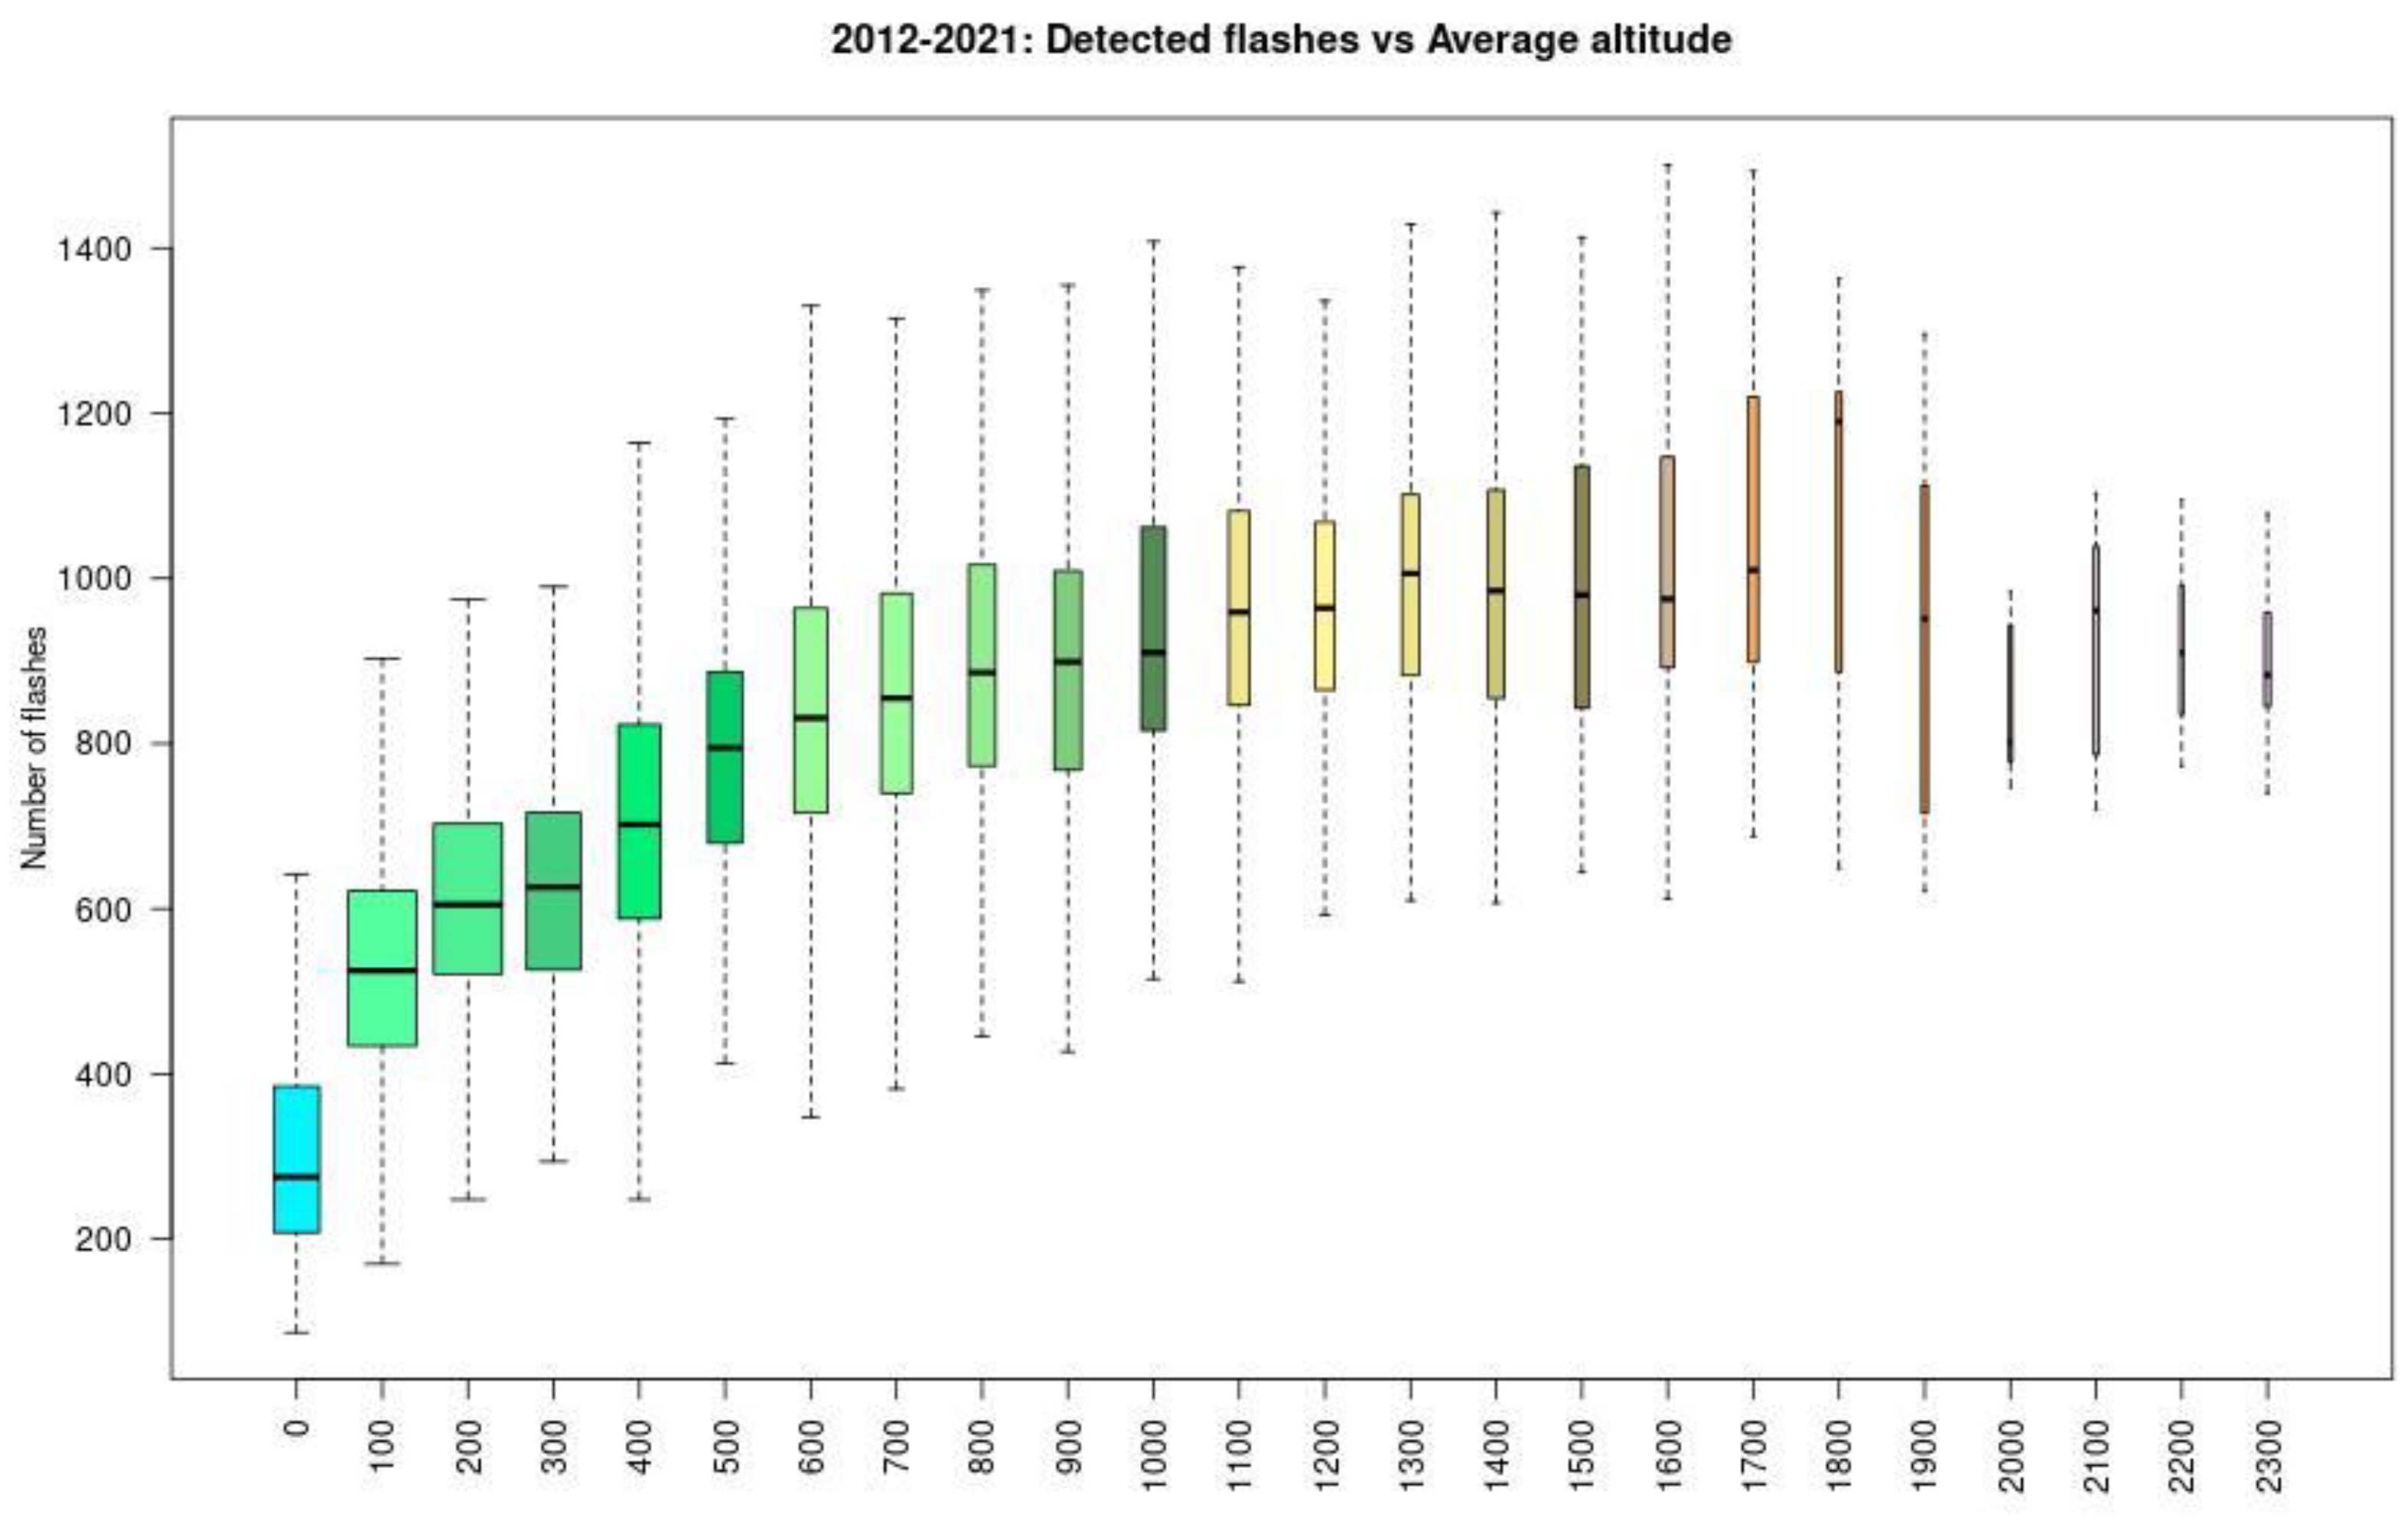
  • There is an increase in the number of detected flashes with the increase in the average terrain altitude until 1800 m, followed by a slight decrease in number of flashes at altitudes above 1800 m;
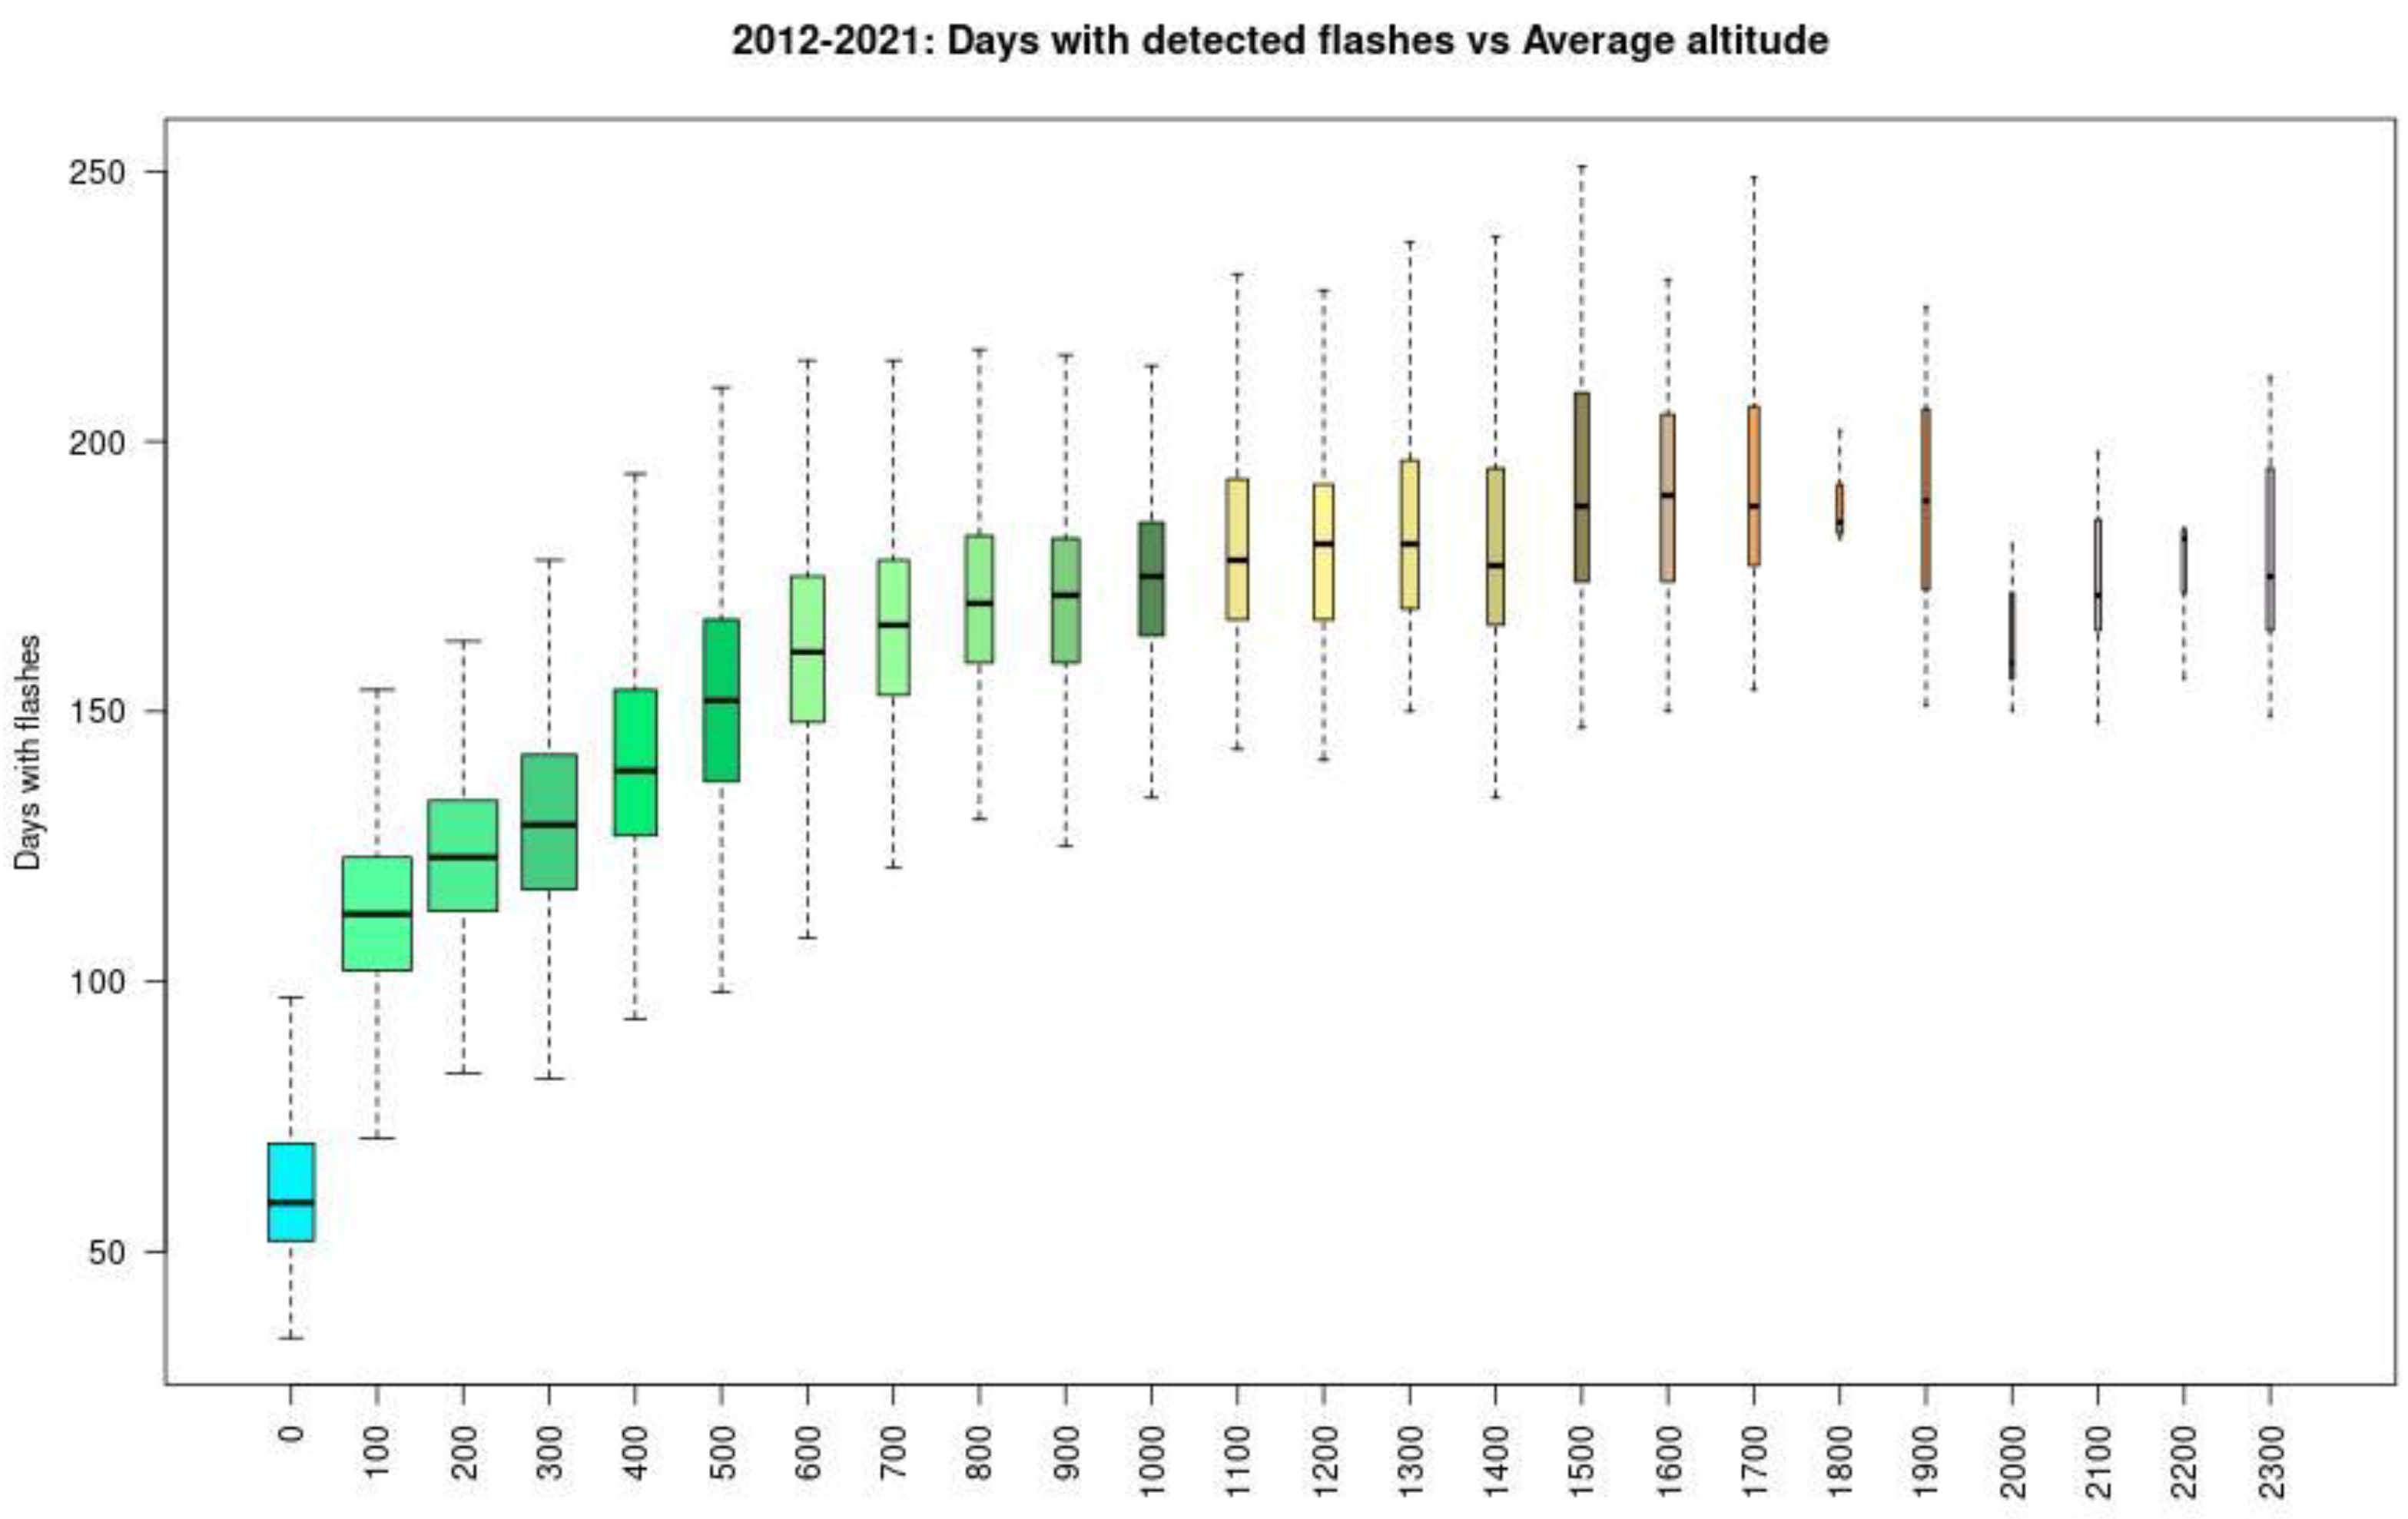
  • The number of thunderstorm days (TD) increases with the increase in terrain altitude until 1900 m and then decreases for altitudes above 1900 m;
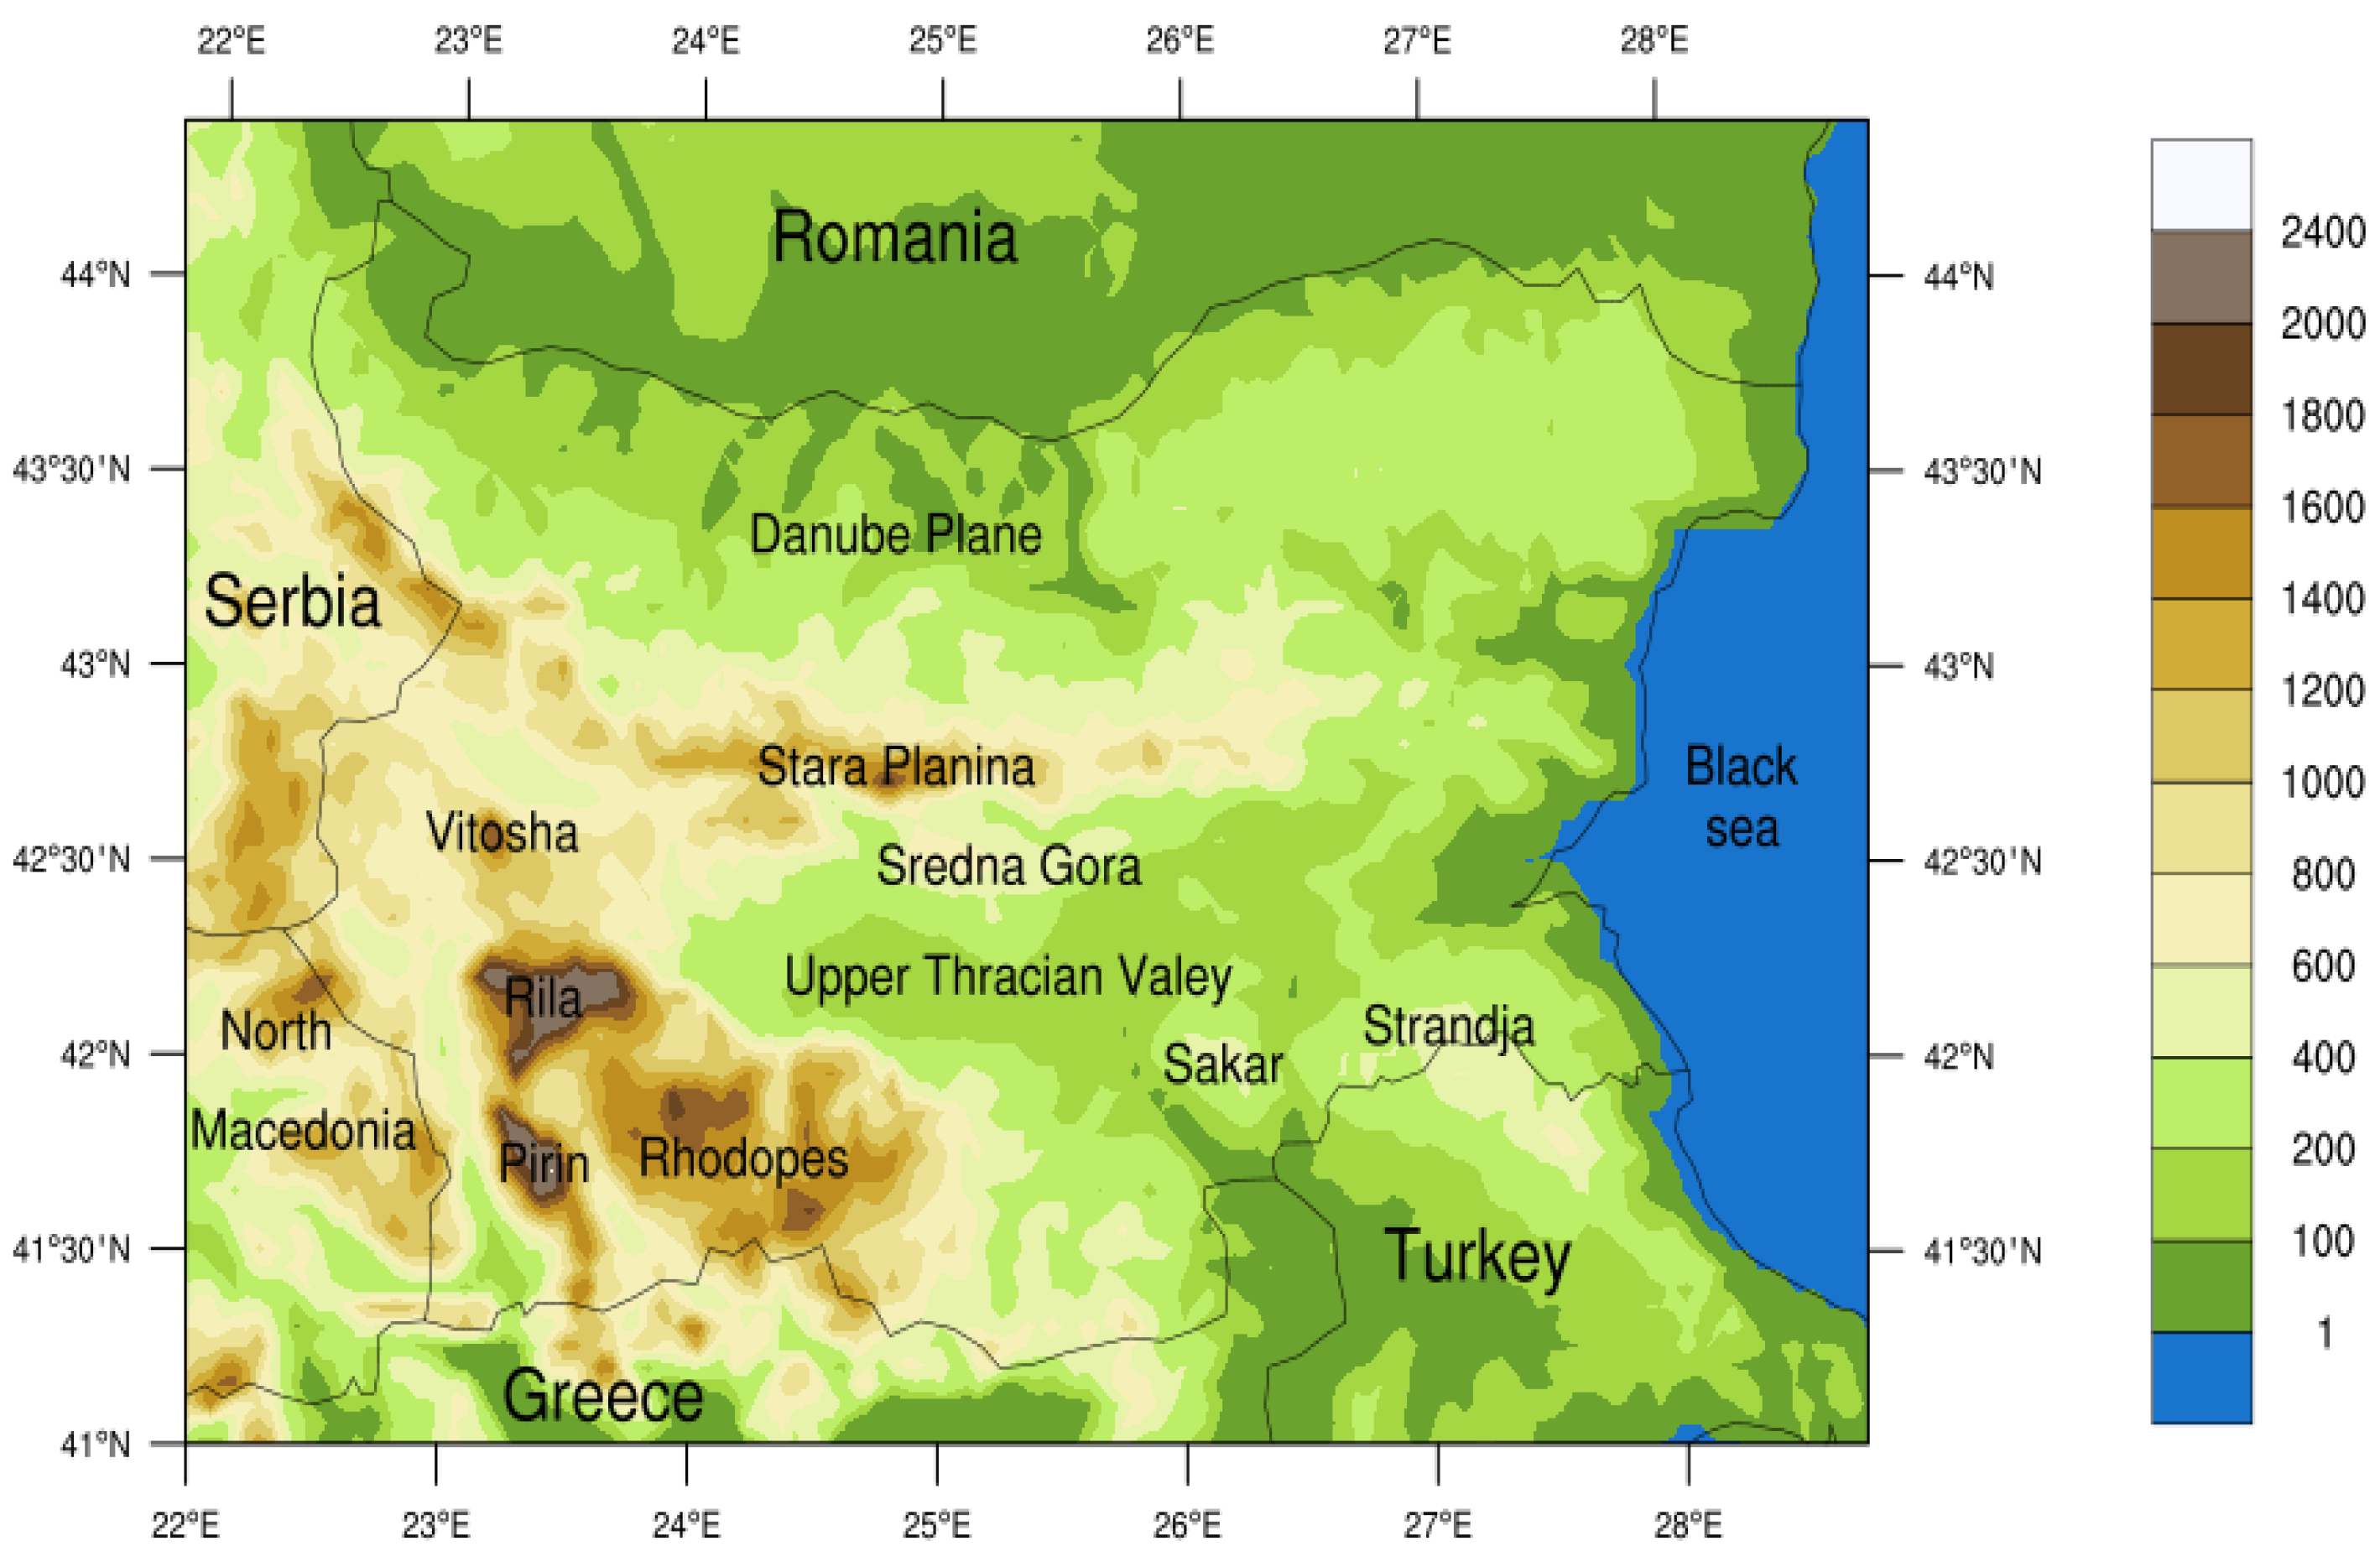
  • During the cold half of the year, thunderstorms in the studied region formed mainly over the southern part of Rhodopes and northern Greece and Turkey, while during the warm half of the year, they formed over mountainous regions (mainly in the western part of Bulgaria);
  • The maximum flash density over the larger part of the considered domain is reached between 12 and 18 UTC; over a part of the mountainous regions (Rila) and a part of the Black Sea, it is reached in the early morning, between 03 and 06 UTC.
The results obtained here are in accordance with those obtained for other regions in Europe, such as: the relationship between lightning activity and terrain topography [20], and the clear annual and diurnal cycles of lightning activity. The present study, as a 10-year lightning climatology analysis for Bulgaria, could be used to identify daily, monthly, and yearly anomalies on an operational basis.

Author Contributions

Conceptualization, B.D.T. and I.G.; methodology, B.D.T.; software, B.D.T.; validation, B.D.T. and I.G.; formal analysis, B.D.T. and I.G.; investigation, B.D.T. and I.G.; resources, B.D.T. and I.G.; data curation, B.D.T. and I.G.; writing—original draft preparation, B.D.T.; writing—review and editing, B.D.T. and I.G.; visualization, B.D.T. and I.G. All authors have read and agreed to the published version of the manuscript.

Funding

This research received no external funding.

Data Availability Statement

ATDnet lightning are sent freely to the National Institute of Meteorology and Hydrology by the UK Met Office on behalf of the World Meteorological Organization to member states through its Global Telecommunication System.

Conflicts of Interest

The authors declare no conflict of interest.

References

  1. Poelman, D.R.; Schulz, W.; Diendorfer, G.; Bernardi, M. The European lightning location system EUCLID–Part2: Observations. Nat. Hazards Earth Syst. Sci. 2016, 16, 607–616. [Google Scholar] [CrossRef] [Green Version]
  2. Kotroni, V.; Lagouvardos, K. Lightning in the Mediterranean and its relation with sea-surface temperature. Environ. Res. Lett. 2016, 11, 034006. [Google Scholar] [CrossRef]
  3. Wapler, K. High-resolution climatology of lightning characteristics within Central Europe. Meteorol. Atm. Phys. 2013, 122, 175–184. [Google Scholar] [CrossRef]
  4. Tuomy, T.; Makela, A. Thunderstorm climate of Finland 1998–2007. Geophysica 2008, 44, 67–80. [Google Scholar]
  5. Schulz, W.; Cummins, K.; Diendorfer, G.; Dorninger, M. Cloud-to-ground lightning in Austria: A 10-year study using data from lightning local system. J. Geophys. Res. 2005, 110, D09101. [Google Scholar] [CrossRef]
  6. Anderson, G.; Klugmann, D. European lightning density using ATDnet data. Nat. Hazards Earth Syst. Sci. 2014, 14, 815–829. [Google Scholar] [CrossRef] [Green Version]
  7. Malcheva, K.; Bocheva, L.; Chervenkov, H. Spatio-Temporal Variation of Extreme Heat Events in Southeastern Europe. Atmosphere 2022, 13, 1186. [Google Scholar] [CrossRef]
  8. Bocheva, L.; Malcheva, K. Climatological assessment of extreme 24-hour precipitation in Bulgaria during the period 1931–2019. In Proceedings of the 20th International Multidisciplinary Scientific GeoConference Proceedings SGEM 2020, Albena, Bulgaria, 18–24 August 2020; Volume 20, pp. 357–364. [Google Scholar]
  9. Marinova, T.; Malcheva, K.; Bocheva, L.; Trifonova, L. Climate profile of Bulgaria in the period 1988-2016 and brief climatic assessment of 2017. Bulg. J. Meteorol. Hydrol. 2017, 22, 2–15. [Google Scholar]
  10. Simeonov, P.; Bocheva, L.; Marinova, T. Severe convective storms phenomena occurrence during the warm half year in Bulgaria (1961–2006). Atmos. Res. 2009, 93, 498–505. [Google Scholar] [CrossRef]
  11. Bocheva, L.; Marinova, T. Recent trends of thunderstorms over Bulgaria–climatological analysis. J. Int. Sci. Publ. 2016, 10, 136–144. [Google Scholar]
  12. Lee, A.C. An operational system for the remote location of lightning flashes using VLF arrival time difference technique. J. Atmos. Ocean. Technol. 1986, 3, 630–642. [Google Scholar] [CrossRef]
  13. Chowdhuri, I.; Chandra Pal, S.; Saha, A.; Chakrabortty, R.; Ghosh, M.; Roy, P. Significant decrease of lightning activities during COVID-19 lockdown period over Kolkata megacity in India. Sci. Total Environ. 2020, 747, 141321. [Google Scholar] [CrossRef] [PubMed]
  14. Neto, O.P.; Pinto, I.R.C.A.; Pinto, O., Jr. Lightning during the COVID-19 pandemic in Brazil. J. Atoms. Sol.-Terr. Phys. 2020, 211, 105463. [Google Scholar] [CrossRef] [PubMed]
  15. Pérez-Invernón, F.; Huntrieser, H.; Gordillo-Vasquez, F.; Soler, S. Influence of the COVID-19 lockdown on lightning activity in the Po Valley. Atmos. Res. 2021, 263, 105808. [Google Scholar] [CrossRef]
  16. Djekovic, V.; Andjelкovic, A.; Spalevic, V.; Janić, M. A study of the flooding in Serbia in May 2014. Forestry 2015, 49–66. [Google Scholar]
  17. Monthly Hydrometeorological Bulletin of NIMH (Print: ISSN 1314-894X; Online: ISSN 2815-2743). Available online: https://bulletins.cfd.meteo.bg/ (accessed on 15 October 2022).
  18. Kalnay, E.; Kanamitsu, M.; Kistler, R.; Collins, W.; Deaven, D.; Gandin, L.; Iredell, M.; Saha, S.; White, G.; Woollen, J.; et al. The NCEP/NCAR Reanalysis 40-year Project. Bull. Am. Meteorol. Soc. 1996, 77, 437–472. [Google Scholar] [CrossRef]
  19. GLOBE Task Team; Hastings; David, A.; Dunbar, P.K.; Elphingstone, G.M.; Bootz, M.; Murakami, H.; Maruyama, H.; Masaharu, H.; Holland, P.; et al. The Global Land One-Kilometer Base Elevation (GLOBE) Digital Elevation Model, Version 1.0. National Oceanic and Atmospheric Administration, National Geophysical Data Center, 325 Broadway, Boulder, Colorado 80305-3328, U.S.A. Digital Data Base on the World Wide Web. 1999. Available online: http://www.ngdc.noaa.gov/mgg/topo/globe.html (accessed on 15 October 2022).
  20. Bourscheidt, V.; Pinto Junior, O.; Naccarato, K.P.; Pinto, I.R.C.A. The influence of topography on cloud-to-ground lightning density in South Brazil. Atmos. Res. 2009, 91, 508–513. [Google Scholar] [CrossRef]
  21. Petrova, S.; Mitzeva, R.; Kotroni, V.; Latham, J.; Peneva, E. Analyse of summer lightning activity and precipitation in the Central and Eastern Mediterranean. Atmos. Res. 2009, 110, D09101. [Google Scholar] [CrossRef]
Figure 1. Topography of the domain over which lightning activity based on ATDnet data for the period 2012–2021 is shown.
Climate 10 00184 g001
Figure 2. Annual distribution of the flashes detected by ATDnet over the studied domain for the period 2012–2021.
Climate 10 00184 g002
Figure 3. Annual distribution of the number of days with flashes detected by ATDnet over the studied domain for the period 2012–2021.
Climate 10 00184 g003
Figure 4. Monthly distribution of flashes detected by ATDnet over the studied domain for the period 2012–2021.
Climate 10 00184 g004
Figure 5. Monthly distribution of the number of days with flashes detected by ATDnet over the studied domain for the period 2012–2021.
Climate 10 00184 g005
Figure 6. (a). Composite geopotential height at 500 hPa isobaric surface—anomaly for July–September 2012. Images provided by the NOAA/ESRL Physical Sciences Division, Boulder, Colorado, from their Web site at http://www.esrl.noaa.gov/psd (accessed on 15 October 2022) [18]. (b). Composite geopotential height at 500 hPa isobaric surface—anomaly for April–June 2014. Images provided by the NOAA/ESRL Physical Sciences Division, Boulder, Colorado, from their Web site at http://www.esrl.noaa.gov/psd (accessed on 15 October 2022) [18]. (c). Composite geopotential height at 500 hPa isobaric surface—anomaly for June–July 2018. Images provided by the NOAA/ESRL Physical Sciences Division, Boulder Colorado from their Web site at http://www.esrl.noaa.gov/psd (accessed on 15 October 2022) [18].
Climate 10 00184 g006
Figure 7. Diurnal distribution (in %) of flashes over the studied domain according to ATDnet for the period 2012–2021.
Climate 10 00184 g007
Figure 8. Number of days with detected flashes in the different diurnal time intervals during the period 2012–2021.
Climate 10 00184 g008
Figure 9. Annual spatial (on a grid of 0.05 × 0.05 deg) distribution of flash density (number of flashes per km2 per year), according to ATDnet during 2012, 2013, 2014, 2015, 2016, 2017, 2018, 2019, 2020, and 2021, and the yearly average for the whole period 2012–2021.
Climate 10 00184 g009
Figure 10. Annual spatial (on a grid of 0.05 × 0.05 deg) distribution of days with flashes (number of days with flashes per year) according to ATDnet during 2012, 2013, 2014, 2015, 2016, 2017, 2018, 2019, 2020, and 2021, and the yearly average for the whole period 2012–2021.
Climate 10 00184 g010
Figure 11. Box and whiskers plot of the number of detected flashes for the period 2012—2021 as a function of the average (on the grid of 0.05 × 0.05 deg) height in km.
Climate 10 00184 g011
Figure 12. Box and whiskers plot of the number of days with detected flashes for the period 2012–2021 as a function of the average (on the grid of 0.05 × 0.05 deg) height in km.
Climate 10 00184 g012
Figure 13. Mean monthly spatial distribution of flashes according to ATDnet (spatial resolution: 0.05 × 0.05deg) spatial (on a grid of 0.05 × 0.05 deg).
Climate 10 00184 g013
Figure 14. Mean monthly spatial distribution of days with flashes according to ATDnet (spatial resolution: 0.05 × 0.05deg) spatial (on a grid of 0.05 × 0.05 deg).
Climate 10 00184 g014
Figure 15. Spatial distribution of flash density in the time intervals between 00 and 03 UTC, 03 and 06 UTC, 06 and 09 UTC, 09 and 12 UTC, 12 and 15 UTC, 15 and 18 UTC, 18 and 21 UTC, and 21 and 24 UTC, and diurnal distribution of the maximum flash density over the studied domain (spatial resolution: 0.05 × 0.05 deg).
Climate 10 00184 g015
Publisher’s Note: MDPI stays neutral with regard to jurisdictional claims in published maps and institutional affiliations.

