
Climatic Drivers of the Complex Phenology of the Mediterranean Semi-Deciduous Shrub Phlomis fruticosa Based on Satellite-Derived EVI


Abstract
:1. Introduction
2. Materials and Methods
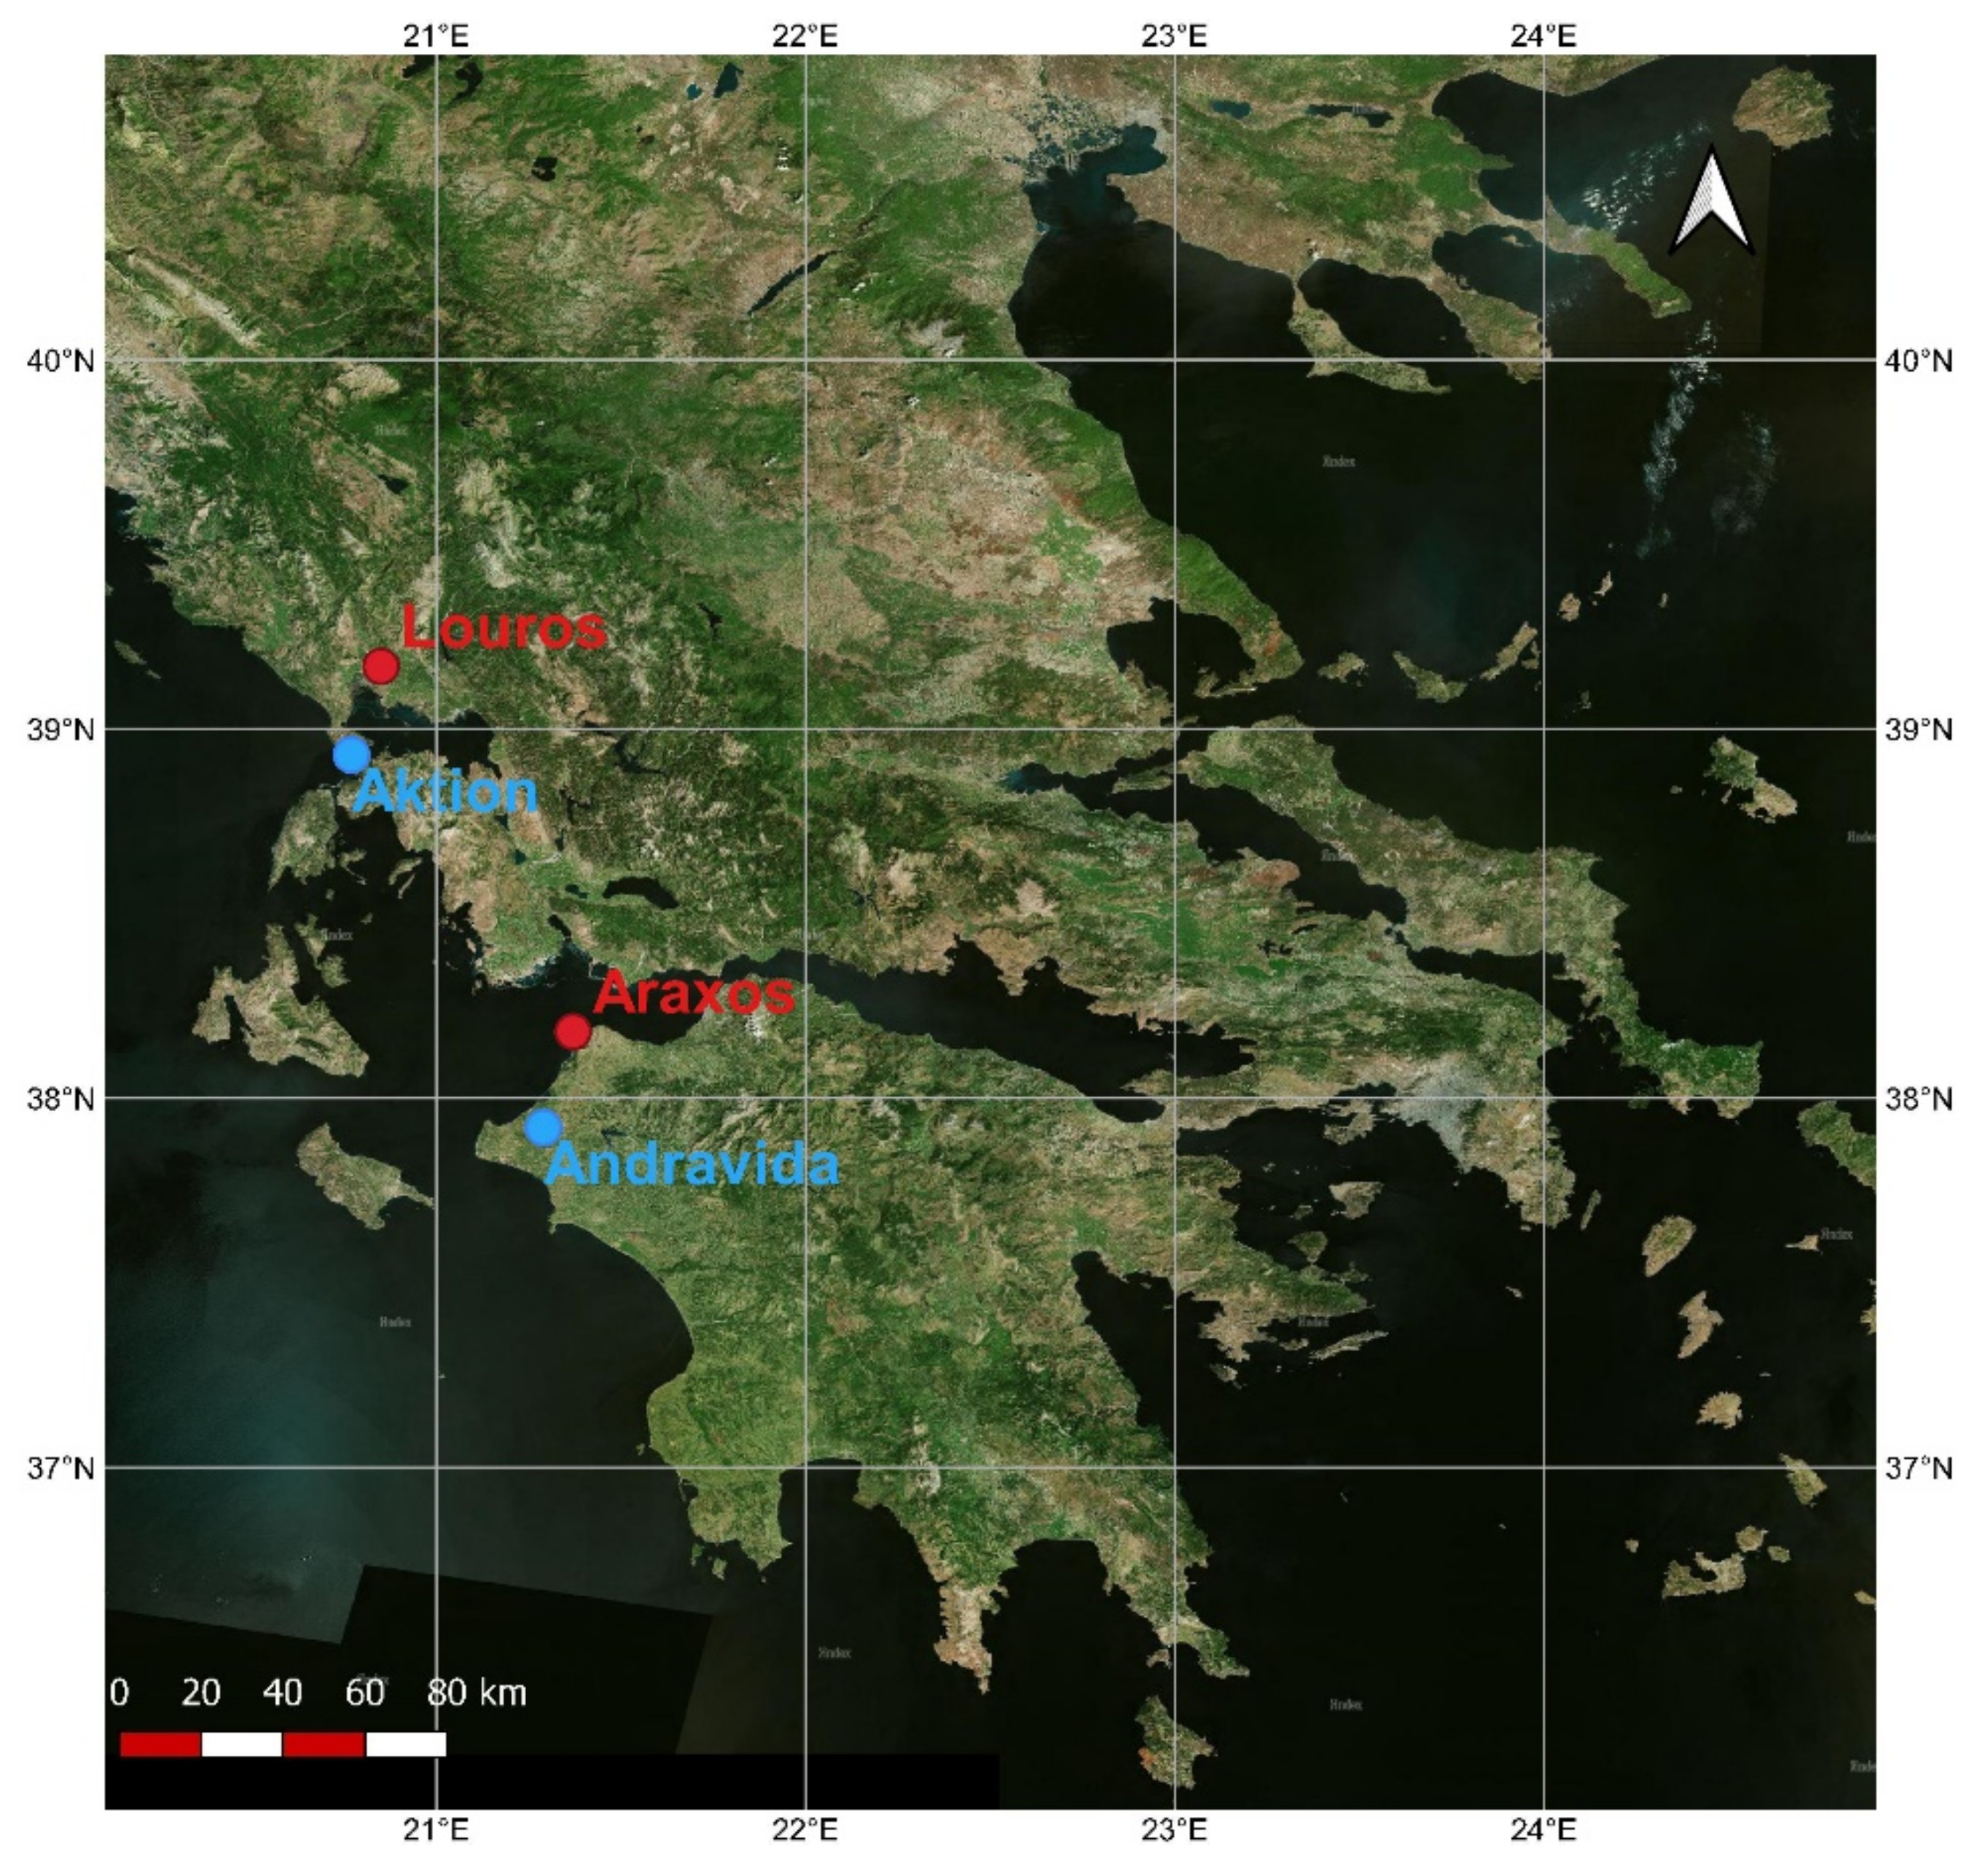
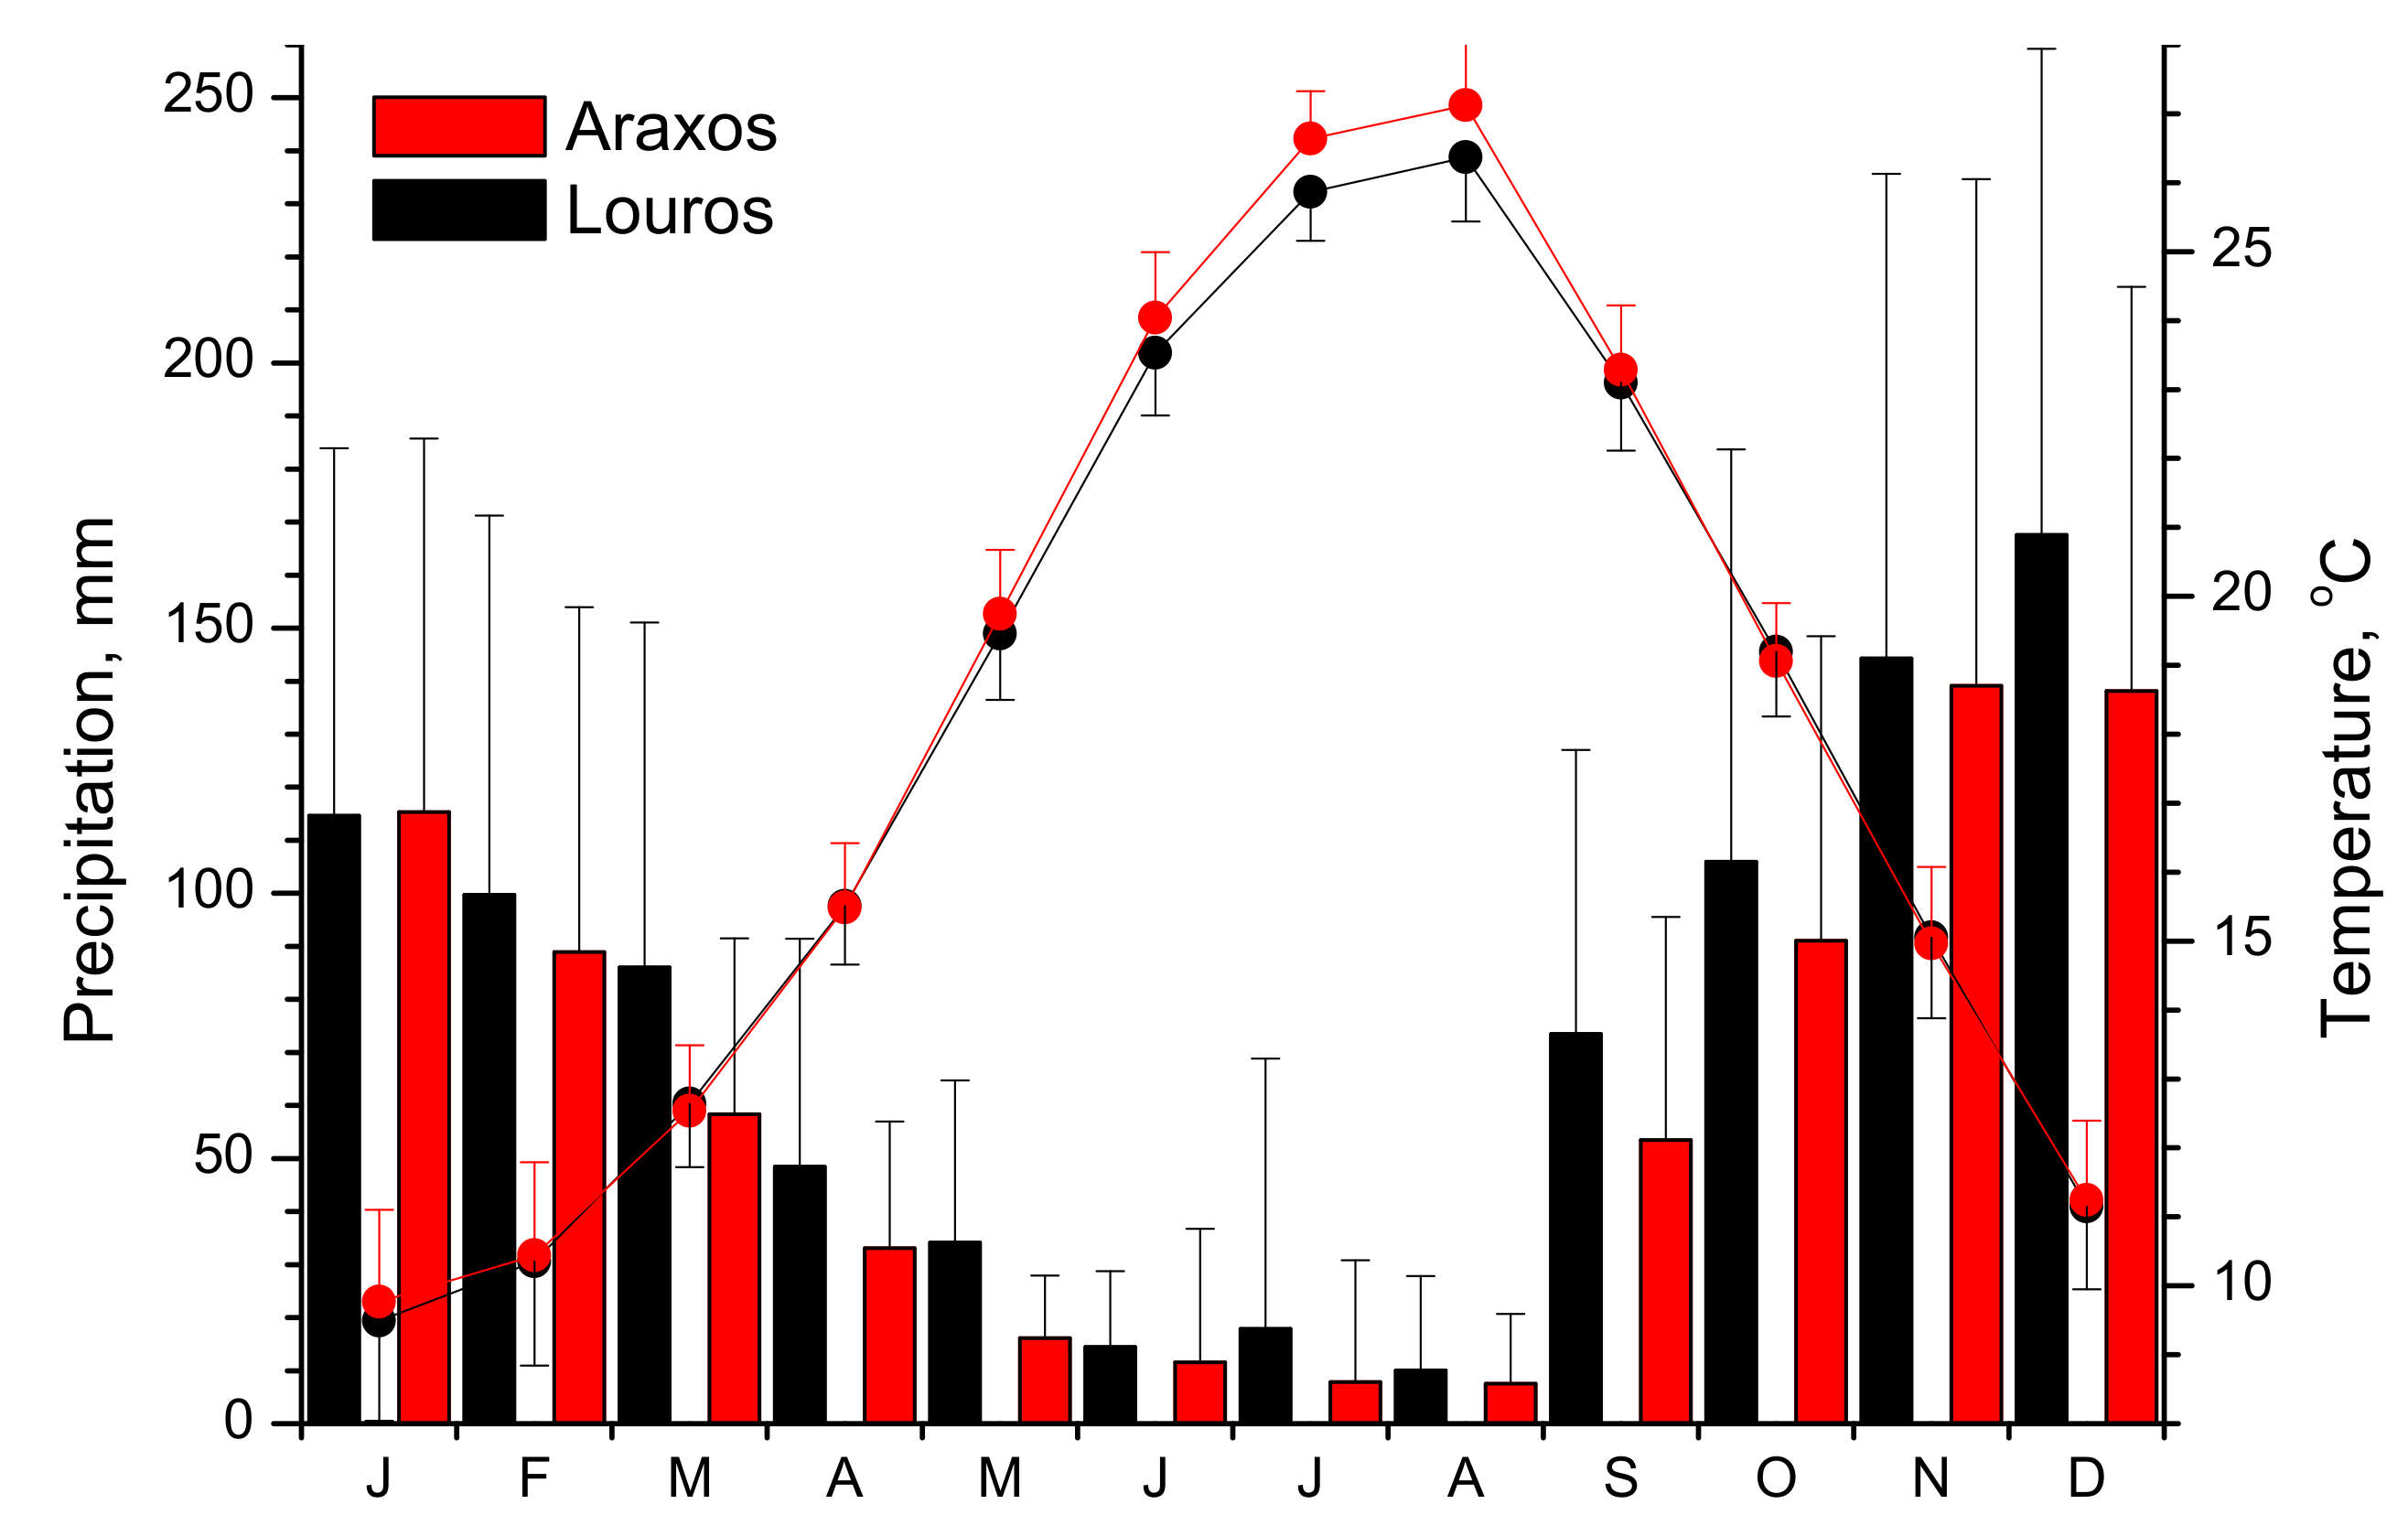
2.1. Study Sites
2.2. Meteorological Data
2.3. Species Description
2.4. Satellite Data
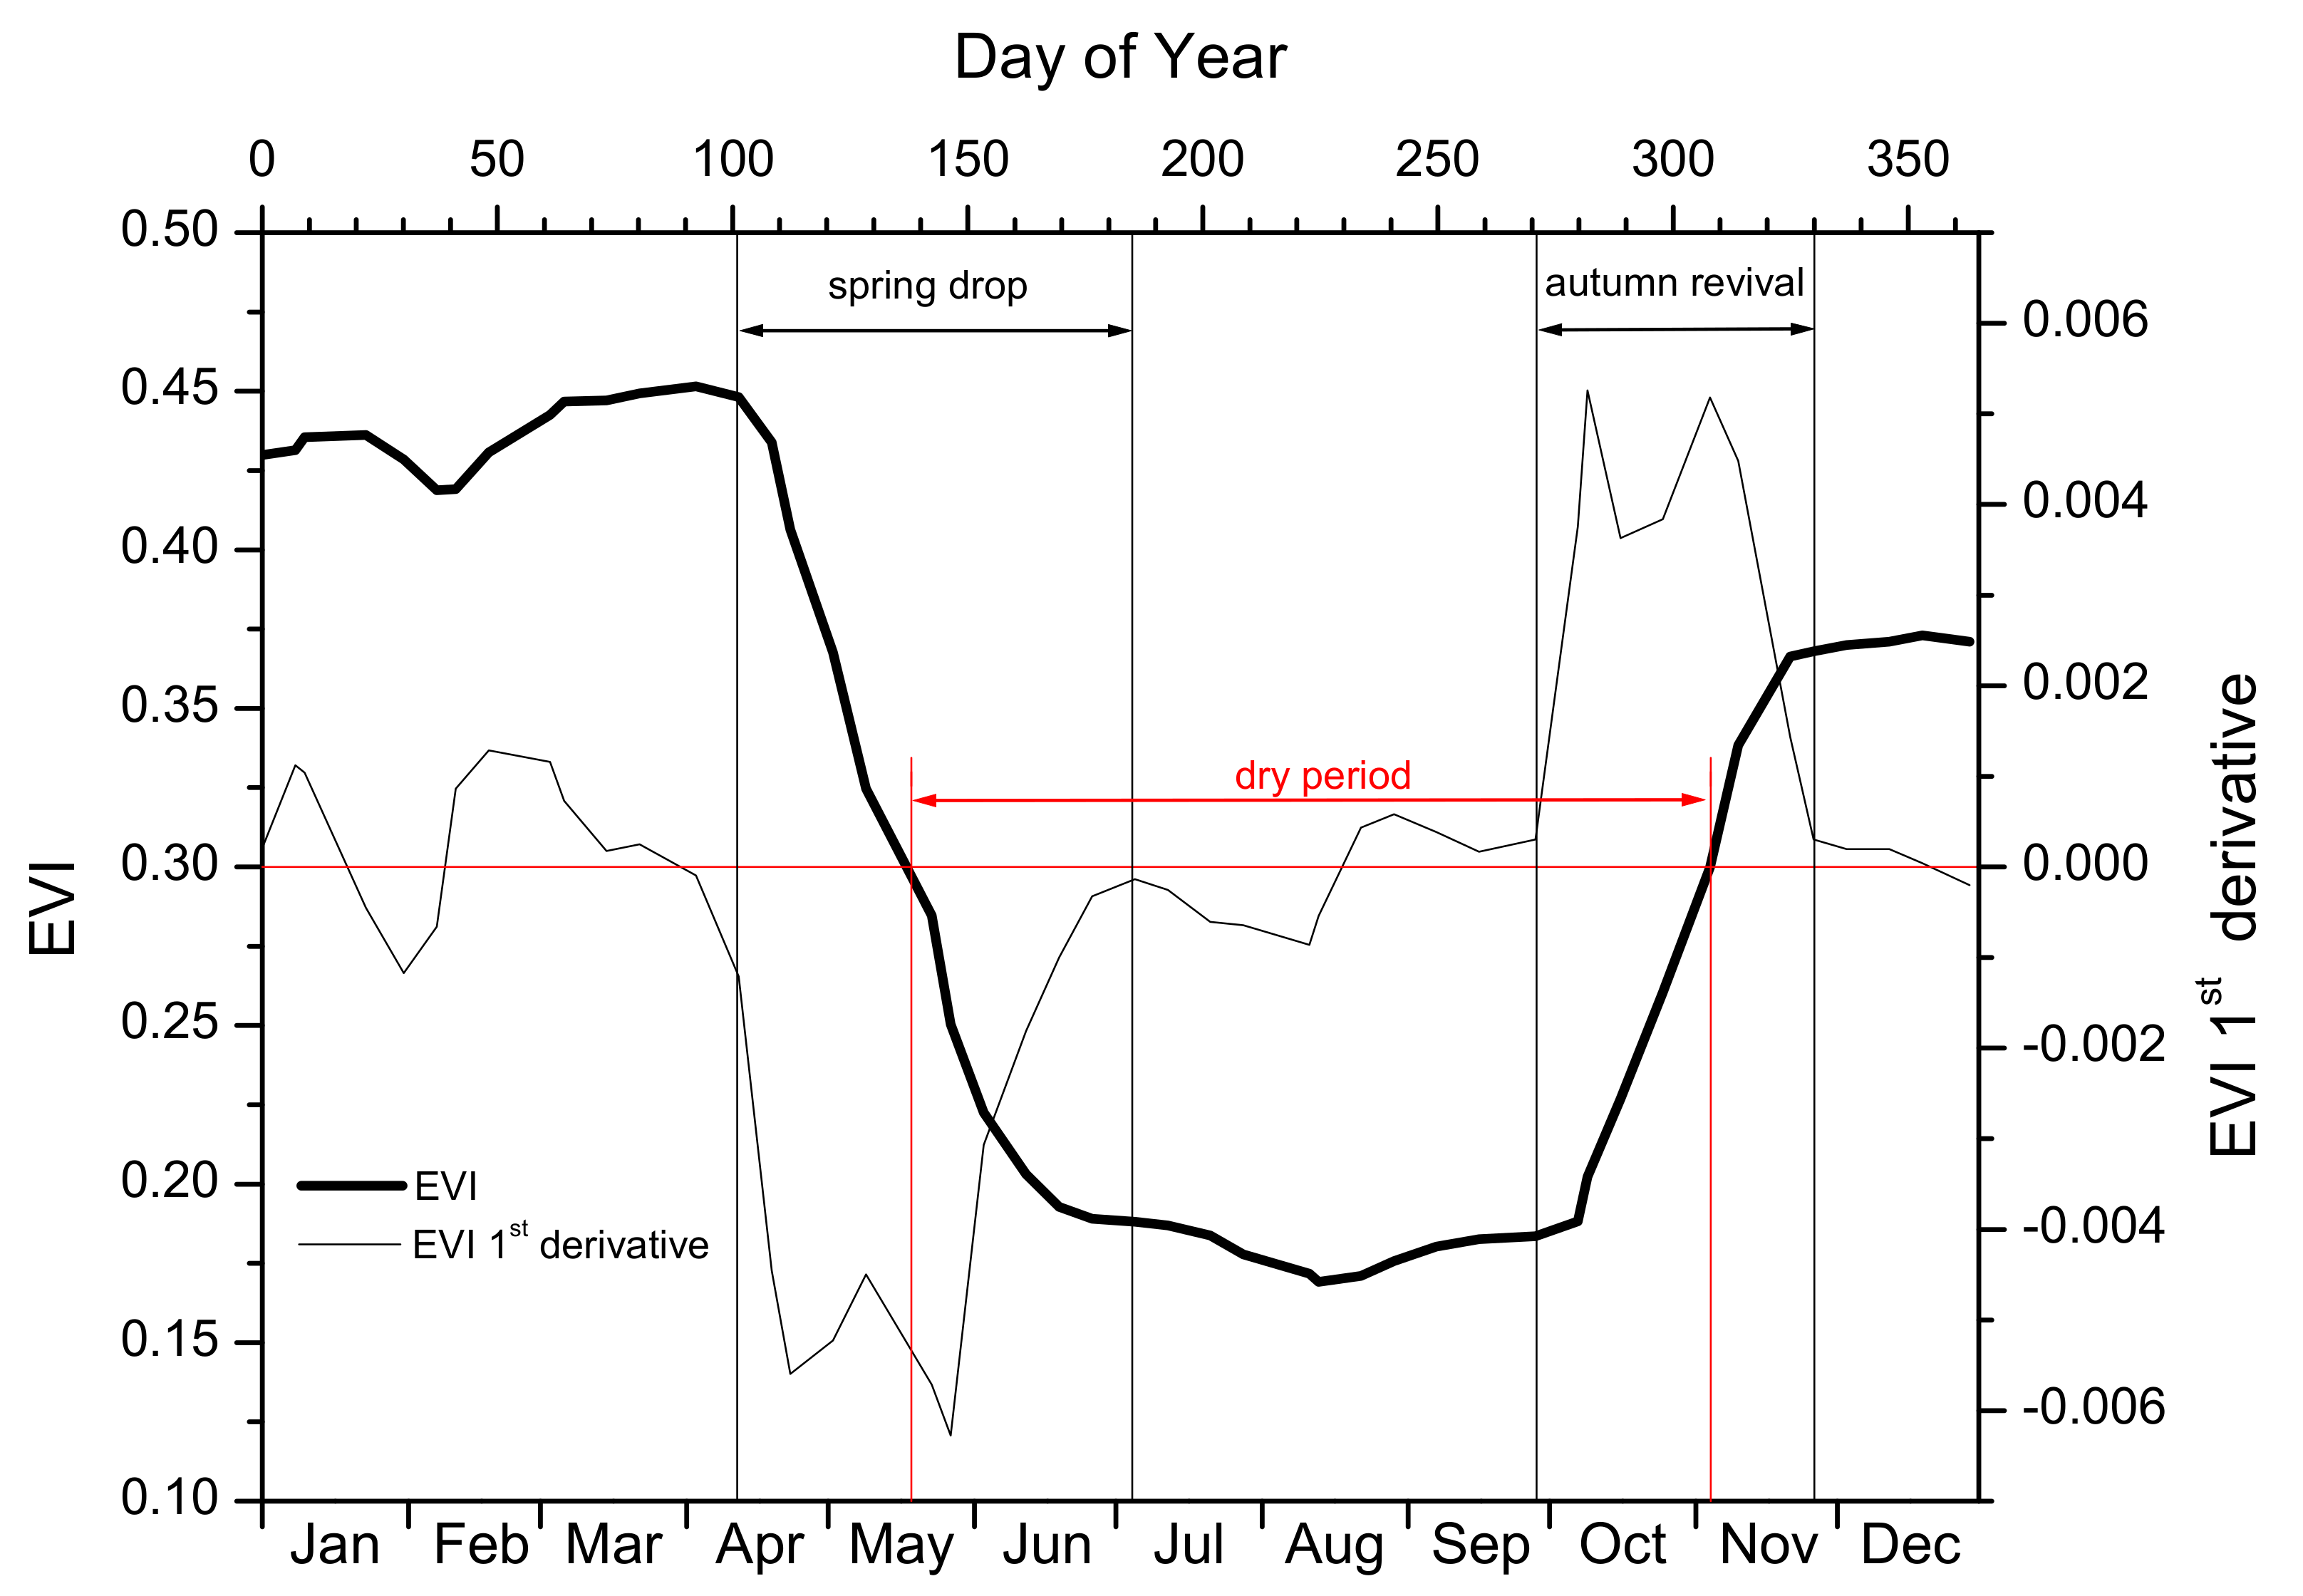
2.5. Phenology Metrics
2.6. Statistical Analysis
- Average temperature, total precipitation, and total rain days of one to six consecutive months before each phenological event, e.g., for a phenological event occurring in October, total precipitation of October and September (two months combination).
- Average temperature, total precipitation, and total rain days of one to five consecutive months with one to five months lag before the event, e.g., for a phenological event occurring in October, total precipitation of August and July (two months combination with two months lag time).
3. Results
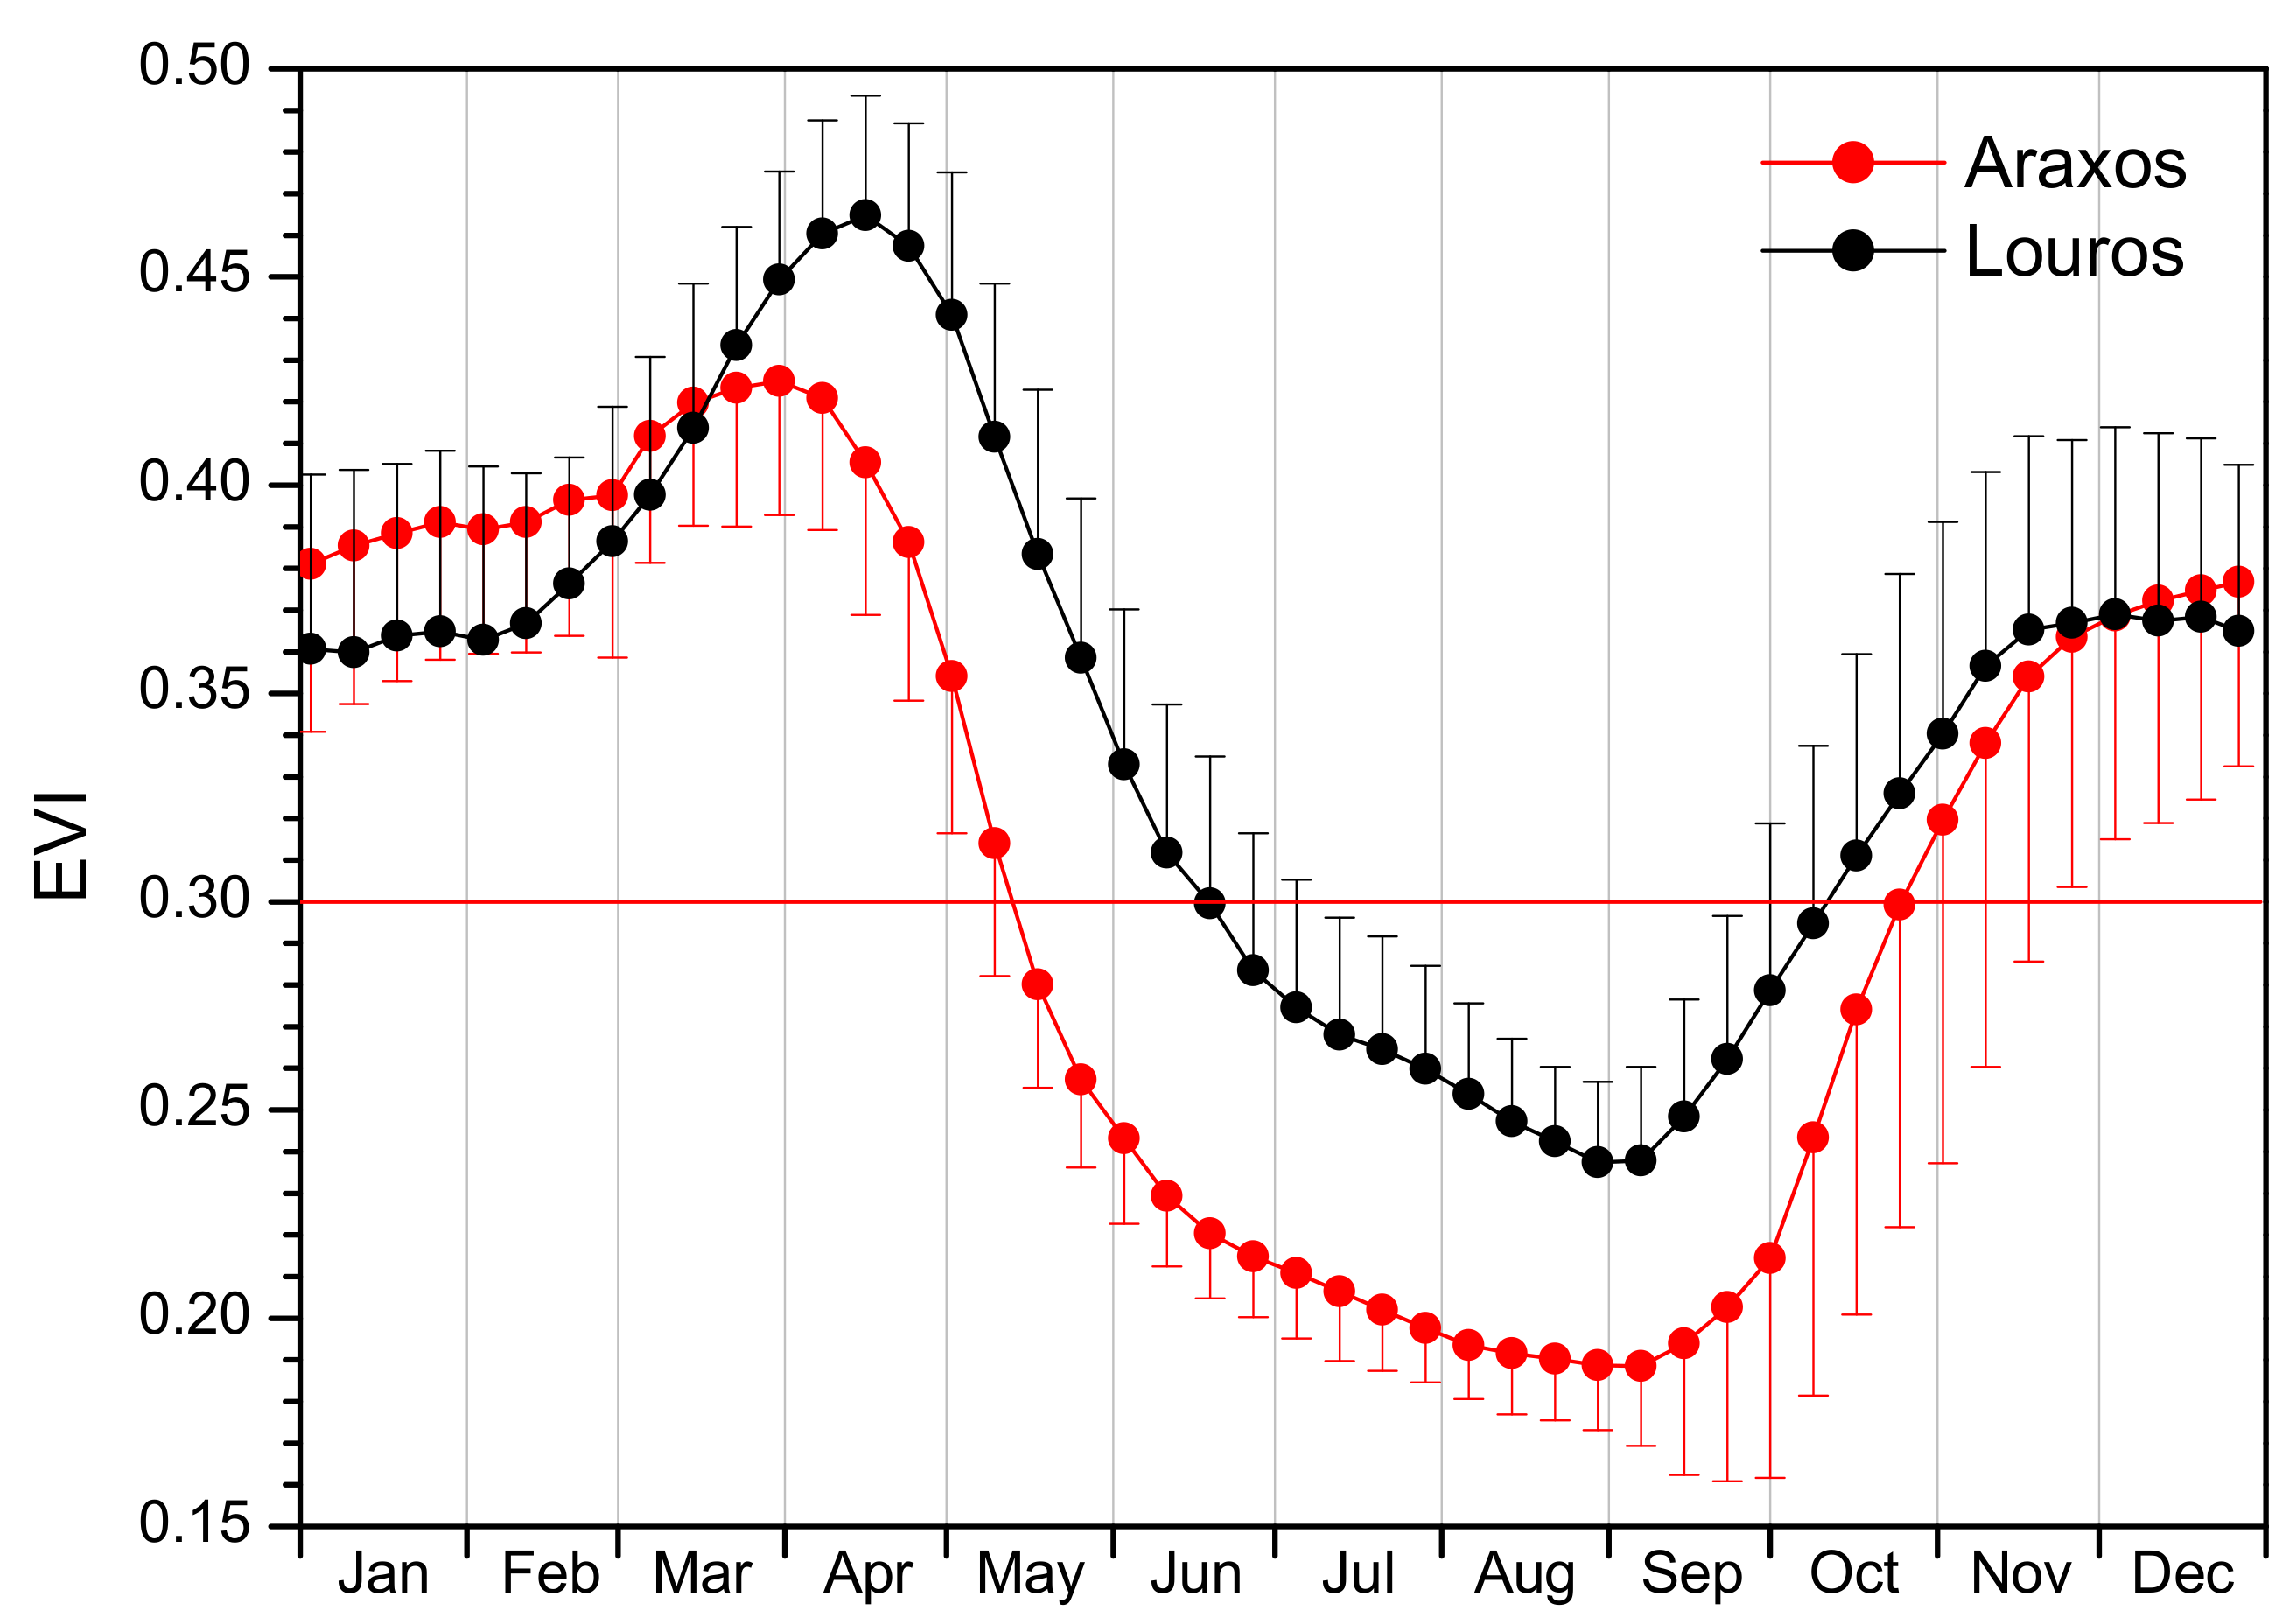
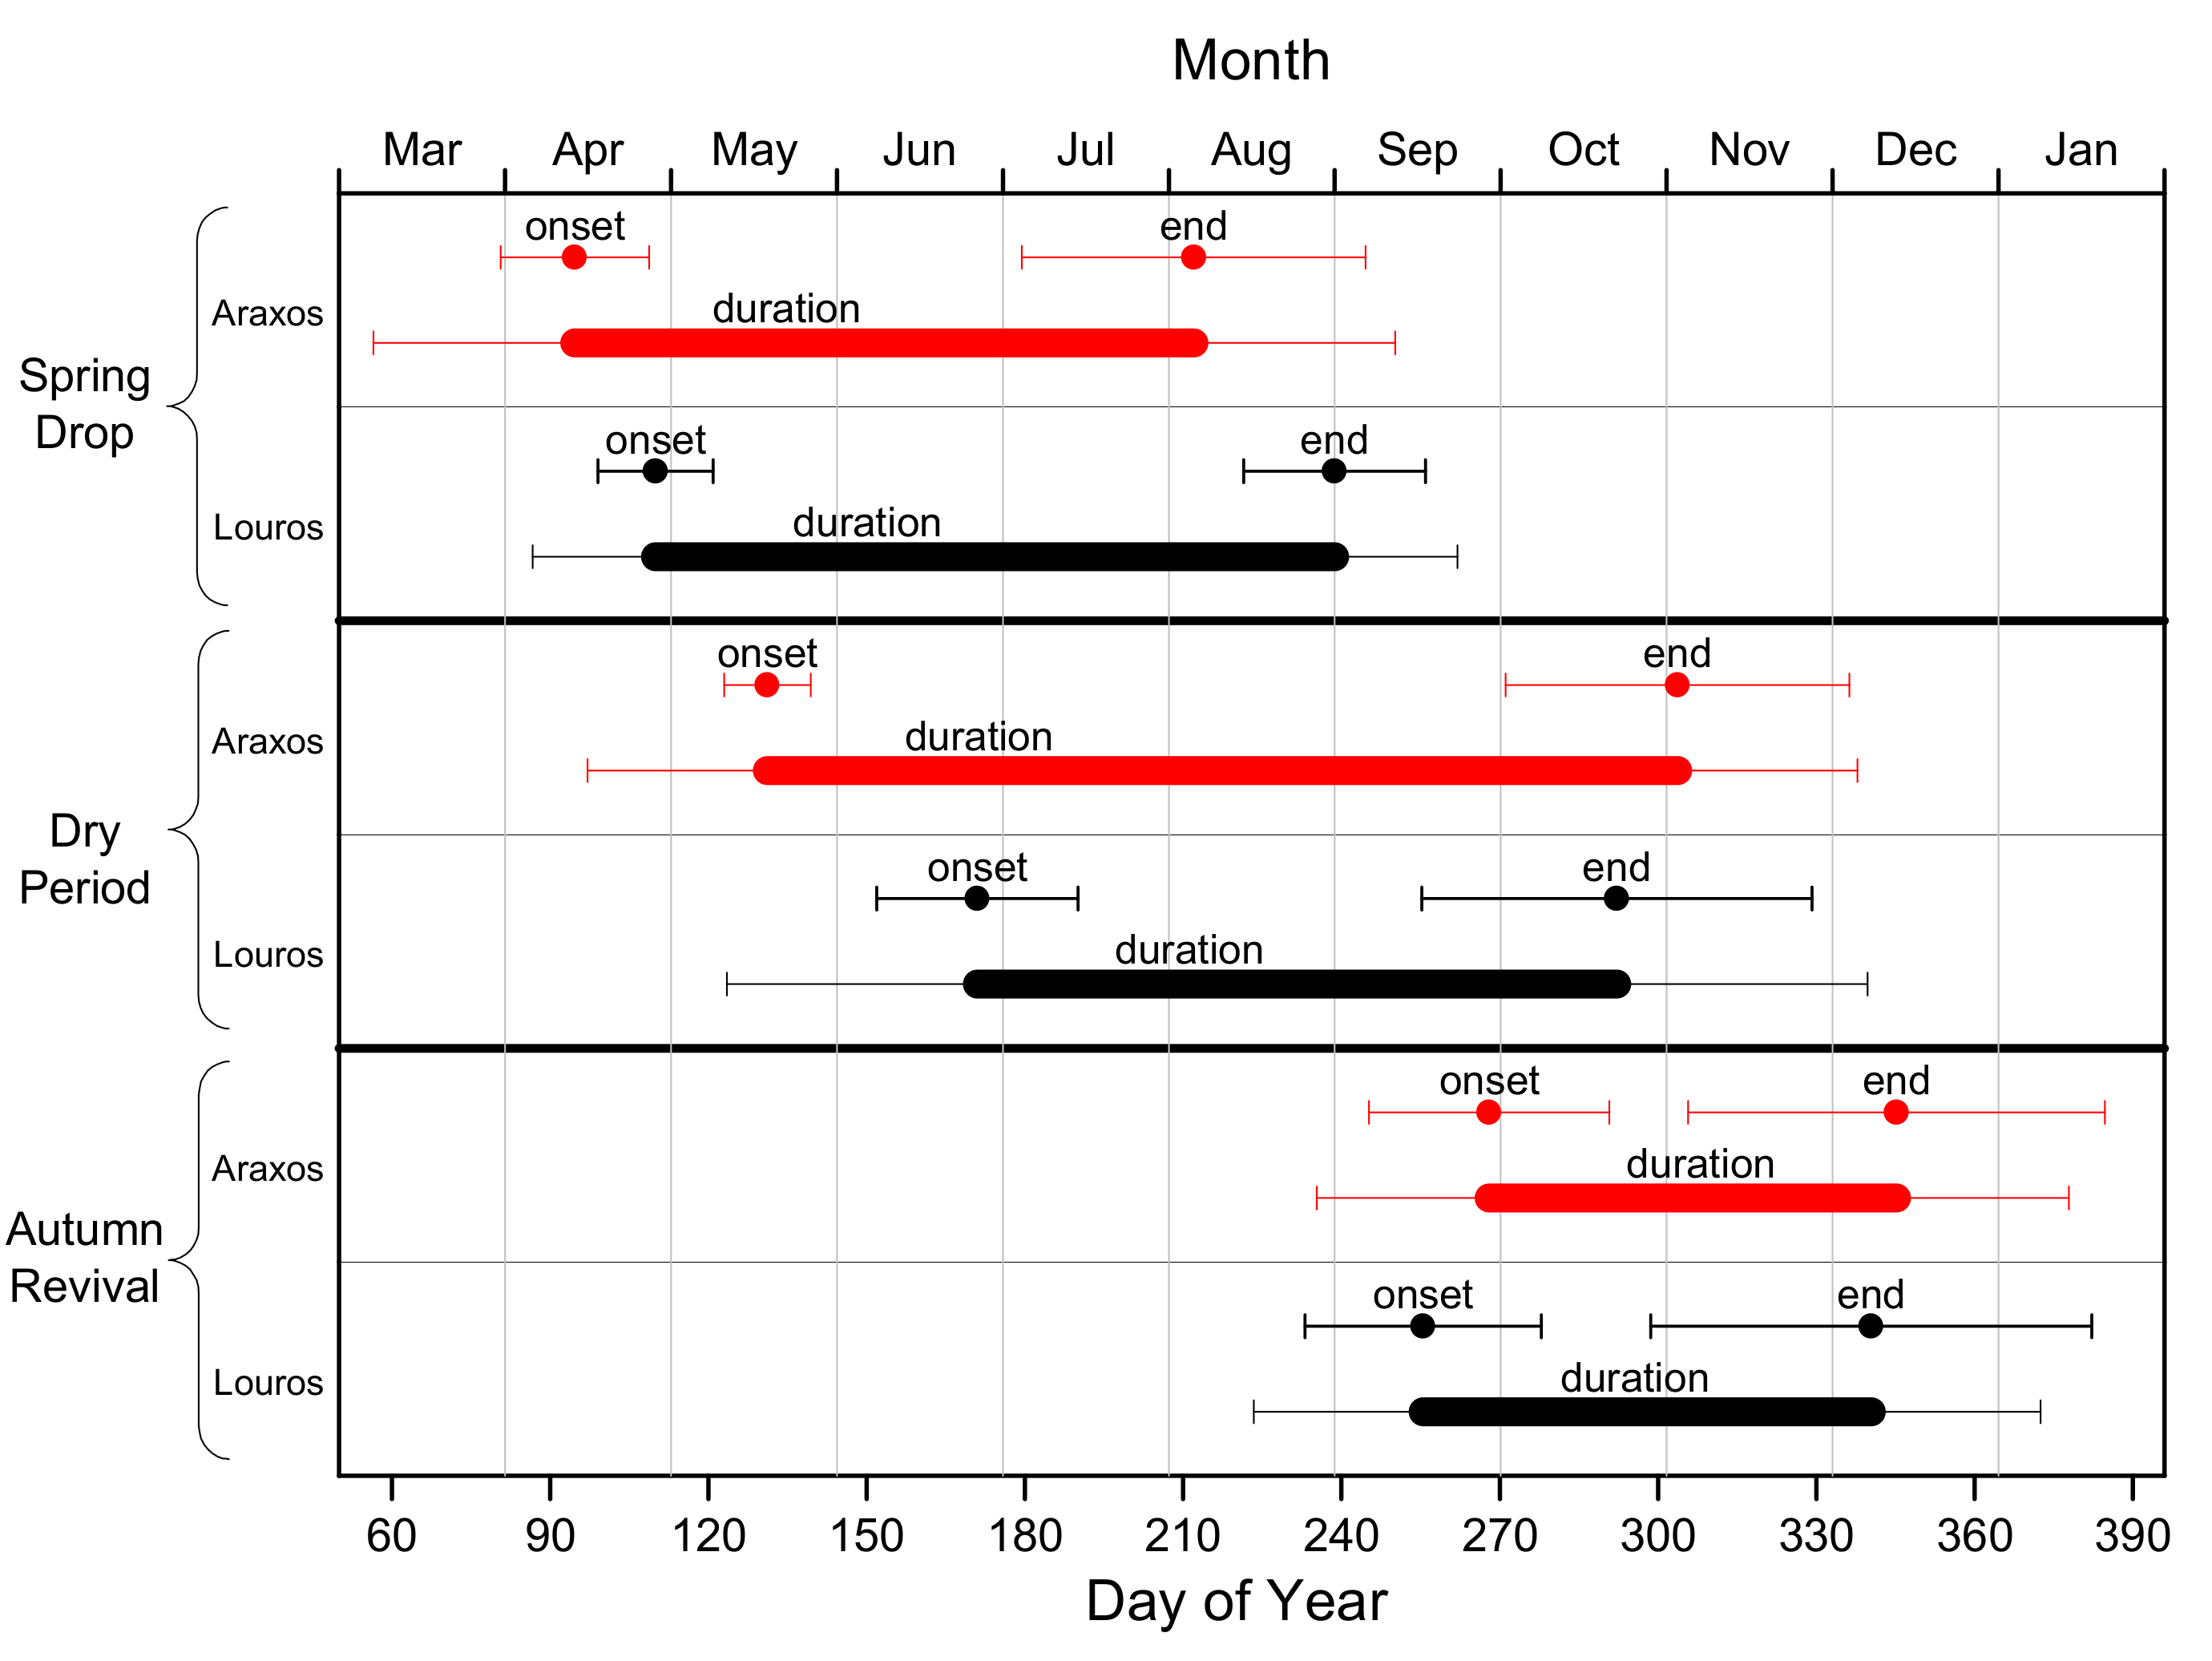
3.1. Phenology
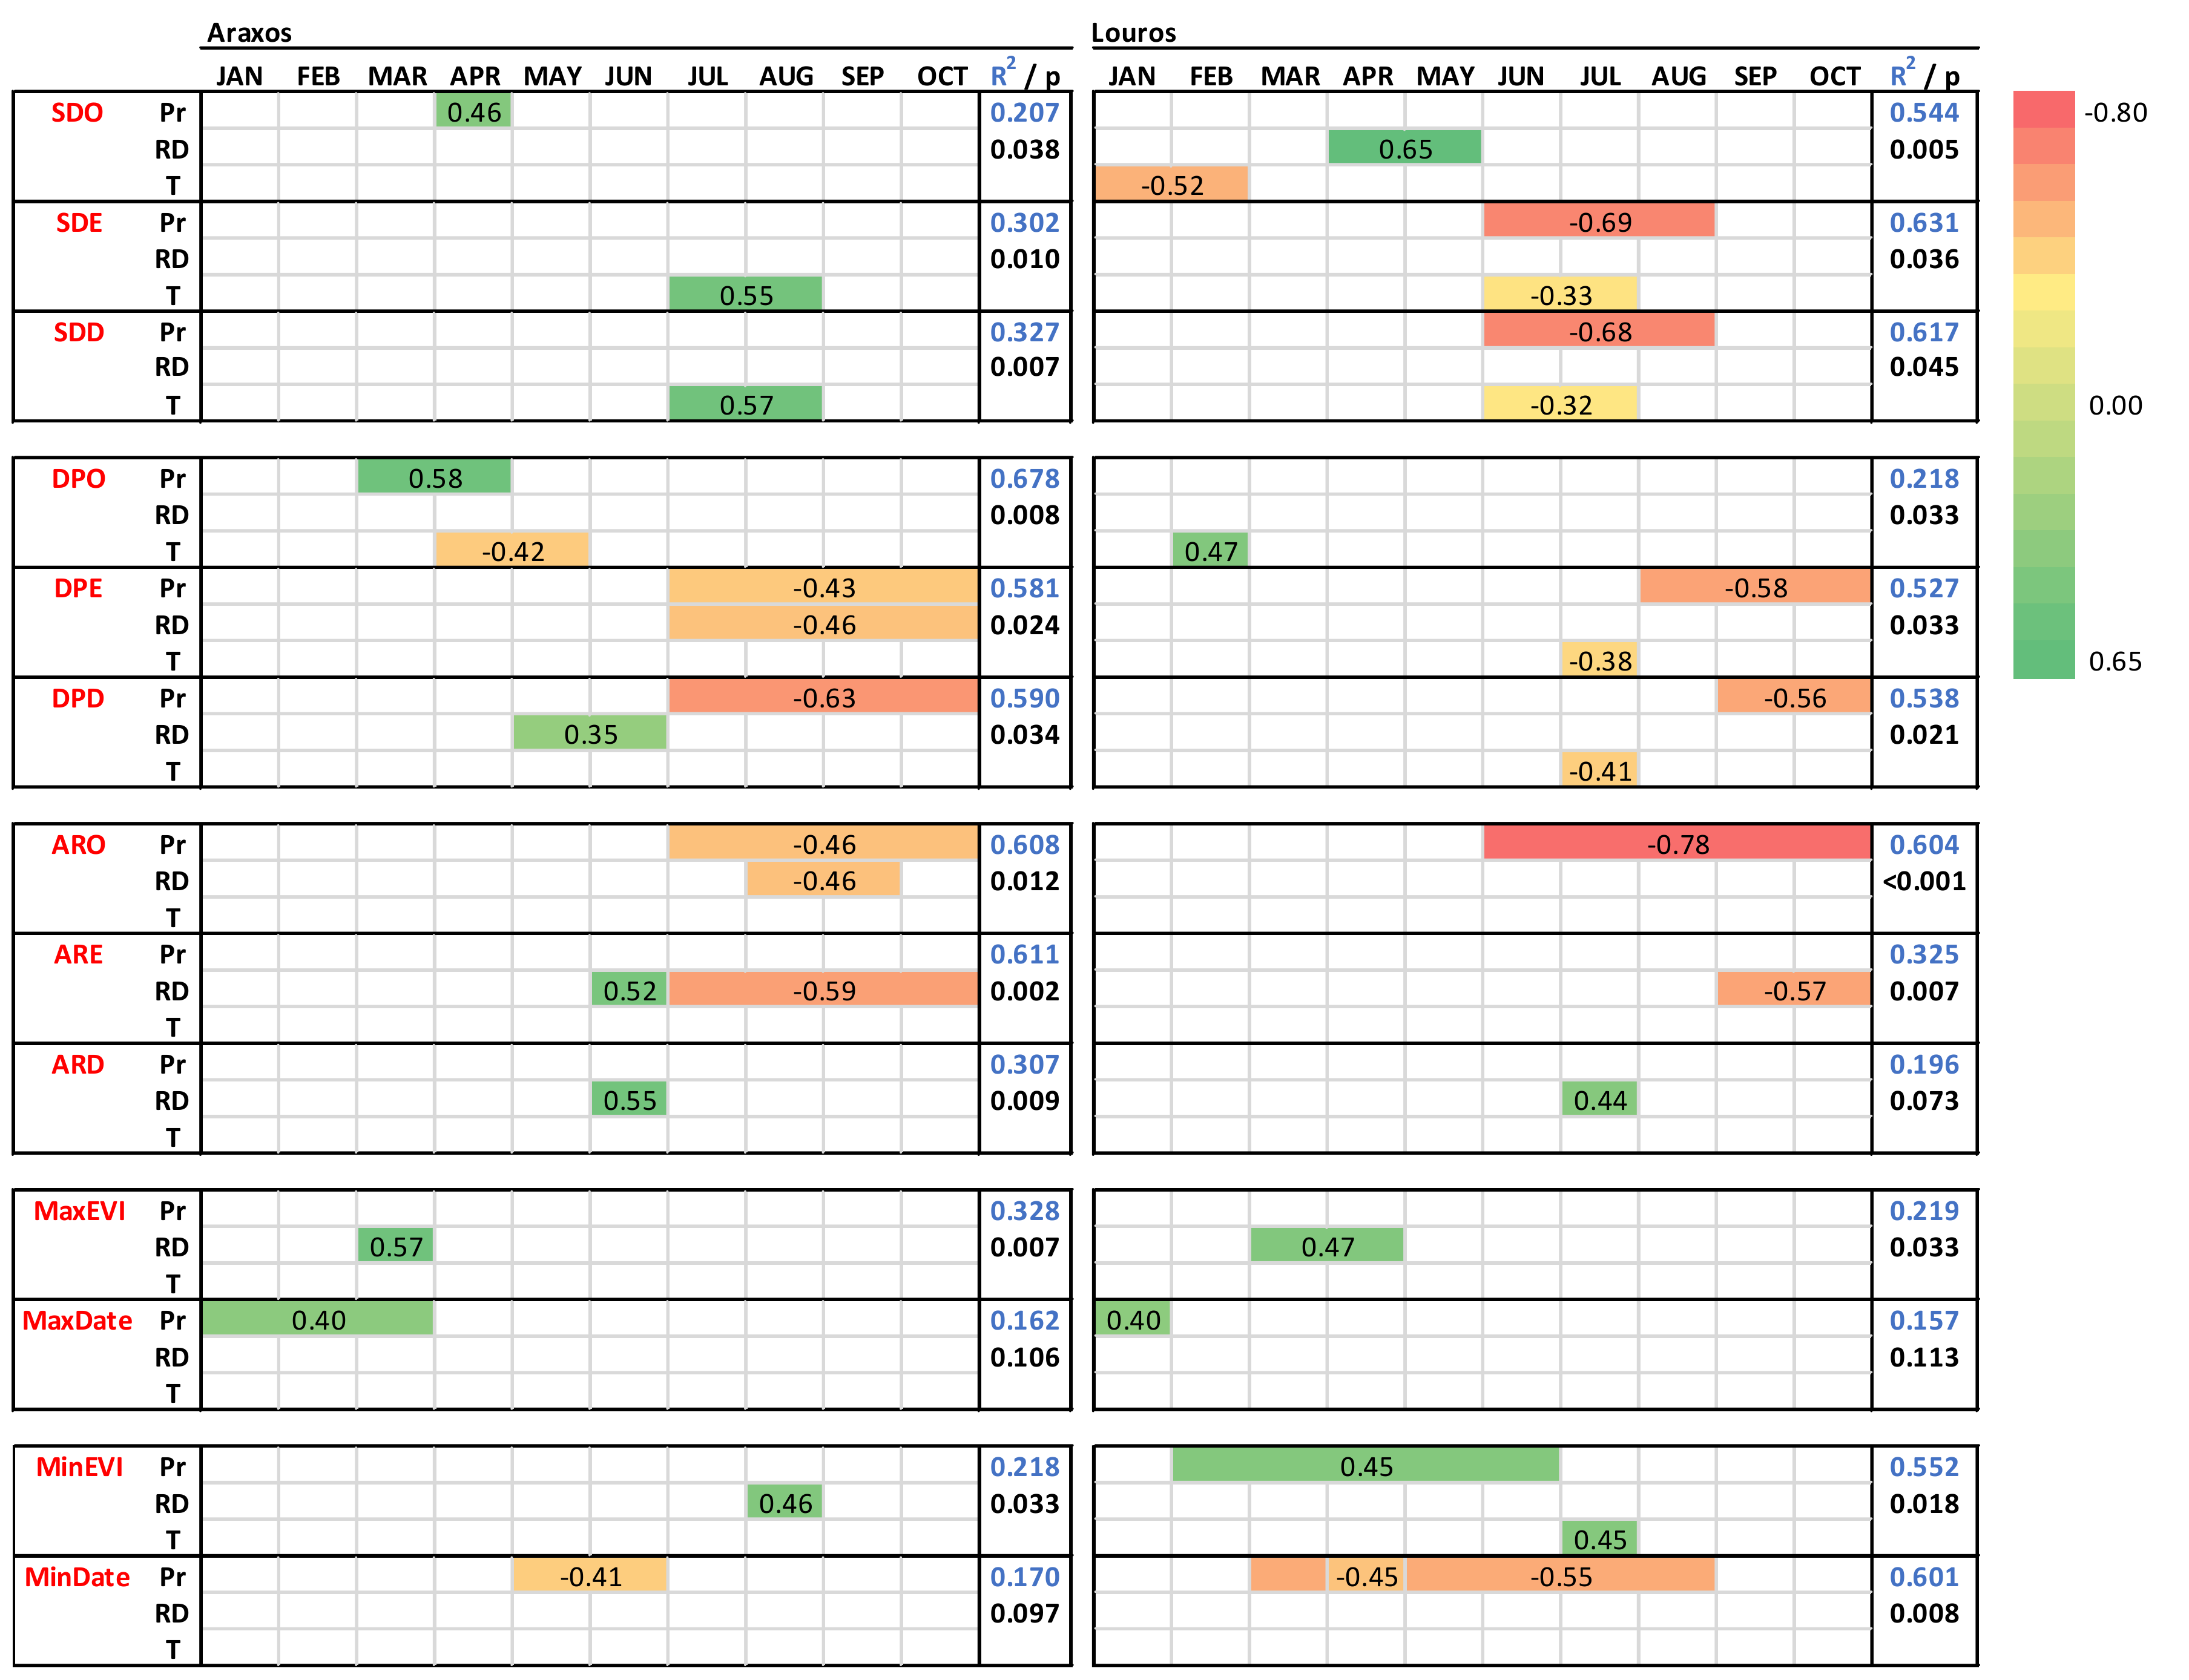
3.2. Phenology and Climatic Control
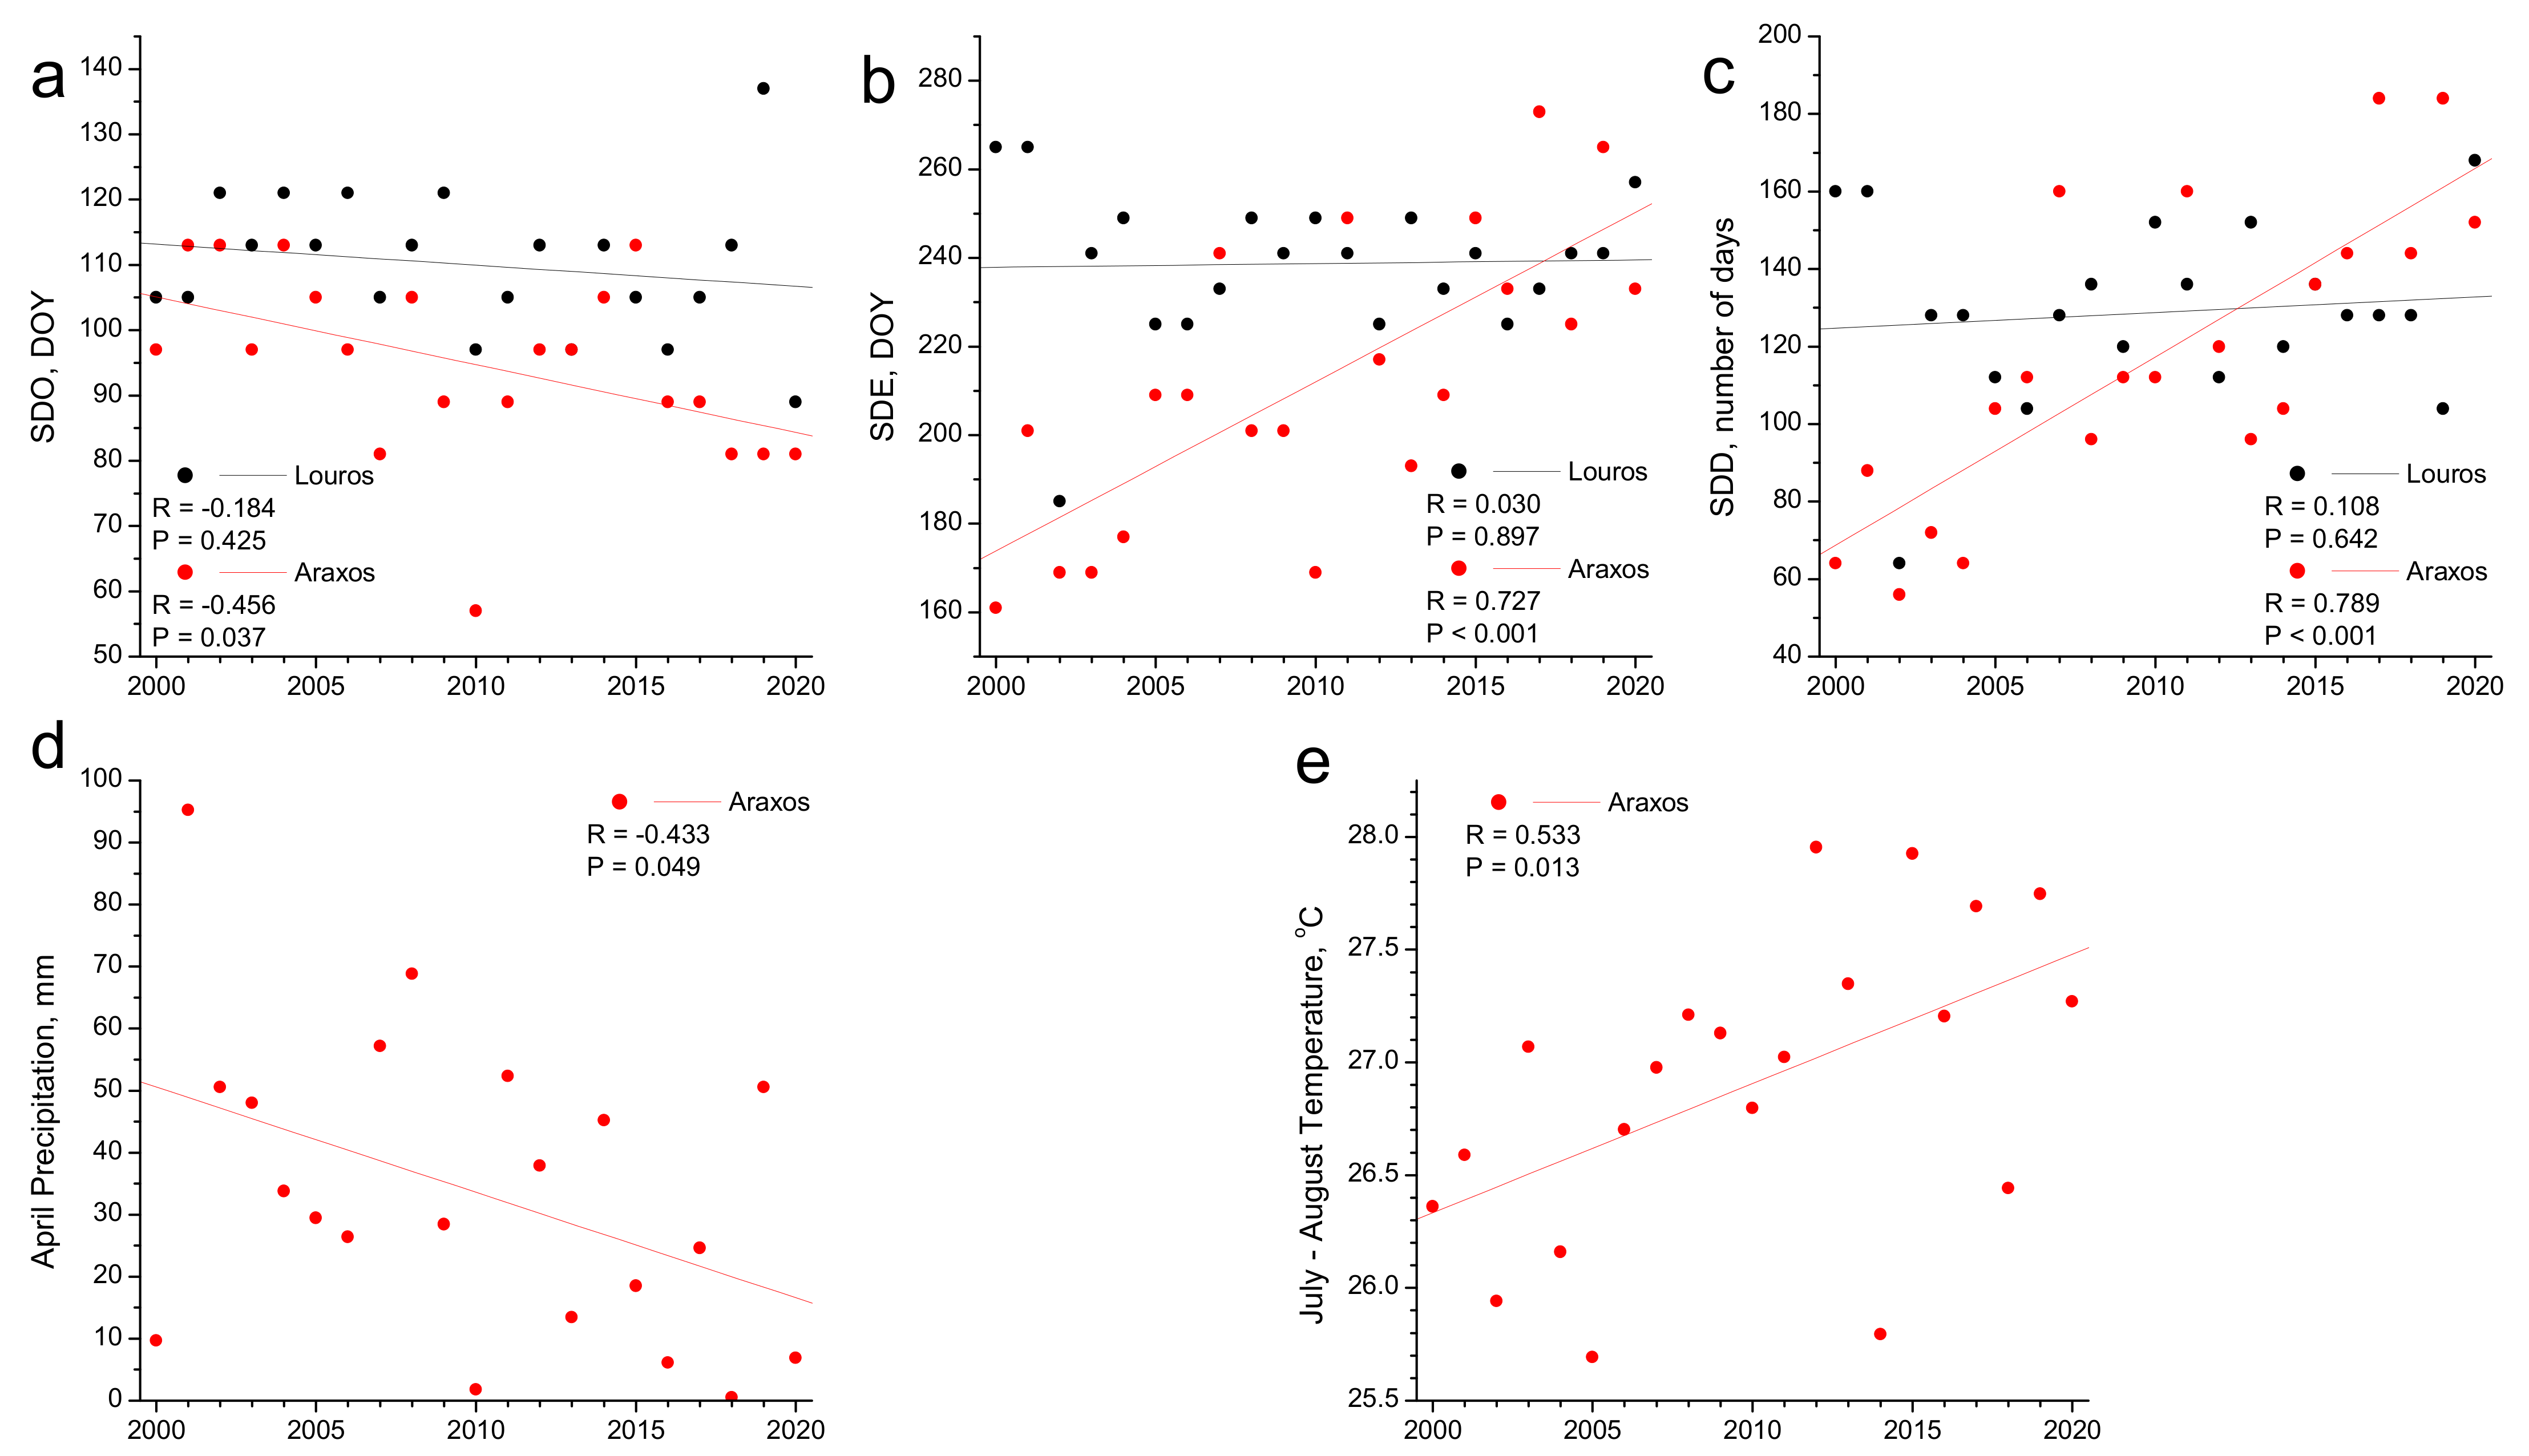
3.3. Phenology and Climate Change
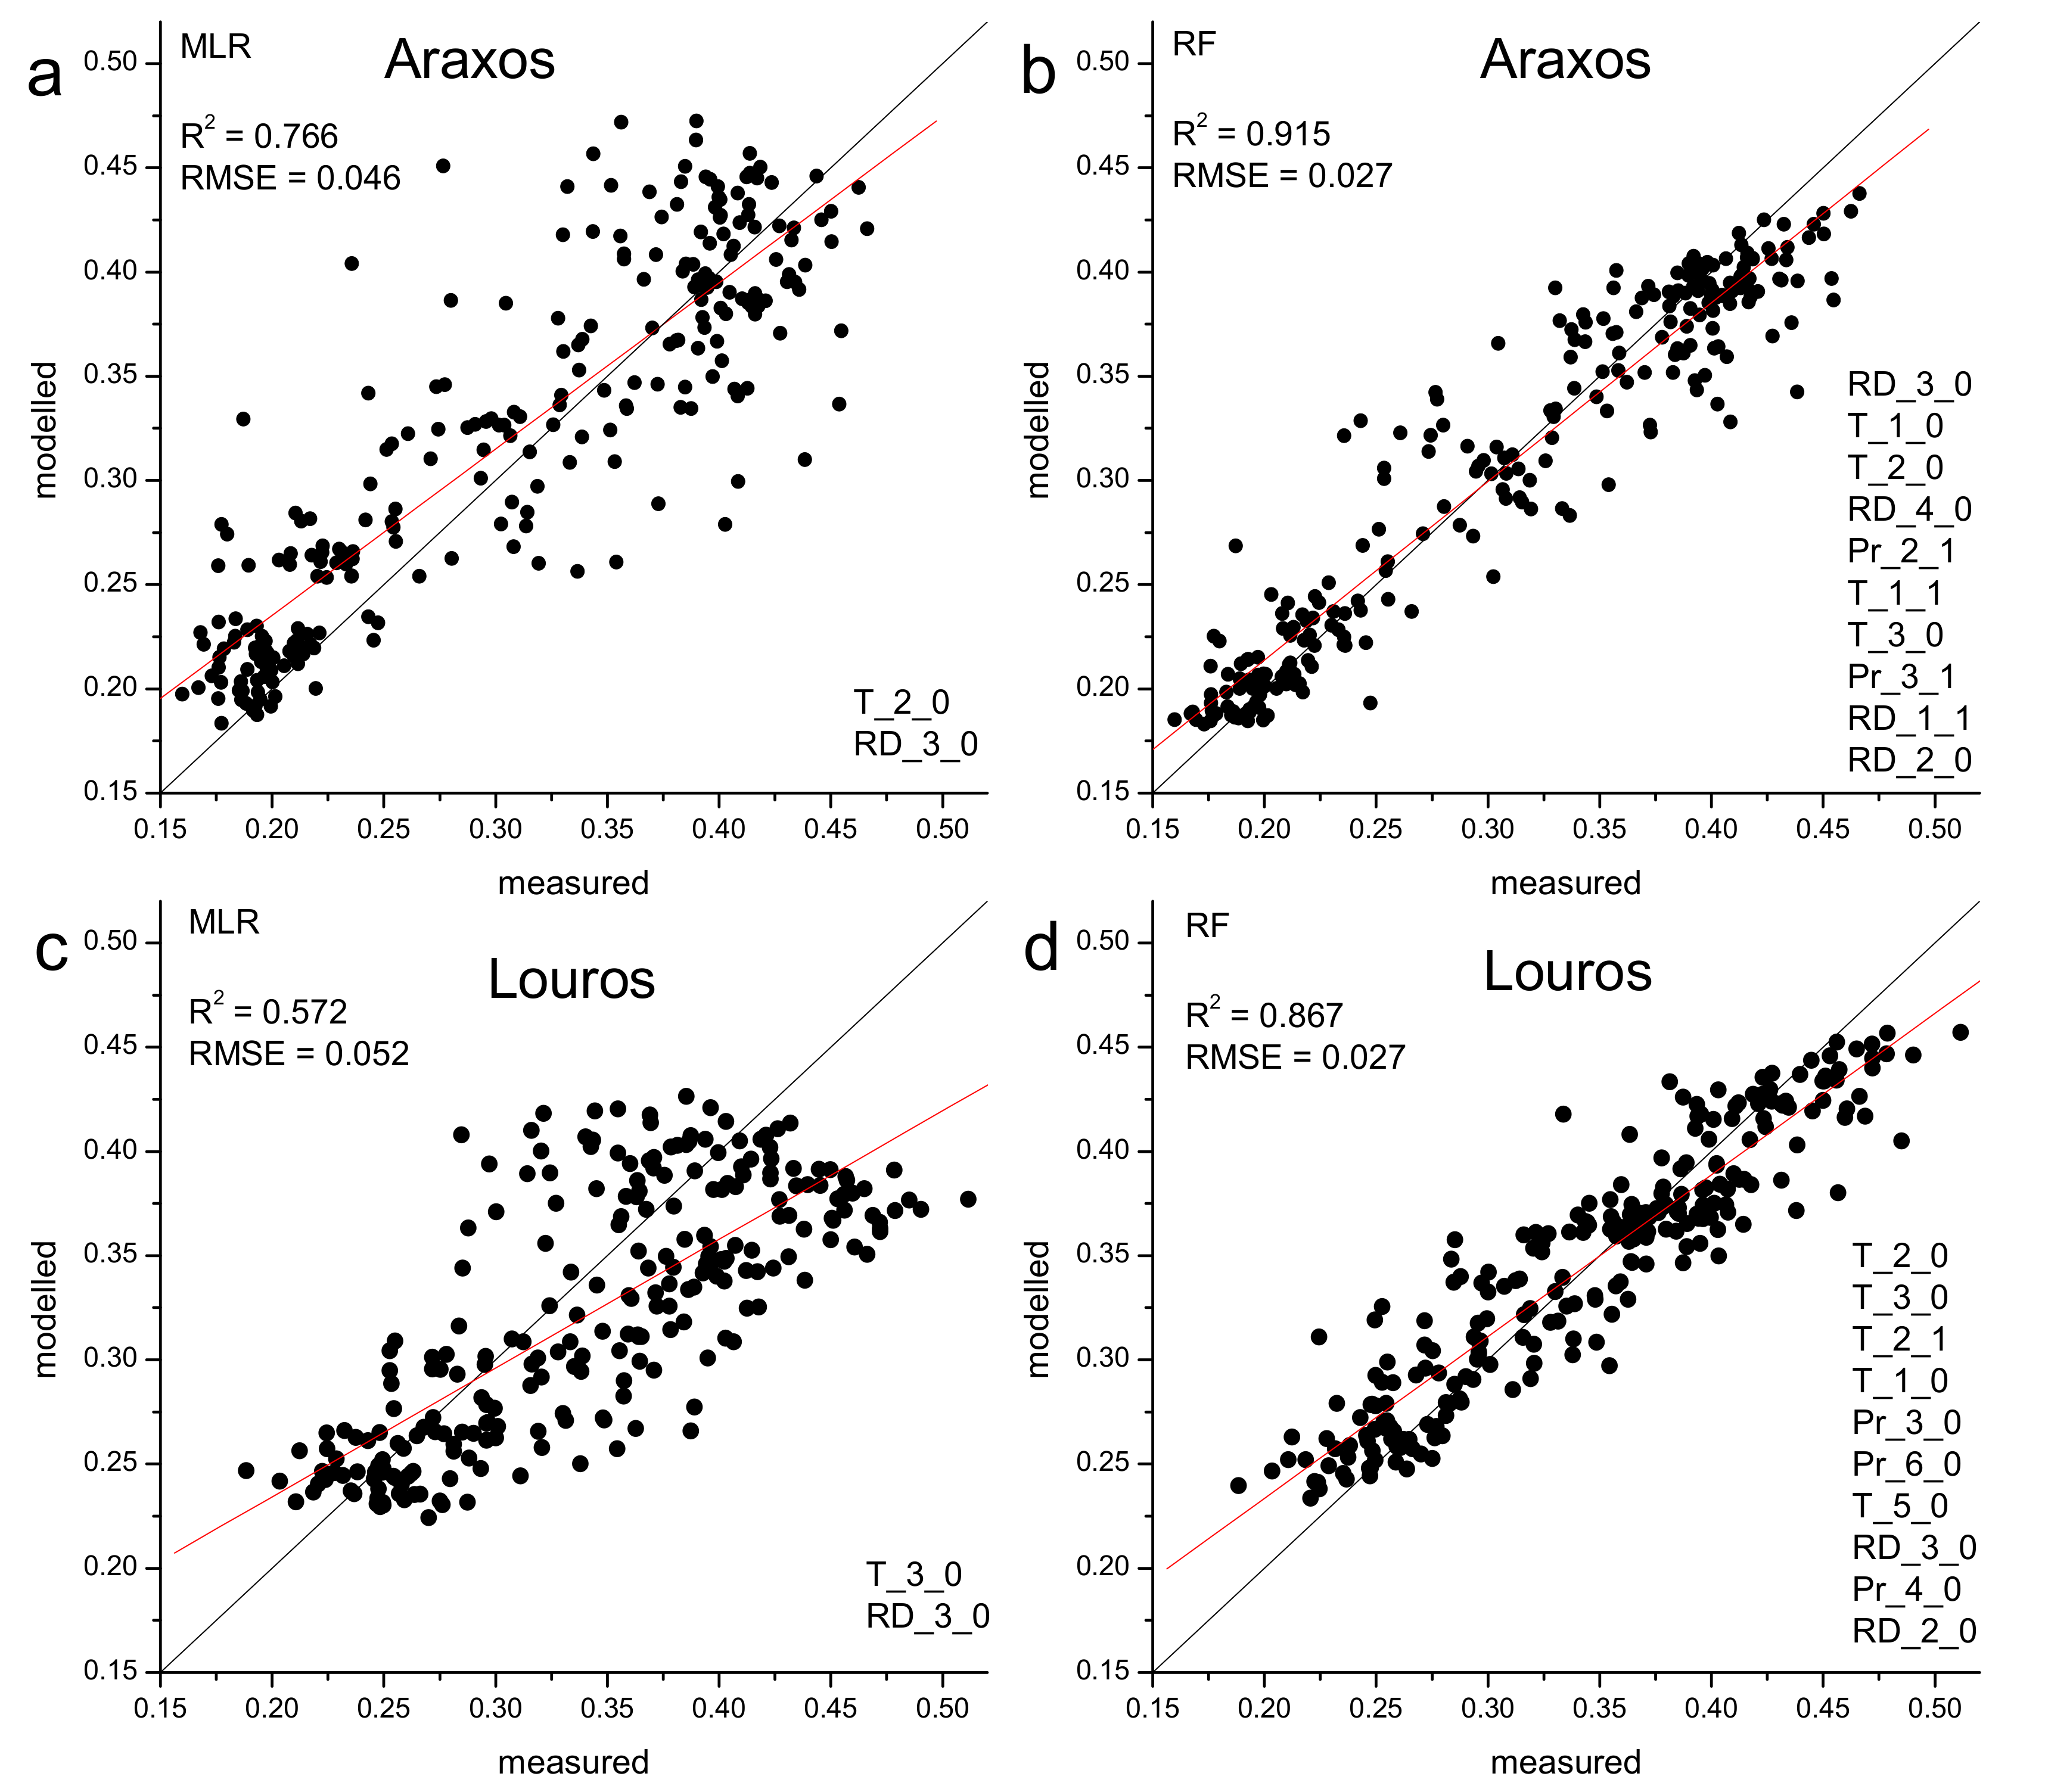
3.4. EVI and Climatic Control
4. Discussion
4.1. EVI Tntra- and Inter-Annual Fluctuation and Phenology Metrics
4.2. Climatic Control on Phenological Events
5. Conclusions
Author Contributions
Funding
Institutional Review Board Statement
Informed Consent Statement
Data Availability Statement
Conflicts of Interest
References
- Zhou, Y.; Zhang, L.; Fensholt, R.; Wang, K.; Vitkovskaya, I.; Tian, F. Climate Contributions to Vegetation Variations in Central Asian Drylands: Pre- and Post-USSR Collapse. Remote Sens. 2015, 7, 2449–2470. [Google Scholar] [CrossRef] [Green Version]
- Richardson, A.D.; Keenan, T.F.; Migliavacca, M.; Ryu, Y.; Sonnentag, O.; Toomey, M. Climate Change, Phenology, and Phenological Control of Vegetation Feedbacks to the Climate System. Agric. For. Meteorol. 2013, 169, 156–173. [Google Scholar] [CrossRef]
- Gordo, O.; Sanz, J.J. Long-Term Temporal Changes of Plant Phenology in the Western Mediterranean. Glob. Change Biol. 2009, 15, 1930–1948. [Google Scholar] [CrossRef]
- Ivits, E.; Cherlet, M.; Tóth, G.; Sommer, S.; Mehl, W.; Vogt, J.; Micale, F. Combining Satellite Derived Phenology with Climate Data for Climate Change Impact Assessment. Glob. Planet. Change 2012, 88–89, 85–97. [Google Scholar] [CrossRef]
- Chen, F.; Liu, Z.; Zhong, H.; Wang, S. Exploring the Applicability and Scaling Effects of Satellite-Observed Spring and Autumn Phenology in Complex Terrain Regions Using Four Different Spatial Resolution Products. Remote Sens. 2021, 13, 4582. [Google Scholar] [CrossRef]
- Levizou, E.; Manetas, Y. Combined Effects of Enhanced UV-B Radiation and Additional Nutrients on Growth of Two Mediterranean Plant Species. In Responses of Plants to UV-B Radiation; Advances in Vegetation Science; Rozema, J., Manetas, Y., Björn, L.-O., Eds.; Springer: Dordrecht, The Netherlands, 2001; pp. 179–186. ISBN 978-94-017-2892-8. [Google Scholar]
- Caldwell, M.M.; Bornman, J.F.; Ballaré, C.L.; Flint, S.D.; Kulandaivelu, G. Terrestrial Ecosystems, Increased Solar Ultraviolet Radiation, and Interactions with Other Climate Change Factors. Photochem. Photobiol. Sci. 2007, 6, 252–266. [Google Scholar] [CrossRef]
- Körner, C.; Paulsen, J. A World-wide Study of High Altitude Treeline Temperatures. Available online: https://onlinelibrary.wiley.com/doi/full/10.1111/j.1365-2699.2003.01043.x (accessed on 23 December 2021).
- Dahlin, K.M.; Asner, G.P.; Field, C.B. Environmental and Community Controls on Plant Canopy Chemistry in a Mediterranean-Type Ecosystem. Proc. Natl. Acad. Sci. USA 2013, 110, 6895–6900. [Google Scholar] [CrossRef] [Green Version]
- Burkett, V.R.; Wilcox, D.A.; Stottlemyer, R.; Barrow, W.; Fagre, D.; Baron, J.; Price, J.; Nielsen, J.L.; Allen, C.D.; Peterson, D.L.; et al. Nonlinear Dynamics in Ecosystem Response to Climatic Change: Case Studies and Policy Implications. Ecol. Complex. 2005, 2, 357–394. [Google Scholar] [CrossRef] [Green Version]
- Cao, R.; Chen, J.; Shen, M.; Tang, Y. An Improved Logistic Method for Detecting Spring Vegetation Phenology in Grasslands from MODIS EVI Time-Series Data. Agric. For. Meteorol. 2015, 200, 9–20. [Google Scholar] [CrossRef]
- Cerlini, P.B.; Saraceni, M.; Orlandi, F.; Silvestri, L.; Fornaciari, M. Phenological Response to Temperature Variability and Orography in Central Italy. Int. J. Biometeorol. 2022, 66, 71–86. [Google Scholar] [CrossRef]
- Liu, Y.; Hill, M.J.; Zhang, X.; Wang, Z.; Richardson, A.D.; Hufkens, K.; Filippa, G.; Baldocchi, D.D.; Ma, S.; Verfaillie, J.; et al. Using Data from Landsat, MODIS, VIIRS and PhenoCams to Monitor the Phenology of California Oak/Grass Savanna and Open Grassland across Spatial Scales. Agric. For. Meteorol. 2017, 237–238, 311–325. [Google Scholar] [CrossRef]
- Sangüesa-Barreda, G.; Di Filippo, A.; Piovesan, G.; Rozas, V.; Di Fiore, L.; García-Hidalgo, M.; García-Cervigón, A.I.; Muñoz-Garachana, D.; Baliva, M.; Olano, J.M. Warmer Springs Have Increased the Frequency and Extension of Late-Frost Defoliations in Southern European Beech Forests. Sci. Total Environ. 2021, 775, 145860. [Google Scholar] [CrossRef] [PubMed]
- Busetto, L.; Colombo, R.; Migliavacca, M.; Cremonese, E.; Meroni, M.; Galvagno, M.; Rossini, M.; Siniscalco, C.; Morra Di Cella, U.; Pari, E. Remote Sensing of Larch Phenological Cycle and Analysis of Relationships with Climate in the Alpine Region. Glob. Change Biol. 2010, 16, 2504–2517. [Google Scholar] [CrossRef]
- Carpintero, E.; Andreu, A.; Gómez-Giráldez, P.J.; Blázquez, Á.; González-Dugo, M.P. Remote-Sensing-Based Water Balance for Monitoring of Evapotranspiration and Water Stress of a Mediterranean Oak–Grass Savanna. Water 2020, 12, 1418. [Google Scholar] [CrossRef]
- Touhami, I.; Moutahir, H.; Assoul, D.; Bergaoui, K.; Aouinti, H.; Bellot, J.; Andreu, J.M. Multi-Year Monitoring Land Surface Phenology in Relation to Climatic Variables Using MODIS-NDVI Time-Series in Mediterranean Forest, Northeast Tunisia. Acta Oecologica 2022, 114, 103804. [Google Scholar] [CrossRef]
- Liu, L.; Cao, R.; Shen, M.; Chen, J.; Wang, J.; Zhang, X. How Does Scale Effect Influence Spring Vegetation Phenology Estimated from Satellite-Derived Vegetation Indexes? Remote Sens. 2019, 11, 2137. [Google Scholar] [CrossRef] [Green Version]
- Isaacson, S.; Ephrath, J.E.; Rachmilevitch, S.; Maman, S.; Ginat, H.; Blumberg, D.G. Long and Short Term Population Dynamics of Acacia Trees via Remote Sensing and Spatial Analysis: Case Study in the Southern Negev Desert. Remote Sens. Environ. 2017, 198, 95–104. [Google Scholar] [CrossRef]
- Paz-Kagan, T.; Silver, M.; Panov, N.; Karnieli, A. Multispectral Approach for Identifying Invasive Plant Species Based on Flowering Phenology Characteristics. Remote Sens. 2019, 11, 953. [Google Scholar] [CrossRef] [Green Version]
- Liang, L.; Schwartz, M.D.; Fei, S. Validating Satellite Phenology through Intensive Ground Observation and Landscape Scaling in a Mixed Seasonal Forest. Remote Sens. Environ. 2011, 115, 143–157. [Google Scholar] [CrossRef]
- Stagakis, S.; Markos, N.; Sykioti, O.; Kyparissis, A. Monitoring Canopy Biophysical and Biochemical Parameters in Ecosystem Scale Using Satellite Hyperspectral Imagery: An Application on a Phlomis Fruticosa Mediterranean Ecosystem Using Multiangular CHRIS/PROBA Observations. Remote Sens. Environ. 2010, 114, 977–994. [Google Scholar] [CrossRef]
- Pan, Y.; Li, L.; Zhang, J.; Liang, S.; Zhu, X.; Sulla-Menashe, D. Winter Wheat Area Estimation from MODIS-EVI Time Series Data Using the Crop Proportion Phenology Index. Remote Sens. Environ. 2012, 119, 232–242. [Google Scholar] [CrossRef]
- Sjöström, M.; Ardö, J.; Eklundh, L.; El-Tahir, B.A.; El-Khidir, H.A.M.; Hellström, M.; Pilesjö, P.; Seaquist, J. Evaluation of Satellite Based Indices for Gross Primary Production Estimates in a Sparse Savanna in the Sudan. Biogeosciences 2009, 6, 129–138. [Google Scholar] [CrossRef] [Green Version]
- Stagakis, S.; Markos, N.; Sykioti, O.; Kyparissis, A. Tracking Seasonal Changes of Leaf and Canopy Light Use Efficiency in a Phlomis Fruticosa Mediterranean Ecosystem Using Field Measurements and Multi-Angular Satellite Hyperspectral Imagery. ISPRS J. Photogramm. Remote Sens. 2014, 97, 138–151. [Google Scholar] [CrossRef]
- Hinojo-Hinojo, C.; Goulden, M.L. Plant Traits Help Explain the Tight Relationship between Vegetation Indices and Gross Primary Production. Remote Sens. 2020, 12, 1405. [Google Scholar] [CrossRef]
- Restrepo-Coupe, N.; Huete, A.; Davies, K.; Cleverly, J.; Beringer, J.; Eamus, D.; van Gorsel, E.; Hutley, L.B.; Meyer, W.S. MODIS Vegetation Products as Proxies of Photosynthetic Potential along a Gradient of Meteorologically and Biologically Driven Ecosystem Productivity. Biogeosciences 2016, 13, 5587–5608. [Google Scholar] [CrossRef] [Green Version]
- Huete, A.; Didan, K.; Miura, T.; Rodriguez, E.P.; Gao, X.; Ferreira, L.G. Overview of the Radiometric and Biophysical Performance of the MODIS Vegetation Indices. Remote Sens. Environ. 2002, 83, 195–213. [Google Scholar] [CrossRef]
- Cavalaris, C.; Megoudi, S.; Maxouri, M.; Anatolitis, K.; Sifakis, M.; Levizou, E.; Kyparissis, A. Modeling of Durum Wheat Yield Based on Sentinel-2 Imagery. Agronomy 2021, 11, 1486. [Google Scholar] [CrossRef]
- Peng, D.; Wu, C.; Li, C.; Zhang, X.; Liu, Z.; Ye, H.; Luo, S.; Liu, X.; Hu, Y.; Fang, B. Spring Green-up Phenology Products Derived from MODIS NDVI and EVI: Intercomparison, Interpretation and Validation Using National Phenology Network and AmeriFlux Observations. Ecol. Indic. 2017, 77, 323–336. [Google Scholar] [CrossRef]
- Broich, M.; Huete, A.; Tulbure, M.G.; Ma, X.; Xin, Q.; Paget, M.; Restrepo-Coupe, N.; Davies, K.; Devadas, R.; Held, A. Land Surface Phenological Response to Decadal Climate Variability across Australia Using Satellite Remote Sensing. Biogeosciences 2014, 11, 5181–5198. [Google Scholar] [CrossRef] [Green Version]
- Fanelli, G.; Attorre, F.; Del Giudice, M.; Gjeta, E.; De Sanctis, M. Phlomis Fruticosa Scrublands in the Central Mediterranean Region: Syntaxonomy and Ecology. Phytocoenologia 2015, 45, 49–68. [Google Scholar] [CrossRef]
- Kyparissis, A.; Manetas, Y. Seasonal Leaf Dimorphism in a Semi-Deciduous Mediterranean Shrub: Ecophysiological Comparisons between Winter and Summer Leaves. Acta Oecol. 1993, 14, 23–32. [Google Scholar]
- Kyparissis, A.; Grammatikopoulos, G.; Manetas, Y. Leaf Demography and Photosynthesis as Affected by the Environment in the Drought Semi-Deciduous Mediterranean Shrub Phlomis fruticosa L. Acta Oecol. 1997, 18, 543–555. [Google Scholar] [CrossRef]
- Huete, A.R.; Liu, H.Q.; Batchily, K.; van Leeuwen, W. A Comparison of Vegetation Indices over a Global Set of TM Images for EOS-MODIS. Remote Sens. Environ. 1997, 59, 440–451. [Google Scholar] [CrossRef]
- Roerink, G.J.; Su, Z.; Menenti, M. S-SEBI: A Simple Remote Sensing Algorithm to Estimate the Surface Energy Balance. Phys. Chem. Earth Part B Hydrol. Oceans Atmos. 2000, 25, 147–157. [Google Scholar] [CrossRef]
- White, M.A.; Thornton, P.E.; Running, S.W. A Continental Phenology Model for Monitoring Vegetation Responses to Interannual Climatic Variability. Glob. Biogeochem. Cycles 1997, 11, 217–234. [Google Scholar] [CrossRef]
- Schwartz, M.D.; Reed, B.C.; White, M.A. Assessing Satellite-Derived Start-of-Season Measures in the Conterminous USA. Int. J. Climatol. 2002, 22, 1793–1805. [Google Scholar] [CrossRef]
- Gao, F.; Anderson, M.; Daughtry, C.; Karnieli, A.; Hively, D.; Kustas, W. A Within-Season Approach for Detecting Early Growth Stages in Corn and Soybean Using High Temporal and Spatial Resolution Imagery. Remote Sens. Environ. 2020, 242, 111752. [Google Scholar] [CrossRef]
- Le Maire, G.; Marsden, C.; Nouvellon, Y.; Stape, J.-L.; Ponzoni, F.J. Calibration of a Species-Specific Spectral Vegetation Index for Leaf Area Index (LAI) Monitoring: Example with MODIS Reflectance Time-Series on Eucalyptus Plantations. Remote Sens. 2012, 4, 3766–3780. [Google Scholar] [CrossRef] [Green Version]
- Féret, J.-B.; Corbane, C.; Alleaume, S. Detecting the Phenology and Discriminating Mediterranean Natural Habitats With Multispectral Sensors—An Analysis Based on Multiseasonal Field Spectra. IEEE J. Sel. Top. Appl. Earth Obs. Remote Sens. 2015, 8, 2294–2305. [Google Scholar] [CrossRef]
- Catorci, A.; Lulli, R.; Malatesta, L.; Tavoloni, M.; Tardella, F.M. How the Interplay between Management and Interannual Climatic Variability Influences the NDVI Variation in a Sub-Mediterranean Pastoral System: Insight into Sustainable Grassland Use under Climate Change. Agric. Ecosyst. Environ. 2021, 314, 107372. [Google Scholar] [CrossRef]
- Cabello, J.; Alcaraz-Segura, D.; Ferrero, R.; Castro, A.J.; Liras, E. The Role of Vegetation and Lithology in the Spatial and Inter-Annual Response of EVI to Climate in Drylands of Southeastern Spain. J. Arid Environ. 2012, 79, 76–83. [Google Scholar] [CrossRef]
- Stöckli, R.; Rutishauser, T.; Dragoni, D.; O’Keefe, J.; Thornton, P.E.; Jolly, M.; Lu, L.; Denning, A.S. Remote Sensing Data Assimilation for a Prognostic Phenology Model. J. Geophys. Res. Biogeosci. 2008, 113. [Google Scholar] [CrossRef]
- Piedallu, C.; Chéret, V.; Denux, J.P.; Perez, V.; Azcona, J.S.; Seynave, I.; Gégout, J.C. Soil and Climate Differently Impact NDVI Patterns According to the Season and the Stand Type. Sci. Total Environ. 2019, 651, 2874–2885. [Google Scholar] [CrossRef] [PubMed]
- Horion, S.; Cornet, Y.; Erpicum, M.; Tychon, B. Studying Interactions between Climate Variability and Vegetation Dynamic Using a Phenology Based Approach. Int. J. Appl. Earth Obs. Geoinf. 2013, 20, 20–32. [Google Scholar] [CrossRef]
- Sousa, D.; Davis, F.W. Scalable Mapping and Monitoring of Mediterranean-Climate Oak Landscapes with Temporal Mixture Models. Remote Sens. Environ. 2020, 247, 111937. [Google Scholar] [CrossRef]
- Stanimirova, R.; Cai, Z.; Melaas, E.K.; Gray, J.M.; Eklundh, L.; Jönsson, P.; Friedl, M.A. An Empirical Assessment of the MODIS Land Cover Dynamics and TIMESAT Land Surface Phenology Algorithms. Remote Sens. 2019, 11, 2201. [Google Scholar] [CrossRef] [Green Version]
- Jin, H.; Jönsson, A.M.; Olsson, C.; Lindström, J.; Jönsson, P.; Eklundh, L. New Satellite-Based Estimates Show Significant Trends in Spring Phenology and Complex Sensitivities to Temperature and Precipitation at Northern European Latitudes. Int. J. Biometeorol. 2019, 63, 763–775. [Google Scholar] [CrossRef] [Green Version]
- Workie, T.G.; Debella, H.J. Climate Change and Its Effects on Vegetation Phenology across Ecoregions of Ethiopia. Glob. Ecol. Conserv. 2018, 13, e00366. [Google Scholar] [CrossRef]
- Liu, Y.; Li, Y.; Li, S.; Motesharrei, S. Spatial and Temporal Patterns of Global NDVI Trends: Correlations with Climate and Human Factors. Remote Sens. 2015, 7, 13233–13250. [Google Scholar] [CrossRef] [Green Version]
- Vicente-Serrano, S.M.; Gouveia, C.; Camarero, J.J.; Beguería, S.; Trigo, R.; López-Moreno, J.I.; Azorín-Molina, C.; Pasho, E.; Lorenzo-Lacruz, J.; Revuelto, J.; et al. Response of Vegetation to Drought Time-Scales across Global Land Biomes. Proc. Natl. Acad. Sci. USA 2013, 110, 52–57. [Google Scholar] [CrossRef] [Green Version]


| Phenological event | Abbreviation | Characteristics | |
|---|---|---|---|
| Spring drop | onset | SDO | Day of Year |
| end | SDE | Day of Year | |
| duration | SDD | Number of days. SDD = SDE – SDO | |
| Autumn revival | onset | ARO | Day of Year |
| end | ARE | Day of Year | |
| duration | ARD | Number of days. ARD = ARE – ARO | |
| Dry period | onset | DPO | Day of Year |
| end | DPE | Day of Year | |
| duration | DPD | Number of days. DPD = DPE – DPO | |
| Annual maximum EVI | Max EVI | ||
| Date of Max EVI | Day of Year | ||
| Annual minimum EVI | Min EVI | ||
| Date of Min EVI | Day of Year |
| Phenological Event | Araxos | Louros | Difference | P | |
|---|---|---|---|---|---|
| Spring Drop | Onset (DOY) | 95 ± 14 | 110 ± 11 | −15 | <0.001 |
| End (DOY) | 212 ± 33 | 239 ± 17 | −27 | 0.004 | |
| Duration (ND) | 117 ± 38 | 129 ± 23 | −11 | 0.242 | |
| Dry Period | Onset (DOY) | 131 ± 8 | 171 ± 19 | −40 | <0.001 |
| End (DOY) | 304 ± 33 | 292 ± 37 | 11 | 0.033 | |
| Duration (ND) | 172 ± 34 | 121 ± 47 | 51 | <0.001 | |
| Autumn Revival | Onset (DOY) | 268 ± 23 | 255 ± 22 | 13 | 0.007 |
| End (DOY) | 345 ± 40 | 340 ± 42 | 5 | 0.486 | |
| Duration (ND) | 77 ± 33 | 85 ± 32 | −8 | 0.238 | |
| Max EVI | 0.439 ± 0.026 | 0.473 ± 0.028 | −0.034 | <0.001 | |
| Date of Max EVI | (DOY) | 81 ± 17 | 103 ± 10 | −22 | <0.001 |
| Min EVI | 0.179 ± 0.011 | 0.226 ± 0.021 | −0.048 | <0.001 | |
| Date of Min EVI | (DOY) | 253 ± 23 | 245 ± 20 | 8 | 0.171 |
Publisher’s Note: MDPI stays neutral with regard to jurisdictional claims in published maps and institutional affiliations. |
© 2022 by the authors. Licensee MDPI, Basel, Switzerland. This article is an open access article distributed under the terms and conditions of the Creative Commons Attribution (CC BY) license (https://creativecommons.org/licenses/by/4.0/).
Share and Cite
Kyparissis, A.; Levizou, E. Climatic Drivers of the Complex Phenology of the Mediterranean Semi-Deciduous Shrub Phlomis fruticosa Based on Satellite-Derived EVI. Plants 2022, 11, 584. https://doi.org/10.3390/plants11050584
Kyparissis A, Levizou E. Climatic Drivers of the Complex Phenology of the Mediterranean Semi-Deciduous Shrub Phlomis fruticosa Based on Satellite-Derived EVI. Plants. 2022; 11(5):584. https://doi.org/10.3390/plants11050584
Chicago/Turabian StyleKyparissis, Aris, and Efi Levizou. 2022. "Climatic Drivers of the Complex Phenology of the Mediterranean Semi-Deciduous Shrub Phlomis fruticosa Based on Satellite-Derived EVI" Plants 11, no. 5: 584. https://doi.org/10.3390/plants11050584
APA StyleKyparissis, A., & Levizou, E. (2022). Climatic Drivers of the Complex Phenology of the Mediterranean Semi-Deciduous Shrub Phlomis fruticosa Based on Satellite-Derived EVI. Plants, 11(5), 584. https://doi.org/10.3390/plants11050584