Abstract
Mangrove ecosystems are valuable, yet vulnerable, and therefore they have been an important subject of protection and restoration in China. Reliable information on long-term China mangrove dynamics is lacking but vital to analyze the driving forces and evaluate the efforts of mangrove conversation. This study aims to quantify the conversions among mangroves and other land covers with high accuracy. The updated mangrove base map for 2018 was produced by integrating Advanced Land Observing Satellite (ALOS) Phased Array type L-band Synthetic Aperture Radar 2 (PALSAR-2) yearly mosaics and Landsat imagery with an overall accuracy of 95.23 ± 6.02%. Then, a novel approach combining map-to-image and image-to-image methods was proposed to detect the changed pixels in mangrove forests from 1985 to 2018. The mangrove base map was adopted to mask the images from other years. To determine the changed pixels, the differencing values in the masked area between two images were calculated and compared with the corresponding thresholds. Based on the changed pixels, the possible driving forces were analyzed and associated with socioeconomic development. The resultant mangrove dynamics demonstrated that mangrove forests in China experienced a tendency of loss first and recovery later during the past 30 years. Most mangrove gains came from aquaculture and mudflat, whilst losses were due to the built-up construction and aquaculture reclamation. These conversions indicated that mangrove deforestations were mainly due to human-induced destruction, while the recoveries were strongly associated with conservation and restoration actions.
1. Introduction
Mangrove ecosystems are amongst the most productive ecosystems on the earth and provide a wide range of essential ecosystem services [,], such as coastal protection and nurseries for juvenile coral reef fishes. Nowadays, mangrove forest has been recognized as an important sink for carbon [], whose carbon sequestration and storage capacity are 3–4 times higher than the terrestrial forests. Murray et al. [] estimated that mangroves sequester 34.5–38.2 billion tonnes of CO2 with an average carbon fixation rate of 5.98 tonnes CO2/ha/yr, which could contribute to mitigating climate change and achieving sustainable development goals []. However, the mangrove ecosystem is one of the most vulnerable and threatened ecosystems in the world and has experienced a dramatic loss due to human activities like urban development, reclamation for aquaculture, and coastal landfill. It has been reported that more than 50% of mangrove forests were lost globally since the 1980s [,]. To prevent the further loss of mangroves, many international programs, such as Reduce Emission from Deforestation and Degradation (REDD+) and the Kyoto Protocol, have highlighted the significance of immediate protection and conservation of mangrove ecosystems. China only makes up about 0.14% of the world’s mangrove area, but it holds one-third of the world’s mangrove species, with considerable ecological and socioeconomic value [,]. Mangroves in China experienced a 50% loss from 40,000 ha in 1957 down to 18,800 ha in the mid-1980s []. Meanwhile, mangrove conservation and restoration started from the early 1980s and were widely conducted after 1995 with the announcement of China’s Biodiversity Conservation Action Plan. Therefore, it is important to understand long-term China’s mangrove dynamics and evaluate the achievements of conservation efforts between the 1980s and the 2010s.
Remote sensing (RS) provides a way to monitor the spatiotemporal distribution and health status of mangrove ecosystems. To date, several global mangrove forest maps have been produced, such as the World Atlas of Mangrove [], Mangrove Forests of the World [], and Global Database of Continuous Mangrove Forest Cover for the 21st Century []. However, these maps are incomplete or outdated, which may not reflect the latest spatial distribution of mangrove forests in China. Besides, China’s mangroves are in relatively small areas and sparsely distributed compared with those in other countries. Consequently, they are challenging to distinguish by the same classification methods or training samples as are used in other regions. Thus, in recent years, many researchers in China attempted to map the mangrove forests on a national scale. Wu et al. [] mapped the mangrove forest ecosystems in China for the 1990s, 2000s, and 2010s by visual interpretation of Landsat imagery. Jia et al. [] applied the object-based method to generate the mangrove forest maps and evaluated the effectiveness of conservation on mangroves in China. Chen et al. [] created a mangrove forest map of China in 2015 with high accuracy by combining the Landsat 7/8 and Sentinel 1A images. Hu et al. [] monitored the mangrove forest changes in China between 1990 and 2015 through Landsat-derived spectral-temporal variability metrics. Jia et al. [] mapped the mangrove forest dynamics from 1973 to 2015 based on Landsat imagery, which provided the first dataset of China’s long-term mangrove distribution. Although these studies gave an overview of the mangrove forests in China, limitations remain. Firstly, most studies only adopted the optical images for long-term monitoring, resulting in the omission of some mangrove areas either entirely or partially due to a lack of available images from cloud contamination. Moreover, to our knowledge, no study has quantified the changes among mangroves and other land covers despite their importance in identifying the driving forces of the changes. Quantitative analysis of mangrove changes could enhance the effectiveness of mangrove conservation and management.
Therefore, the main objectives of this study are (1) to monitor the long-term mangrove dynamics at the provincial level with high accuracy by combining optical and Synthetic Aperture Radar (SAR) images; (2) to quantify the changes among mangroves and other land covers and analyze the possible driving forces of mangrove dynamics in China.
2. Materials and Methods
2.1. Study Area
Natural mangroves in China are distributed from Yulin Port, Hainan province (18°9′ N) to Fuding, Fujian province (27°20′ N), while artificially planted mangroves have extended to Yueqing Bay in Zhejiang province (28°25′ N) []. The study area (Figure 1) covers all potential areas where mangroves are likely to occur in China, encompassing five coastal provinces (Hainan, Guangxi, Guangdong, Fujian, and Zhejiang), Hong Kong Special Administrative Region, Macao Special Administrative Region, and Taiwan.
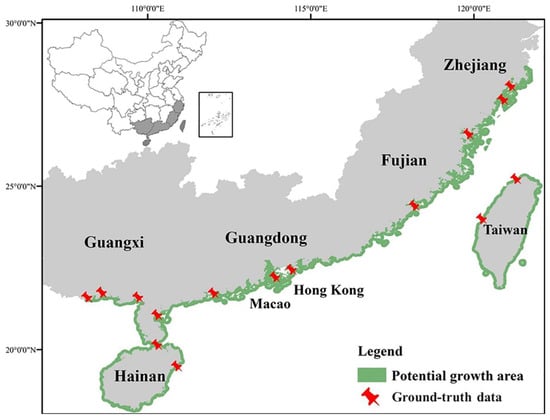
Figure 1.
Location of study area and potential mangrove growth area in China.
2.2. Data
2.2.1. Synthetic Aperture Radar (SAR) Imagery
Japan Aerospace Exploration Agency (JAXA) L-band SAR mosaic from Japanese Earth Resources Satellite 1 (JERS-1) for 1996 was downloaded from JAXA (JAXA EORC mosaic: http://www.eorc.jaxa.jp/ALOS/en/palsar_fnf/fnf_index.htm) and ALOS PALSAR/PALSAR-2 yearly mosaics for 2007, 2010 and 2018 were obtained from Google Earth Engine (GEE) with 25 m spatial resolution. A Lee filter was adopted to filter the bands from SAR imagery to reduce the speckle effects []. The data was in digital number and converted to sigma naught backscattering coefficient using Equation (1), with a calibration factor (CF) of −83 for ALOS PALSAR/PALSAR-2 and −84.66 for JERS-1. To allow fusion with the Landsat data and digital elevation model (DEM) data, the resulting ALOS PALSAR/PALSAR-2 and JERS-1 data were resampled to 30 m pixel resolution, using nearest neighbor interpolation in GEE.
σo = 10 × log10(DN2) − CF,
2.2.2. Landsat Imagery
Landsat 5 Thematic Mapper (TM) and Landsat 8 Operational Land Imager (OLI) Surface Reflectance (SR) images between 1985 and 2018 were acquired in GEE. Based on the cfmask band, clouds and shadows in images were identified and only the images with clouds less than 10% were selected to conduct classification. Besides, to reduce the influence of tidal inundation, the Normalized Difference Vegetation Index (NDVI) [] and Land Surface Water Index (LSWI) [] were calculated for the selected mangrove samples. We assumed that the mean NDVI values of the mangrove samples should be larger than the mean LSWI values in the low tide period [,]. Thus, Landsat images with mean NDVI values larger than mean LSWI values for mangrove samples were selected in this study. Finally, the median of image collection for each year was calculated for mangrove classification.
2.2.3. Ground-Truth Data
Field surveys were carried out in Zhejiang and Fujian from 2017 to 2018. Images around mangrove forests were taken by the unmanned aerial vehicle (UAV) and digital camera (Supplementary Figure S1). Besides, mangrove locations were also collected by literature review (Supplementary Table S1) and visual inspection of very high spatial resolution Google Earth images. Finally, around 1236 ha mangroves were selected as ground-truth samples (5% of the total mangrove forests). All these ground-truth data were used for selecting the training (70%) and validation (30%) samples.
2.2.4. Other Data
Data from OpenStreetMap and an administrative map of China were adopted to delineate the coastline. Then, a 10-km coastline buffer zone for both inland and seaside was created to narrow the study area. As most mangroves are distributed in areas with an elevation between -5 m and 10 m above the mean sea level and a slope of less than 10° [], 30-m Shuttle Radar Topography Mission (SRTM) DEM data were adopted to mask out the regions with the high elevation and steep slope. Finally, the potential mangrove growth area is displayed in Figure 1. The datasets used in this study are summarized in Table 1.

Table 1.
Details of the datasets and sources used in this study.
2.3. Methodology
The overview of the methodology is shown in Figure 2. Firstly, the mangrove base map of China was created for 2018. Then the long-term mangrove dynamics were determined by detecting the changes in mangrove forests during the periods 1985–2018, 1996–2018, 2007–2018, and 2010–2018. Lastly, the conversions among mangroves and other land covers were quantified for each period. The details are shown in the following sections:
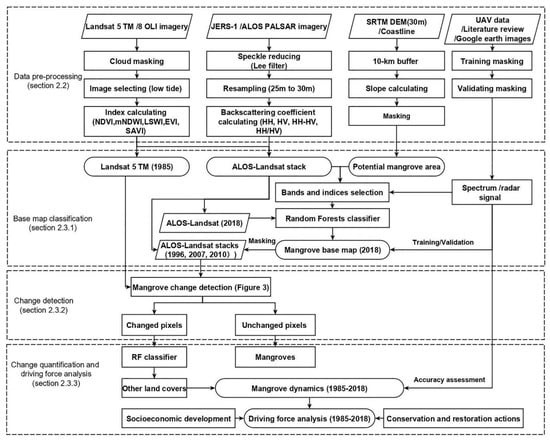
Figure 2.
Flowchart of mangrove mapping and change detecting.
2.3.1. Mangrove Baseline Classification
The separability of different bands was evaluated based on the average differences among mangroves and other land covers (salt marsh, seawater, aquaculture, agriculture, built up, and mudflat). The bands with relatively high separability were selected as classification features. Besides, a measure of variable importance within the Random Forest (RF) classifier revealed that NDVI, modified Normalized Difference Water Index (mNDWI) [], LSWI, and Soil-adjusted Vegetation Index (SAVI) [], performed well in distinguishing mangroves. So, these indices were also adopted as classification features to help classify the mangroves within the RF classifier. Overall, 70% of the samples were randomly selected for training, and the remainder were used for validation. The classification procedure was completed in the GEE platform.
2.3.2. Mangrove Change Detection from 1985 to 2018
Change detection in RS is usually achieved by image-to-image [] or map-to-map [] approaches. The image-to-image method relies on identifying the objects by image enhancement, which would be influenced by the differences in image calibration. The map-to-map method is based on the classification results from multi-date images, so it may suffer from classification error propagation. To overcome these limitations, Thomas et al. [] proposed a new map-to-image method to detect changes in mangrove forests globally. This method assumed that the distribution of values extracted for a land cover class is normal with deviations away from this identified as change features. It used the base map of objects (mangrove forests) derived from classification to mask an independent image and then removed the pixels to ultimately achieve the normal distribution in the masked area. The removed pixels were defined as changed pixels, namely the changes in mangrove forests. The map-to-image method has proved to be effective in detecting the changes in large continuous mangrove forests. However, it doesn’t work efficiently when the mangrove areas are small, or the changes are unapparent. The mangrove distributions in China are relatively sparse, and do not satisfy the assumption of the normal distribution as shown in Supplementary Figure S2; thus, the map-to-image method can’t be applied in detecting the mangrove dynamics in China directly. In this study, an improved change detection method was proposed by combining the map-to-image method with the image-to-image method to identify the mangrove changes in China. The schematic diagram is displayed in Figure 3. Firstly, the mangrove map in 2018 generated in Section 2.3.1 was employed to mask the ALOS-Landsat stacks for the years 1996, 2007, and 2010 and the Landsat 5 TM images for 1985. Then, the masked images were subtracted by the image in 2018 to produce the differencing image, which represents the change of digital values for each pixel between these two years. Four classification features were adopted here to detect the change between the two images, namely NDVI, LSWI, and Horizontal transmit and Vertical receive (HV) backscattering for ALOS-Landsat stacks and NDVI, LSWI, and NIR for Landsat 5 TM images. We assumed that if the differencing value of one pixel between two images is larger than the threshold, then this pixel has changed over time []. A series of possible thresholds for each feature was tested, and the change detection accuracies were assessed based on the validation samples. The threshold with the highest accuracy was finally employed. If the differencing values of all features (NDVI, LSWI, and HV) for one pixel exceeded their thresholds, this pixel would be classified as the changed pixel. The changed pixels were defined as mangrove loss while the unchanged pixels represented the remaining mangroves.
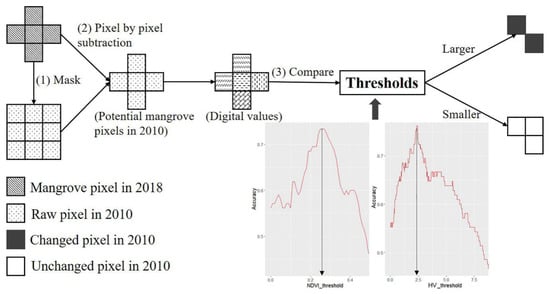
Figure 3.
The schematic diagram of mangrove change detection (2010–2018).
In terms of mangrove gain, a 1000-m buffer based on the mangrove map in 2018 was created to represent the potential area where mangrove gain may occur []. Similarly, this potential area was used to mask the images from different years, and the changed/unchanged pixels in the masked area were detected by the same method. After that, the changed pixels were reclassified into mangroves and other land covers based on the training samples. The new mangrove pixels were regarded as mangrove gains. The whole procedure was conducted in R Studio [].
2.3.3. Quantitative Assessment of Mangrove Dynamics
The changed pixels (mangrove gain and loss) indicated the conversions among mangroves and other different land covers. The land covers around coastal mangrove forests are seawater, aquaculture, agriculture, mudflat, built up, and salt marsh. Thus, the changed pixels were reclassified into these six different classes to quantify the mangrove dynamics. Different regions have various environmental and geomorphic conditions. For example, salt marshes are distributed near mangrove forests in Zhejiang and Fujian, while they rarely occur in Hainan and Guangdong. Hence, the reclassification was conducted at the provincial level, and the quantitative results were summarized for each province, respectively. The reclassification accuracies were assessed for each province. Finally, referring to the conversions among mangroves and other land covers, the driving forces of long-term mangrove dynamics were analyzed related to the socio-economic development and national conservation programs.
3. Results
3.1. Mangrove Base Map
The separability of different bands among mangroves and other land covers is shown in Figure 4. It indicated that the Near Infrared Red (NIR) band from Landsat SR images and HV backscattering from the PALSAR-2 mosaic were relatively important to identify mangroves. Therefore, NIR, HV, NDVI, mNDWI, LSWI, and SAVI were employed in this study to map the mangrove distributions in 2018. The confusion matrix among different land covers generated from the classification result is displayed in Table A1. It proved that the selected features performed well in discriminating different land covers.
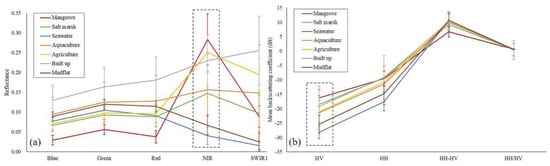
Figure 4.
Separability of different land covers in terms of: (a) Spectral reflectance from Landsat 8 Surface Reflectance (SR); (b) Backscattering coefficient from PALSAR-2.
The mangrove distribution map over China in 2018 is displayed in Figure 5 and the classification accuracy for each province is listed in Table 2. The classification accuracies for most areas are over 90%, between 85.19 ± 12.21% (Zhejiang) and 99.02 ± 2.14% (Hong Kong). The overall accuracy for the whole coastal zone is 95.23 ± 6.02%, with a kappa coefficient of 0.9243. A total of 24,602 ha mangroves was identified across the whole coastal zone, ranging from 10.62 ha in Macao to 9217.63 ha in Guangdong (Table 2). More than 90% of the mangrove forests in China were distributed in the southern regions. Guangdong occupied the largest area of mangrove forest, which was around 37.5% of the total mangrove area, followed by Guangxi (36.9%) and Hainan (17.4%).
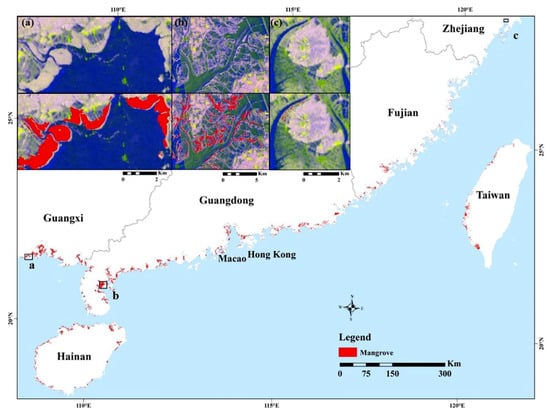
Figure 5.
Spatial distribution of China’s mangroves in 2018 and zoom views of three natural mangrove reserves: (a) Guangxi Beilun Estuary National Nature Reserve; (b) Zhanjiang Mangrove National Nature Reserve; and (c) Zhejiang Ximen Island Marine Special Reserve. The background of (a–c) is PALSAR-2 mosaic in 2018 shown in R: G: B = HH: HV: HH-HV composite (Note: HH = Horizontal transmit and Horizontal receive).
Table 2.
Classification result and accuracy assessment for each province (district).
3.2. Mangrove Area Changes from 1985 to 2018
The mangrove area changes for each province (district) over the period 1985–2018, 1996–2018, 2007–2018, and 2010–2018 are presented in Figure 6 and Figure 7. The classification accuracies for all provinces are above 80%. The results demonstrated that the total areas of China’s mangrove in 1985, 1996, 2007, 2010, and 2018 were 20,086 ha, 18,033 ha, 22,428 ha, 23,639 ha, and 24,602 ha, respectively. Over the period 1985–1996, mangroves in China experienced a net loss of 2053 ha, however, after that, the mangrove area increased by nearly 36% from 18,033 ha in 1996 to 24,602 ha in 2018. Especially during 1996–2010, the mangrove area experienced a net gain of 7133 ha. Since 2010, the total mangrove area has been relatively stable compared with before.
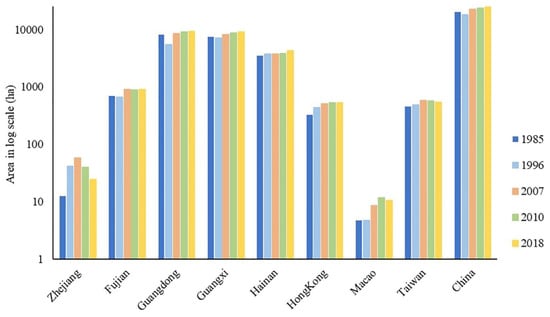
Figure 6.
Mangrove areas for each province (district) and the whole coastal zone from 1985 to 2018.
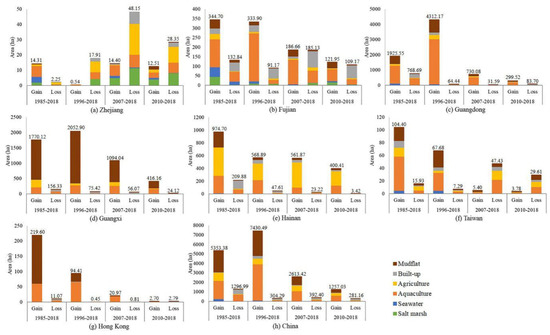
Figure 7.
Conversions among mangroves and other land covers for each province (district).
From 1985 to 1996, the mangrove areas in Zhejiang, Hainan, Hong Kong, Macao, and Taiwan increased, while in the other three provinces, the mangrove areas decreased. After 1996, the mangrove areas in Guangdong, Guangxi, and Hong Kong kept increasing; however, mangroves in Zhejiang decreased after 2007. Mangrove forests in Fujian, Macao, and Taiwan have experienced a net gain firstly and then a net loss after 1996. Conversely, the area increased again after a slight decrease from 1996 to 2007 in Hainan. The biggest area change was observed in Guangdong, where 46% (4249 ha) of the mangrove recovered between 1996 and 2018. The spatial distributions of mangrove gain and loss in the southern part of Guangdong, where most mangrove changes occurred, are displayed in Figure 8. Most changes occurred between 1996 and 2007 near two national nature reserves, while sporadic increases appeared after 2010.
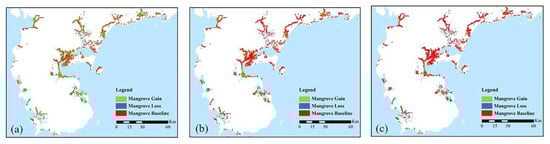
Figure 8.
Mangrove distribution changes in the southern part of Guangdong province after the 1990s: (a) 1996–2018; (b) 2007–2018; (c) 2010–2018.
3.3. Quantitative Results of Mangrove Dynamics
Table 3 shows the conversions among mangroves and other land covers in China over the period 1985–2018, 1996–2018, 2007–2018, and 2010–2018. For each province and time, the details of changes among mangroves and different land covers can be observed in Figure 7. The reclassification accuracies for all provinces and years are higher than 90%, which are summarized in Table A2. In general, between 1985 and 2018, 1934 ha mangrove gain came from aquaculture and 2263 ha from mudflat, while 493 ha mangrove loss was converted to built up and 692 ha to aquaculture. Referring to the result for each region, the changes in different provinces and time periods were different. For Zhejiang, Fujian, Guangdong, and Taiwan, mangrove gain was mainly from aquaculture, while for Guangxi and Hong Kong, the gain came from mudflat. Besides, mangroves in Hainan gained from aquaculture and agriculture. In terms of mangrove loss, for Fujian, Guangxi, and Hong Kong, mangrove loss was mainly due to the built-up construction and aquaculture reclamation. Additionally, more than 50% of mangroves have been lost to built-up construction in Hainan, while most mangroves were converted to aquaculture in Guangdong.
Table 3.
Conversions among mangroves and other land covers in the whole coastal zone of China.
4. Discussion
4.1. The Advantages in the Resultant Mangrove Dynamics
In this study, the overall accuracies for the base map and mangrove dynamics are 95.23 ± 6.02% and 80 ± 4.98%, respectively, which represent the maps of sufficient quality for use within the research community and policymaking. Comparing with the existing national mangrove maps [,,], the resultant mangrove areas in this study are closer to the statistical data from the China Forestry Report [], as shown in Figure A1, especially for Guangdong, Guangxi, and Hainan. Three advantages in this study may contribute to the higher accuracy.
Firstly, the tidal inundation was properly considered in this study as mentioned in Section 2.2.2. Most previous studies selected the images with low tide based on the water level in tidal level stations [,]. However, there are usually only 3-4 tidal level stations in each province and some of them are far from the mangrove forests. Thus, the water level may not reflect the actual tidal inundation in mangrove forests. In this study, we assumed that if the mangrove is above the water surface, the vegetation index (NDVI) should be larger than the water index (LSWI). A similar method has been widely used for rice paddy and reed wetland mapping [,]. In this way, the images were selected based on the mangrove samples, which could represent more reliable tidal information in mangrove forests. Besides, instead of using the image of single data, we adopted the multi-data mosaics for each year, which could also reduce the misclassification caused by tidal inundation.
Secondly, the mangrove classification is usually influenced by the presence of clouds in tropics and subtropics. Although most studies adopted the images with less cloud, the cloud contamination still can not be solved thoroughly. In this research, SAR images, which are not influenced by weather conditions [], were employed to improve the classification accuracy. Previous studies have revealed that there was a 20% increase in accuracy by combining optical and radar datasets compared to employing them independently [,]. Besides, SAR data can reflect the structure information of mangroves, which could help distinguish them from other vegetation []. The mangrove areas we got are slightly larger than those in prior studies [,,,], which indicates that more mangroves were identified in this study. Two southernmost regions (Guangxi and Hainan) are most likely to be influenced by cloud. Our results showed that there were 8715 ha mangroves in Guangxi and 3861 ha in Hainan, which are similar to the statistical data from the China Forestry Report (8375 ha in Guangxi, and 3930 ha in Hainan). However, the results derived from only Landsat imagery demonstrated that the mangrove areas are 5813 ha and 5978 ha in Guangxi, and 3576 ha and 3623 ha in Hainan [,] which are much lower than the statistical data. Thus, the combination of optical and radar images provided more comprehensive and accurate results by reducing the influence of clouds, which improved the reliability of mangrove dynamics.
Lastly, the change detection method proposed in this study is more robust and accurate in identifying China’s mangrove dynamics. The combination of map-to-image method and image-to-image method enhanced the detection of changed pixels between independent images and reduced the error propagation caused by different classification accuracies. Furthermore, instead of analyzing the spectral characteristics in the whole mangrove forest [], we focused on the image differencing at the pixel level, which could detect the changes in detail. The successful assessment of mangrove dynamics in Zhejiang proved that this method is not limited to the mangrove area and distribution. The novel approach represents an essential step towards mapping mangrove dynamics in China with limited area and sparse distribution.
4.2. The Potential Sources of Uncertainties in the Resultant Mangrove Dynamics
Although the resultant mangrove maps in our study improved the accuracy of the mangrove database in China, limitations remain in the application of RS data. Firstly, we noticed that the classification accuracy of the mangroves in Zhejiang was the lowest (85.19 ± 12.21%) among all regions. The causes of the misclassifications may be due to the tidal effects and spectral similarity among vegetation. Zhejiang is the northernmost boundary of mangroves in China, with only one mangrove species—Kandelia candel []. The artificially planted mangroves were much shorter than the natural ones, and the spatial distribution was relatively scattered. These characteristics make them more susceptible to tidal inundation. Although we selected the Landsat imagery in the low tide period by mangrove samples, the samples were randomly selected and could not represent all mangroves in that region. It is possible that some mangroves were under the water surface and couldn’t be identified. Besides, Zhejiang has a large area of salt marshes, such as about 2432 ha of Spartina alterniflora []. Salt marshes are usually distributed in the adjacent areas of mangroves, which have similar spectral information with mangroves especially under the influence of the tide. So, it is difficult to distinguish them without enough ground-truth data or very high-resolution images.
Furthermore, the determination of different thresholds for detecting changed pixels remains somewhat uncertain. In this study, we set a group of thresholds for each variable and selected the one with the highest accuracy based on the ground-truth samples. The accuracies for all thresholds were above 80%, however, they varied in different regions and periods. The spectral similarity among mangroves, salt marshes, and agricultural land made it difficult to determine the thresholds and detect the conversions among them. So, the uncertainty of thresholds could cause misclassification among some land covers. In addition, the mangrove ages and species may also influence the detection of mangrove changes. For example, if the mangroves in one pixel grew up or were converted into other species over time, the spectral information for that pixel in two images could be varied. In this case, the unchanged mangrove pixels with different ages or species would be misclassified into changed pixels. This misclassification could occur when we detected the changes over a long period. Thus, it’s suggested to properly apply this change detection method during a certain period or validate it with more ground-truth data.
Additional uncertainties could come from the spatial resolution of the images. The images we employed in this study have a spatial resolution of 30 m. However, in some regions, the mangroves were distributed sparsely with relatively small areas. This could cause the mixed pixels and influence the classification accuracy. It is difficult to improve the results before the 2000s due to the limited RS imagery resources. However, as the development of mangrove mapping is driven by sensor progress [], with the availability of more high-resolution imagery (like QuickBird, Worldview, and GaoFen-2), the identification of mangrove distributions and changes can be further improved.
4.3. The Possible Driving Forces of Mangrove Dynamics
This is the first study to quantify the mangrove changes in China. The results indicated the possible driving forces of mangrove dynamics in the past 30 years. Generally, the mangrove changes were various in different regions and time periods due to the diverse meteorological conditions and policy actions. However, most mangrove gains were transformed from aquaculture and mudflat, and losses were due to built-up construction and aquaculture reclamation. The mangrove loss in China typically occurred from 1985 to 1996, while after 1996 the mangrove areas increased steadily. The principal reasons for these changes are human activities including destruction and protection. Before the 1990s, mangrove loss was mainly due to the pressure from population explosion and urbanization [], especially in the coastal areas where several big cities like Shenzhen and Xiamen are located. The rapid development in the coastal zone required more constructed land for human activities, and that is why mangrove forests in some regions have been destroyed and converted into built-up construction. Besides, a lack of financial and human resources at that time resulted in a large area of mangroves being converted to aquaculture for direct economic benefits.
However, since the early 1990s, the importance and vulnerability of mangrove ecosystems led to the awareness of the Chinese government and the public. Therefore, a number of laws and regulations to protect mangrove ecosystems were published, including the Action Plan for China Biodiversity Protection (State Environmental Protection Agency, 1994), the Forestry Action Plan for China’s Agenda of the 21st Century (State Forestry Administration, 1995; 1996), the Plan for China Ecological Environment Conservation (The State Council, 1998), and the Action Plan for China Wetland Protection (State Forestry Administration, 2000). Under these laws and regulations, billions of dollars were invested to restore and protect mangrove ecosystems []. According to our results, mangrove gain was chiefly from aquaculture and mudflat, which reflected the achievements of remediation of illegal fisheries and a large area of restoration.
Meanwhile, many mangrove reserves have been established since the 1980s, which was strongly associated with the mangrove area’s increase. The first provincial mangrove nature reserve was established in 1980 in Hainan. After that, 26 mangrove reserves have been established, as shown in Supplementary Figure S3, which protected around 20,000 ha mangroves. The mangrove gain followed the establishment of mangrove reserves yet with varying time lags. This can be attributed to the different survival rates of newly planted mangroves in different regions. In the beginning, the survival rates in most provinces were low, with only 20% to 30% []. However, the successful replantation project started in the early 1990s in Guangxi. As reported, around 71% of the artificially planted mangroves there survived [], which accounts for the rapid increase in mangrove area in Guangxi. Recently, more mangrove restoration projects have been conducted in Zhejiang to enlarge the mangrove forest in the middle part of China. However, the extreme cold weather in the winter of 2015 caused the death of mangroves, which contributed to the mangrove loss in Zhejiang. Besides, the invasion of Spartina alterniflora also threatened the health of mangrove ecosystems. As shown in Figure 7, some mangrove areas have been converted to salt marshes in Zhejiang and Fujian. Thus, the protection, introduction, and development of mangrove ecosystems still need more scientific knowledge and practice.
In this study, we primarily focused on the anthropogenic factors that affected mangrove loss and gain. However, environmental factors could also contribute to the changes in mangrove forests. Studies have shown that air temperature, rainfall, and salinity have a significant influence on mangrove phenology [], which could affect the replantation. Besides, the urbanization process generated sediments that were flushed into the river and formed a new mudflat []. This expanding mudflat provided more habitats for the seedlings and replantation of mangroves, which is beneficial to the mangrove area’s increase. Thus, it requires more field investigation and RS observations to figure out the comprehensive driving forces for mangrove dynamics in further study.
5. Conclusions
This study provides the first quantitative assessment of mangrove dynamics in China for the past 30 years by integrating ALOS PALSAR/PALSAR-2 and Landsat imagery. The updated mangrove base map, with an overall accuracy of 95.23 ± 6.02%, shows that there were 24,602 ha of mangrove forests in 2018 and more than 90% of mangroves were distributed along the southern coastline. An alternative approach combining the map-to-image method and image-to-image method was proposed to improve the mangrove change detection. Pixel-based analysis and different thresholds for each index can identify the changes among mangroves and other land covers in detail. The resultant mangrove long-term dynamics demonstrated that mangroves in most areas have a tendency of loss first and recovery later. Although they undergo spatial variations, most mangrove gains came from aquaculture and mudflat, while their losses were converted to built-up and aquaculture. In addition, the quantitative results of mangrove changes enable us to analyze the potential driving forces. The mangrove losses were typically due to human-made destruction, while the recoveries were attributed to conservation actions. Although there are limitations, the results nonetheless provide sound assessments of mangrove changes, which have potential importance to the mangrove protection and restoration programs, along with applicability to the research community and policymaking.
Supplementary Materials
The following are available online at https://www.mdpi.com/2220-9964/9/9/513/s1, Figure S1: Mangrove field work: (a) Ximendao, Zhejiang (16 July 2017); (b) Haishanxiang, Zhejiang (26 November 2017); (c) Niyudao, Zhejiang (12 December 2018); (d) Xiamen, Fujian (5 November 2017), Figure S2: The distributions of HV, LSWI and NDVI values extracted for mangrove forests in Zhejiang province, Figure S3: Mangrove nature reserves in China during 1980–2020: (a) Cumulative number; (b) Protected area, Table S1: The ground-truth data in this study.
Author Contributions
Conceptualization, Yuhan Zheng and Wataru Takeuchi; Methodology, Yuhan Zheng; Software, Yuhan Zheng; Validation, Yuhan Zheng; Formal Analysis, Yuhan Zheng; Resources, Wataru Takeuchi; Data Curation, Yuhan Zheng; Writing—Original Draft Preparation, Yuhan Zheng; Writing—Review and Editing, Wataru Takeuchi; Visualization, Yuhan Zheng; Supervision, Wataru Takeuchi; Project Administration, Wataru Takeuchi; Funding Acquisition, Wataru Takeuchi. All authors have read and agreed to the published version of the manuscript.
Funding
This research received no external funding.
Acknowledgments
The authors would like to thank Wu Jiaping from the Ocean College in Zhejiang University, China for sharing the ground-truth data in Zhejiang province. We also thank reviewers and editors whose comments helped improve and clarify this manuscript. This study was in part supported by the China Scholarship Council.
Conflicts of Interest
The authors declare no conflict of interest.
Appendix A. Evaluation Accuracy after Classification
Table A1.
Confusion matrix for mapping mangrove distributions in each province (district).
Table A1.
Confusion matrix for mapping mangrove distributions in each province (district).
| MG | SW | AG | AQ | BU | MF | SM | ||
|---|---|---|---|---|---|---|---|---|
| MG | 44 | 14 | 0 | 2 | 0 | 0 | 4 | |
| SW | 6 | 56 | 0 | 0 | 0 | 0 | 0 | |
| AG | 0 | 4 | 36 | 0 | 0 | 0 | 4 | |
| Zhejiang | AQ | 6 | 2 | 0 | 34 | 0 | 0 | 0 |
| BU | 0 | 0 | 0 | 0 | 40 | 0 | 0 | |
| MF | 0 | 0 | 0 | 0 | 0 | 32 | 0 | |
| SM | 0 | 6 | 0 | 0 | 0 | 0 | 34 | |
| MG | 451 | 6 | 0 | 1 | 4 | 0 | 0 | |
| SW | 0 | 470 | 2 | 0 | 2 | 1 | 0 | |
| AG | 0 | 0 | 547 | 0 | 0 | 0 | 0 | |
| Fujian | AQ | 3 | 5 | 0 | 314 | 9 | 0 | 0 |
| BU | 5 | 8 | 0 | 1 | 343 | 2 | 0 | |
| MF | 1 | 0 | 0 | 0 | 4 | 586 | 0 | |
| SM | 0 | 8 | 5 | 0 | 0 | 0 | 274 | |
| MG | 1203 | 0 | 0 | 29 | 8 | 1 | 0 | |
| SW | 0 | 480 | 4 | 0 | 3 | 0 | 0 | |
| AG | 0 | 0 | 461 | 3 | 0 | 0 | 0 | |
| Guangdong | AQ | 22 | 0 | 3 | 719 | 5 | 29 | 2 |
| BU | 5 | 0 | 0 | 8 | 428 | 14 | 0 | |
| MF | 0 | 0 | 0 | 4 | 6 | 729 | 1 | |
| SM | 1 | 0 | 0 | 7 | 0 | 0 | 314 | |
| MG | 1666 | 0 | 2 | 1 | 1 | 0 | 0 | |
| SW | 0 | 376 | 3 | 4 | 0 | 0 | 0 | |
| AG | 1 | 0 | 616 | 3 | 0 | 0 | 0 | |
| Guangxi | AQ | 9 | 0 | 2 | 338 | 0 | 0 | 0 |
| BU | 1 | 0 | 0 | 0 | 231 | 0 | 0 | |
| MF | 0 | 0 | 0 | 0 | 0 | 379 | 0 | |
| SM | 0 | 0 | 0 | 0 | 0 | 0 | 0 | |
| MG | 1068 | 0 | 0 | 28 | 7 | 0 | 0 | |
| SW | 0 | 350 | 2 | 3 | 1 | 0 | 0 | |
| AG | 0 | 0 | 253 | 0 | 0 | 0 | 1 | |
| Hainan | AQ | 54 | 0 | 0 | 380 | 3 | 0 | 0 |
| BU | 8 | 0 | 0 | 19 | 203 | 1 | 0 | |
| MF | 1 | 0 | 0 | 0 | 0 | 120 | 0 | |
| SM | 0 | 0 | 1 | 2 | 0 | 0 | 80 |
MG = Mangrove, SW = Seawater, AG = Agriculture, AQ = Aquaculture, BU = Built up, MF = Mudflat, SM = Salt marsh.
Table A2.
The classification accuracies of change quantification in each province (district).
Table A2.
The classification accuracies of change quantification in each province (district).
| 1985 | 1996 | 2007 | 2010 | |||||
|---|---|---|---|---|---|---|---|---|
| Gain | Loss | Gain | Loss | Gain | Loss | Gain | Loss | |
| Zhejiang | 0.9590 | 0.9501 | 0.9481 | 0.9611 | 0.9628 | 0.9500 | 0.9595 | 0.9589 |
| Fujian | 0.9866 | 0.9632 | 0.9795 | 0.9005 | 0.9867 | 0.9553 | 0.9843 | 0.9712 |
| Guangdong | 0.9844 | 0.9487 | 0.9709 | 0.9445 | 0.9839 | 0.9546 | 0.9805 | 0.9581 |
| Guangxi | 1 | 0.9948 | 0.9993 | 0.9841 | 1 | 0.9888 | 0.9986 | 0.9809 |
| Hainan | 0.9581 | 0.9650 | 0.9480 | 0.9754 | 0.9862 | 0.9690 | 0.9794 | 0.9617 |
| Hong Kong | 0.9824 | 0.9605 | 0.9790 | 0.9472 | 0.9831 | 0.9552 | 0.9844 | 0.9605 |
| Taiwan | 0.9653 | 0.9676 | 0.9375 | 0.9690 | 0.9865 | 0.9565 | 0.9856 | 0.9725 |

Figure A1.
Mangrove areas’ comparison with other available data in 2010.
References
- Nagelkerken, I.; van der Velde, G.; Gorissen, M.; Meijer, G.; Van’t Hof, T.; Den Hartog, C. Importance of mangroves, seagrass beds and the shallow coral reef as a nursery for important coral reef fishes, using a visual census technique. Estuar. Coast. Shelf Sci. 2000, 51, 31–44. [Google Scholar] [CrossRef]
- Arkema, K.K.; Guannel, G.; Verutes, G.; Wood, S.A.; Guerry, A.; Ruckelshaus, M.; Kareiva, P.; Lacayo, M.; Silver, J.M. Coastal habitats shield people and property from sea-level rise and storms. Nat. Clim. Chang. 2013, 3, 913–918. [Google Scholar] [CrossRef]
- Duarte, C.M.; Losada, I.J.; Hendriks, I.E.; Mazarrasa, I.; Marbà, N. The role of coastal plant communities for climate change mitigation and adaptation. Nat. Clim. Chang. 2013, 3, 961–968. [Google Scholar] [CrossRef]
- Murray, B.C.; Pendleton, L.; Jenkins, W.A.; Sifleet, S. Green Payments for Blue Carbon: Economic Incentives for Protecting Threatened Coastal Habitats. 2011. Available online: https://nicholasinstitute.duke.edu/environment/publications/naturalresources/blue-carbon-report (accessed on 6 July 2020).
- Hamilton, S.E.; Casey, D. Creation of a high spatio-temporal resolution global database of continuous mangrove forest cover for the 21st century (CGMFC-21). Glob. Ecol. Biogeogr. 2016, 25, 729–738. [Google Scholar] [CrossRef]
- Spalding, M.; Blasco, E.; Field, C. World Mangrove Alias; The International Society for Mangrove Ecosystems: Okinawa, Japan, 1997. [Google Scholar]
- Wu, J.; Zhang, H.; Pan, Y.; Krause-Jensen, D.; He, Z.; Fan, W.; Xiao, X.; Chung, I.; Marbà, N.; Serrano, O. Opportunities for blue carbon strategies in China. Ocean Coast. Manag. 2020, 194, 105241. [Google Scholar] [CrossRef]
- Li, X.; Yu, X.; Hou, X.; Liu, Y.; Li, H.; Zhou, Y.; Xia, S.; Liu, Y.; Duan, H.; Wang, Y. Valuation of Wetland Ecosystem Services in National Nature Reserves in China’s Coastal Zones. Sustainability 2020, 12, 3131. [Google Scholar] [CrossRef]
- He, Y.; Zhang, M. Study on wetland loss and its reasons in China. Chin. Geogr. Sci. 2001, 11, 241–245. [Google Scholar] [CrossRef]
- Spalding, M.; Kainuma, M.; Collins, L. World Atlas of Mangroves; Earthscan: London, UK, 2010. [Google Scholar]
- Giri, C.; Ochieng, E.; Tieszen, L.L.; Zhu, Z.; Singh, A.; Loveland, T.; Masek, J.; Duke, N. Status and distribution of mangrove forests of the world using earth observation satellite data. Glob. Ecol. Biogeogr. 2011, 20, 154–159. [Google Scholar] [CrossRef]
- Wu, P.; Zhang, J.; Ma, Y.; Li, X. Remote sensing monitoring and analysis of the changes of mangrove resource in China in the past 20 years. Adv. Mar. Sci. 2013, 31, 406–414, (In Chinese with English Abstract). [Google Scholar]
- Jia, M.; Wang, Z.; Li, L.; Song, K.; Ren, C.; Liu, B.; Mao, D. Mapping China’s mangroves based on an object-oriented classification of Landsat imagery. Wetlands 2014, 34, 277–283. [Google Scholar] [CrossRef]
- Chen, B.; Xiao, X.; Li, X.; Pan, L.; Doughty, R.; Ma, J.; Dong, J.; Qin, Y.; Zhao, B.; Wu, Z. A mangrove forest map of China in 2015: Analysis of time series Landsat 7/8 and Sentinel-1A imagery in Google Earth Engine cloud computing platform. ISPRS J. Photogramm. Remote Sens. 2017, 131. [Google Scholar] [CrossRef]
- Hu, L.; Li, W.; Xu, B. Monitoring mangrove forest change in China from 1990 to 2015 using Landsat-derived spectral-temporal variability metrics. Int. J. Appl. Earth Obs. Geoinf. 2018, 73, 88–98. [Google Scholar] [CrossRef]
- Jia, M.; Wang, Z.; Zhang, Y.; Mao, D.; Wang, C. Monitoring loss and recovery of mangrove forests during 42 years: The achievements of mangrove conservation in China. Int. J. Appl. Earth Obs. Geoinf. 2018, 73, 535–545. [Google Scholar] [CrossRef]
- Lee, J.-S. Digital image enhancement and noise filtering by use of local statistics. IEEE Trans. Pattern Anal. Mach. Intell. 1980, 165–168. [Google Scholar] [CrossRef]
- Tucker, C.J. Red and photographic infrared linear combinations for monitoring vegetation. Remote Sens. Environ. 1978, 8, 127–150. [Google Scholar] [CrossRef]
- Gao, B.-C. NDWI—A normalized difference water index for remote sensing of vegetation liquid water from space. Remote Sens. Environ. 1996, 58, 257–266. [Google Scholar] [CrossRef]
- Zhou, Y.; Xiao, X.; Qin, Y.; Dong, J.; Zhang, G.; Kou, W.; Jin, C.; Wang, J.; Li, X. Mapping paddy rice planting area in rice-wetland coexistent areas through analysis of Landsat 8 OLI and MODIS images. Int. J. Appl. Earth Obs. Geoinf. 2016, 46, 1–12. [Google Scholar] [CrossRef]
- Xu, H. Modification of normalised difference water index (NDWI) to enhance open water features in remotely sensed imagery. Int. J. Remote Sens. 2006, 27, 3025–3033. [Google Scholar] [CrossRef]
- Huete, A.R. A soil-adjusted vegetation index (SAVI). Remote Sensing of Environment. Remote Sens. Environ. 1988, 25, 295–309. [Google Scholar] [CrossRef]
- Bruzzone, L.; Prieto, D.F. Automatic analysis of the difference image for unsupervised change detection. IEEE Trans. Geosci. Remote Sens. 2000, 38, 1171–1182. [Google Scholar] [CrossRef]
- Dingle Robertson, L.; King, D.J. Comparison of pixel-and object-based classification in land cover change mapping. Int. J. Remote Sens. 2011, 32, 1505–1529. [Google Scholar] [CrossRef]
- Thomas, N.; Bunting, P.; Lucas, R.; Hardy, A.; Rosenqvist, A.; Fatoyinbo, T. Mapping mangrove extent and change: A globally applicable approach. Remote Sens. 2018, 10, 1466. [Google Scholar] [CrossRef]
- Macleod, R.D.; Congalton, R.G. A quantitative comparison of change-detection algorithms for monitoring eelgrass from remotely sensed data. Photogramm. Eng. Remote Sens. 1998, 64, 207–216. [Google Scholar]
- RStudio Team. RStudio: Integrated Development for R. RStudio; PBC: Boston, MA, USA, 2019. [Google Scholar]
- Chen, L.; Wang, W.; Zhang, Y.; Lin, G. Recent progresses in mangrove conservation, restoration and research in China. J. Plant Ecol. 2009, 2, 45–54. [Google Scholar] [CrossRef]
- Dong, J.; Xiao, X.; Menarguez, M.A.; Zhang, G.; Qin, Y.; Thau, D.; Biradar, C.; Moore III, B. Mapping paddy rice planting area in northeastern Asia with Landsat 8 images, phenology-based algorithm and Google Earth Engine. Remote Sens. Environ. 2016, 185, 142–154. [Google Scholar] [CrossRef]
- Held, A.; Ticehurst, C.; Lymburner, L.; Williams, N. High resolution mapping of tropical mangrove ecosystems using hyperspectral and radar remote sensing. Int. J. Remote Sens. 2003, 24, 2739–2759. [Google Scholar] [CrossRef]
- Ramsey, E.W.; Nelson, G.A.; Sapkota, S.K. Classifying coastal resources by integrating optical and radar imagery and color infrared photography. Mangroves Salt Marshes 1998, 2, 109–119. [Google Scholar] [CrossRef]
- Pham, T.D.; Yokoya, N.; Bui, D.T.; Yoshino, K.; Friess, D.A. Remote sensing approaches for monitoring mangrove species, structure, and biomass: Opportunities and challenges. Remote Sens. 2019, 11, 230. [Google Scholar] [CrossRef]
- Huang, X.; Peng, X.; Qiu, J.; Chen, S. Mangrove status and development prospects in southern Zhejiang Province. J. Zhejiang For. Coll. 2009, 26, 427–433, (In Chinese with English Abstract). [Google Scholar]
- Wang, A.; Chen, J.; Jing, C.; Ye, G.; Wu, J.; Huang, Z.; Zhou, C. Monitoring the invasion of Spartina alterniflora from 1993 to 2014 with Landsat TM and SPOT 6 satellite data in Yueqing Bay, China. PLoS ONE 2015, 10, e0135538. [Google Scholar] [CrossRef]
- Wang, L.; Jia, M.; Yin, D.; Tian, J. A review of remote sensing for mangrove forests: 1956–2018. Remote Sens. Environ. 2019, 231, 111223. [Google Scholar] [CrossRef]
- Jia, M.; Liu, M.; Wang, Z.; Mao, D.; Ren, C.; Cui, H. Evaluating the effectiveness of conservation on mangroves: A remote sensing-based comparison for two adjacent protected areas in Shenzhen and Hong Kong, China. Remote Sens. 2016, 8, 627. [Google Scholar] [CrossRef]
- Songsom, V.; Koedsin, W.; Ritchie, R.J.; Huete, A. Mangrove phenology and environmental drivers derived from remote sensing in southern Thailand. Remote Sens. 2019, 11, 955. [Google Scholar] [CrossRef]
- Liu, M.; Zhang, H.; Lin, G.; Lin, H.; Tang, D. Zonation and directional dynamics of mangrove forests derived from time-series satellite imagery in Mai Po, Hong Kong. Sustainability 2018, 10, 1913. [Google Scholar] [CrossRef]
© 2020 by the authors. Licensee MDPI, Basel, Switzerland. This article is an open access article distributed under the terms and conditions of the Creative Commons Attribution (CC BY) license (http://creativecommons.org/licenses/by/4.0/).