A Built Heritage Information System Based on Point Cloud Data: HIS-PC

 ,
,  ,
,  ,
, 
Abstract
1. Introduction
- -
- Supporting heritage research allowing, for example, the development of hypotheses on the history of the built environment;
- -
- Serving as an interface to access massive multi-modal information of diverse nature (spatial, temporal, topology, semantics);
- -
- Producing tools and documents for mediation purposes;
- -
- Recording conservation monitoring data.
2. Related Works
2.1. Heritage Documentation
2.2. Heritage Knowledge Representation—The BIM Process
2.3. Heritage BIM and Its Limitation
2.4. Heritage Information System
- -
- managing semantic, temporal and spatial component of heritage information;
- -
- enabling complex spatiotemporal querying and visualisation; and
- -
- supporting point cloud data, eventually as a core spatial data structure.
- -
- be open and adaptative, considering the fast-growing technologies in the field of data acquisition, data management, data visualisation, etc.;
- -
- meet the user’s requirements and therefore be adaptable to needs of specific organisations; and
- -
- be as interoperable as possible to allow the sharing of data and system evolution.
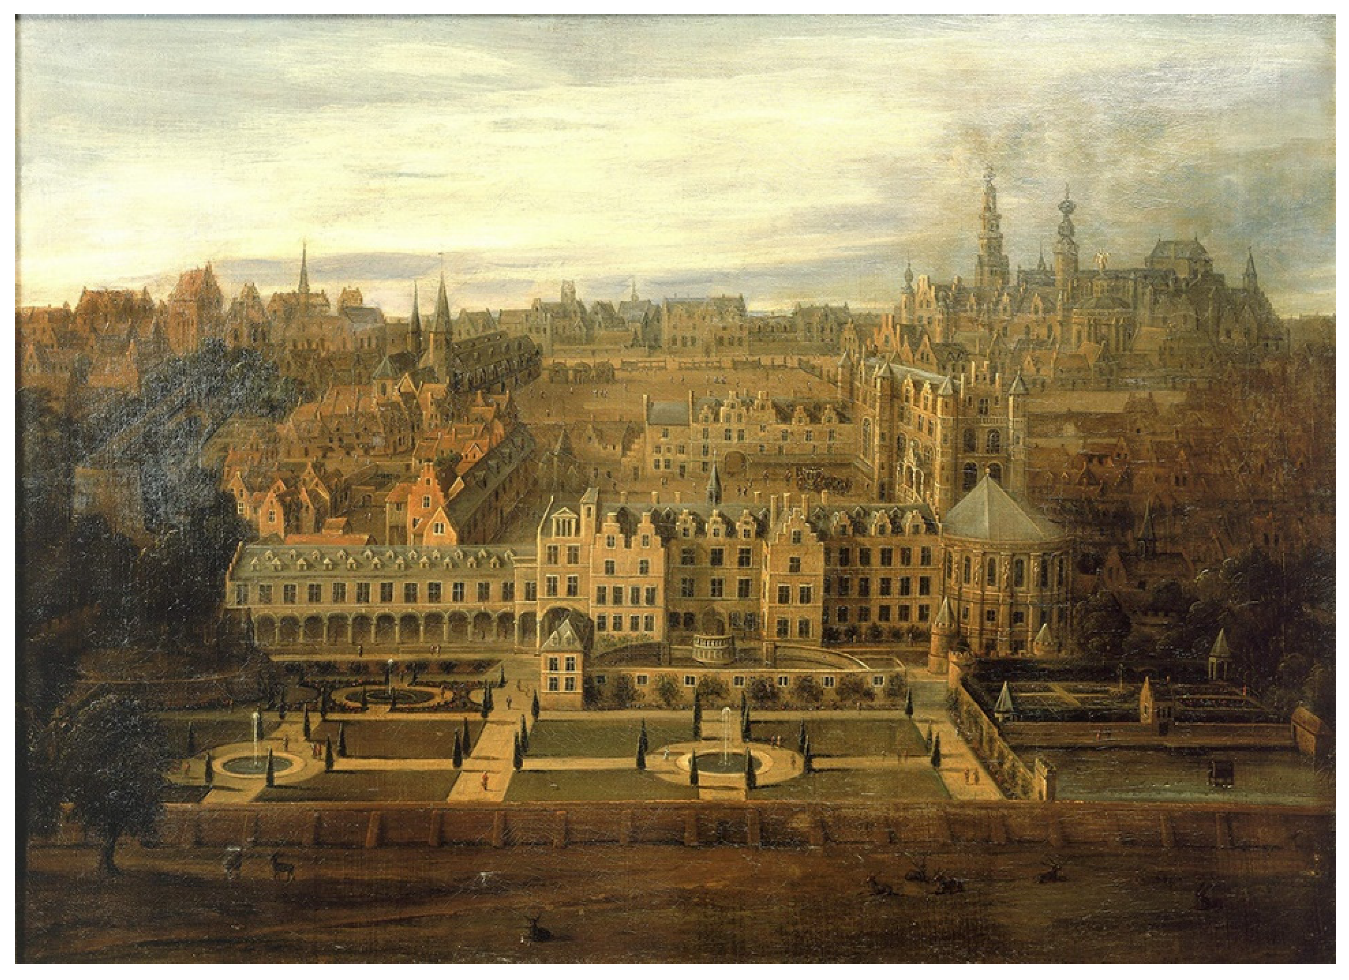
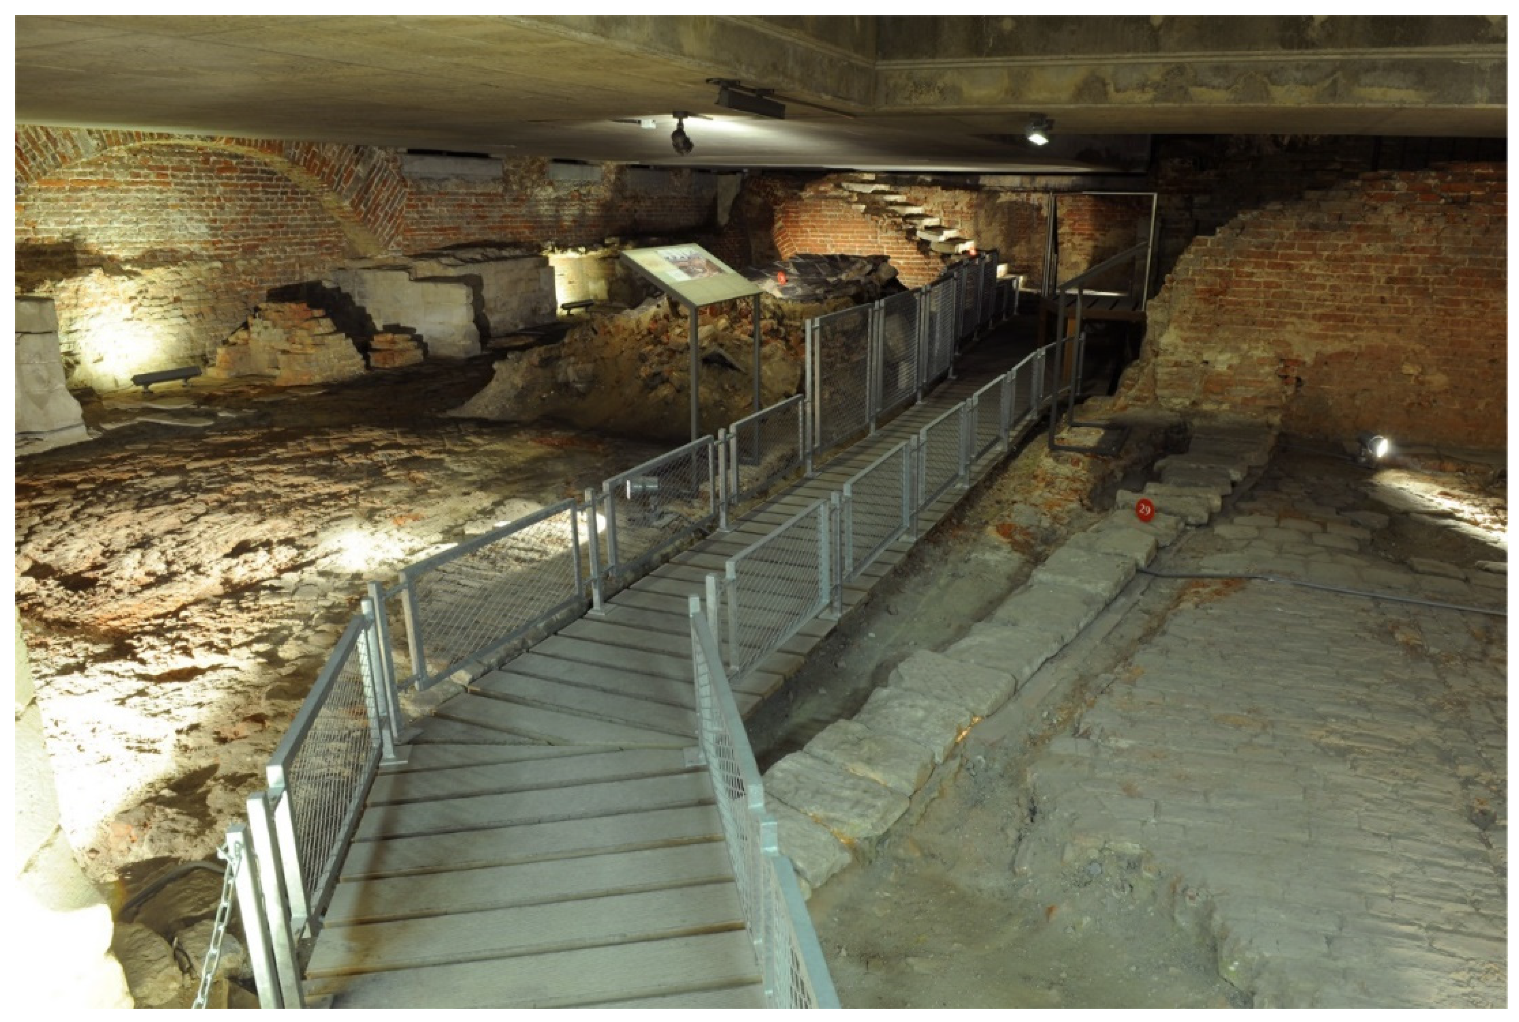
3. Context
4. HIS-PC Architecture Design
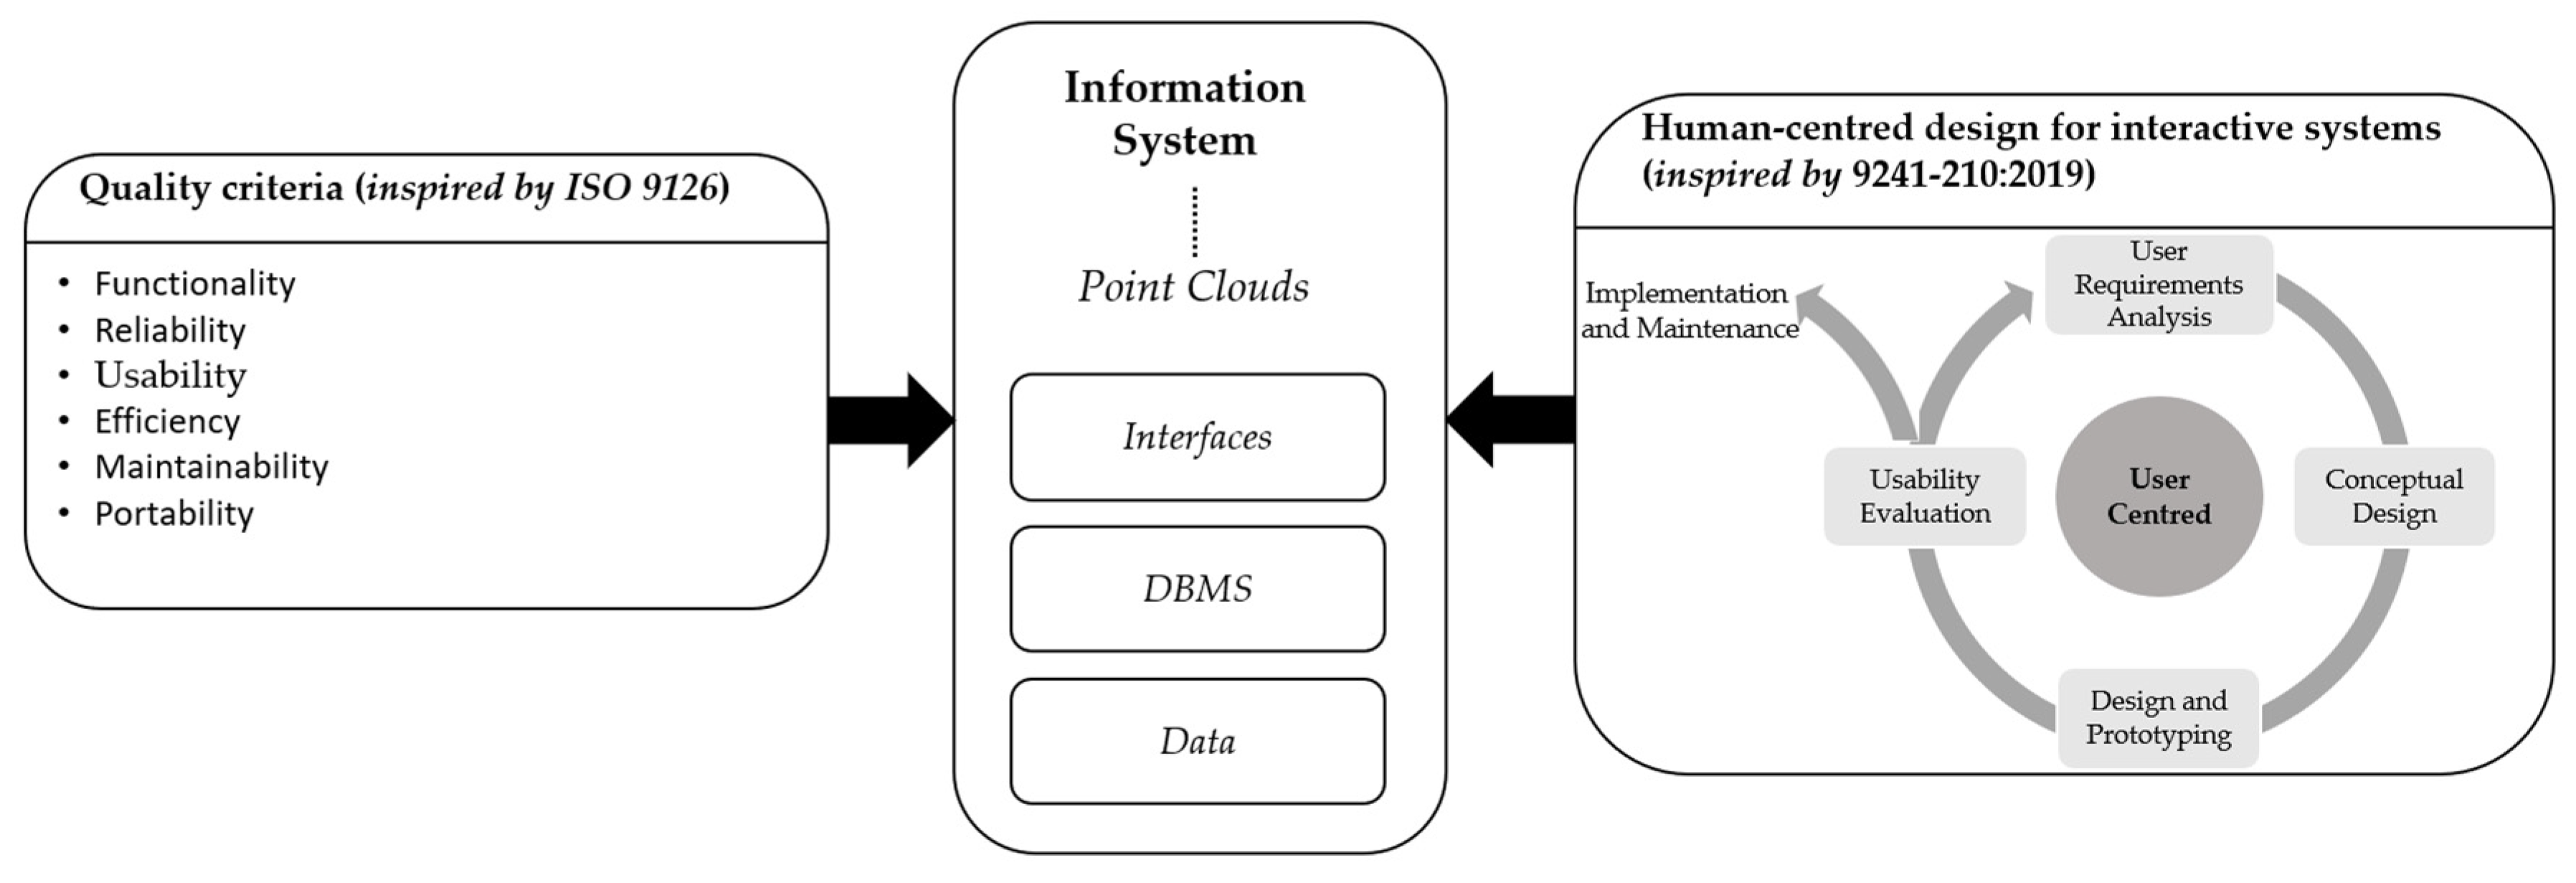
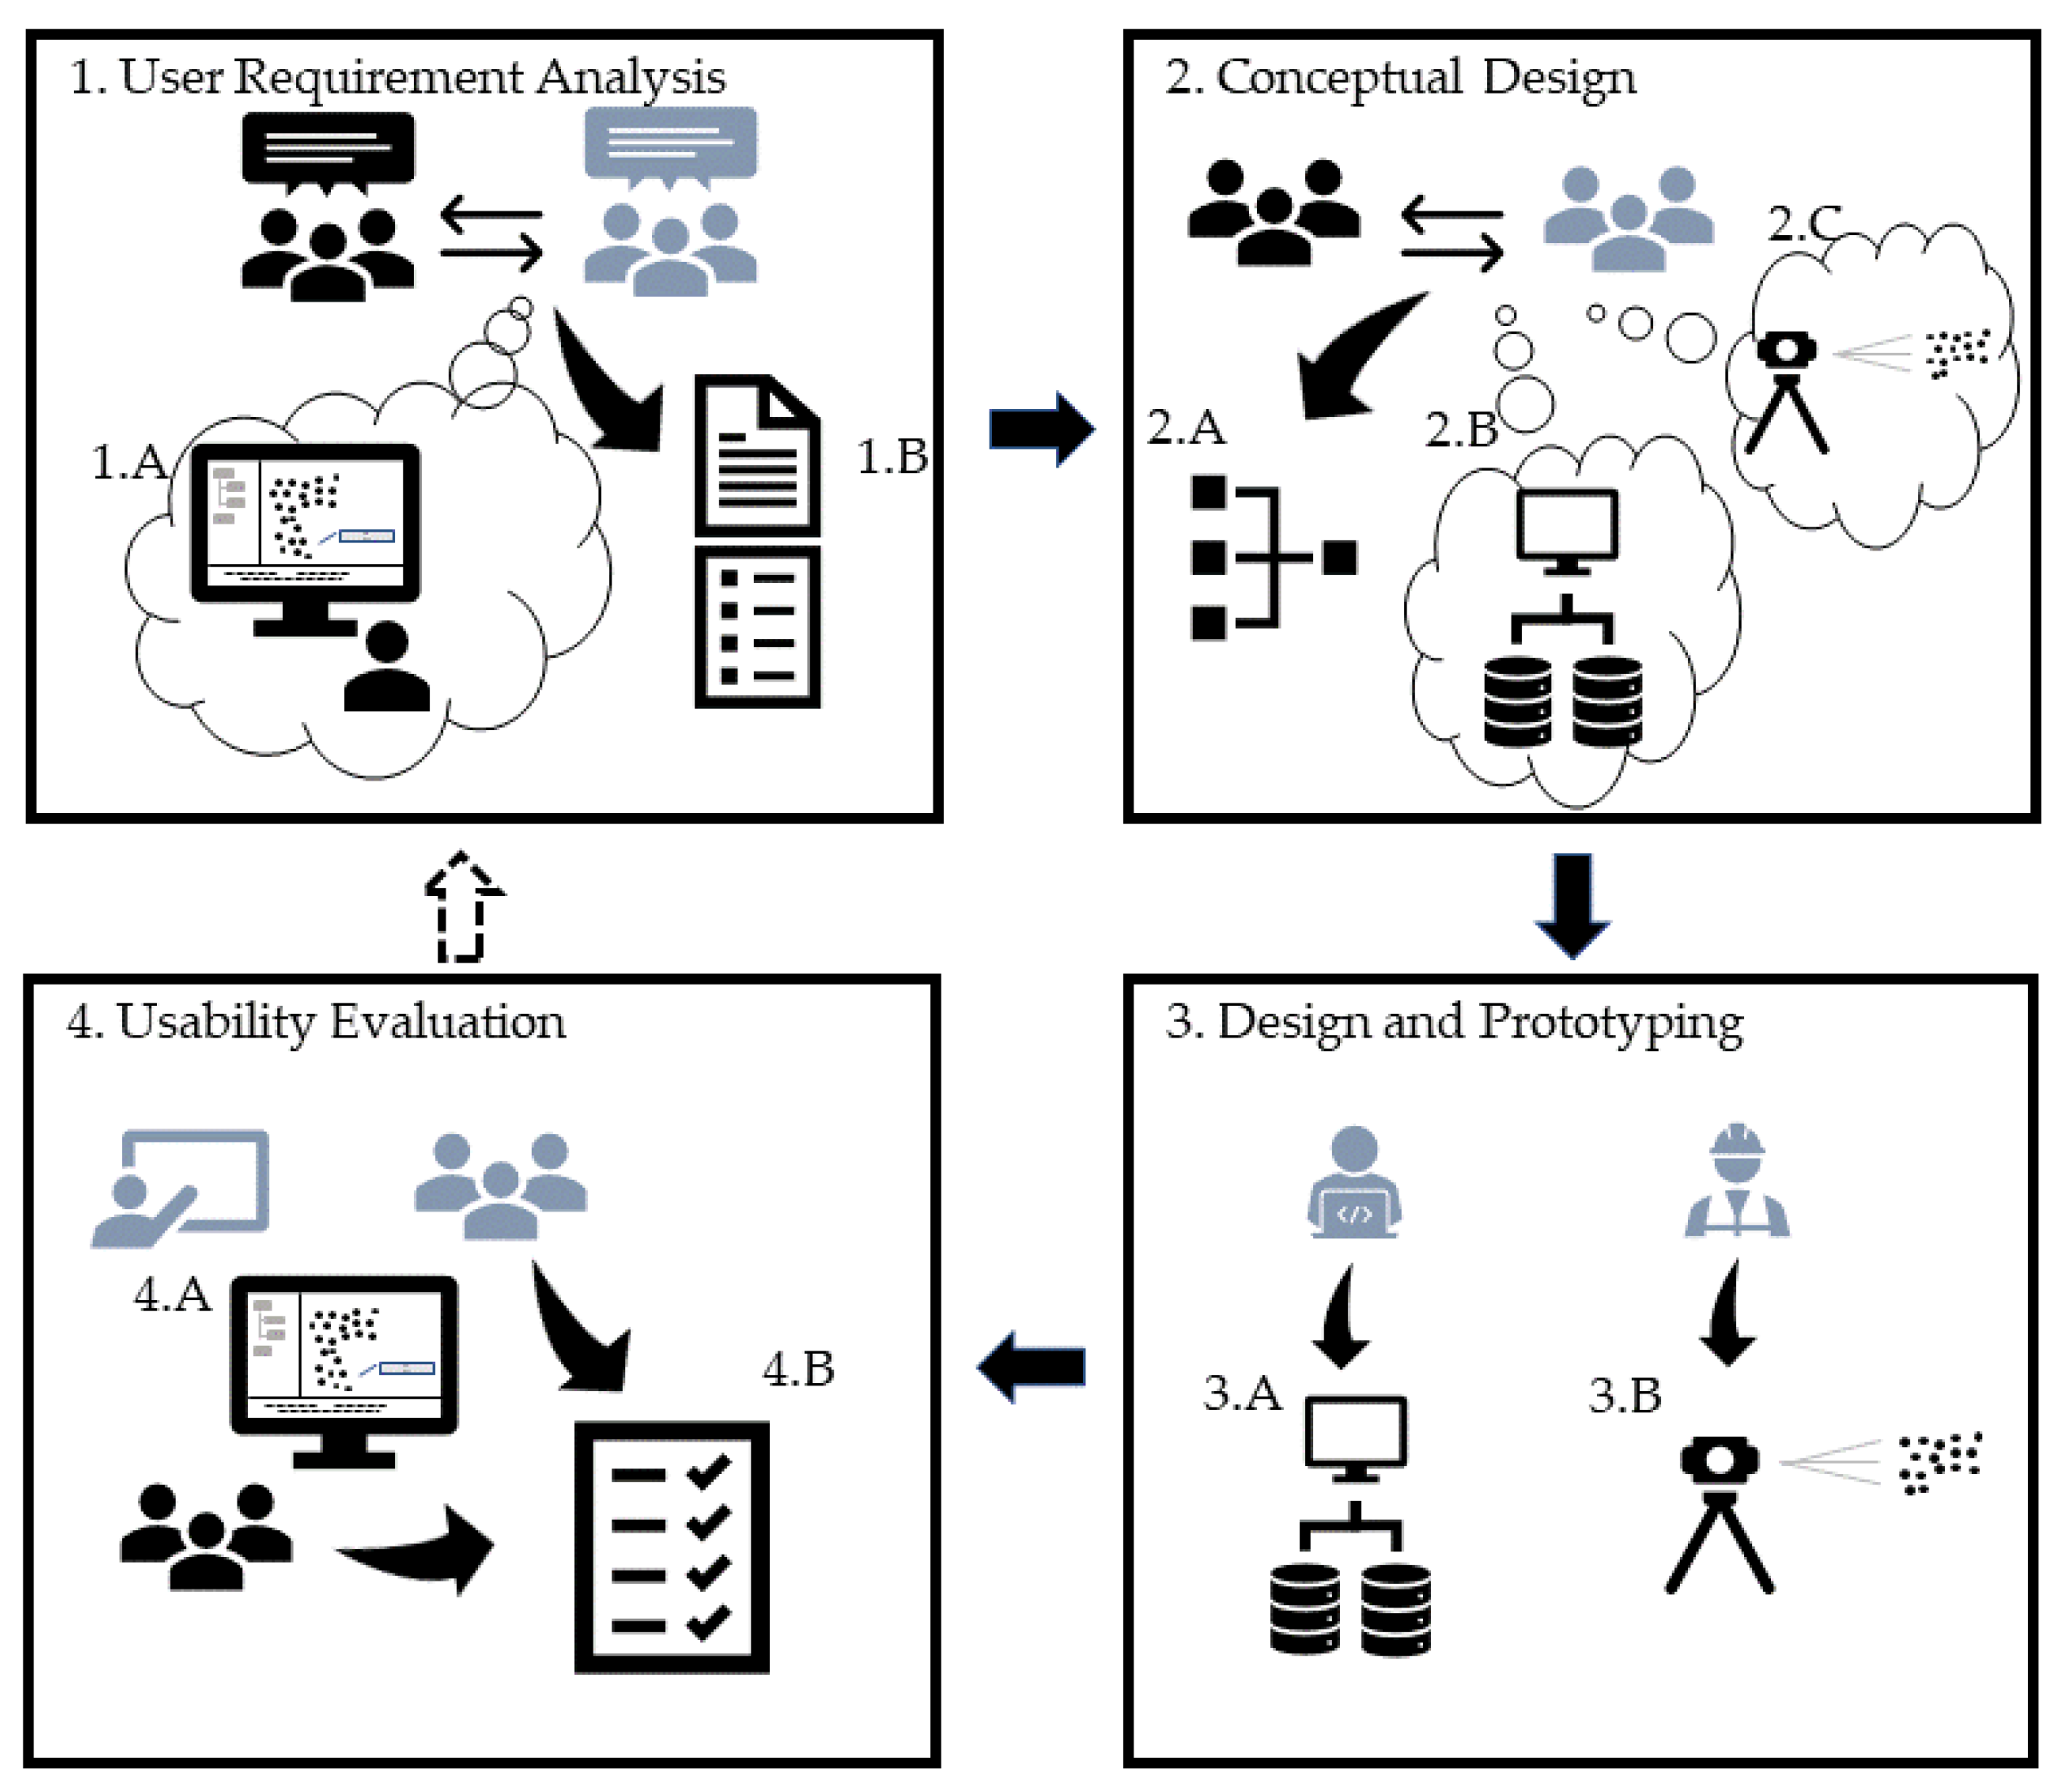
4.1. HIS-PC User-Centred Design
- The analysis of users’ requirements (step 1) which ended up with a list of needs and formalised specifications, both for the IS and data acquisition.
- The conceptual design (step 2) where conceptual data models, system’s interfaces and data acquisition procedures are set up based on the specifications of the first step.
- The design and prototyping (step 3) which consists of an IS prototype development, data acquisition and data integration in the IS prototype.
- The usability evaluation (step 4) which is performed by the designers and the users. Depending on the result of the evaluation, either a new prototyping loop starts or the prototype reaches a further step of implementation and maintenance.
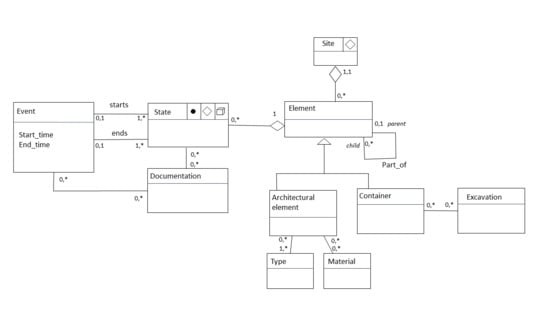
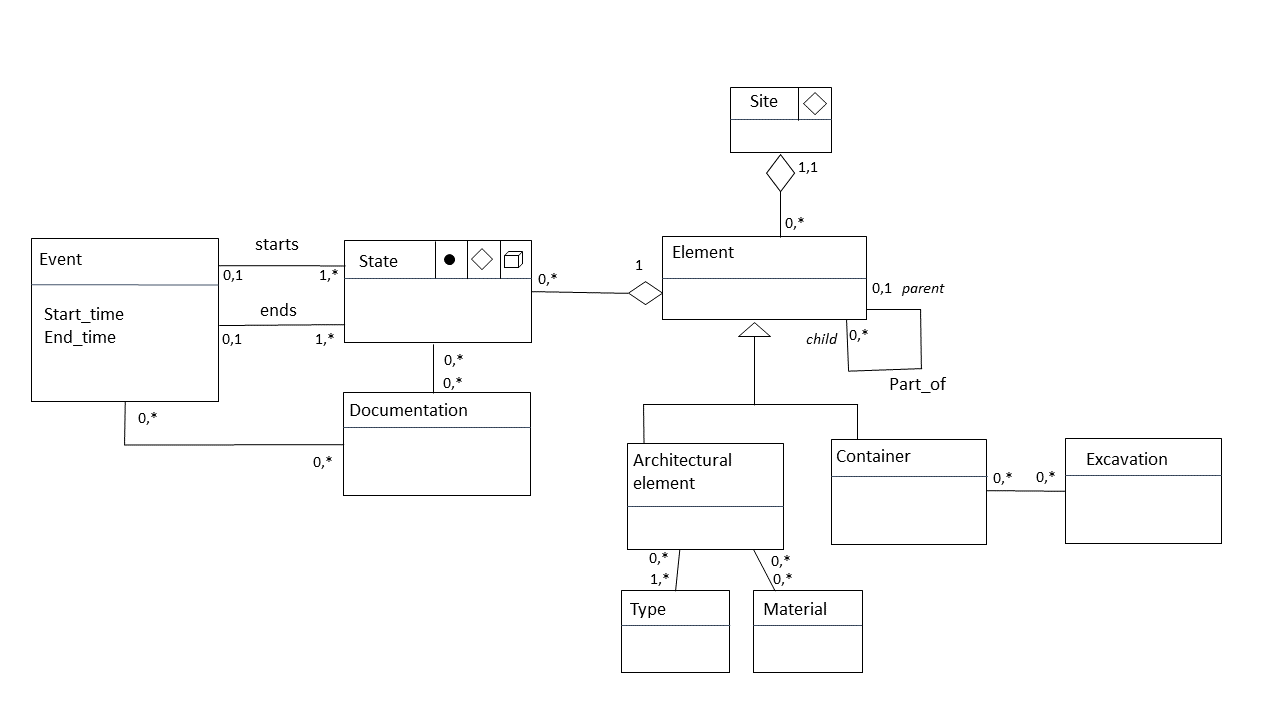
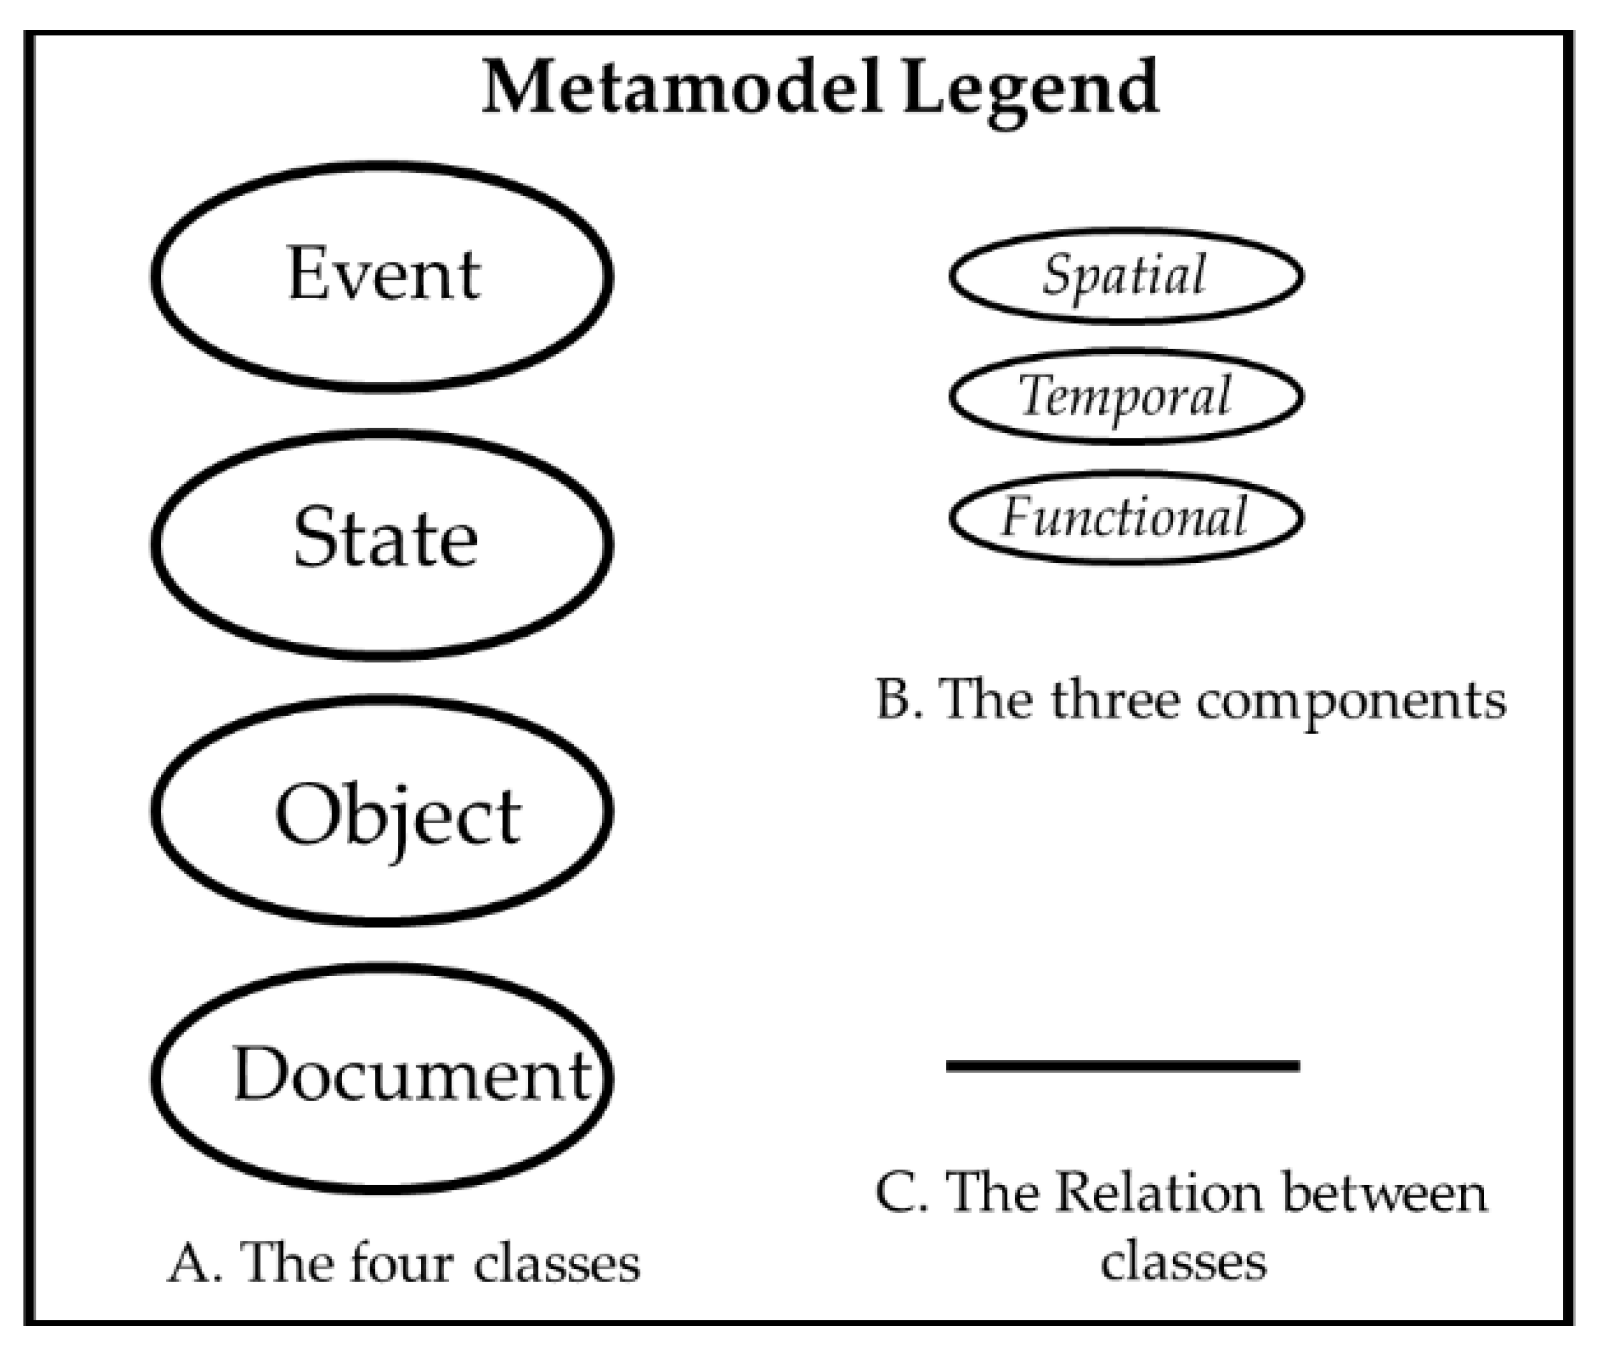
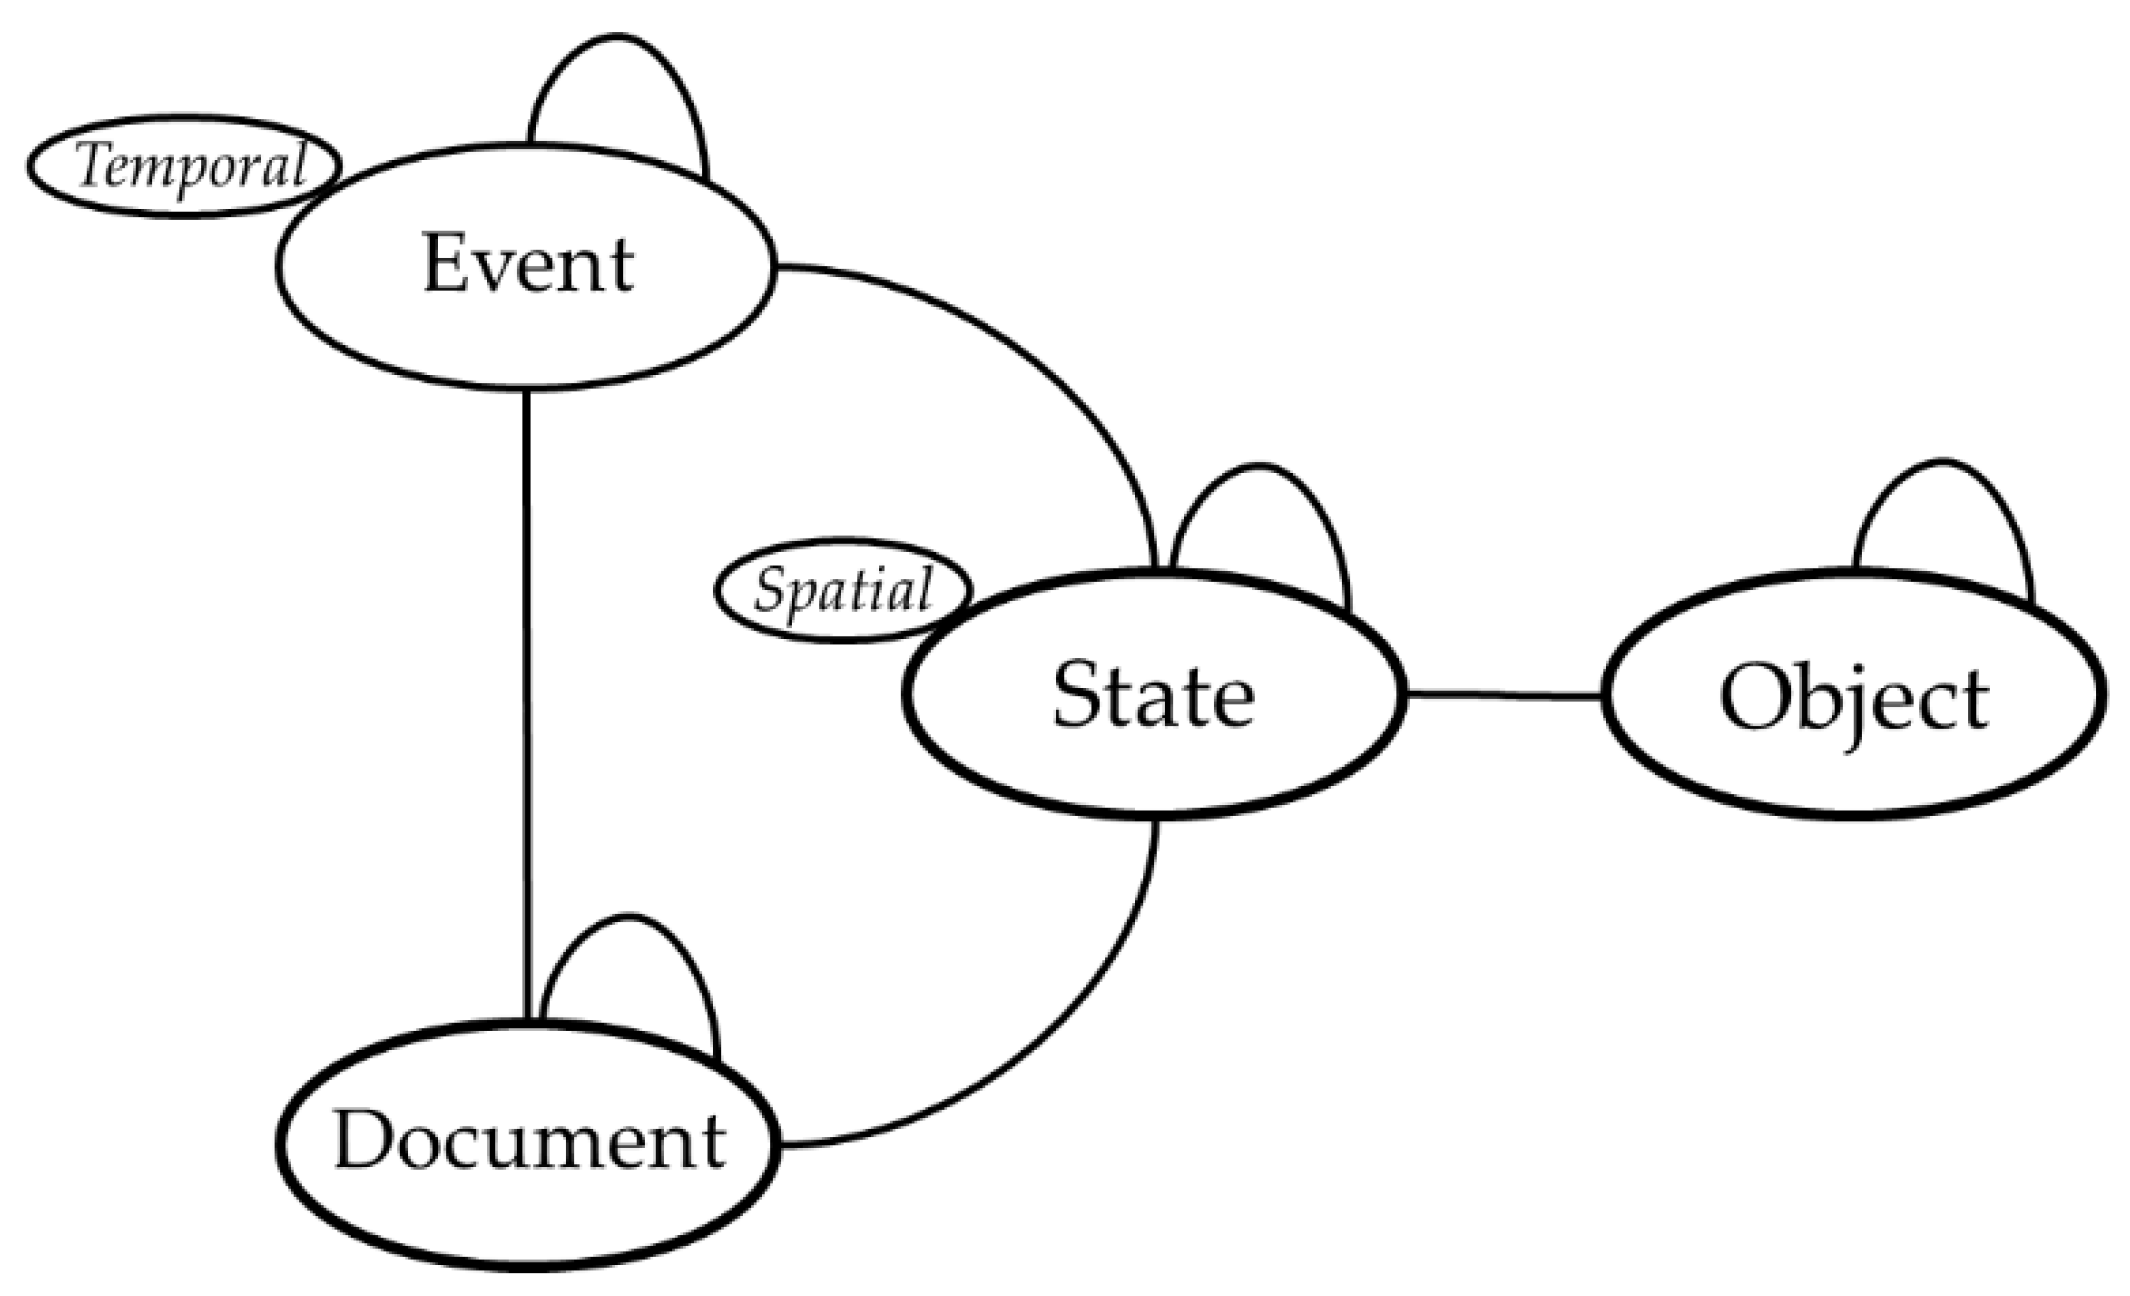
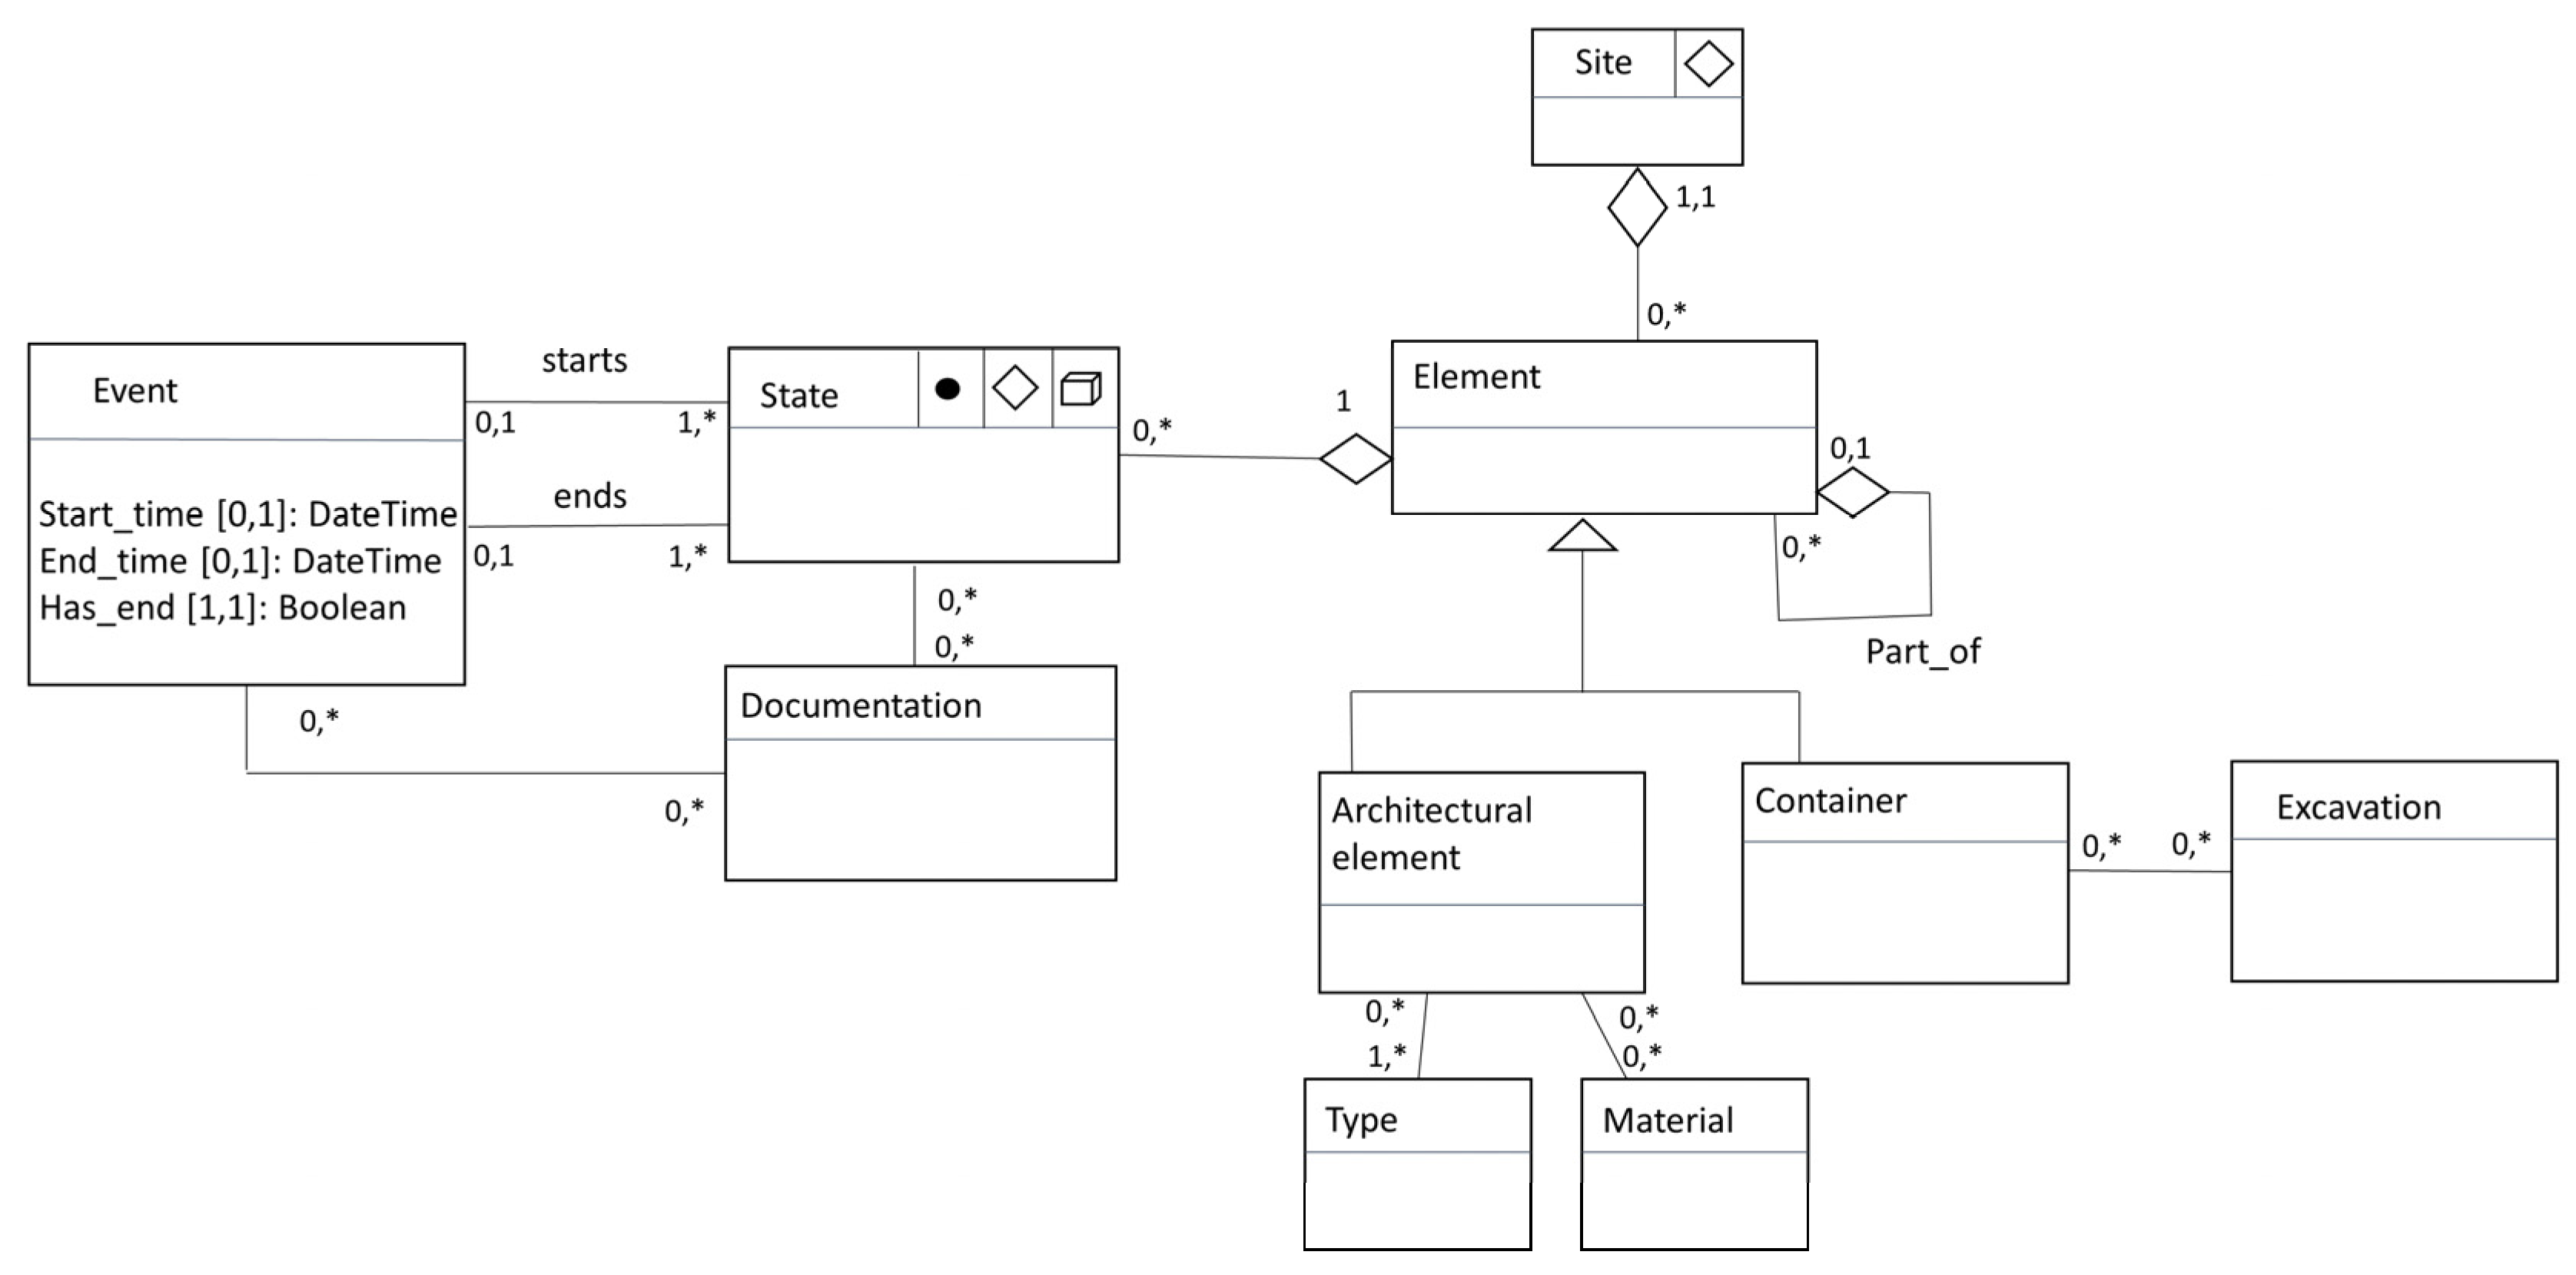
4.2. Data Model
- A distinction between existence and presence. This vision of an object lifecycle allows to sequence all the step of an object definition from its conception, to each transformation and finally to its final destruction. We assume that each transformation, considered as an event, is accessed through documentation that describes the change.
- The temporal states of an object are cumulative. The complete historical sequence is the combination for every state of an object. Consequently, an interpretative sequence is a sub-selection of some states in the complete object history.
- A heritage object is a part of another heritage object. This mereological approach of the heritage components gives considerable latitude to the stakeholders and the final system users to define their vision of the heritage site segmentation. It ensures that the proposed division is closely related to the user’s applications and correspond effectively to their needs.
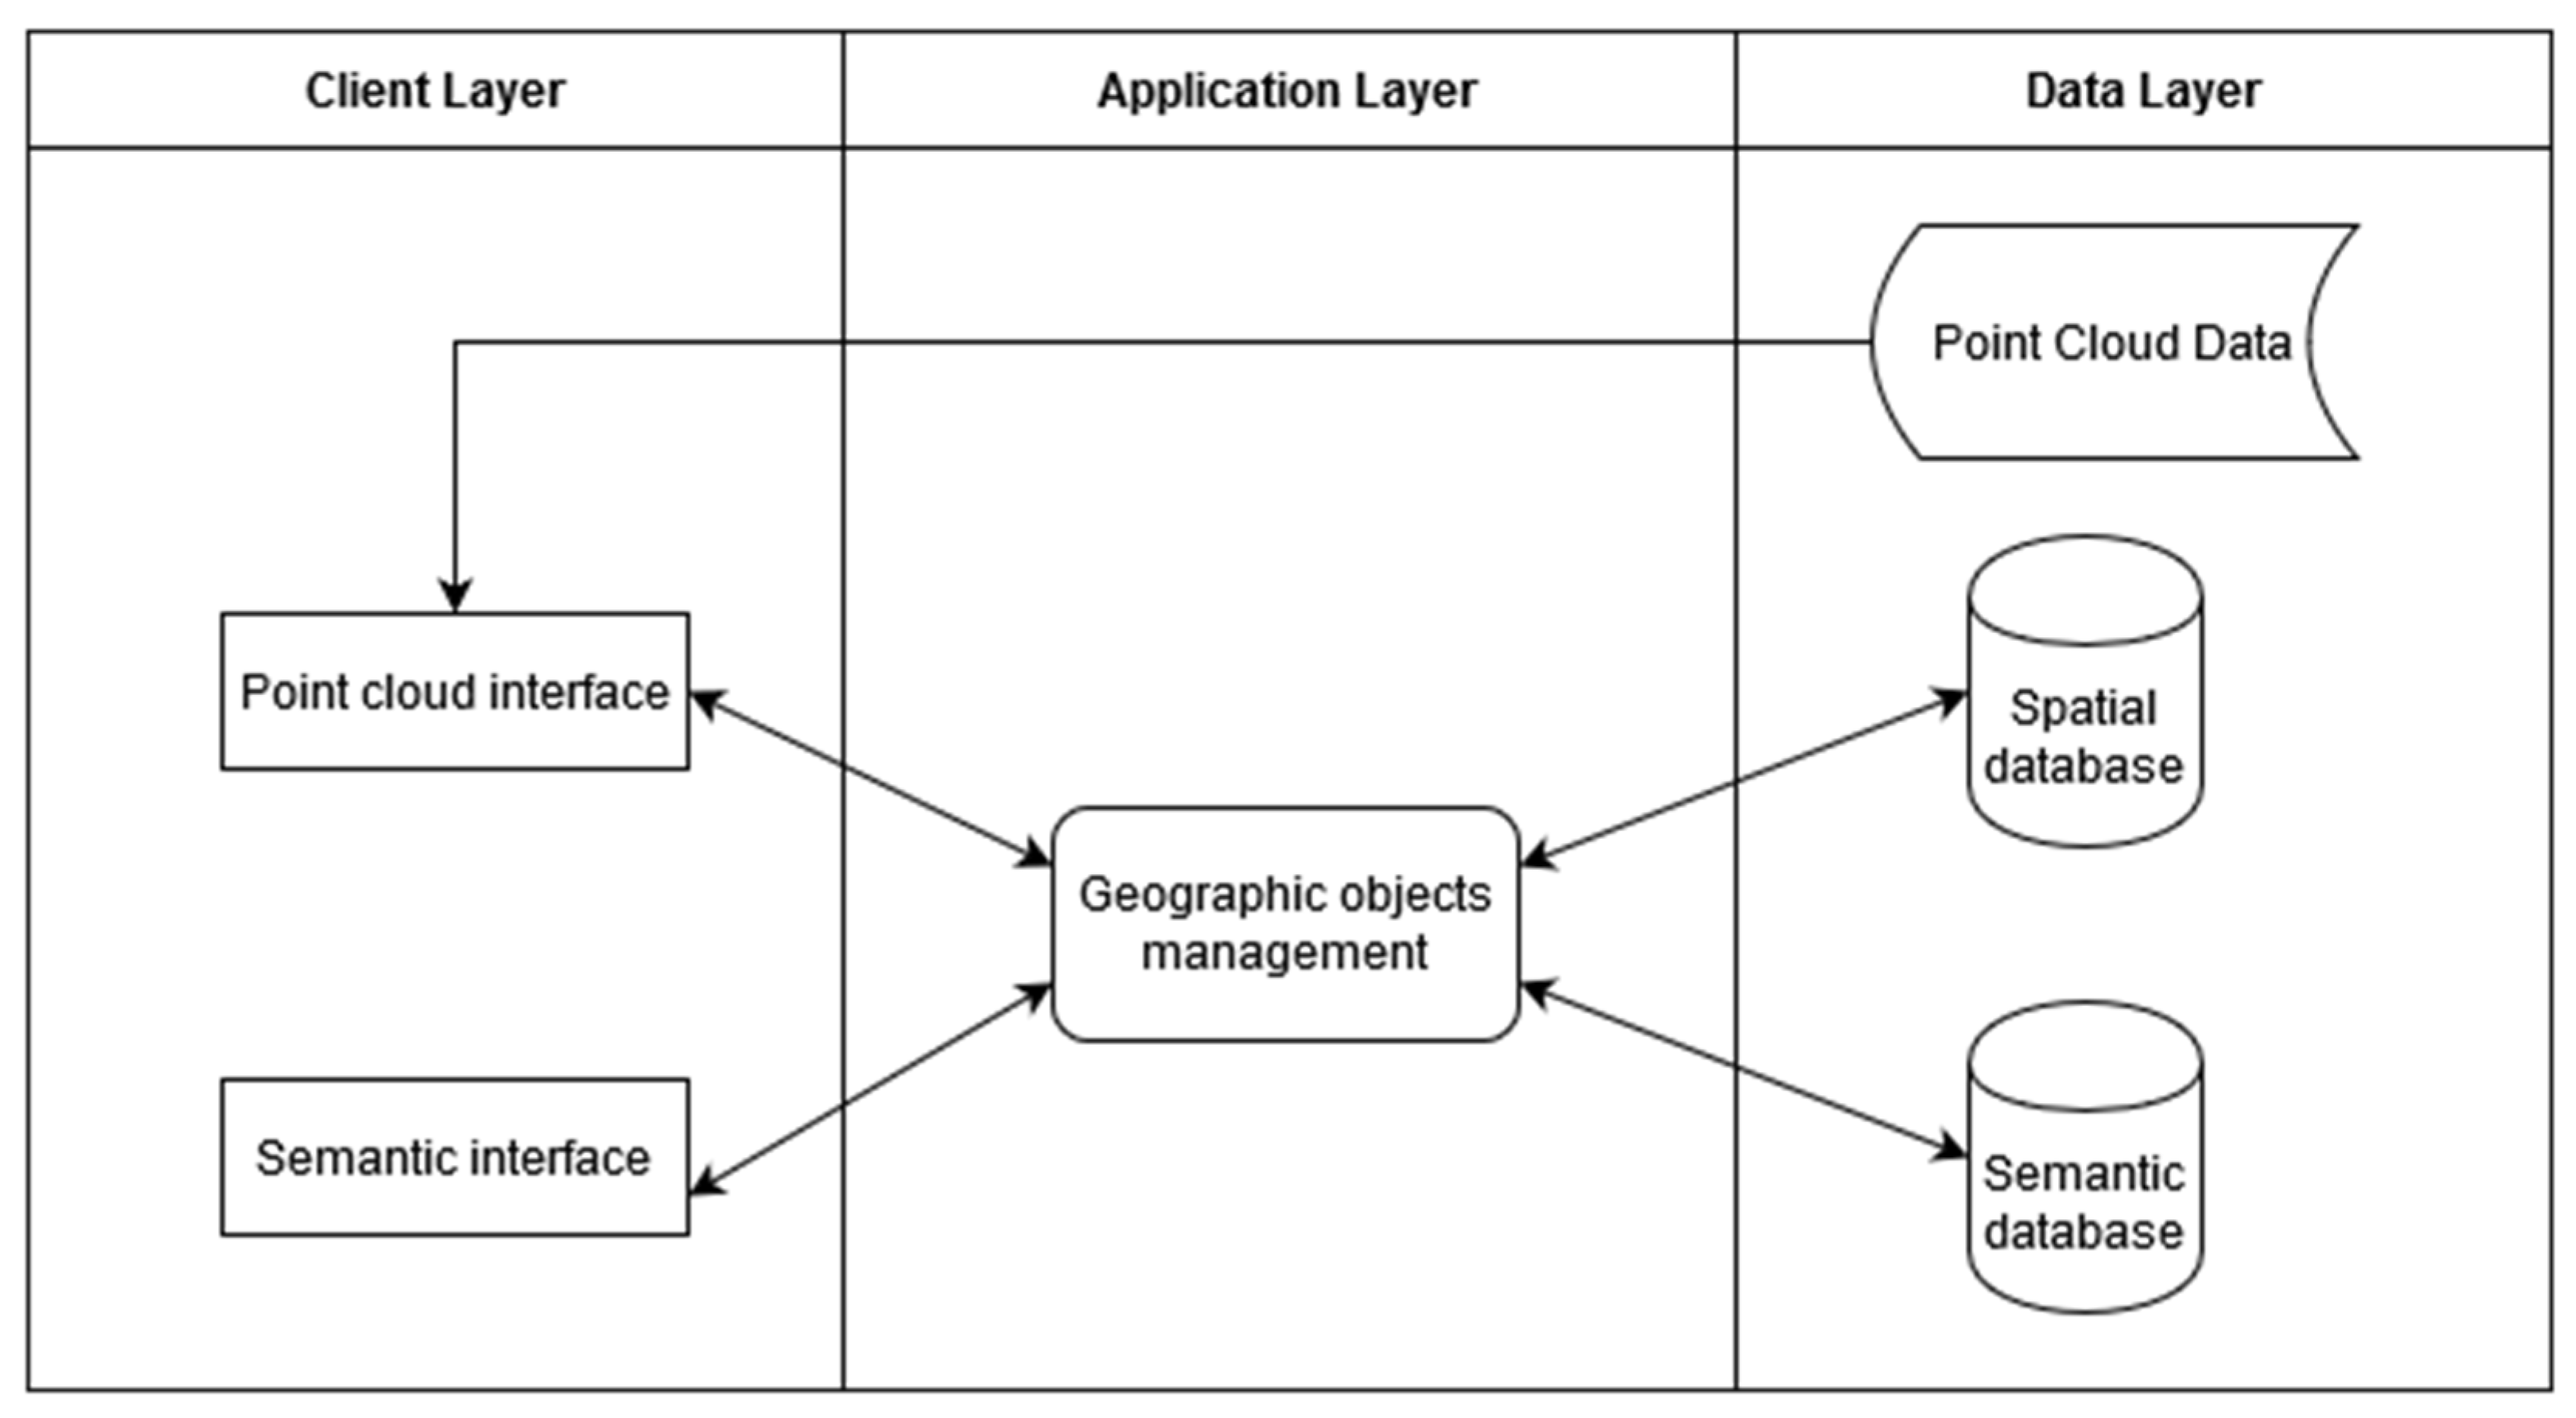
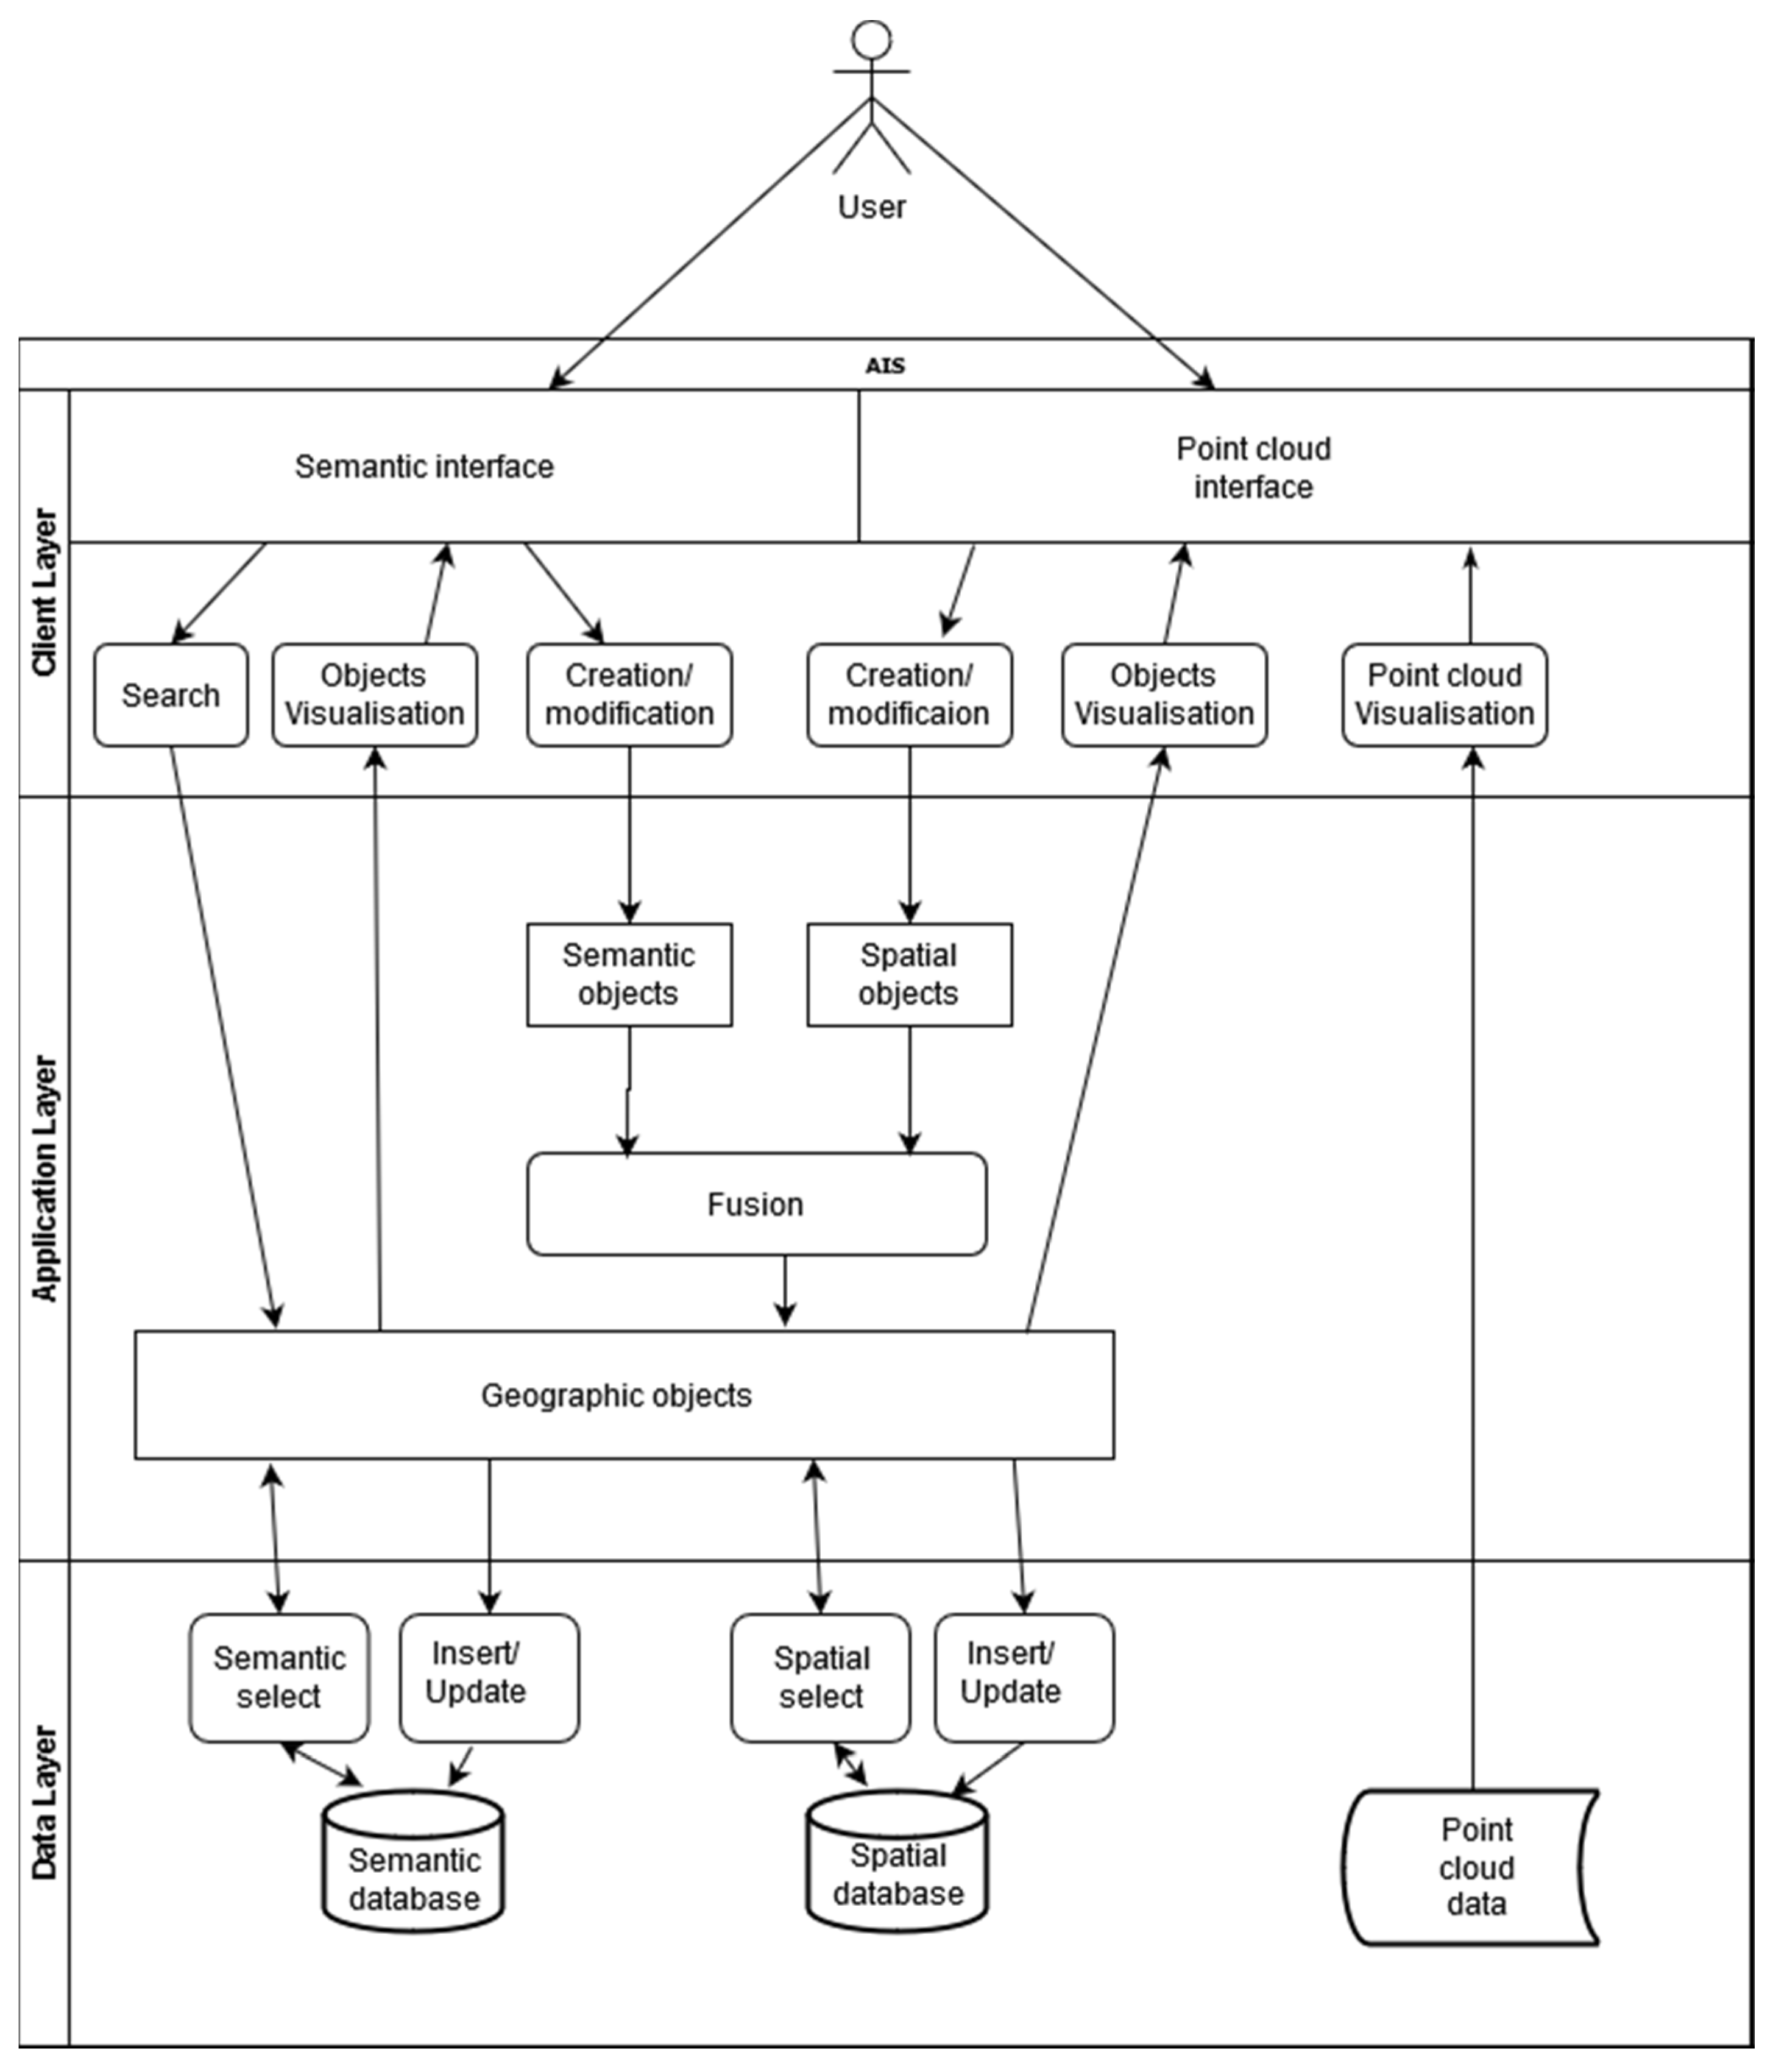
4.3. Information System Architecture Mock-Up
- A client layer regrouping interfaces which are the end users’ entry points to the HIS
- An application layer which allows the communication between the interfaces (client layers) and the data (data layer).
- A data layer regrouping all the data sources (databases or data files), structuring the data lake.
- Semantic interface:
- ○
- Creation/modification of semantic information for objects (e.g., creation of an object “wall” with its building date and material)
- ○
- Representation of all the semantic information of objects (e.g., what is the material of this wall and when was it built?)
- ○
- Search of objects based on semantic aspect and/or spatial predicates (e.g., which are the walls made of granite, built after the 13th century and higher than 2 m?)
- Spatial interface
- ○
- Point cloud visualisation
- ○
- Creation/modification of an object’s spatial definition (e.g., a located vector volume around a wall based on point cloud data)
- ○
- Spatial visualisation of objects (e.g., point cloud part intersected by a vector volume defining a wall)
5. Results
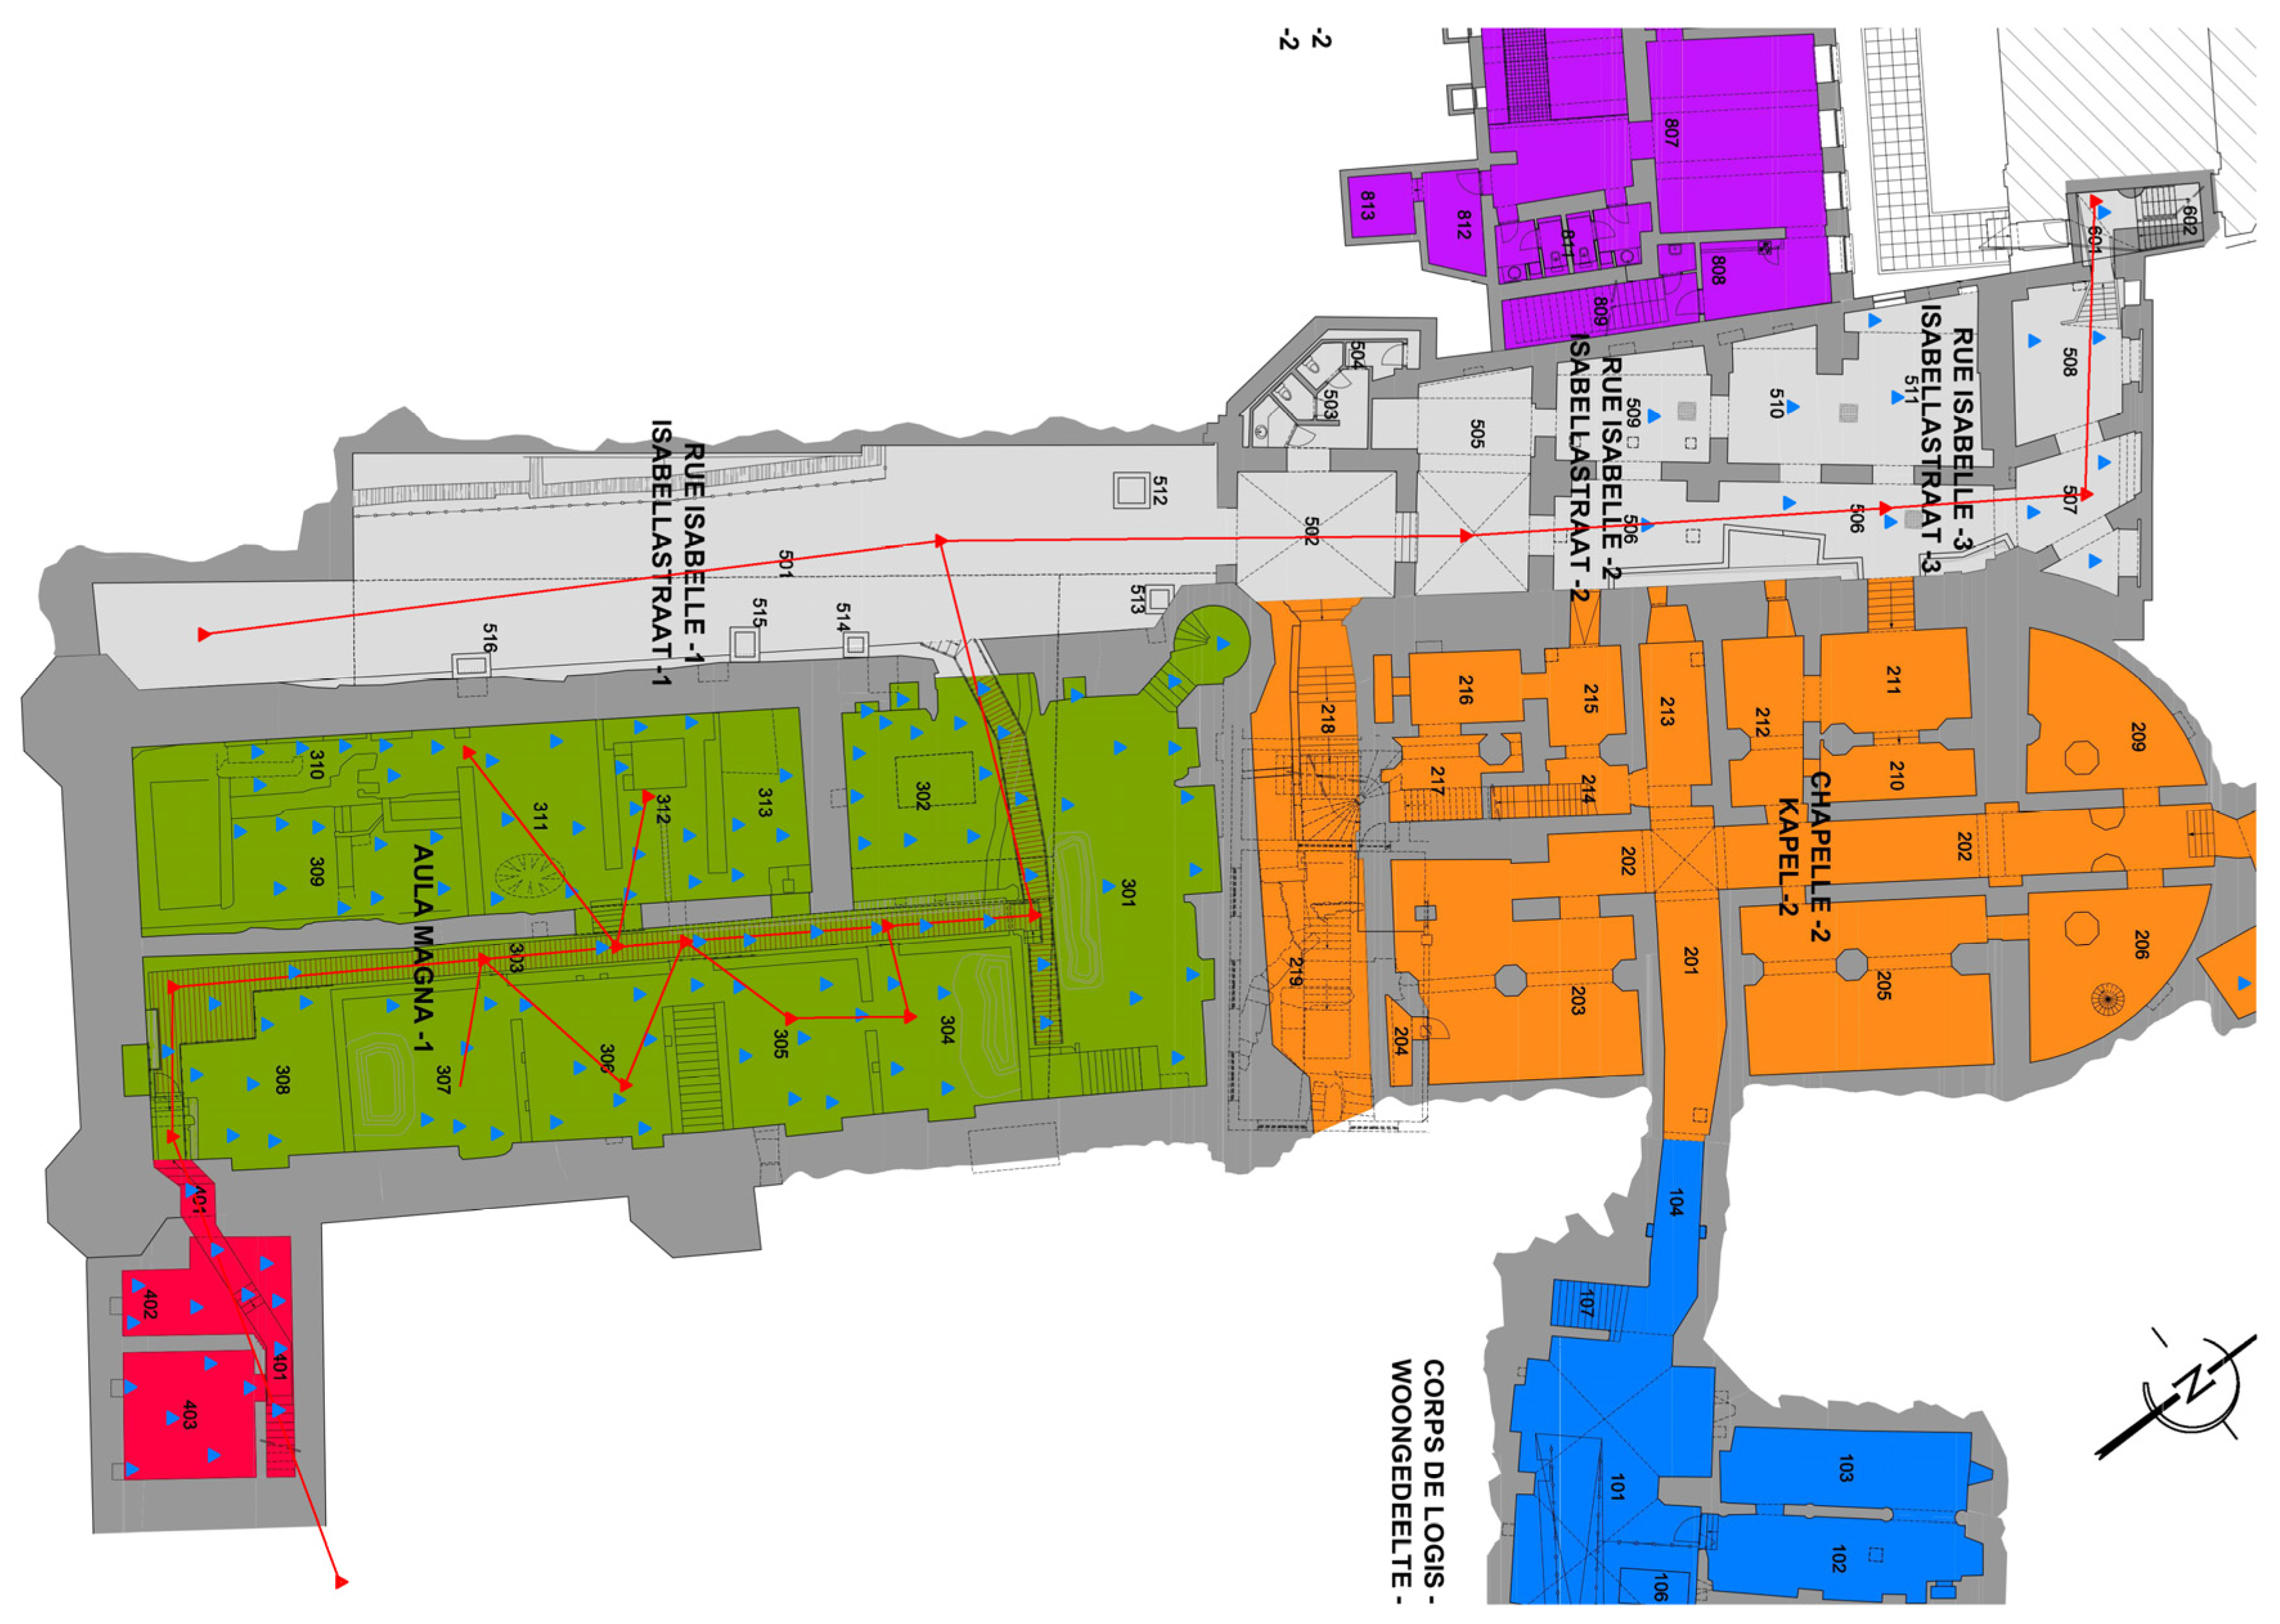
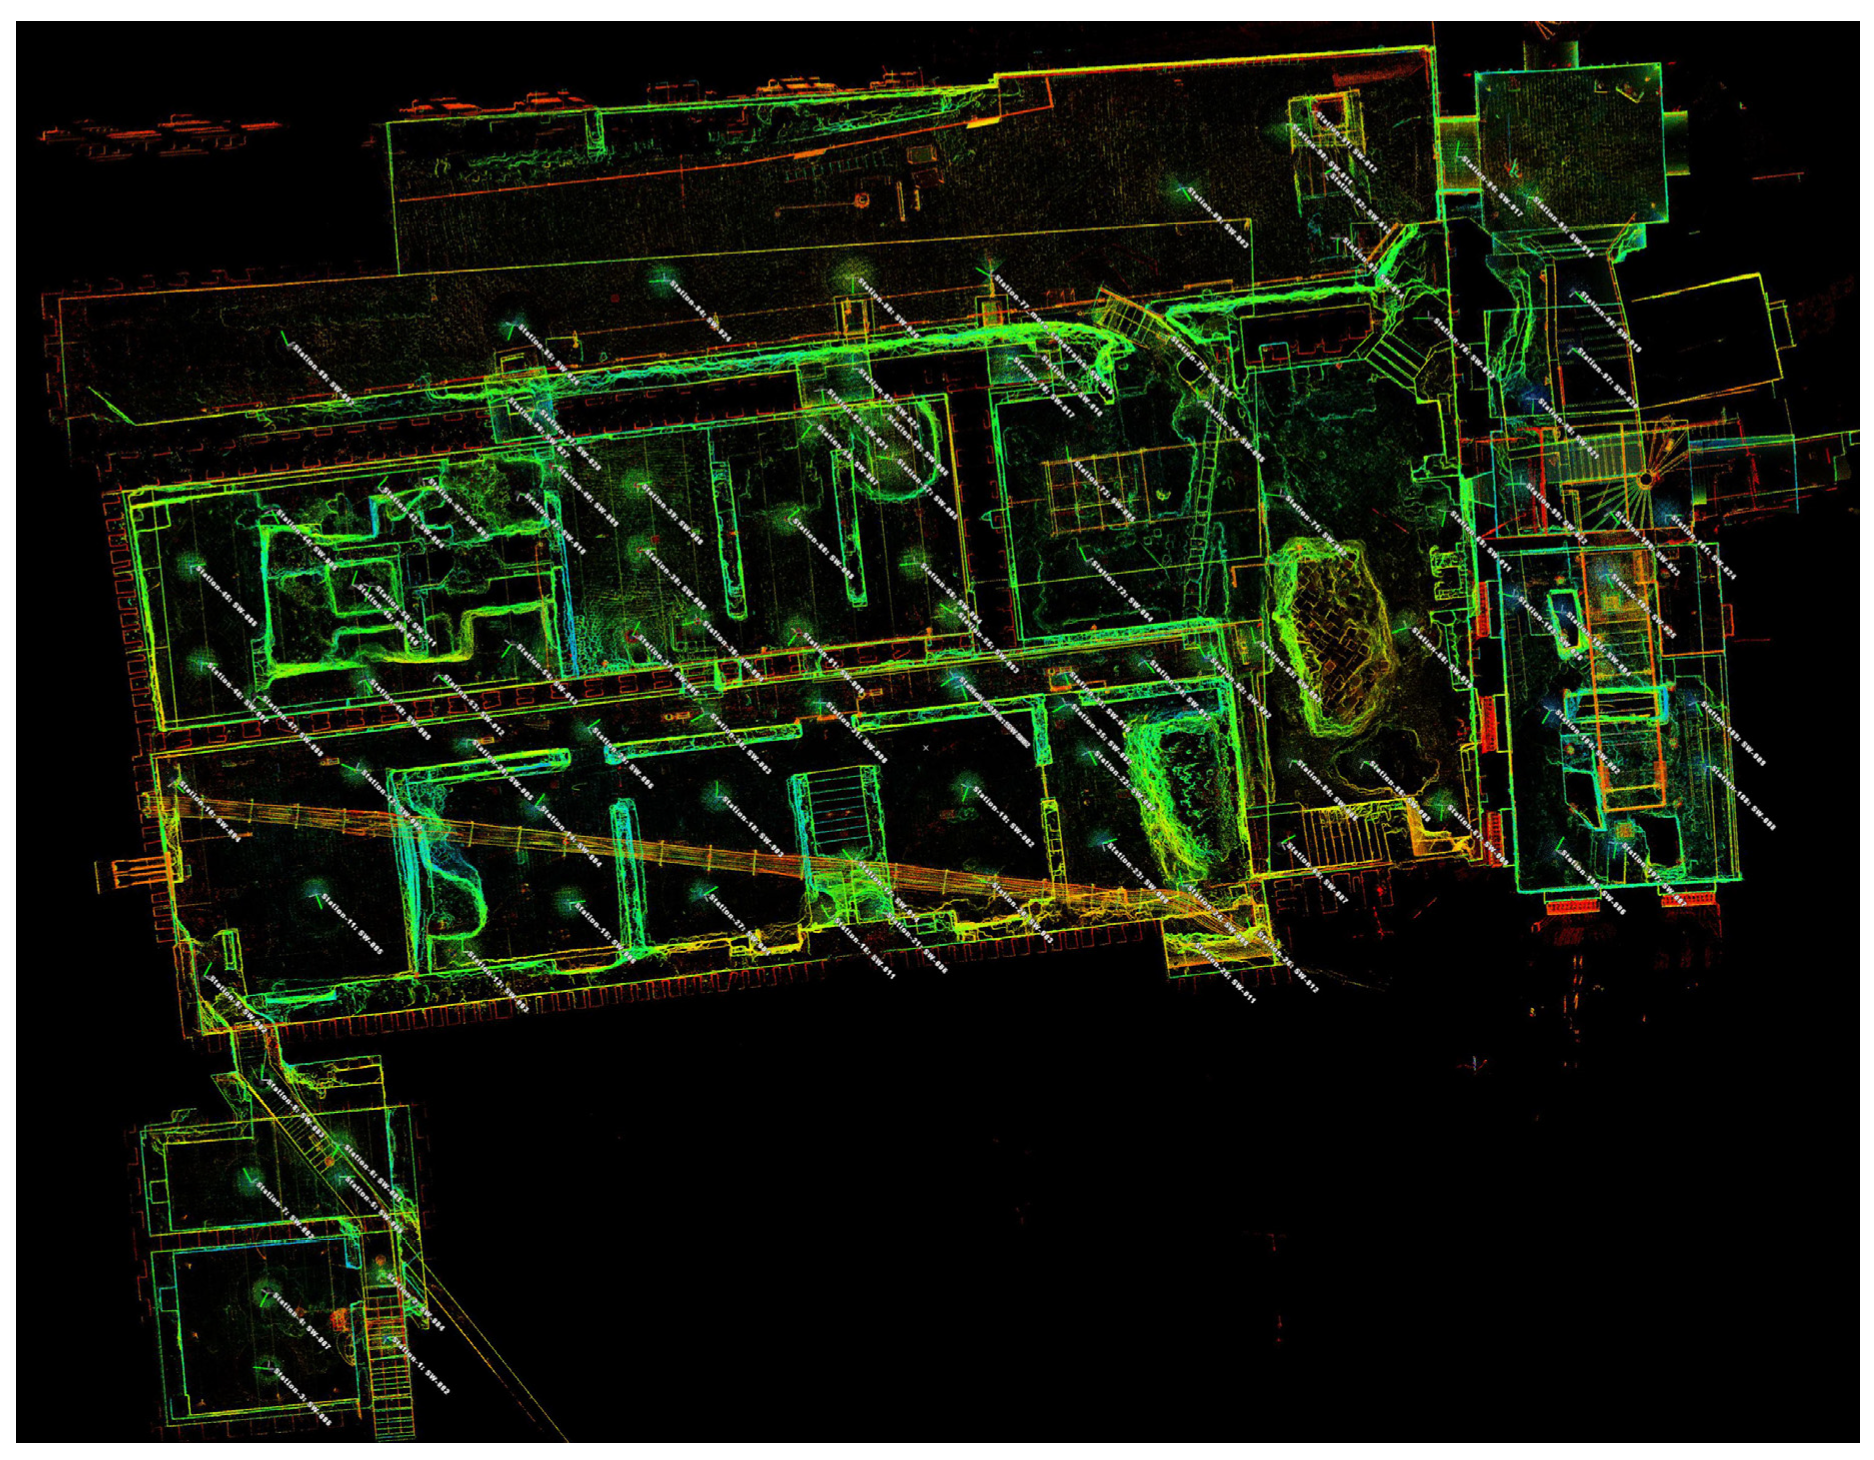
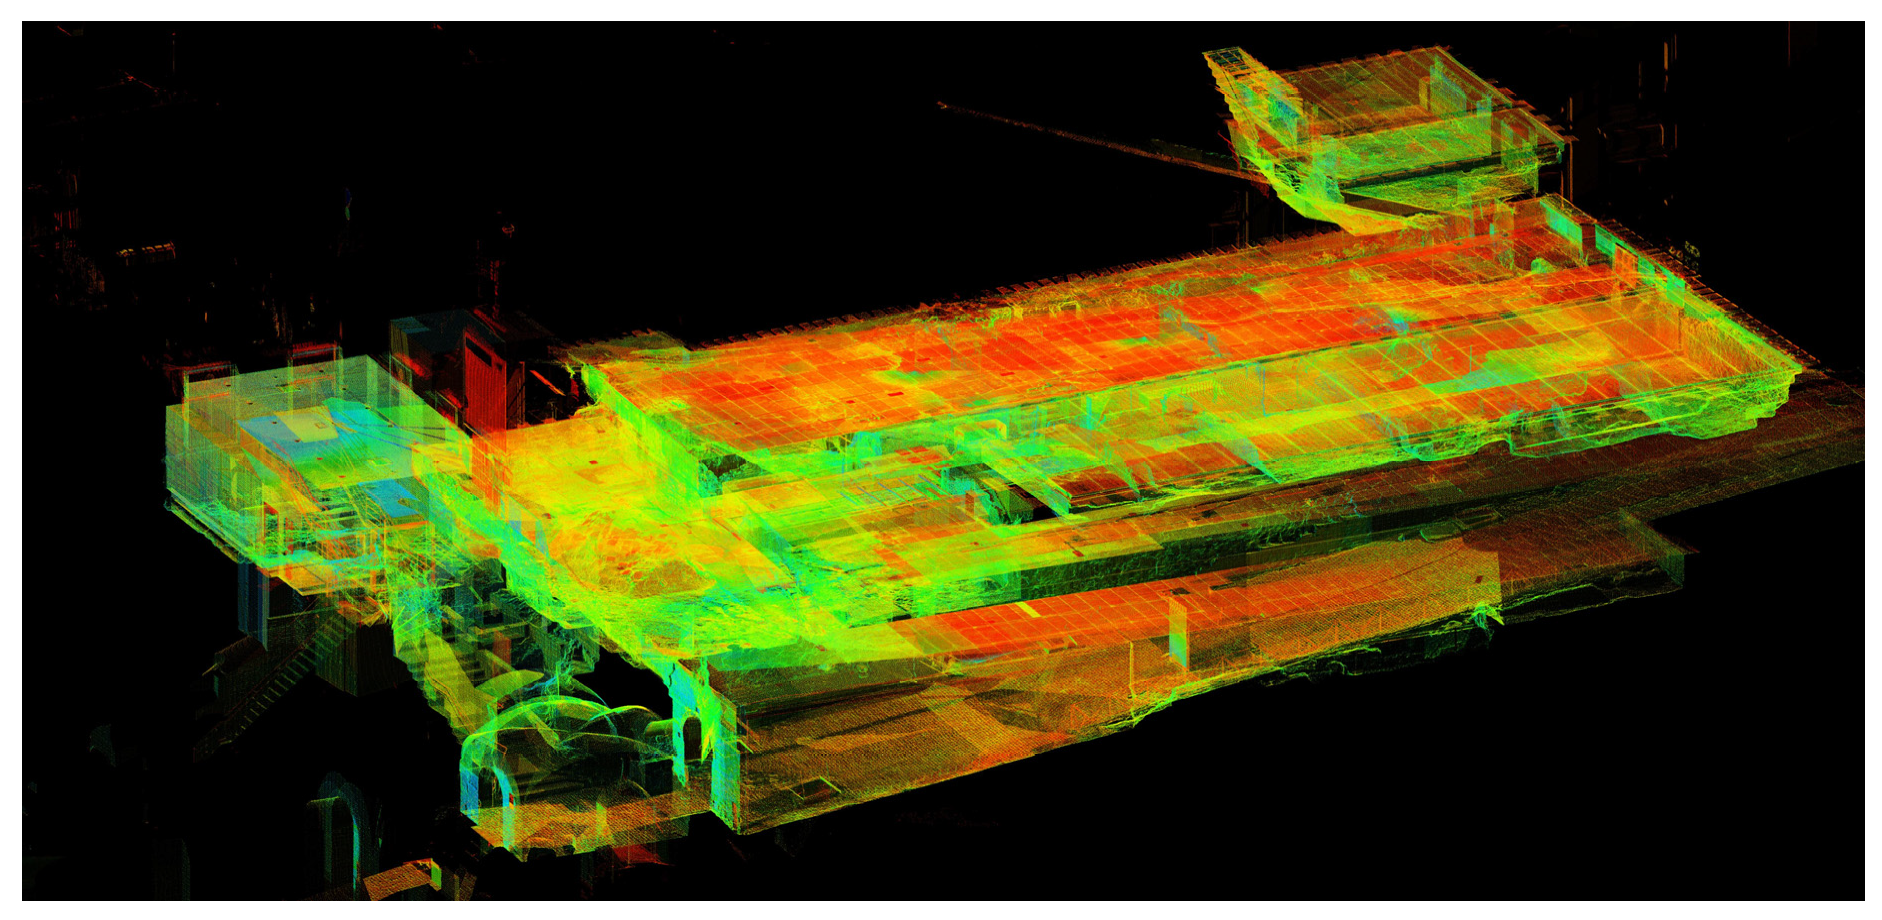
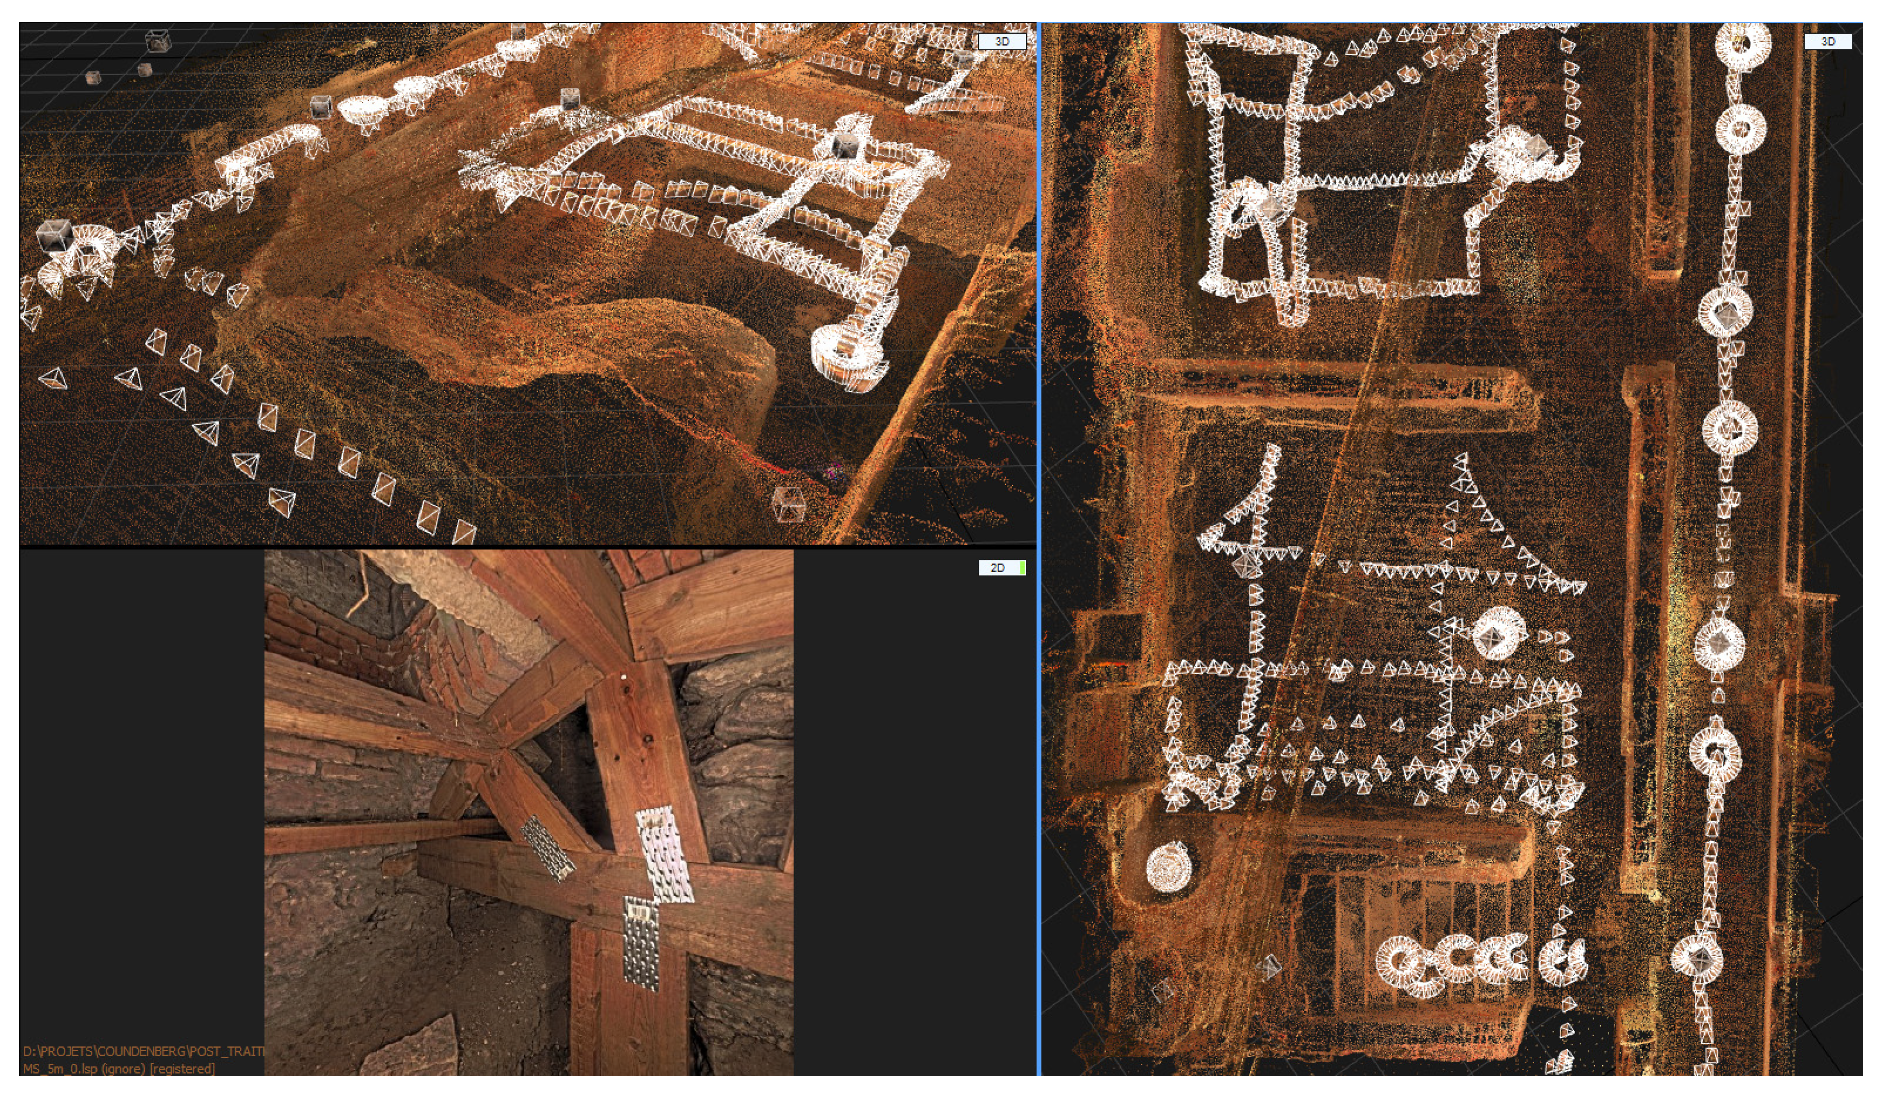
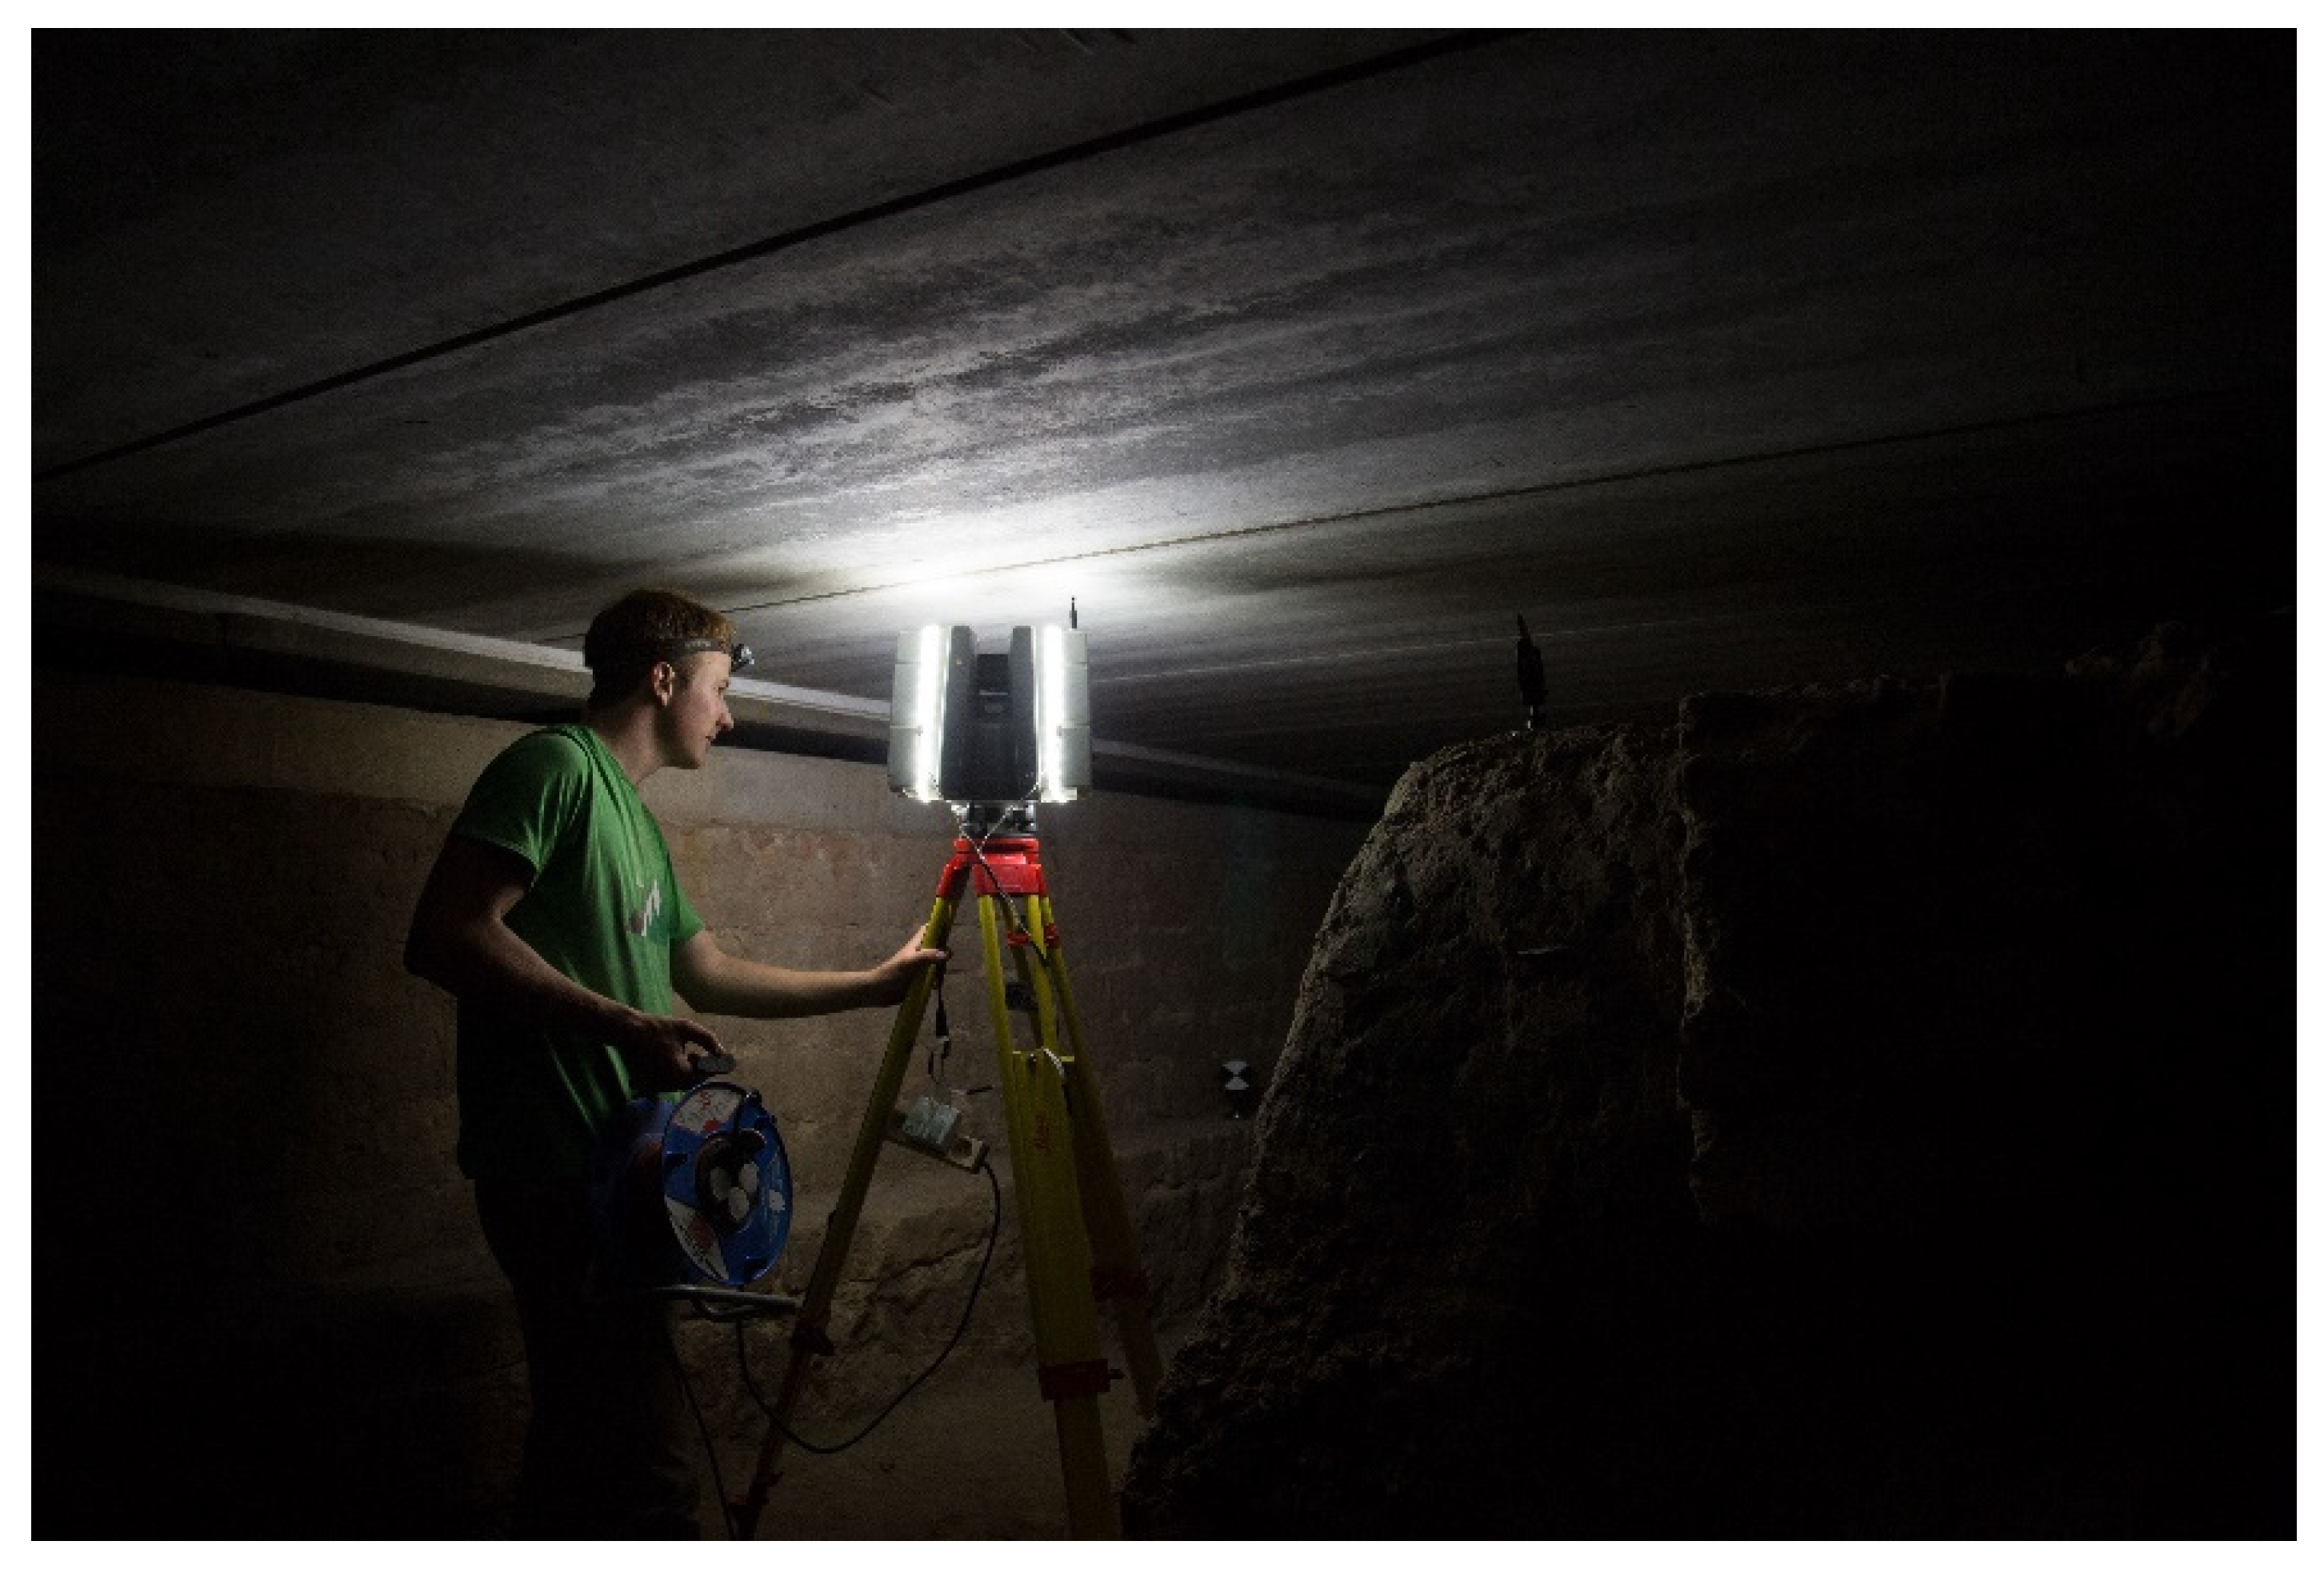
5.1. 3D Data Acquisition
- The implementation of durable reference points, accurately determined in an adapted geo-referenced system;
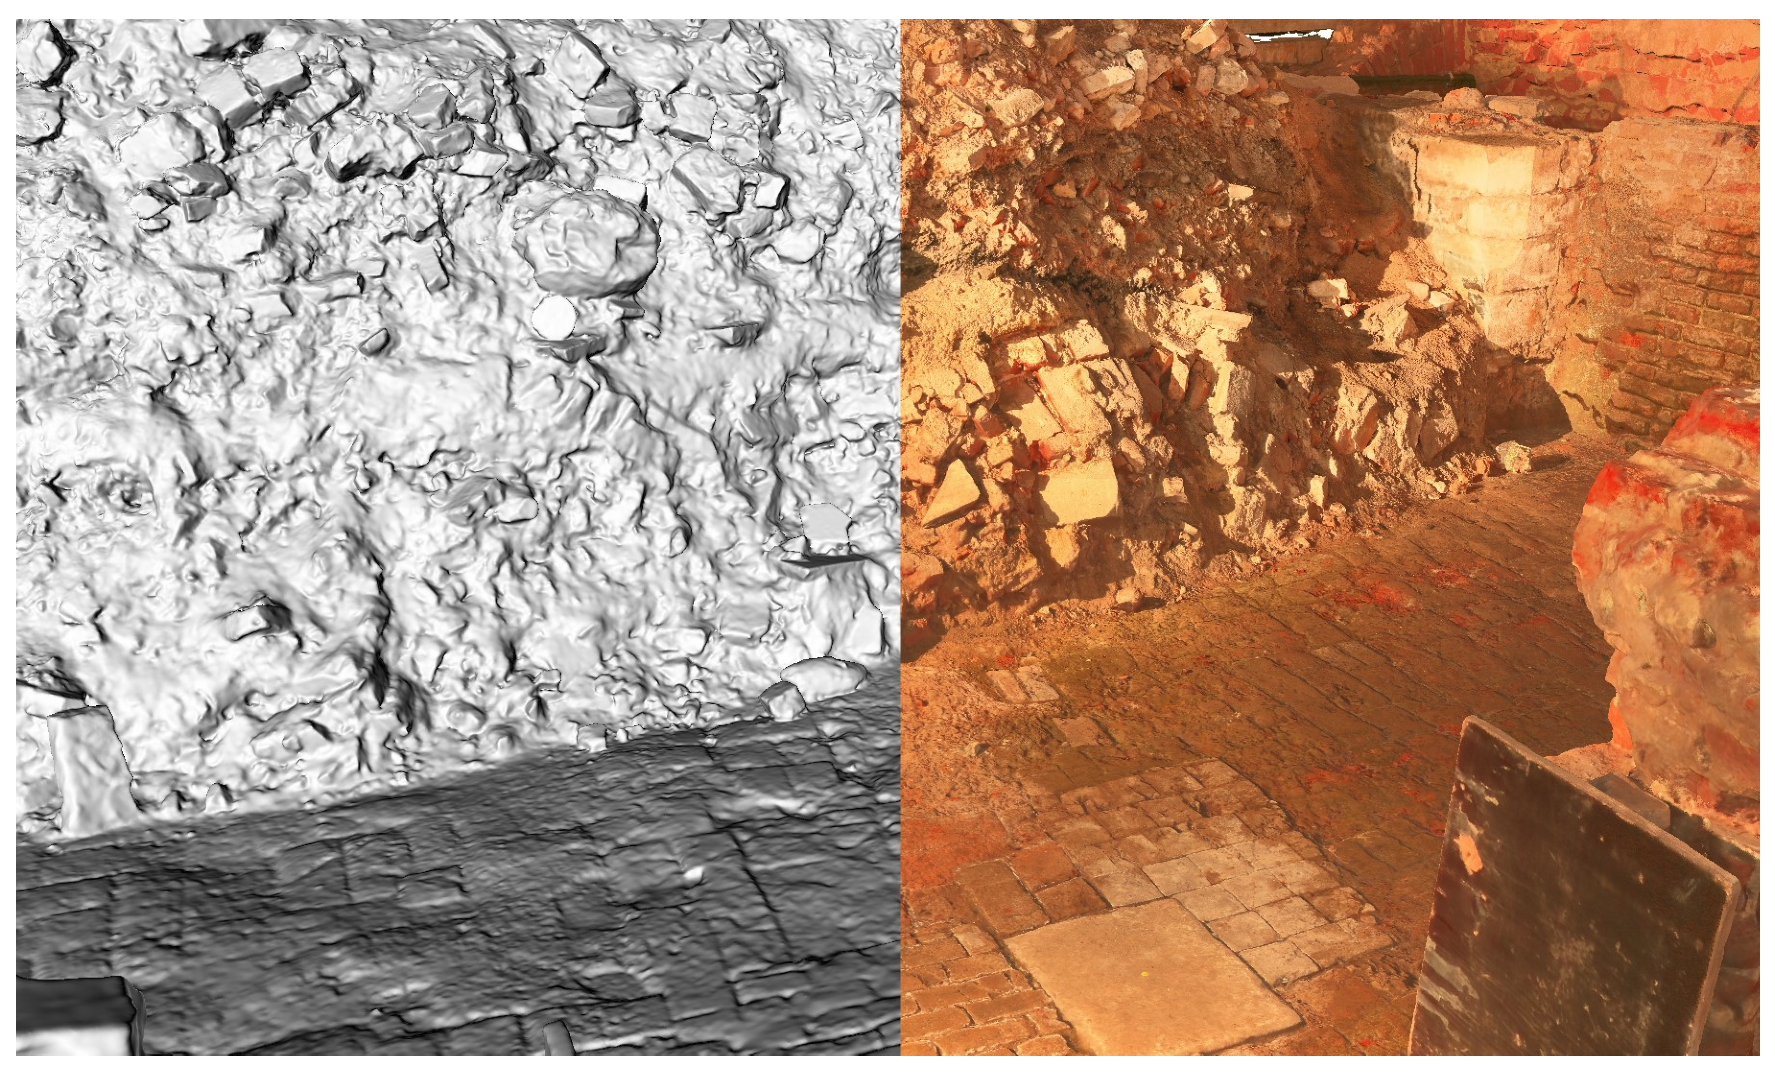
- A full photogrammetric and 3D scan survey of parts of the archaeological site linked to the reference points following the work of Poux et al. [60];
- An element-based full photogrammetric reconstruction of independent elements in a local frame of reference such as in [61].
5.2. Reference Point Materialisation
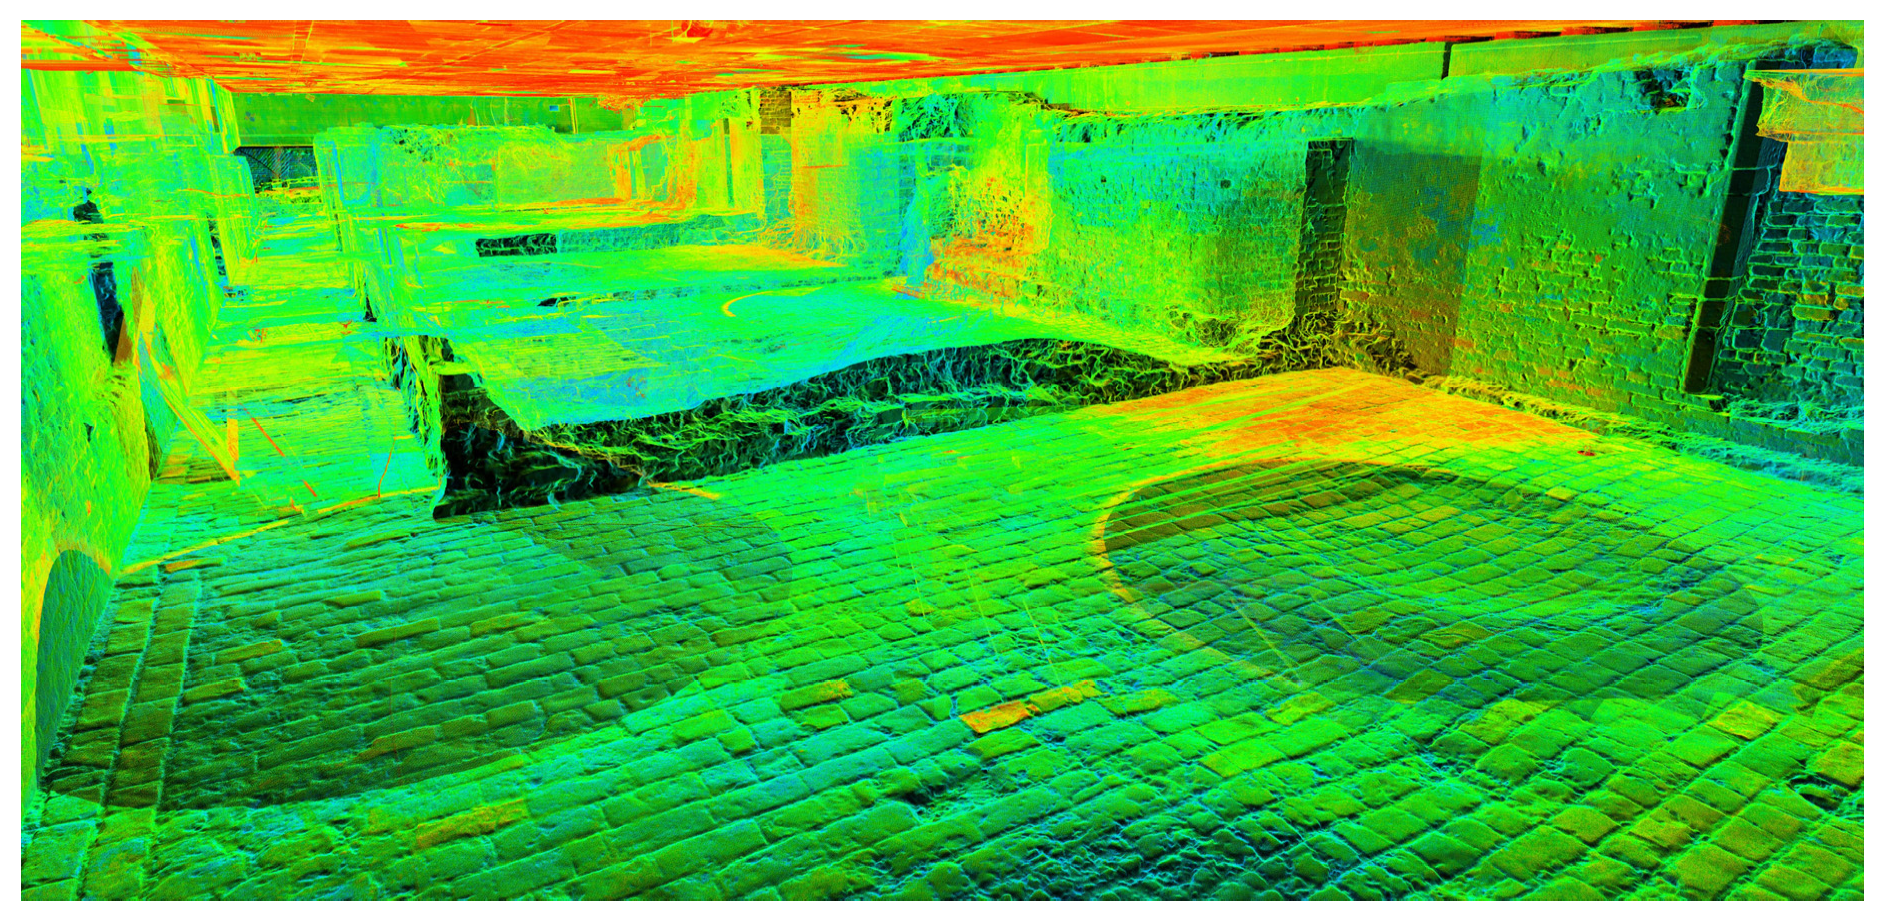
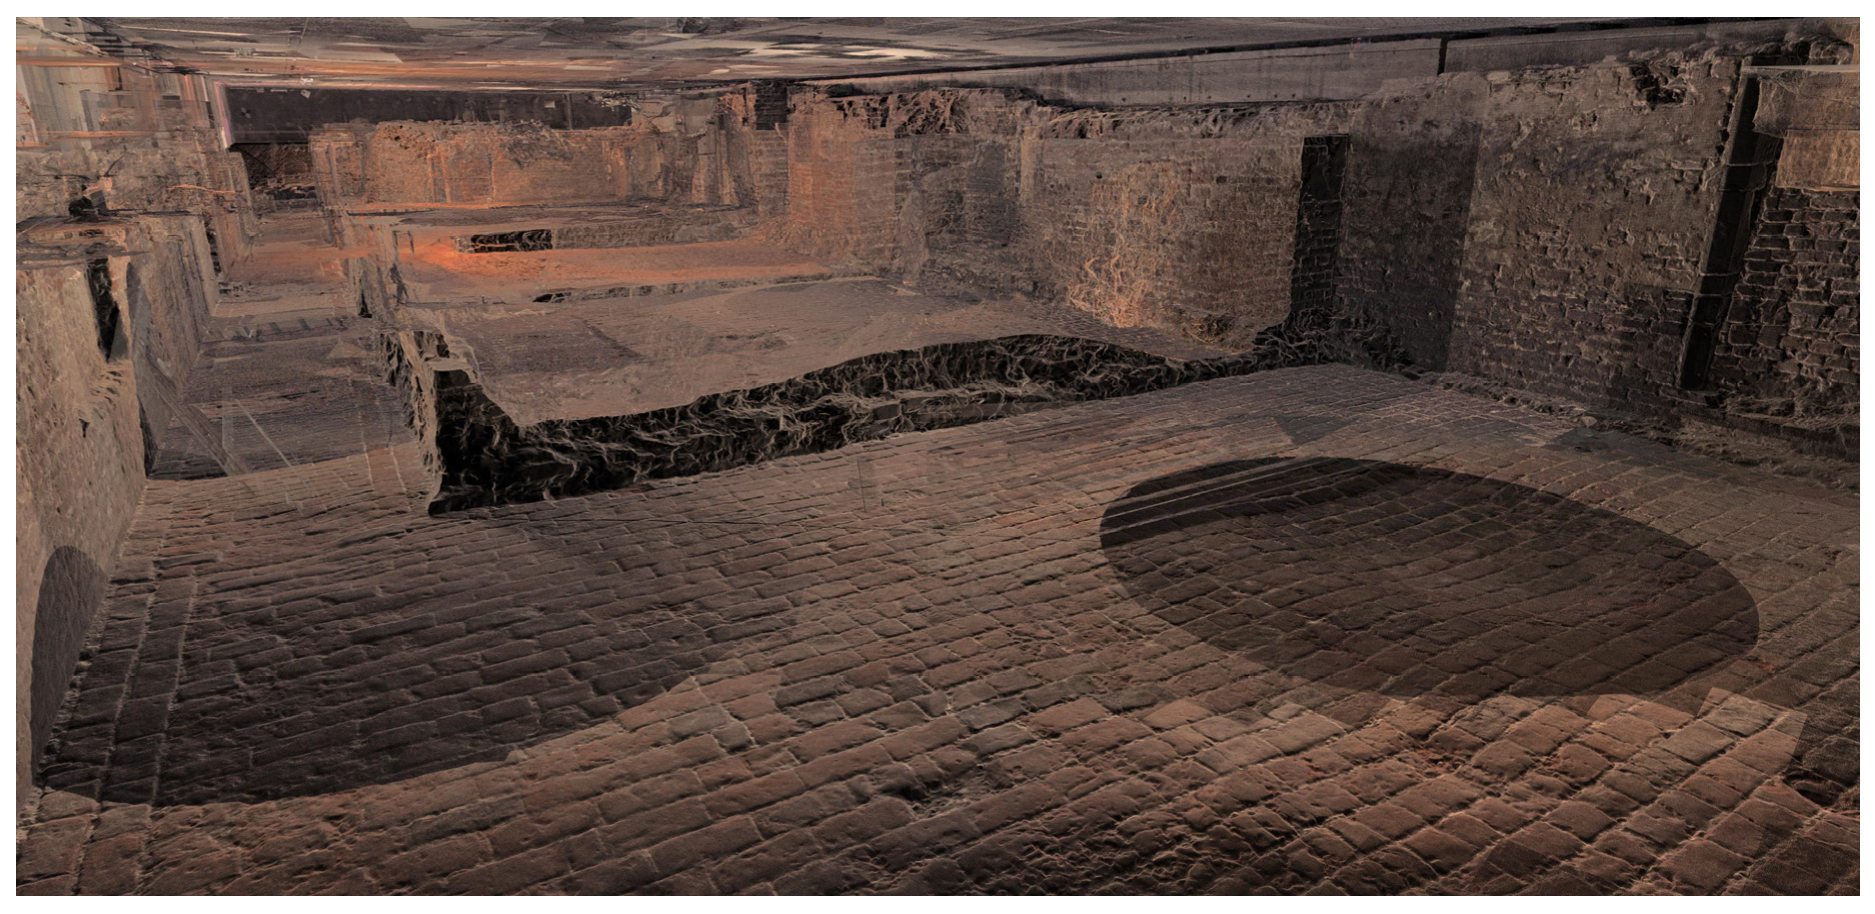
5.3. 3D Laserscanning Survey
Photogrammetry Augmentation
5.4. Implemented Information System
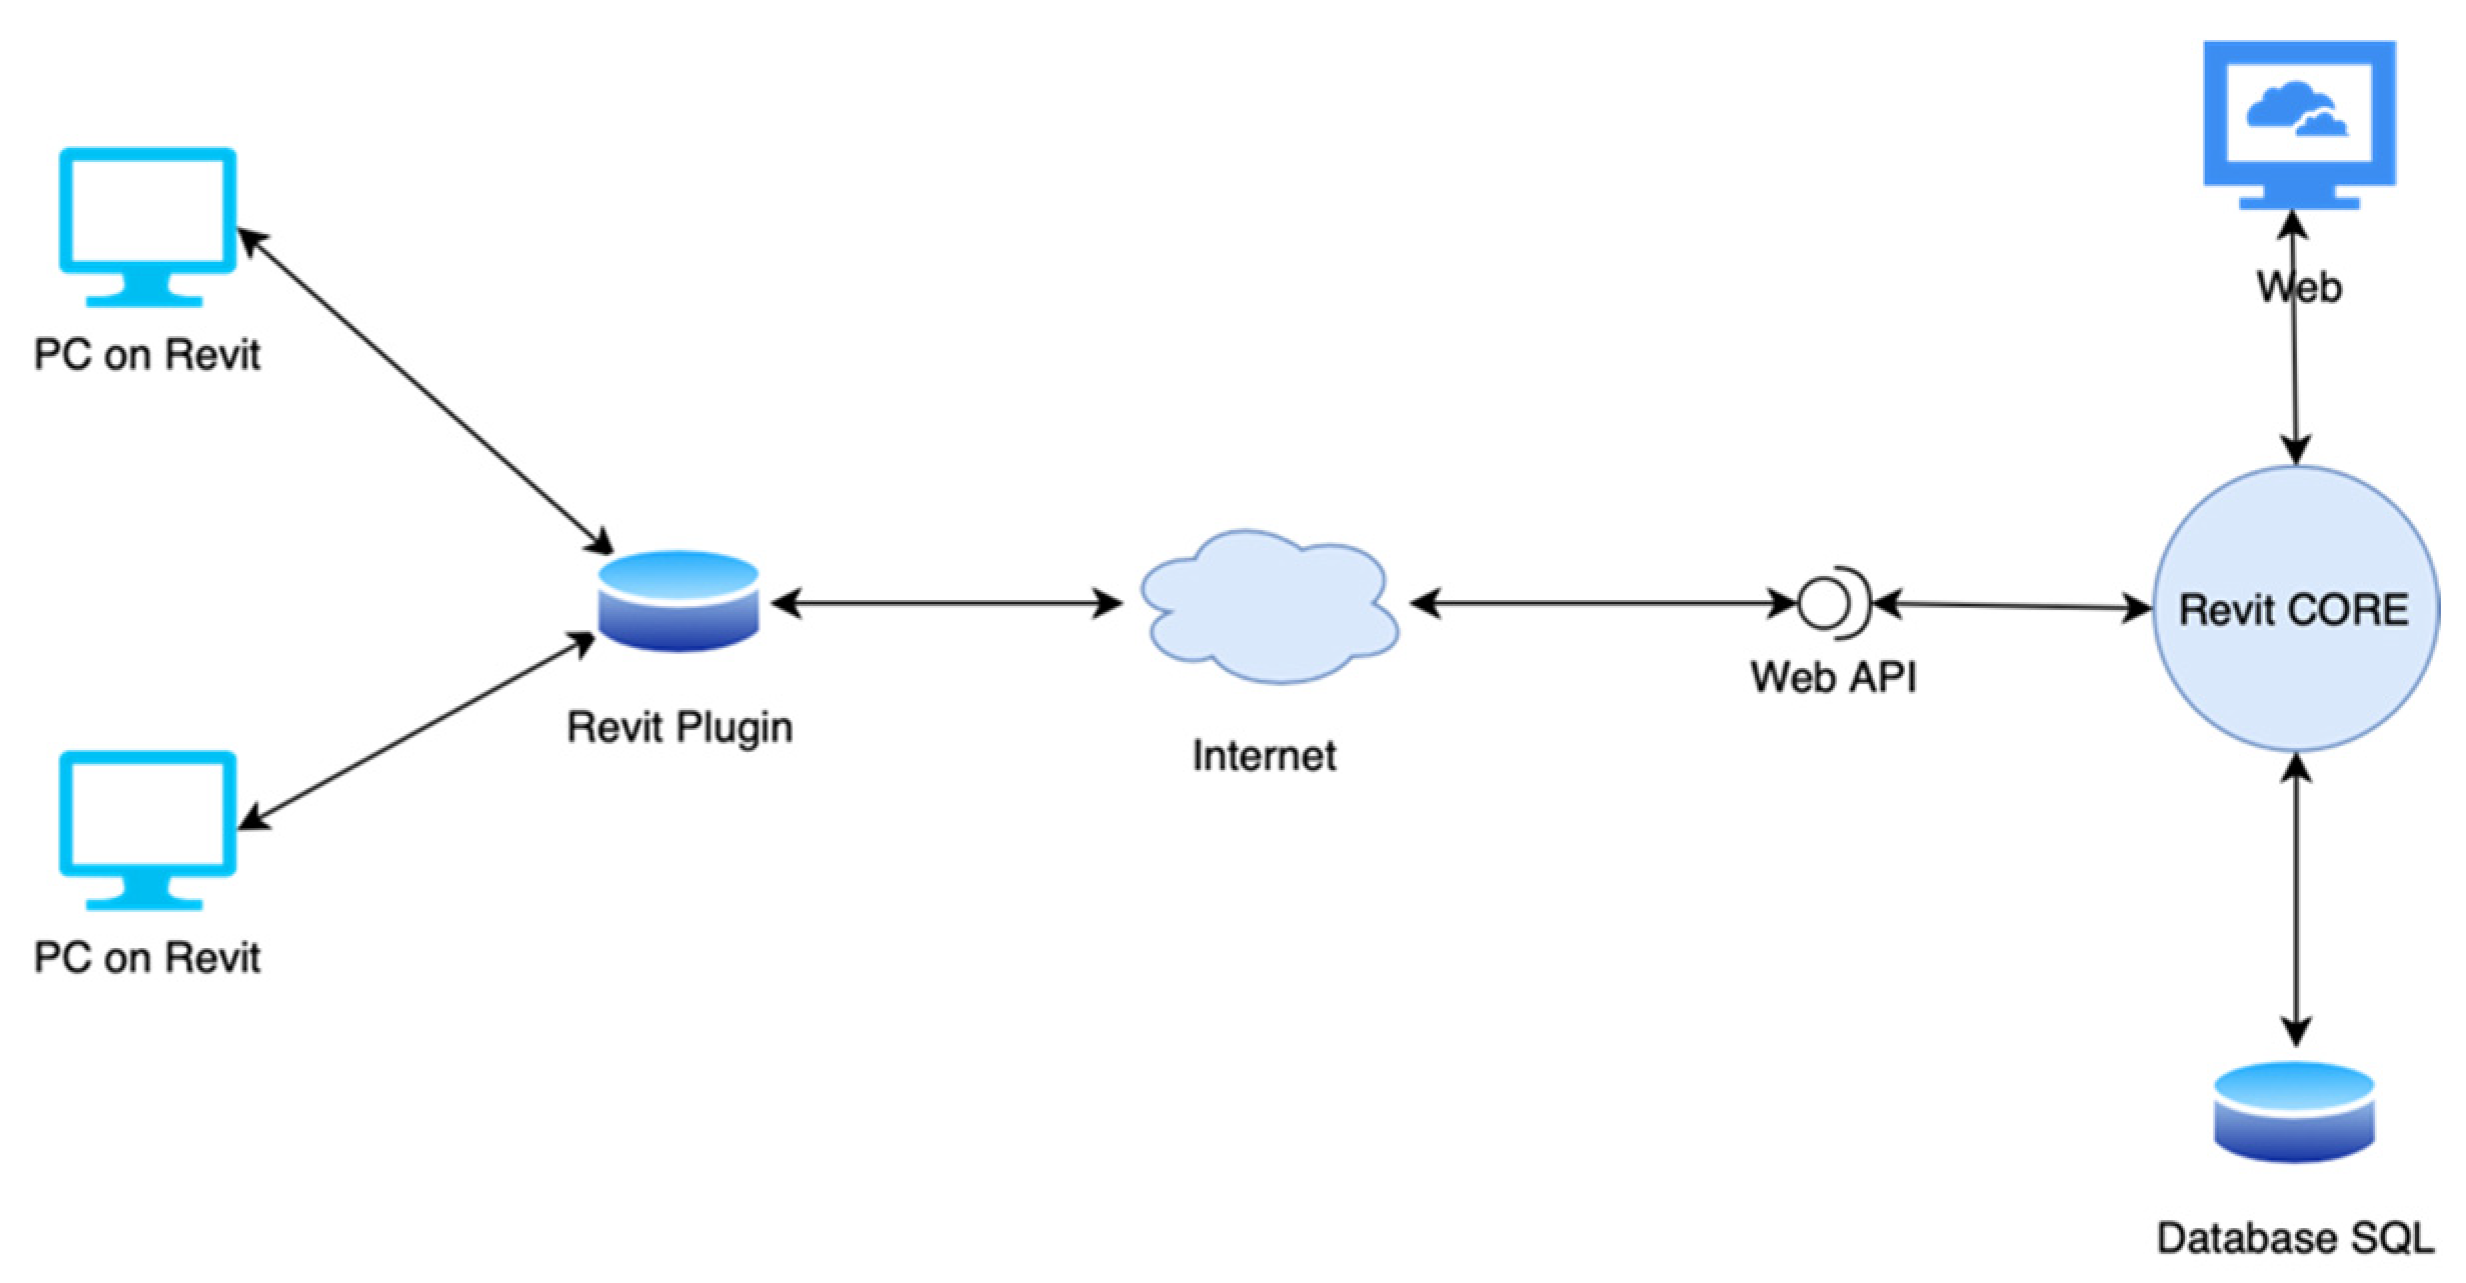
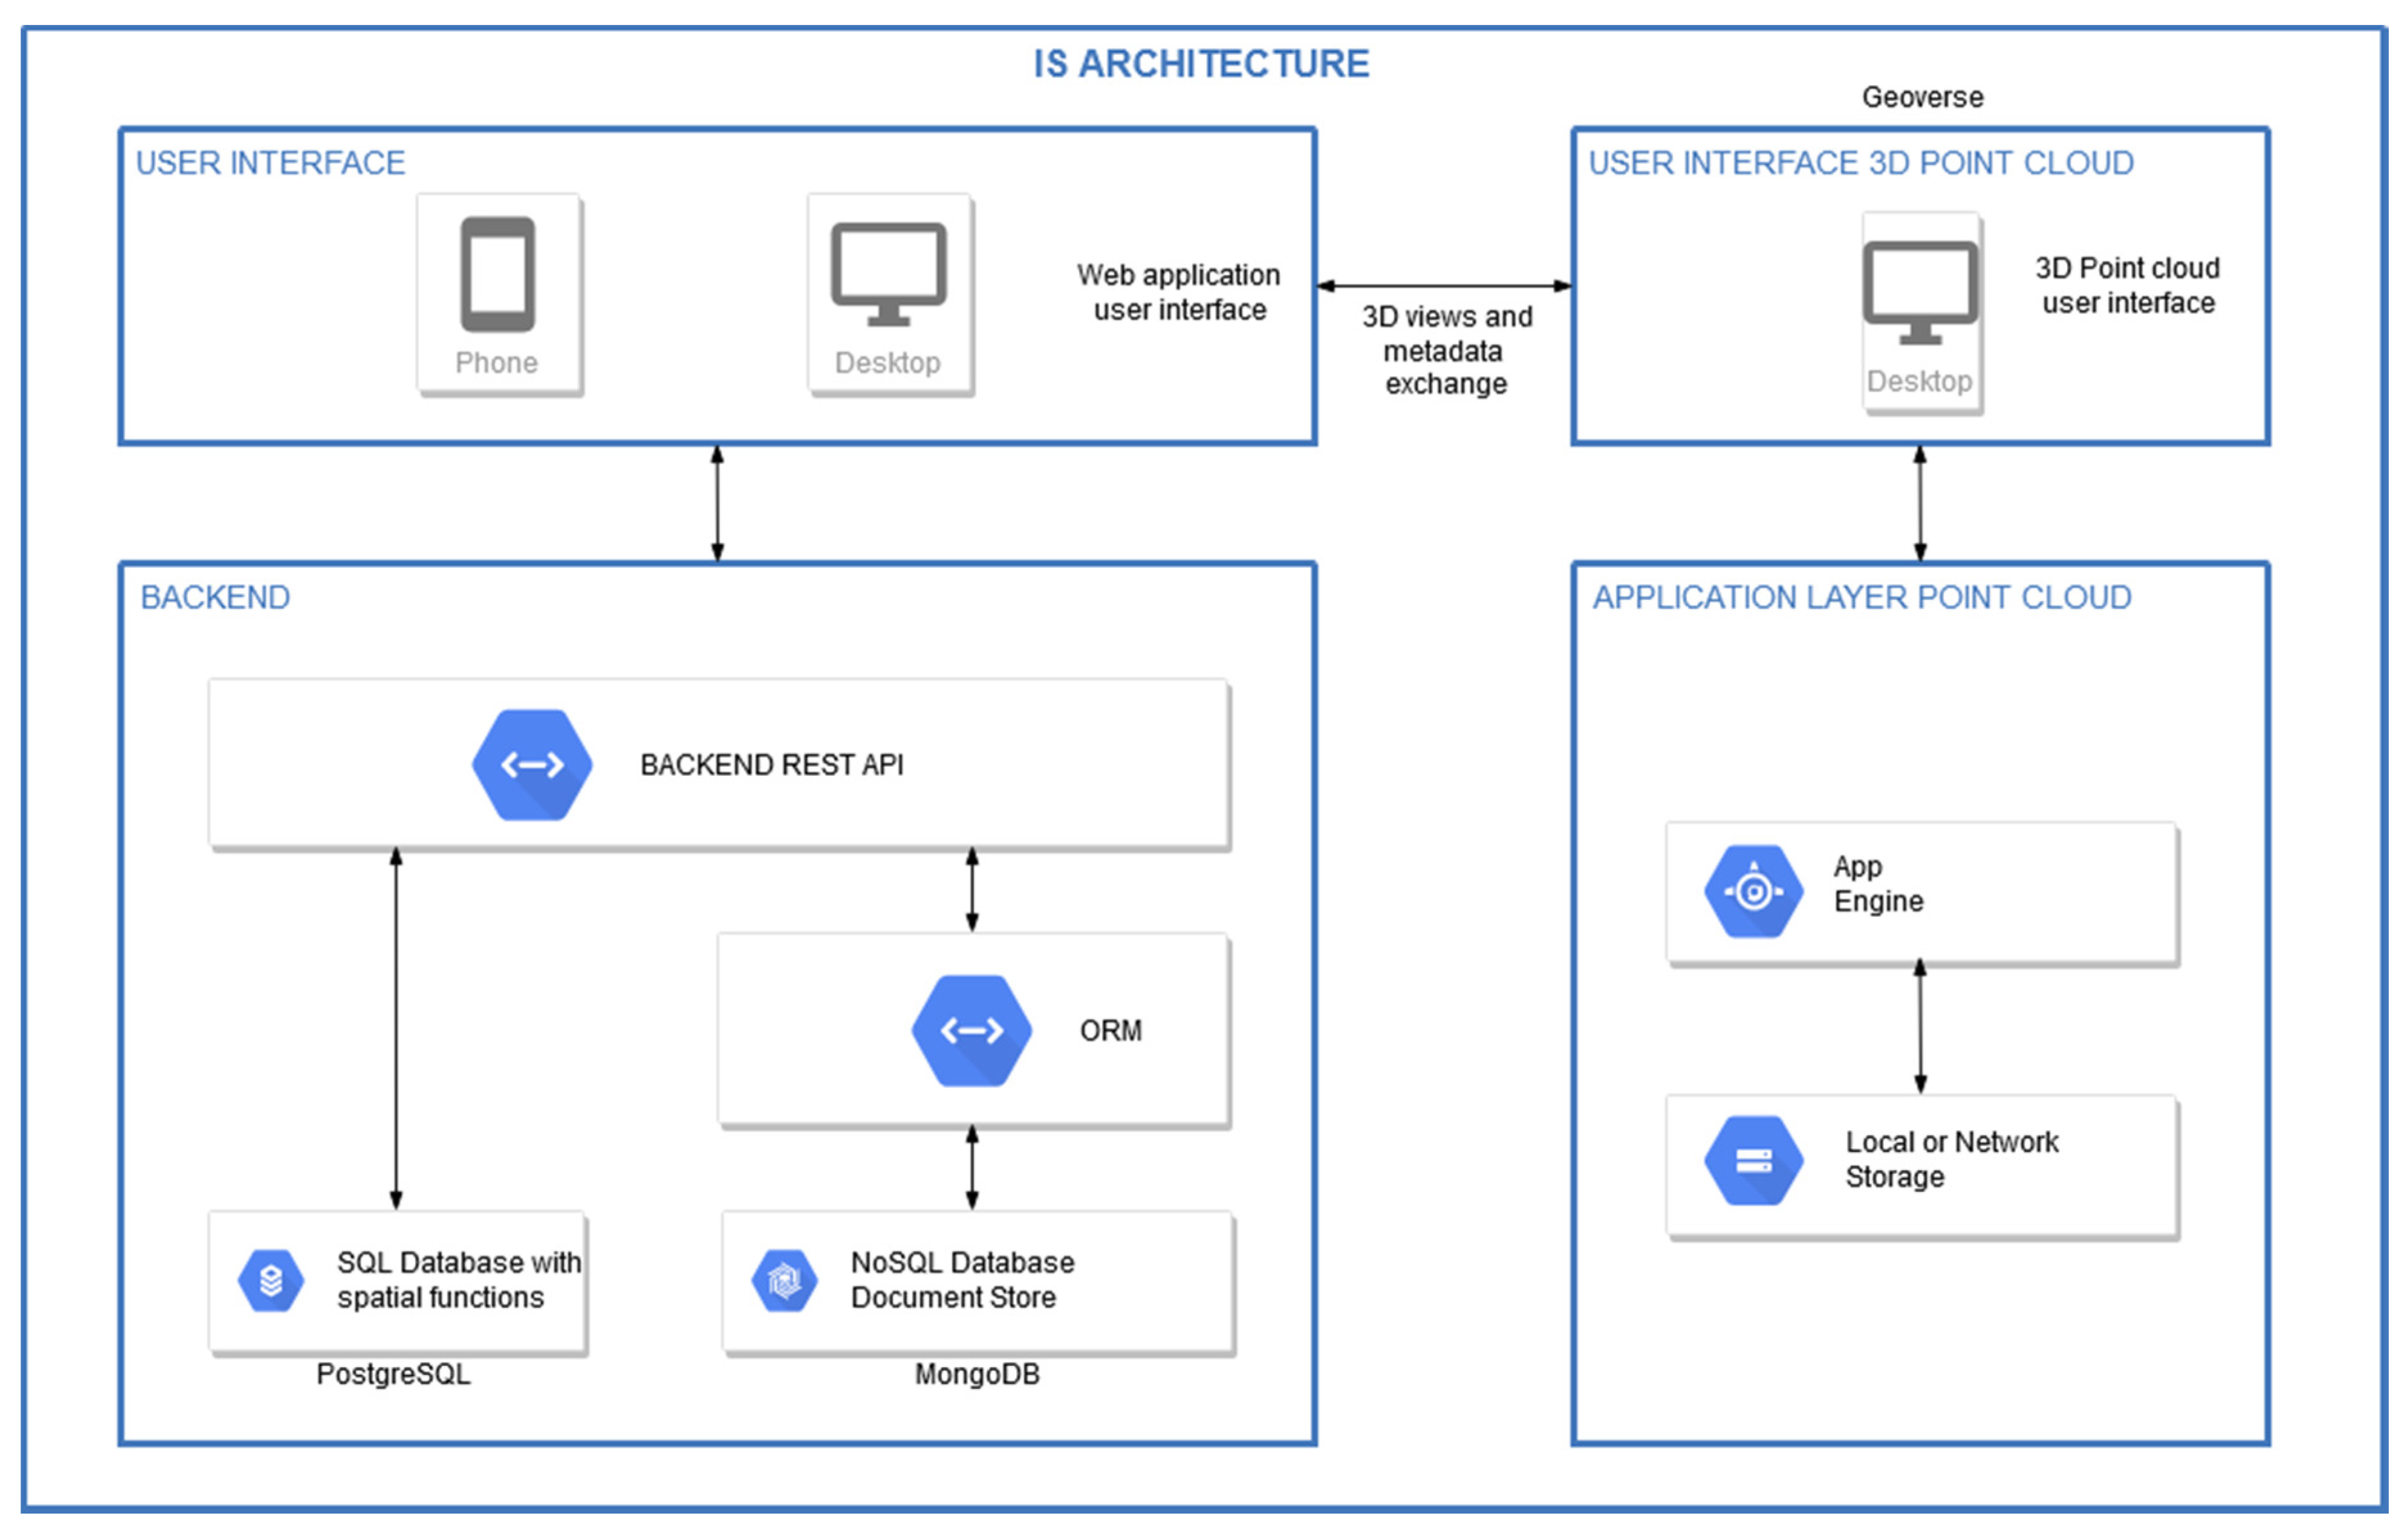
5.4.1. Implemented Architecture
5.4.2. Backend
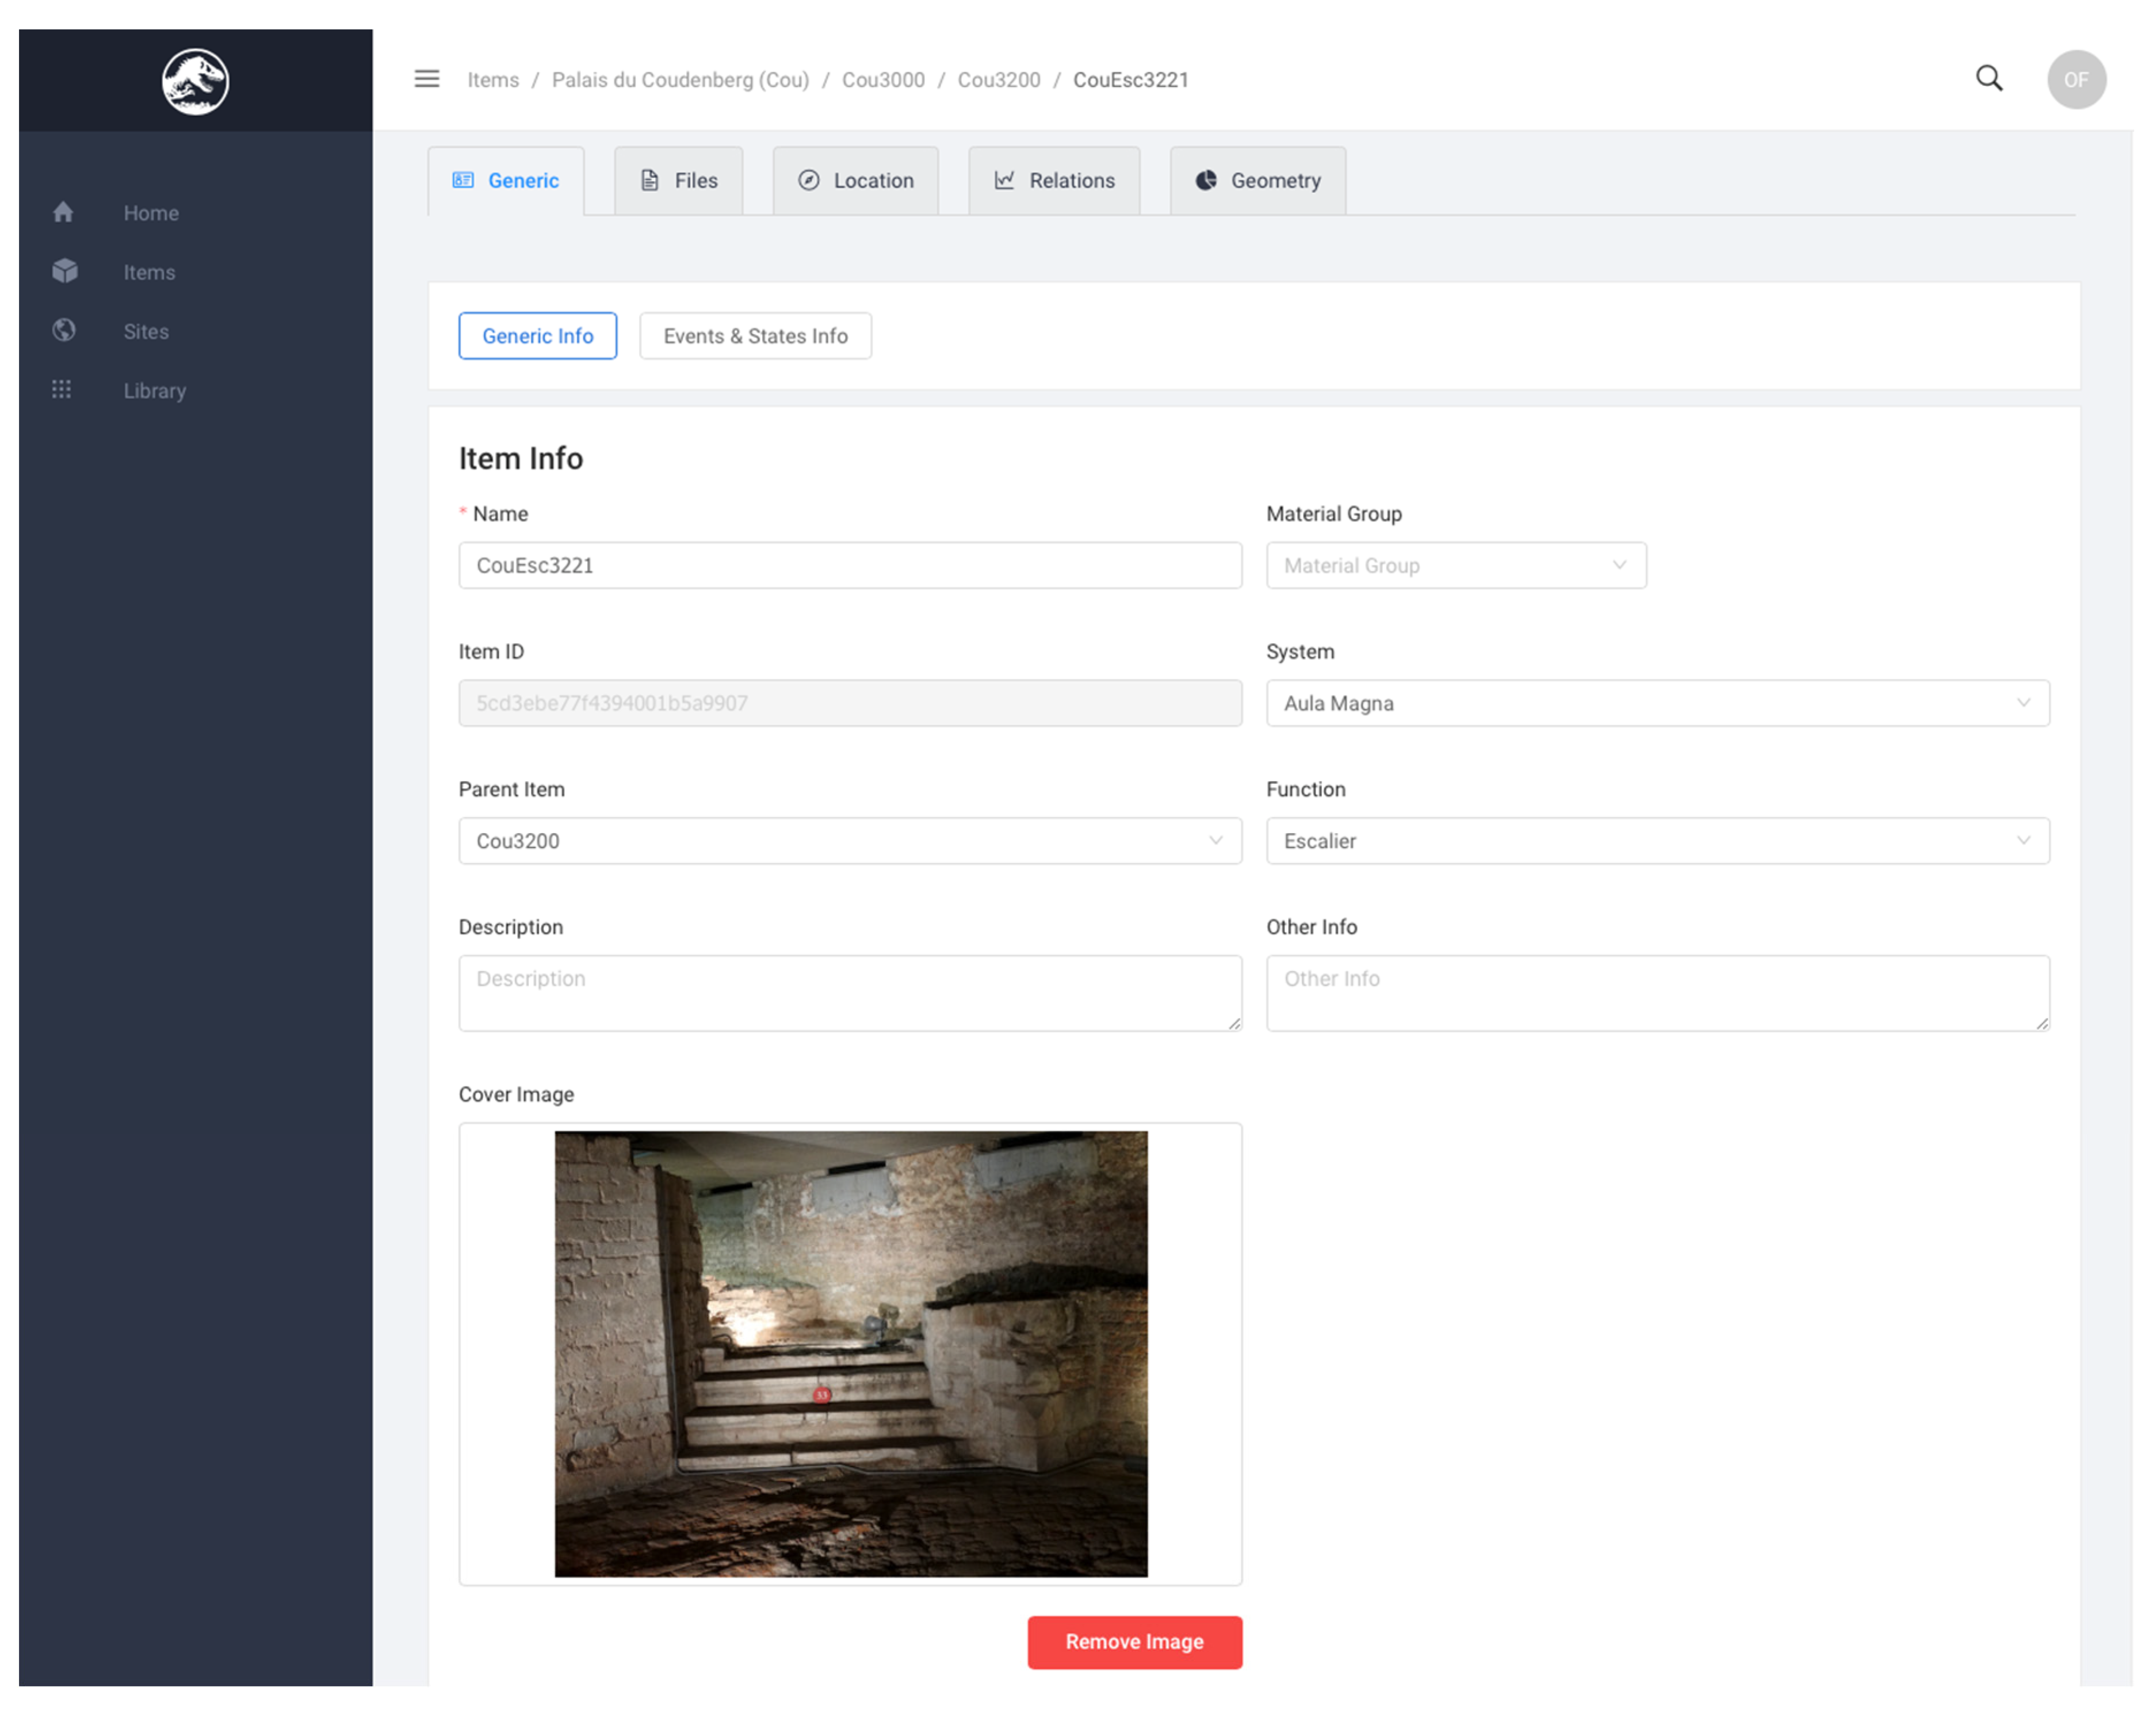
5.4.3. Frontend
- -
- From the semantic interface to create new objects (sites, elements, states or events);
- -
- From the semantic interface to add or modify semantic attributes (numbers, text, dates but also external files like plans, pictures, etc.);
- -
- From the spatial interface to create locations and shapes (geometries) through a digitalisation procedure based on the point cloud.
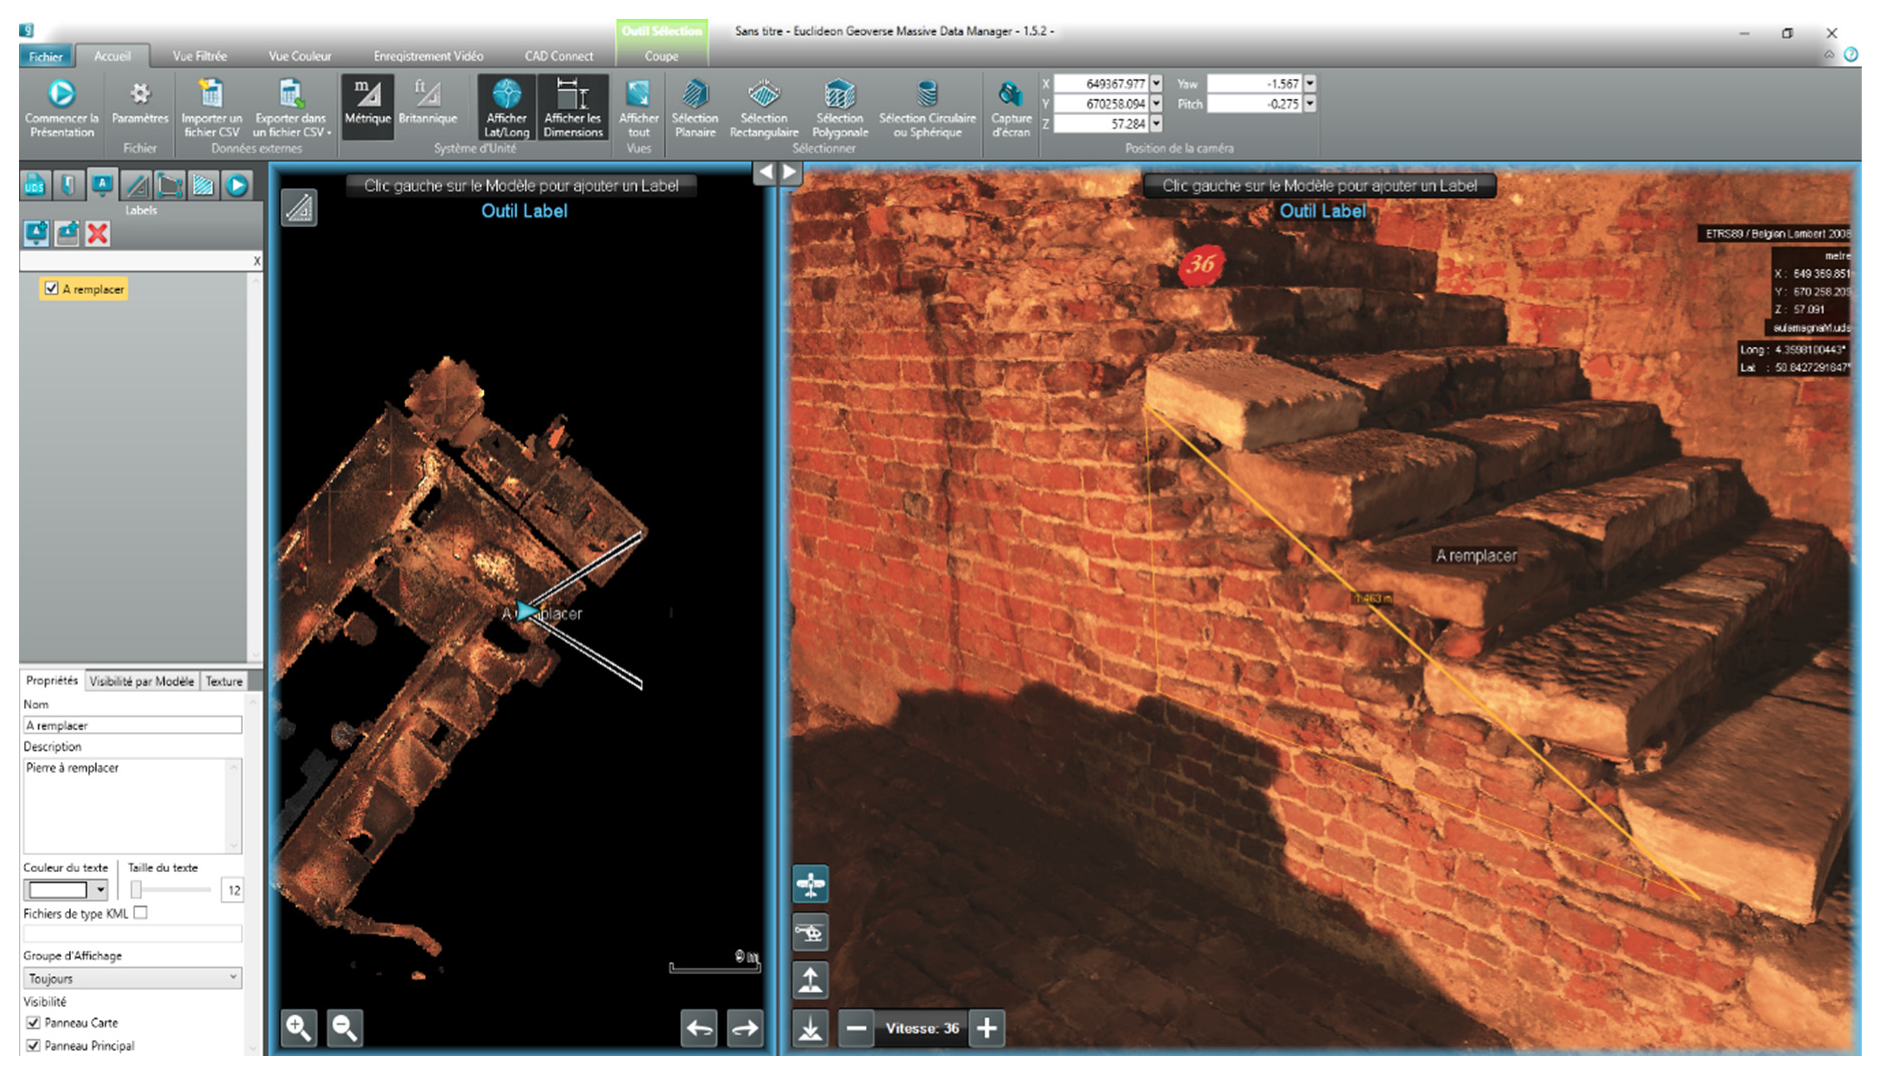
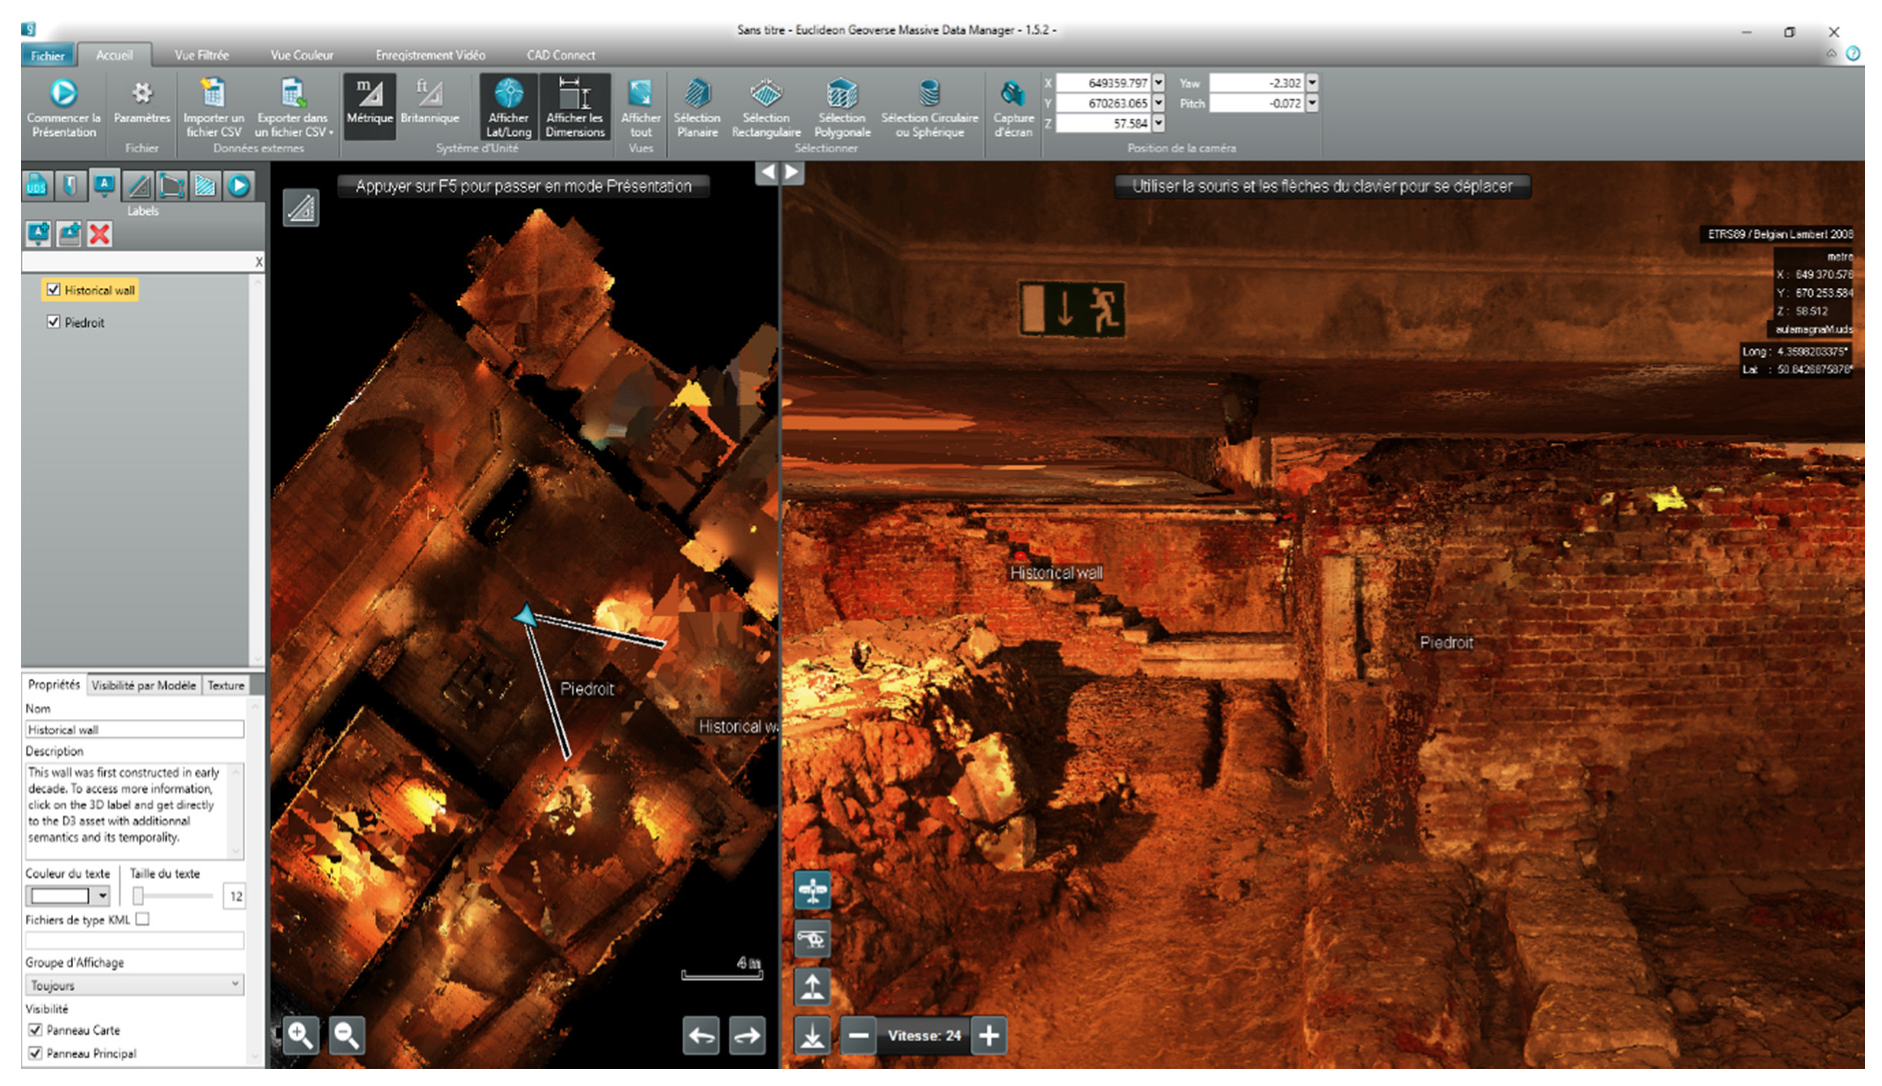
5.4.4. Point Cloud Interface
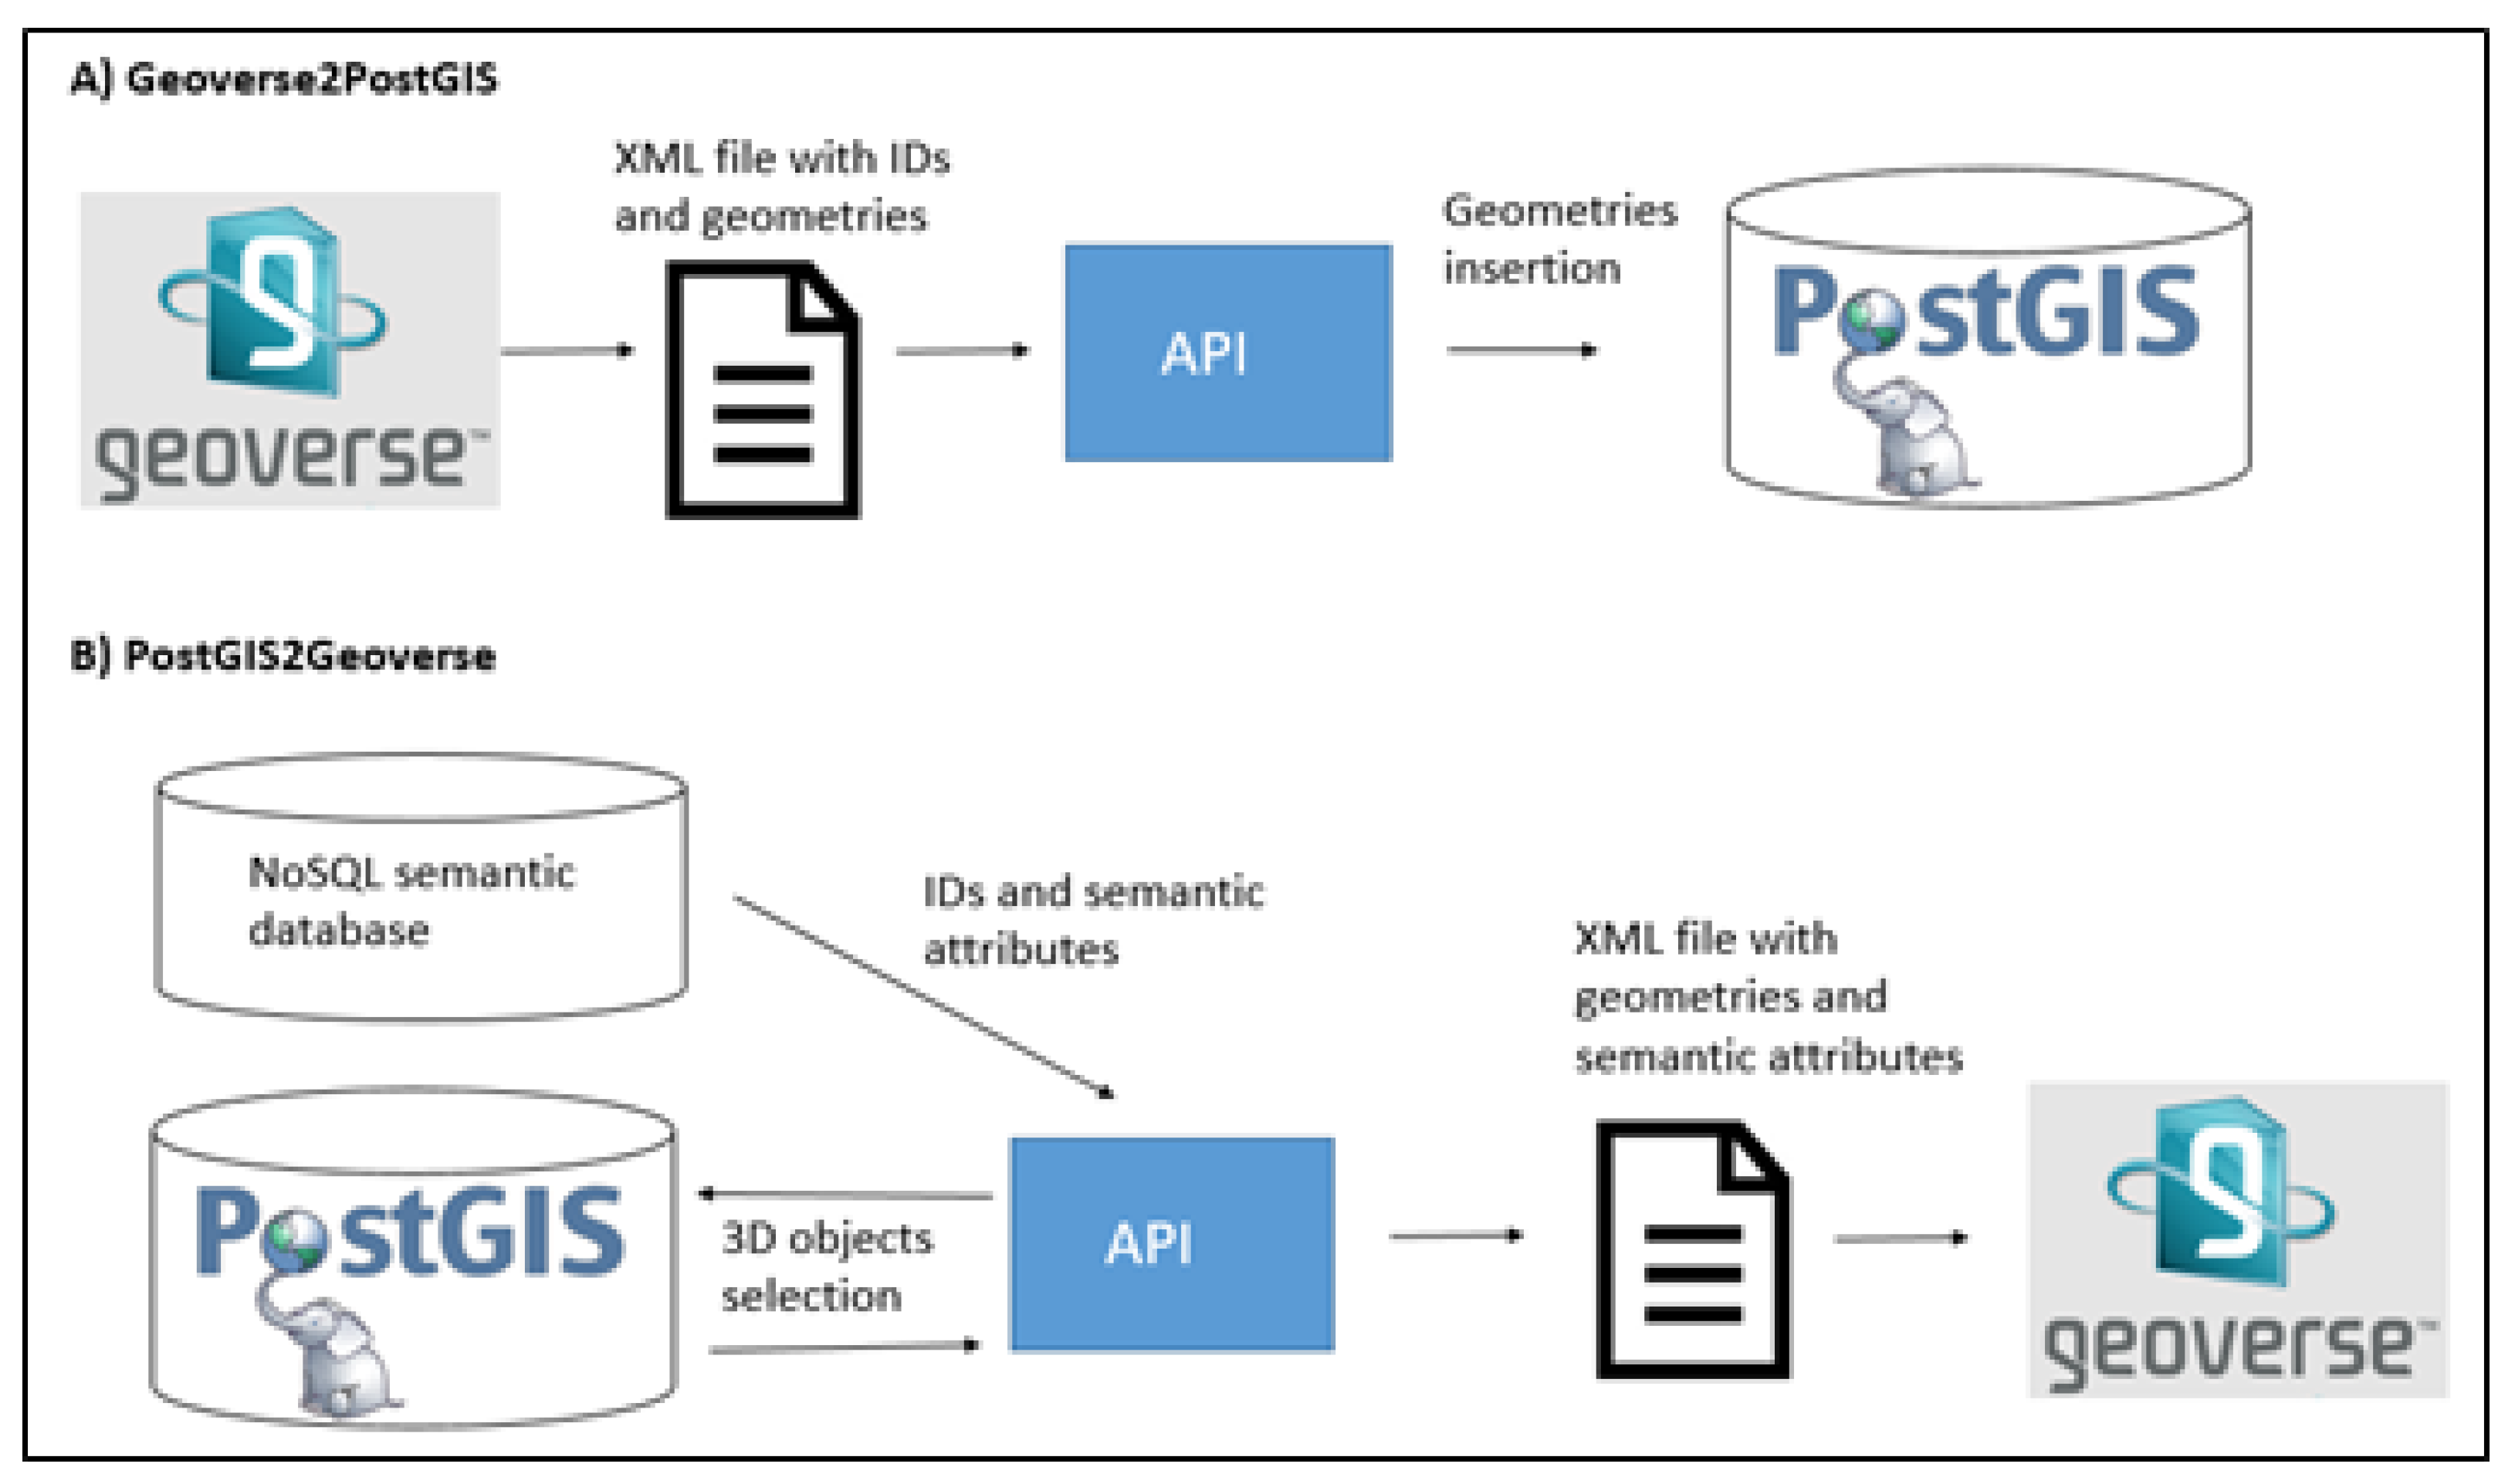
5.4.5. Two Ways Interactions between HIS and Point Cloud
- Geoverse2PostGIS: digitised geometries in Geoverse (including ID, 3D geometries and spatial metadata like coordinates reference system) are sent to PostGIS for their storage.
- PostGIS2Geoverse: based on a user’s query, the API returns 3D geographic objects with semantic attributes readable by Geoverse. 3D geometries come from PostGIS, and semantic attributes come from the NoSQL semantic database (based on common ID between the two databases).
5.5. Usability Evaluation Report
6. Takeaways & Research Perspectives
7. Conclusions
Author Contributions
Funding
Acknowledgments
Conflicts of Interest
References
- Kelly, G.; Serginson, M.; Lockley, S.; Dawood, N.; Kassem, M. Bim for Facility Management: A Review and a Case Study Investigating the Value and Challenges. In Proceedings of the 13th International Conference on Construction Applications of Virtual Reality, London, UK, 30–31 October 2013. [Google Scholar]
- Charlesraj, V.P.C. Knowledge-Based Building Information Modeling (K-BIM) for Facilities Management. In Proceedings of the 31st International Symposium on Automation and Robotics in Construction and Mining (ISARC), Sydney, Australia, 9–11 July 2014. [Google Scholar]
- Leask, A.; Fyall, A. Managing World Heritage Sites; Taylor & Francis: London, UK, 2006. [Google Scholar]
- Fredheim, L.H.; Khalaf, M. The significance of values: heritage value typologies re-examined. Int. J. Heritage Stud. 2016, 22, 1–17. [Google Scholar] [CrossRef]
- Duval, M.; Smith, B.; Hœrlé, S.; Bovet, L.; Khumalo, N.; Bhengu, L. Towards a holistic approach to heritage values: a multidisciplinary and cosmopolitan approach. Int. J. Heritage Stud. 2019, 25, 1279–1301. [Google Scholar] [CrossRef]
- Heras, V.C.; Cordero, M.S.M.; Wijffels, A.; Tenze, A.; Paredes, D.E.J. Heritage values: towards a holistic and participatory management approach. J. Cult. Heritage Manag. Sustain. Dev. 2019, 9, 199–211. [Google Scholar] [CrossRef]
- Poux, F.; Valembois, Q.; Mattes, C.; Kobbelt, L.; Billen, R. Initial User-Centered Design of a Virtual Reality Heritage System: Applications for Digital Tourism. Remote Sens. 2020, 12, 2583. [Google Scholar] [CrossRef]
- Sommerville, I.; Sawyer, P. Viewpoints: principles, problems and a practical approach to requirements engineering. Ann. Softw. Eng. 1997, 3, 101–130. [Google Scholar] [CrossRef]
- Finkelstein, A.; Goedicke, M.; Kramer, J.; Niskier, C. ViewPoint oriented software development: Methods and viewpoints in requirements engineering. Lecture Notes Comput. Sci. 1991, 490, 29–54. [Google Scholar] [CrossRef]
- Guarnieri, A.; Remondino, F.; Vettore, A. Digital photogrammetry and TLS data fusion applied to cultural heritage 3D modeling. In International Archives of the Photogrammetry, Remote Sensing and Spatial Information Sciences—ISPRS Archives; Maas, H.-G., Schneider, D., Eds.; ISPRS: Dresden, Germany, 2006. [Google Scholar]
- Remondino, F. Heritage Recording and 3D Modeling with Photogrammetry and 3D Scanning. Remote Sens. 2011, 3, 1104–1138. [Google Scholar] [CrossRef]
- Letellier, R. Recording, Documentation and Information Management for the Conservation of Heritage Places; Informa UK Limited: London, UK, 2015. [Google Scholar]
- Quintero, M.S.; Blake, B.; Eppich, R. Conservation of Architectural Heritage: The Role of Digital Documentation Tools: The Need for Appropriate Teaching Material. Int. J. Arch. Comput. 2007, 5, 239–253. [Google Scholar] [CrossRef]
- Noya, N.C.; García, Á.L.; Ramírez, F.C. Combining photogrammetry and photographic enhancement techniques for the recording of megalithic art in north-west Iberia. Digit. Appl. Archaeol. Cult. Heritage 2015, 2, 89–101. [Google Scholar] [CrossRef]
- Yastikli, N. Documentation of cultural heritage using digital photogrammetry and laser scanning. J. Cult. Heritage 2007, 8, 423–427. [Google Scholar] [CrossRef]
- Santana, M. Heritage recording, documentation and information systems in preventive maintenance. Presented at the Inauguration of the UNESCO Chair on Preventive Conservation, Maintenance and Monitoring of Monuments and Sites, Leuven, Belgium, 24–25 March 2009. [Google Scholar]
- Chiabrando, F.; Donato, V.; Turco, M.L.; Santagati, C. Cultural Heritage Documentation, Analysis and Management Using Building Information Modelling: State of the Art and Perspectives; Springer Science and Business Media LLC: Berlin/Heidelberg, Germany, 2018; pp. 181–202. [Google Scholar]
- Billen, R.; Jonlet, B.; Luczfalvy Jancsó, A.; Neuville, R.; Nys, G.-A.; Poux, F.; Van Ruymbeke, M.; Piavaux, M.; Hallot, P. La transition numérique dans le domaine du patrimoine bâti: un retour d’expériences. Bull. Comm. R. Monum. Sites Fouill. 2018, 30, 119–148. [Google Scholar]
- Quattrini, R.; Pierdicca, R.; Morbidoni, C. Knowledge-based data enrichment for HBIM: Exploring high-quality models using the semantic-web. J. Cult. Heritage 2017, 28, 129–139. [Google Scholar] [CrossRef]
- Yang, X.; Lu, Y.-C.; Murtiyoso, A.; Koehl, M.; Grussenmeyer, P. HBIM Modeling from the Surface Mesh and Its Extended Capability of Knowledge Representation. ISPRS Int. J. Geo-Inf. 2019, 8, 301. [Google Scholar] [CrossRef]
- Fai, S.; Graham, K.; Duckworth, T.; Wood, N.; Attar, R. Building Information Modelling and Heritage Documentation. In Proceedings of the 23rd International Symposium, International Scientific Committee for Documentation of Cultural Heritage (CIPA), Prague, Czech Republic, 11–16 September 2011. [Google Scholar]
- Doré, C.; Murphy, M. Integration of Historic Building Information Modeling (HBIM) and 3D GIS for recording and managing cultural heritage sites. In Proceedings of the 18th International Conference on Virtual Systems and Multimedia; Institute of Electrical and Electronics Engineers (IEEE), Milan, Italy, 2–5 September 2012. [Google Scholar]
- Azhar, S.; Khalfan, M.; Maqsood, T. Building information modelling (BIM): now and beyond. Constr. Econ. Build. 2015, 12, 15–28. [Google Scholar] [CrossRef]
- Pocobelli, D.P.; Boehm, J.; Bryan, P.; Still, J.; Grau-Bové, J. BIM for heritage science: A review. Herit. Sci. 2018, 6, 30. [Google Scholar] [CrossRef]
- García-Valldecabres, J.; Pellicer, E.; Jordan-Palomar, I. BIM Scientific Literature Review for Existing Buildings and a Theoretical Method: Proposal for Heritage Data Management Using HBIM. In Construction Research Congress 2016; American Society of Civil Engineers (ASCE): Reston, VA, USA, 2016; pp. 2228–2238. [Google Scholar]
- López, F.J.; Lerones, P.; Fernández, J.; García-Bermejo, J.; Zalama, E. A Review of Heritage Building Information Modeling (H-BIM). Multimodal Technol. Interact. 2018, 2, 21. [Google Scholar] [CrossRef]
- Pocobelli, D.P.; Boehm, J.; Bryan, P.; Still, J.; Grau-Bové, J. Building Information Models for monitoring and simulation data in heritage buildings. In International Archives of the Photogrammetry, Remote Sensing and Spatial Information Sciences—ISPRS Archives; Copernicus: Heildeberg, Germany, 2018; Volume 42, pp. 909–916. [Google Scholar]
- Poux, F.; Neuville, R.; Nys, G.-A.; Billen, R. 3D Point Cloud Semantic Modelling: Integrated Framework for Indoor Spaces and Furniture. Remote Sens. 2018, 10, 1412. [Google Scholar] [CrossRef]
- Chevrier, C.; Charbonneau, N.; Grussenmeyer, P.; Perrin, J.-P. Parametric Documenting of Built Heritage: 3D Virtual Reconstruction of Architectural Details. Int. J. Arch. Comput. 2010, 8, 135–150. [Google Scholar] [CrossRef]
- Garagnani, S.; Manferdini, A.M. Parametric accuracy: building information modeling process applied to the cultural heritage preservation. Int. Arch. Photogramm. Remote Sens. Spat. Inf. Sci. 2013, 5, 87–92. [Google Scholar] [CrossRef]
- Angelini, M.G.; Baiocchi, V.; Costantino, D.; Garzia, F. Scan to BIM for 3D reconstruction of the papal basilica of saint Francis in Assisi In Italy. Int. Arch. Photogramm. Remote Sens. Spat. Inf. Sci.—ISPRS Arch. 2017, 42, 47–54. [Google Scholar] [CrossRef]
- Bassier, M.; Hadjidemetriou, G.; Vergauwen, M.; Van Roy, N.; Verstrynge, E. Implementation of Scan-to-BIM and FEM for the Documentation and Analysis of Heritage Timber Roof Structures. In Proceedings of the Euro-Mediterranean Conference, Larnaca, Cyprus, 31 October–5 November 2016. [Google Scholar]
- Logothetis, S.; Valari, E.; Karachaliou, E.; Stylianidis, E. Spatial dmbs architecture for a free and open source bim. In International Archives of the Photogrammetry, Remote Sensing and Spatial Information Sciences—ISPRS Archives; Copernicus: Heildeberg, Germany, 2017; Volume 42, pp. 467–473. [Google Scholar]
- Edwards, J. It’s BIM—But not as we know it! In Heritage Building Information Modelling; Routledge: London, UK, 2017; pp. 6–14. [Google Scholar]
- Simeone, D.; Cursi, S.; Toldo, I.; Carrara, G. B (H) IM-Built Heritage Information Modelling-Extending BIM Approach to Historical and Archaeological Heritage Representation; Copernicus: Heildeberg, Germany, 2014. [Google Scholar]
- Stasinopoulou, T.; Bountouri, L.; Kakali, C.; Lourdi, I.; Papatheodorou, C.; Doerr, M.; Gergatsoulis, M. Ontology-Based Metadata Integration in the Cultural Heritage Domain. In Proceedings of the International Conference on Asian Digital Libraries, Hanoi, Vietnam, 10–13 December 2007. [Google Scholar]
- Ferretti, V.; Comino, E. An integrated framework to assess complex cultural and natural heritage systems with Multi-Attribute Value Theory. J. Cult. Heritage 2015, 16, 688–697. [Google Scholar] [CrossRef]
- Poux, F.; Neuville, R.; Van Wersch, L.; Nys, G.-A.; Billen, R. 3D Point Clouds in Archaeology: Advances in Acquisition, Processing and Knowledge Integration Applied to Quasi-Planar Objects. Geoscience 2017, 7, 96. [Google Scholar] [CrossRef]
- Hallot, P.; Billen, R. States of knowledge: A basis for a spatio-temporal model of cultural heritage information. CEUR Workshop Proc. 2018, 2230, 67–80. [Google Scholar]
- Parisi, P.; Turco, M.L.; Giovannini, E.C. The Value Of Knowledge Through H-Bim Models: Historic Documentation With A Semantic Approach. In ISPRS Ann. Photogramm. Remote Sens. Spat. Inf. Sci. 2019, 42, 581–588. [Google Scholar] [CrossRef]
- Saygi, G.; Remondino, F. Management of Architectural Heritage Information in BIM and GIS: State-of-the-Art and Future Perspectives. Int. J. Heritage Digit. Era 2013, 2, 695–713. [Google Scholar] [CrossRef]
- Tobiáš, P. BIM, GIS and semantic models of cultural heritage buildings. Geoinformatics FCE CTU 2016, 15, 27–42. [Google Scholar] [CrossRef]
- Bruno, S.; De Fino, M.; Fatiguso, F. Historic Building Information Modelling: performance assessment for diagnosis-aided information modelling and management. Autom. Constr. 2018, 86, 256–276. [Google Scholar] [CrossRef]
- Poux, F.; Neuville, R.; Hallot, P.; Billen, R. Model For Semantically Rich Point Cloud Data. ISPRS Ann. Photogramm. Remote Sens. Spat. Inf. Sci. 2017, 107–115. [Google Scholar] [CrossRef]
- Jordan-Palomar, I.; Valldecabres, J.L.G.; Tzortzopoulos, P.; Pellicer, E. An online platform to unify and synchronise heritage architecture information. Autom. Constr. 2020, 110, 103008. [Google Scholar] [CrossRef]
- Dutailly, B.; Feruglio, V.; Ferrier, C.; Chapoulie, R.; Bousquet, B.; Bassel, L.; Mora, P.; Lacanette, D. Accéder en 3D aux données de terrain pluridisciplinaires—Un outil pour l’étude des grottes ornées. In Le Réel et le Virtuel; HAL: Marseille, France, 2019. [Google Scholar]
- Meyer, É.; Grussenmeyer, P.; Perrin, J.-P.; Durand, A.; Drap, P. A web information system for the management and the dissemination of Cultural Heritage data. J. Cult. Heritage 2007, 8, 396–411. [Google Scholar] [CrossRef]
- Potenziani, M.; Callieri, M.; Scopigno, R. Developing and Maintaining a Web 3D Viewer for the CH Community: an Evaluation of the 3DHOP Framework. In Proceedings of the 16th Workshop on Graphics and Cultural Heritage (GCH 2018) Eurographics International Conference, Vienna, Austria, 12–15 November 2018; pp. 169–178. [Google Scholar]
- Van Ruymbeke, M.; Hallot, P.; Nys, G.-A.; Billen, R. Implementation of multiple interpretation data model concepts in CIDOC CRM and compatible models. Virtual Archaeol. Rev. 2018, 9, 50. [Google Scholar] [CrossRef]
- Wu, Q.; Chen, C.; Jiang, Y. Multi-source heterogeneous Hakka culture heritage data management based on MongoDB. In Proceedings of the Fifth International Conference on Agro-Geoinformatics (Agro-Geoinformatics), Tianjin, China, 18–20 July 2016. [Google Scholar]
- Reunanen, M.; Diaz, L.; Horttana, T. A Holistic User-Centered Approach to Immersive Digital Cultural Heritage Installations. J. Comput. Cult. Heritage 2015, 7, 1–16. [Google Scholar] [CrossRef]
- Ibrahim, N.; Ali, N.M. A Conceptual Framework for Designing Virtual Heritage Environment for Cultural Learning. J. Comput. Cult. Heritage 2018, 11, 1–27. [Google Scholar] [CrossRef]
- Barbieri, L.; Bruno, F.; Muzzupappa, M. User-centered design of a virtual reality exhibit for archaeological museums. Int. J. Interact. Des. Manuf. 2017, 12, 561–571. [Google Scholar] [CrossRef]
- De Runz, C.; Desjardin, E. Imperfect Spatiotemporal Information Analysis in a GIS: Application to Archæological Information Completion Hypothesis. Stud. Fuzziness Soft Comput. 2010, 256, 341–356. [Google Scholar] [CrossRef]
- Gonzalez-Perez, C. A conceptual modelling language for the humanities and social sciences. In Proceedings of the 6th International Conference on Research Challenges in Information Science (RCIS), Valencia, Spain, 16–18 May 2012. [Google Scholar]
- Hallot, P.; Billen, R. Enhancing Spatio-Temporal Identity: States of Existence and Presence. ISPRS Int. J. Geo-Inform. 2016, 5, 62. [Google Scholar] [CrossRef]
- Peuquet, D.J. It’s About Time: A Conceptual Framework for the Representation of Temporal Dynamics in Geographic Information Systems. Ann. Assoc. Am. Geogr. 1994, 84, 441–461. [Google Scholar] [CrossRef]
- Bennett, S.; McRobb, S.; Farmer, R.; MacRobb, S. Object-Oriented Systems Analysis and Design Using UML; McGraw-Hill Berkshire: Berkshire, UK, 2006; Volume 2. [Google Scholar]
- Gonzalez-Perez, C.; Parcero-Oubiña, C. A Conceptual Model for Cultural Heritage Definition and Motivation. In Proceedings of the 39th Annual Conference on Computer Applications and Quantitative Methods in Archaeology, Beijing, China, 12–16 April 2011. [Google Scholar]
- Poux, F.; Neuville, R.; Hallot, P.; Billen, R. Point clouds as an efficient multiscale layered spatial representation. In Eurographics Workshop on Urban Data Modelling and Visualisation; Vincent, T., Biljecki, F., Eds.; The Eurographics Association: Liège, Belgium, 2016. [Google Scholar]
- Poux, F.; Neuville, R.; Billen, R. Point Cloud Classification Of Tesserae From Terrestrial Laser Data Combined With Dense Image Matching For Archaeological Information Extraction. ISPRS Ann. Photogramm. Remote Sens. Spat. Inf. Sci. 2017, 203–211. [Google Scholar] [CrossRef]
- Studer, R.; Benjamins, V.; Fensel, D. Knowledge engineering: Principles and methods. Data Knowl. Eng. 1998, 25, 161–197. [Google Scholar] [CrossRef]
- Van Vliet, H. Software Engineering: Principles and Practice; Wiley/Blackwell: New York, NY, USA, 2007. [Google Scholar]
- Gilb, T.; Finzi, S. Principles of Software Engineering Management; Addison-Wesley Professional: Boston, MA, USA, 1988. [Google Scholar]
- Ghezzi, C.; Jazayeri, M.; Mandrioli, D. Fundamentals of Software Engineering; Pearson: London, UK, 1991. [Google Scholar]
- Poux, F.; Billen, R. A Smart Point Cloud Infrastructure for intelligent environments. In Laser Scanning; Informa UK Limited: London, UK, 2019; pp. 127–149. [Google Scholar]
- Holemans, A.; Kasprzyk, J.-P.; Donnay, J.-P. Coupling an Unstructured NoSQL Database with a Geographic Information System. In Proceedings of the Tenth International Conference on Advanced Geographic Information, Rome, Italy, 25–29 March 2018. [Google Scholar]
- OpenGIS Web Feature Service 2.0 Interface Standard; Open Geospatial Consortium Inc.: Wayland, MA, USA, 2010.
- Schutz, M.; Krosl, K.; Wimmer, M. Real-Time Continuous Level of Detail Rendering of Point Clouds. In Proceedings of the IEEE Conference on Virtual Reality and 3D User Interfaces (VR), Osaka, Japan, 23–27 March 2019. [Google Scholar]
- Poux, F.; Billen, R. Poux Voxel-Based 3D Point Cloud Semantic Segmentation: Unsupervised Geometric and Relationship Featuring vs Deep Learning Methods. ISPRS Int. J. Geo-Inform. 2019, 8, 213. [Google Scholar] [CrossRef]
- Bassier, M.; Vergauwen, M.; Poux, F. Point Cloud vs. Mesh Features for Building Interior Classification. Remote Sens. 2020, 12, 2224. [Google Scholar] [CrossRef]
- Poux, F.; Ponciano, J.J. Self-Learning Ontology For Instance Segmentation Of 3d Indoor Point Cloud. In International Archives of Photogrammetry, Remote Sensing and Spatial Information Sciences; Copernicus Publications: Nice, France, 2020; pp. 309–316. [Google Scholar]
- Poux, F.; Mattes, C.; Kobbelt, L. Unsupervised segmentation of indoor 3D point cloud: application to object-based classification. Int. Arch. Photogramm. Remote Sens. Spat. Inf. Sci. 2020, XLIV-4, 111–118. [Google Scholar] [CrossRef]
- Katsianis, M.; Tsipidis, S.; Kotsakis, K.; Kousoulakou, A. A 3D digital workflow for archaeological intra-site research using GIS. J. Archaeol. Sci. 2008, 35, 655–667. [Google Scholar] [CrossRef]
- Kharroubi, A.; Hajji, R.; Billen, R.; Poux, F. Classification and Integration of Massive 3d Points Clouds in a Virtual Reality (VR) Environment. Int. Arch. Photogramm. Remote Sens. Spat. Inf. Sci. 2019, 42, 165–171. [Google Scholar] [CrossRef]
- Kharroubi, A.; Billen, R.; Poux, F. Marker-Less Mobile Augmented Reality Application for Massive 3D Point Clouds and Semantics. Int. Arch. Photogramm. Remote Sens. Spat. Inf. Sci. 2020, XLIII, 255–261. [Google Scholar] [CrossRef]


| Name | Geometric Approach | Semantic Approach | Temporal Approach | ReadOnly/Edition Platform |
|---|---|---|---|---|
| BIMLegacy | Revit LOD400 | Revit | Revit | RO/Edition |
| PHYT | Mesh | SQL | None | RO/Edition |
| Web for CH | VRML/GIS | SQL-DataModel | Period | RO/Edition |
| 3DHop | Mesh | To be connected | Managed from a semantic approach | RO |
| Item | Action | Comment |
|---|---|---|
| Functionality | To improve | More functionalities are needed due to the feedback of the users. |
| Reliability | Satisfying | Some bugs were present in the developed HIS-PC, and we are correcting them progressively |
| Usability | To improve | We need to merge the 3D point cloud system and web application. |
| Efficiency | Satisfying | The HIS-PC requires low hardware resources. |
| Maintainability | To improve | Due to the proprietary aspect of Geoverse, the maintainability of this component is not under control, thus needs migration. The web interface is fully maintainable. |
| Portability | To improve | The web application may be deployed under different server environment, but Geoverse needs a PC to be operated and used. |
© 2020 by the authors. Licensee MDPI, Basel, Switzerland. This article is an open access article distributed under the terms and conditions of the Creative Commons Attribution (CC BY) license (http://creativecommons.org/licenses/by/4.0/).
Share and Cite
Poux, F.; Billen, R.; Kasprzyk, J.-P.; Lefebvre, P.-H.; Hallot, P. A Built Heritage Information System Based on Point Cloud Data: HIS-PC. ISPRS Int. J. Geo-Inf. 2020, 9, 588. https://doi.org/10.3390/ijgi9100588
Poux F, Billen R, Kasprzyk J-P, Lefebvre P-H, Hallot P. A Built Heritage Information System Based on Point Cloud Data: HIS-PC. ISPRS International Journal of Geo-Information. 2020; 9(10):588. https://doi.org/10.3390/ijgi9100588
Chicago/Turabian StylePoux, Florent, Roland Billen, Jean-Paul Kasprzyk, Pierre-Henri Lefebvre, and Pierre Hallot. 2020. "A Built Heritage Information System Based on Point Cloud Data: HIS-PC" ISPRS International Journal of Geo-Information 9, no. 10: 588. https://doi.org/10.3390/ijgi9100588
APA StylePoux, F., Billen, R., Kasprzyk, J.-P., Lefebvre, P.-H., & Hallot, P. (2020). A Built Heritage Information System Based on Point Cloud Data: HIS-PC. ISPRS International Journal of Geo-Information, 9(10), 588. https://doi.org/10.3390/ijgi9100588