Article

Spatiotemporal Analysis of Carbon Emissions and Carbon Storage Using National Geography Census Data in Wuhan, China

1
School of Remote Sensing and Information Engineering, Wuhan University, 129 Luoyu Road, Wuhan 430079, China
2
Collaborative Innovation Center of Geospatial Technology, Wuhan University, Wuhan 430079, China
*
Author to whom correspondence should be addressed.
ISPRS Int. J. Geo-Inf. 2019, 8(1), 7; https://doi.org/10.3390/ijgi8010007
Submission received: 12 November 2018 / Revised: 21 December 2018 / Accepted: 21 December 2018 / Published: 26 December 2018
(This article belongs to the Special Issue Spatial Analysis of Pollution and Risk in a Changing Climate)

Abstract

:
Mapping changes in carbon emissions and carbon storage (CECS) with high precision at a small scale (urban street-block level) can improve governmental policy decisions with respect to the construction of low-carbon cities. In this study, a methodological framework for assessing the carbon budget and its spatiotemporal changes from 2015 to 2017 in Wuhan is proposed, which is able to monitor a large area. To estimate the carbon storage, a comprehensive coefficient model was adopted with carbon density factors and corresponding land cover types. Details regarding land cover were extracted from the Geographic National Census Data (GNCD), including forests, grasslands, croplands, and gardens. For the carbon emissions, an emission-factor model was first used and a spatialization operation was subsequently performed using the geographic location that was obtained from the GNCD. The carbon emissions that were identified in the study are from fossil-fuel consumption, industrial production processes, disposal of urban domestic refuse, and transportation. The final dynamic changes in the CECS, in addition to the net carbon emissions, were monitored and analyzed, yielding temporal and spatial maps with a high-precision at a small scale. The results showed that the carbon storage in Wuhan declined by 2.70% over the three years, whereas the carbon emissions initially increased by 0.2%, and subsequently decreased by 3.1% over this period. The trend in the net carbon emission changes was similar to that of the carbon emissions, demonstrating that the efficiency of carbon reduction was improved during this period. Precise spatiotemporal results at the street-block level can offer insights to governments that are engaged in urban carbon cycle decision making processes, improving their capacities to more effectively manage the spatial distribution of CECS.

1. Introduction

The C40 Large Cities Climate Leadership Group reported that 80% of the global anthropogenic greenhouse gases, which are mainly composed of carbon dioxide (CO2), are emitted from cities [1]. These cities are often characterized by high concentrations of population, vehicles, energy consumption, and industries. The coal energy consumption of cities accounts for 76% of the global total coal consumption, even though their coverage is less than 1% of the total area of the Earth [2]. The reduction in the CO2 emissions from urban systems is, therefore, essential for the reduction in global greenhouse gas concentrations. Currently, two major internationally recognized methods for controlling the continuous increase in atmospheric CO2 concentrations have been proposed [3]. The first is to reduce greenhouse gas emissions, and in particular, energy consumption by improving energy efficiency and developing alternative energy sources [4,5]. The second is to increase greenhouse gas absorption and fixation through biological measures, such as afforestation and reforestation [6,7,8,9]. Therefore, monitoring the spatial and temporal changes in carbon emissions and carbon storage (CECS) in urban ecosystems is important for governments that are engaged in decision-making processes for low carbon cities.
Land cover changes are considered to have the greatest impact on regional carbon storage and carbon emissions [1]. In 2013, China launched the “Geographical Conditions Monitoring (GCM)” national project, which involves the dynamic monitoring of the territory of the country [10]. Geographic National Census Data (GNCD) is the product of the GCM national project, which can be used to map CECS over wide geographical areas and large time scales, significantly improving the efficiency and accuracy of the CECS estimation [11,12]. As a reliable, accurate, and authoritative national geographical data, GNCD has been widely used in China for the monitoring and management of forestry, agriculture, and city development [13]. Therefore, it is necessary to develop a methodological framework for the monitoring of urban CECS based on the GNCD.
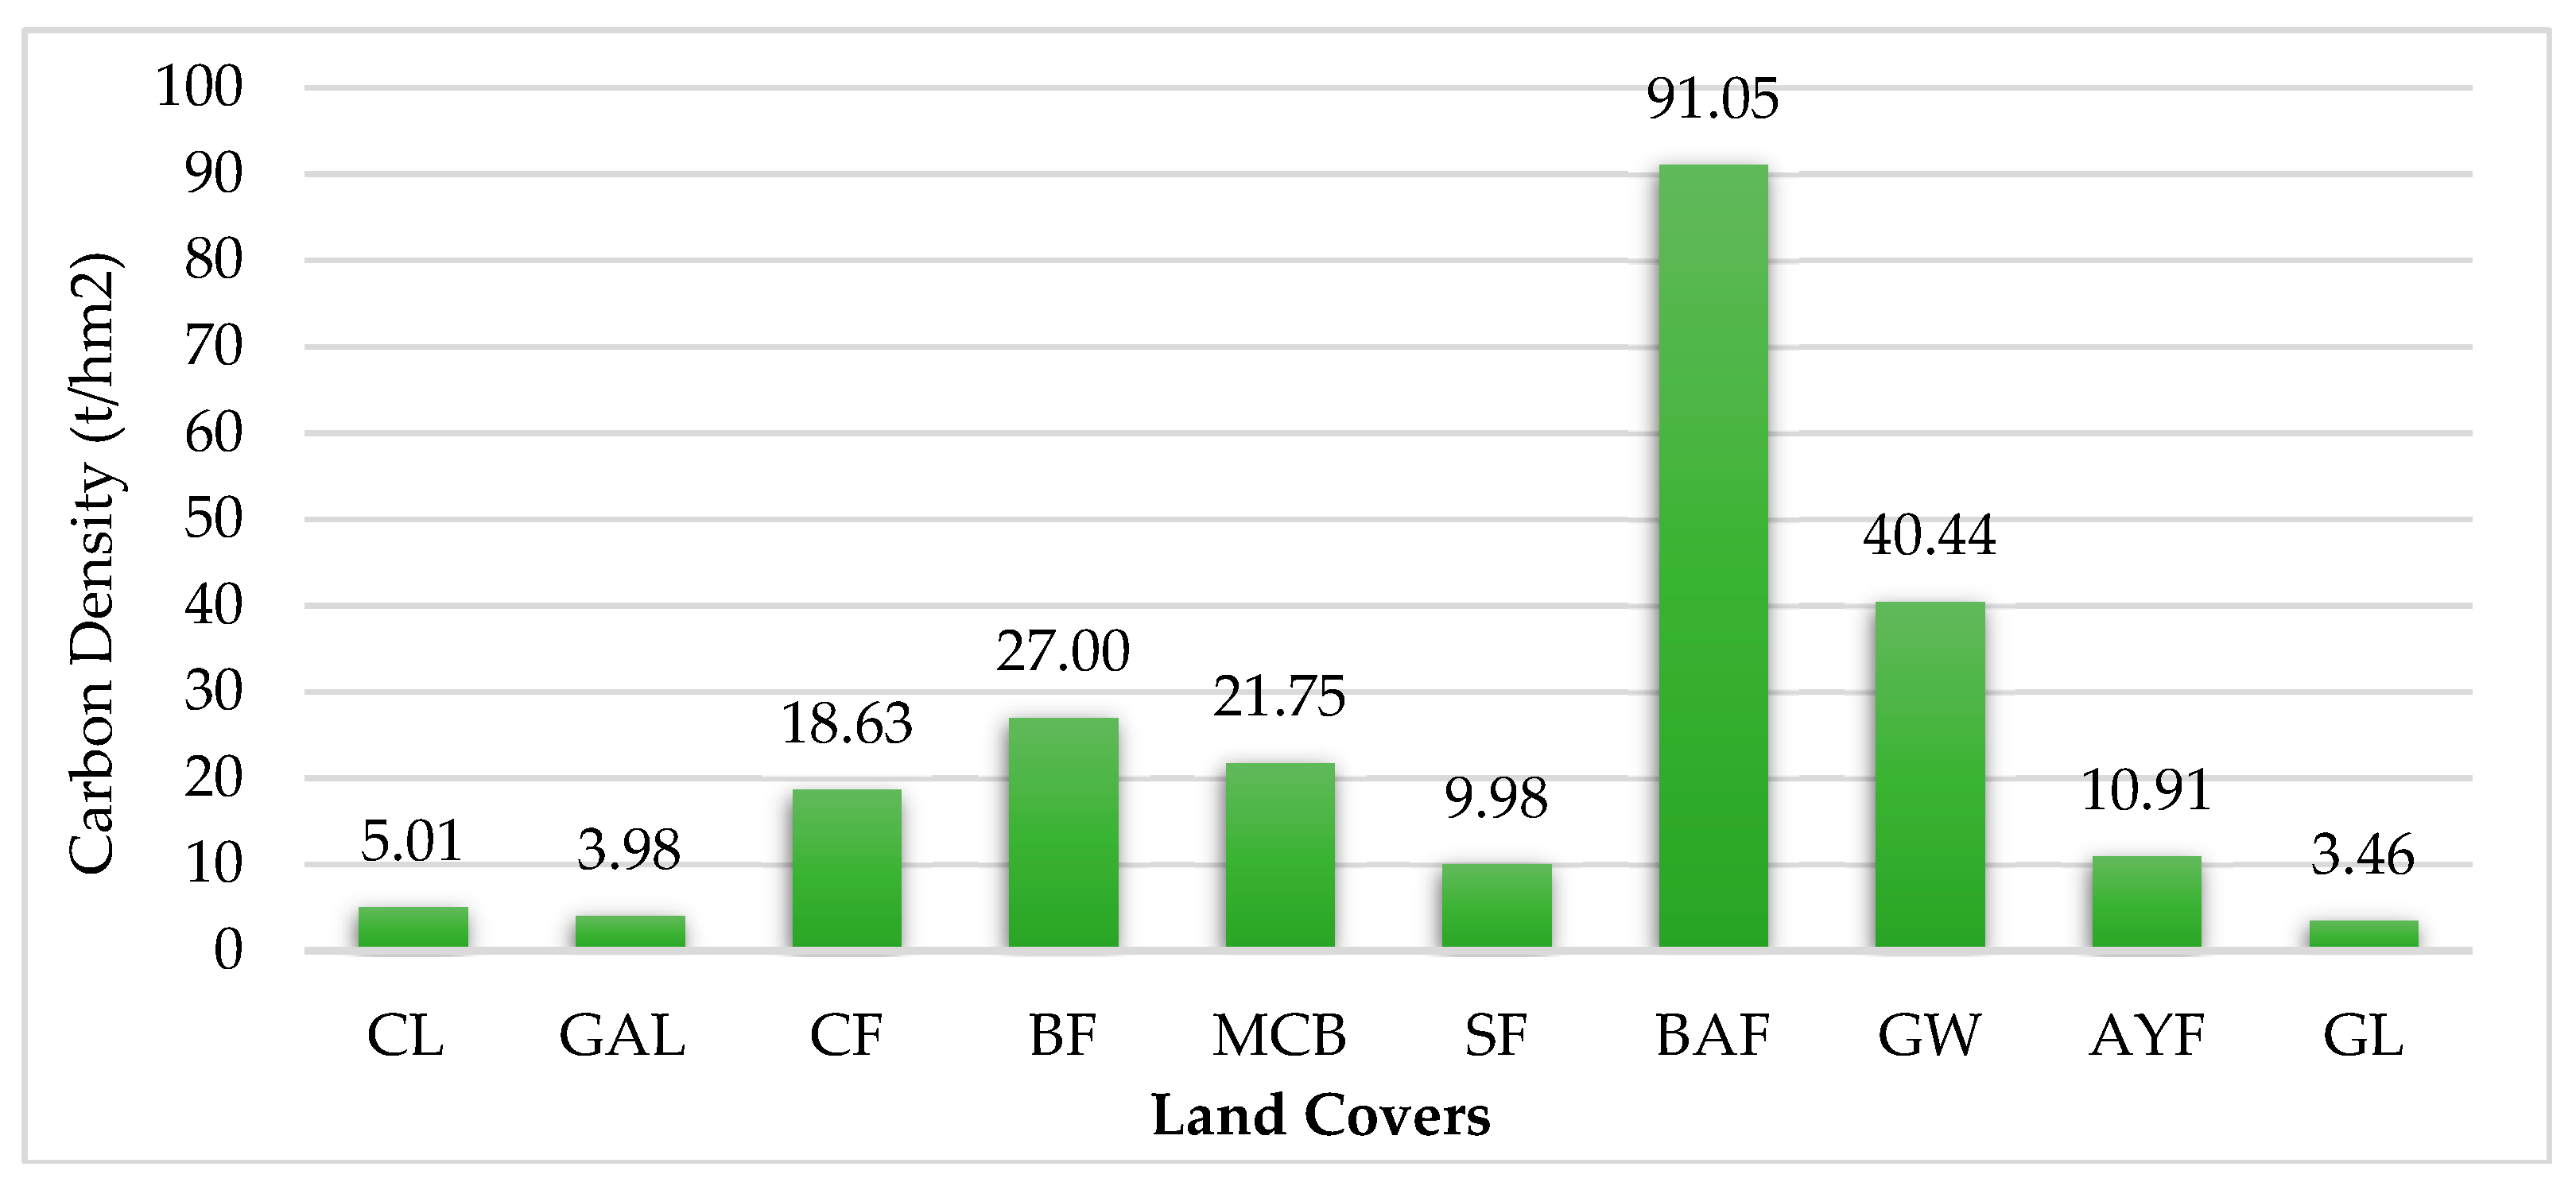
Exploring the carbon storage capacities of different vegetation types in the urban ecosystem is important for governments that are involved in the decision-making processes of low-carbon cities. Carbon storage denotes the cumulative amount of carbon that is produced by plant communities during their lifetime. The carbon pools of urban ecosystems are generally composed of forests, grasslands, gardens, and croplands, where forests represent high-quality carbon storage areas that mitigate climate change by capturing CO2 [14]. Using field surveys, biometric information, and remote sensing images, McPherson, et al. [15] concluded that their method could improve the accuracy of carbon storage estimation and increase the mapping resolution of carbon storage across a region. Wylie, et al. [16] estimated the net carbon storage per unit time of grasslands and croplands based on regression tree models, using remote sensing and bio-geophysical data, in addition to several flux towers. Their results revealed that grassland and cropland ecosystems generally performed as weak net carbon sinks, and more carbon was absorbed from the atmosphere than was released from 2000 to 2008. Zhao, et al. [17] and Golubiewski [18] demonstrated that the management of urban artificial vegetation could improve carbon sequestration capacity. In addition, the increase in artificial urban features is inevitably accompanied by a decrease in natural components [19] and the fragmentation of natural landscapes [20], both of which reduce the carbon absorption capacity and alter the carbon budget of a city.
When compared with vegetative land cover, artificial objects have higher carbon emissions and a more significant impact on urban carbon budgets [21]. Carbon emissions are defined as any processes, activities, or mechanisms that release CO2 into the atmosphere [1]. Moreover, the reduction of these emission is the main method for the reducing CO2 concentrations in the atmosphere [22]. Several researchers have studied the impacts of urban ecosystem carbon emissions from industry, transportation, agriculture, and urban domestic regions on urban carbon budgets [23]. In most cities, industrial energy consumption is the largest contributor of carbon emissions [24,25]. However, transportation in some cities is the largest contributor of carbon emissions [26,27]. In addition, the carbon emissions from urban domestic regions sometimes exceed those from transportation and increase with population growth and urban development [21]. These changes in carbon emissions and geographic coverage significantly affect the carbon budgets of cities. Therefore, it is necessary to monitor the changes in carbon sources over time and over a wide region.
Throughout modern history, researchers have developed several algorithms to estimate CECS in the urban ecosystem. Currently, the internationally recognized emission factor approach, as proposed by the Intergovernmental Panel on Climate Change (IPCC) [28], is widely used for carbon emission estimations. Several studies have performed source attribution of carbon emissions and assessed the contribution of different emission sources [29,30,31] using the emission factor approach. With respect to the carbon storage estimation, the coefficient method based on the average carbon content and geographic coverage information was proposed by the IPCC and it has been widely recognized by international scholars [28]. Zhang, Huang, and Luo [1] calculated the carbon storage of forests, pasturelands, and crop yields in Shenzhen based on the coefficient method. The authors concluded that urban expansion and forest reduction are the main reasons for the observed reduction in carbon sinks. To date, the main challenge of this analysis is the lack of accurate, up-to-date, and spatially explicit carbon estimations for the entire urban landscapes [14]. The method of field observations using a limited number of plots may result in significant sampling errors and high uncertainties in carbon estimations [15,32]. Houghton, et al. [33] estimated carbon emissions using land use and land-cover change data, but the historic land-use data sets were constructed based on aggregated, non-spatial data reported in national and international statistics. Brovkin, et al. [34] explored differences in climate and land-atmosphere fluxes between ensemble averages of simulations with and without land-use changes with a spatial resolution of 0.5° × 0.5° by the end of the 21st century. In this study, the annually updated GNCD that was produced by multiple-source remote sensing data with a resolution higher than 1 m [
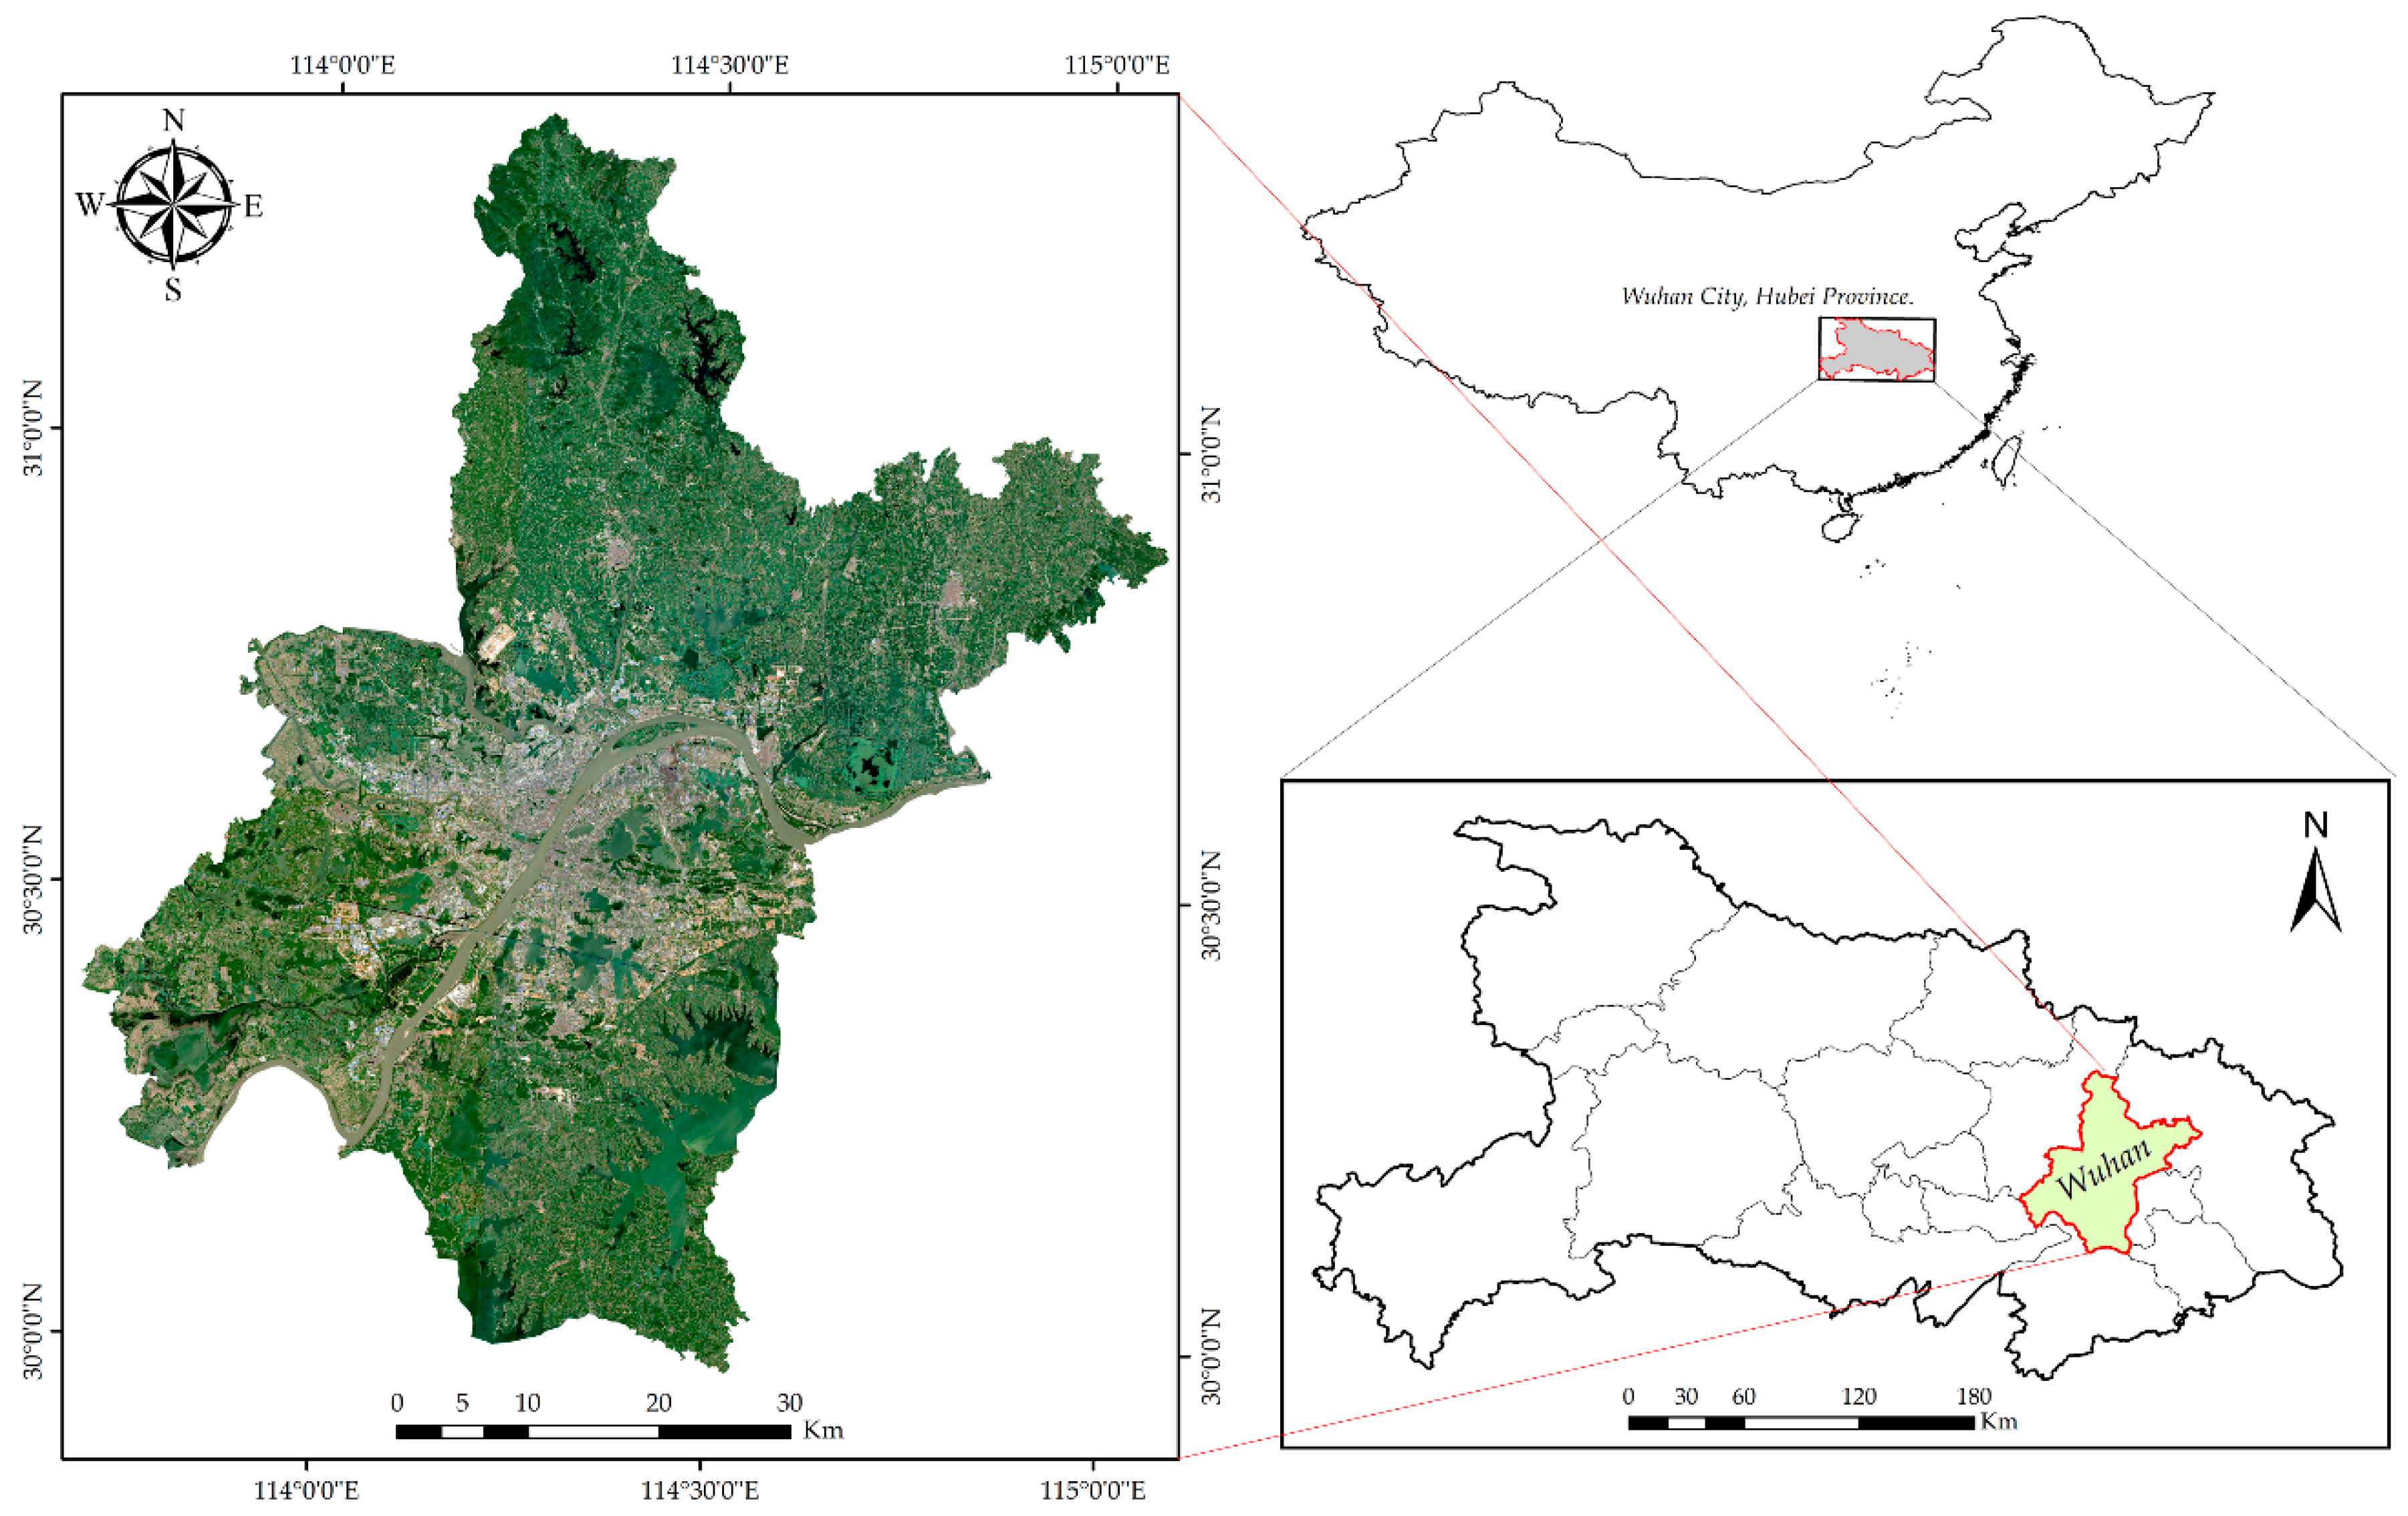
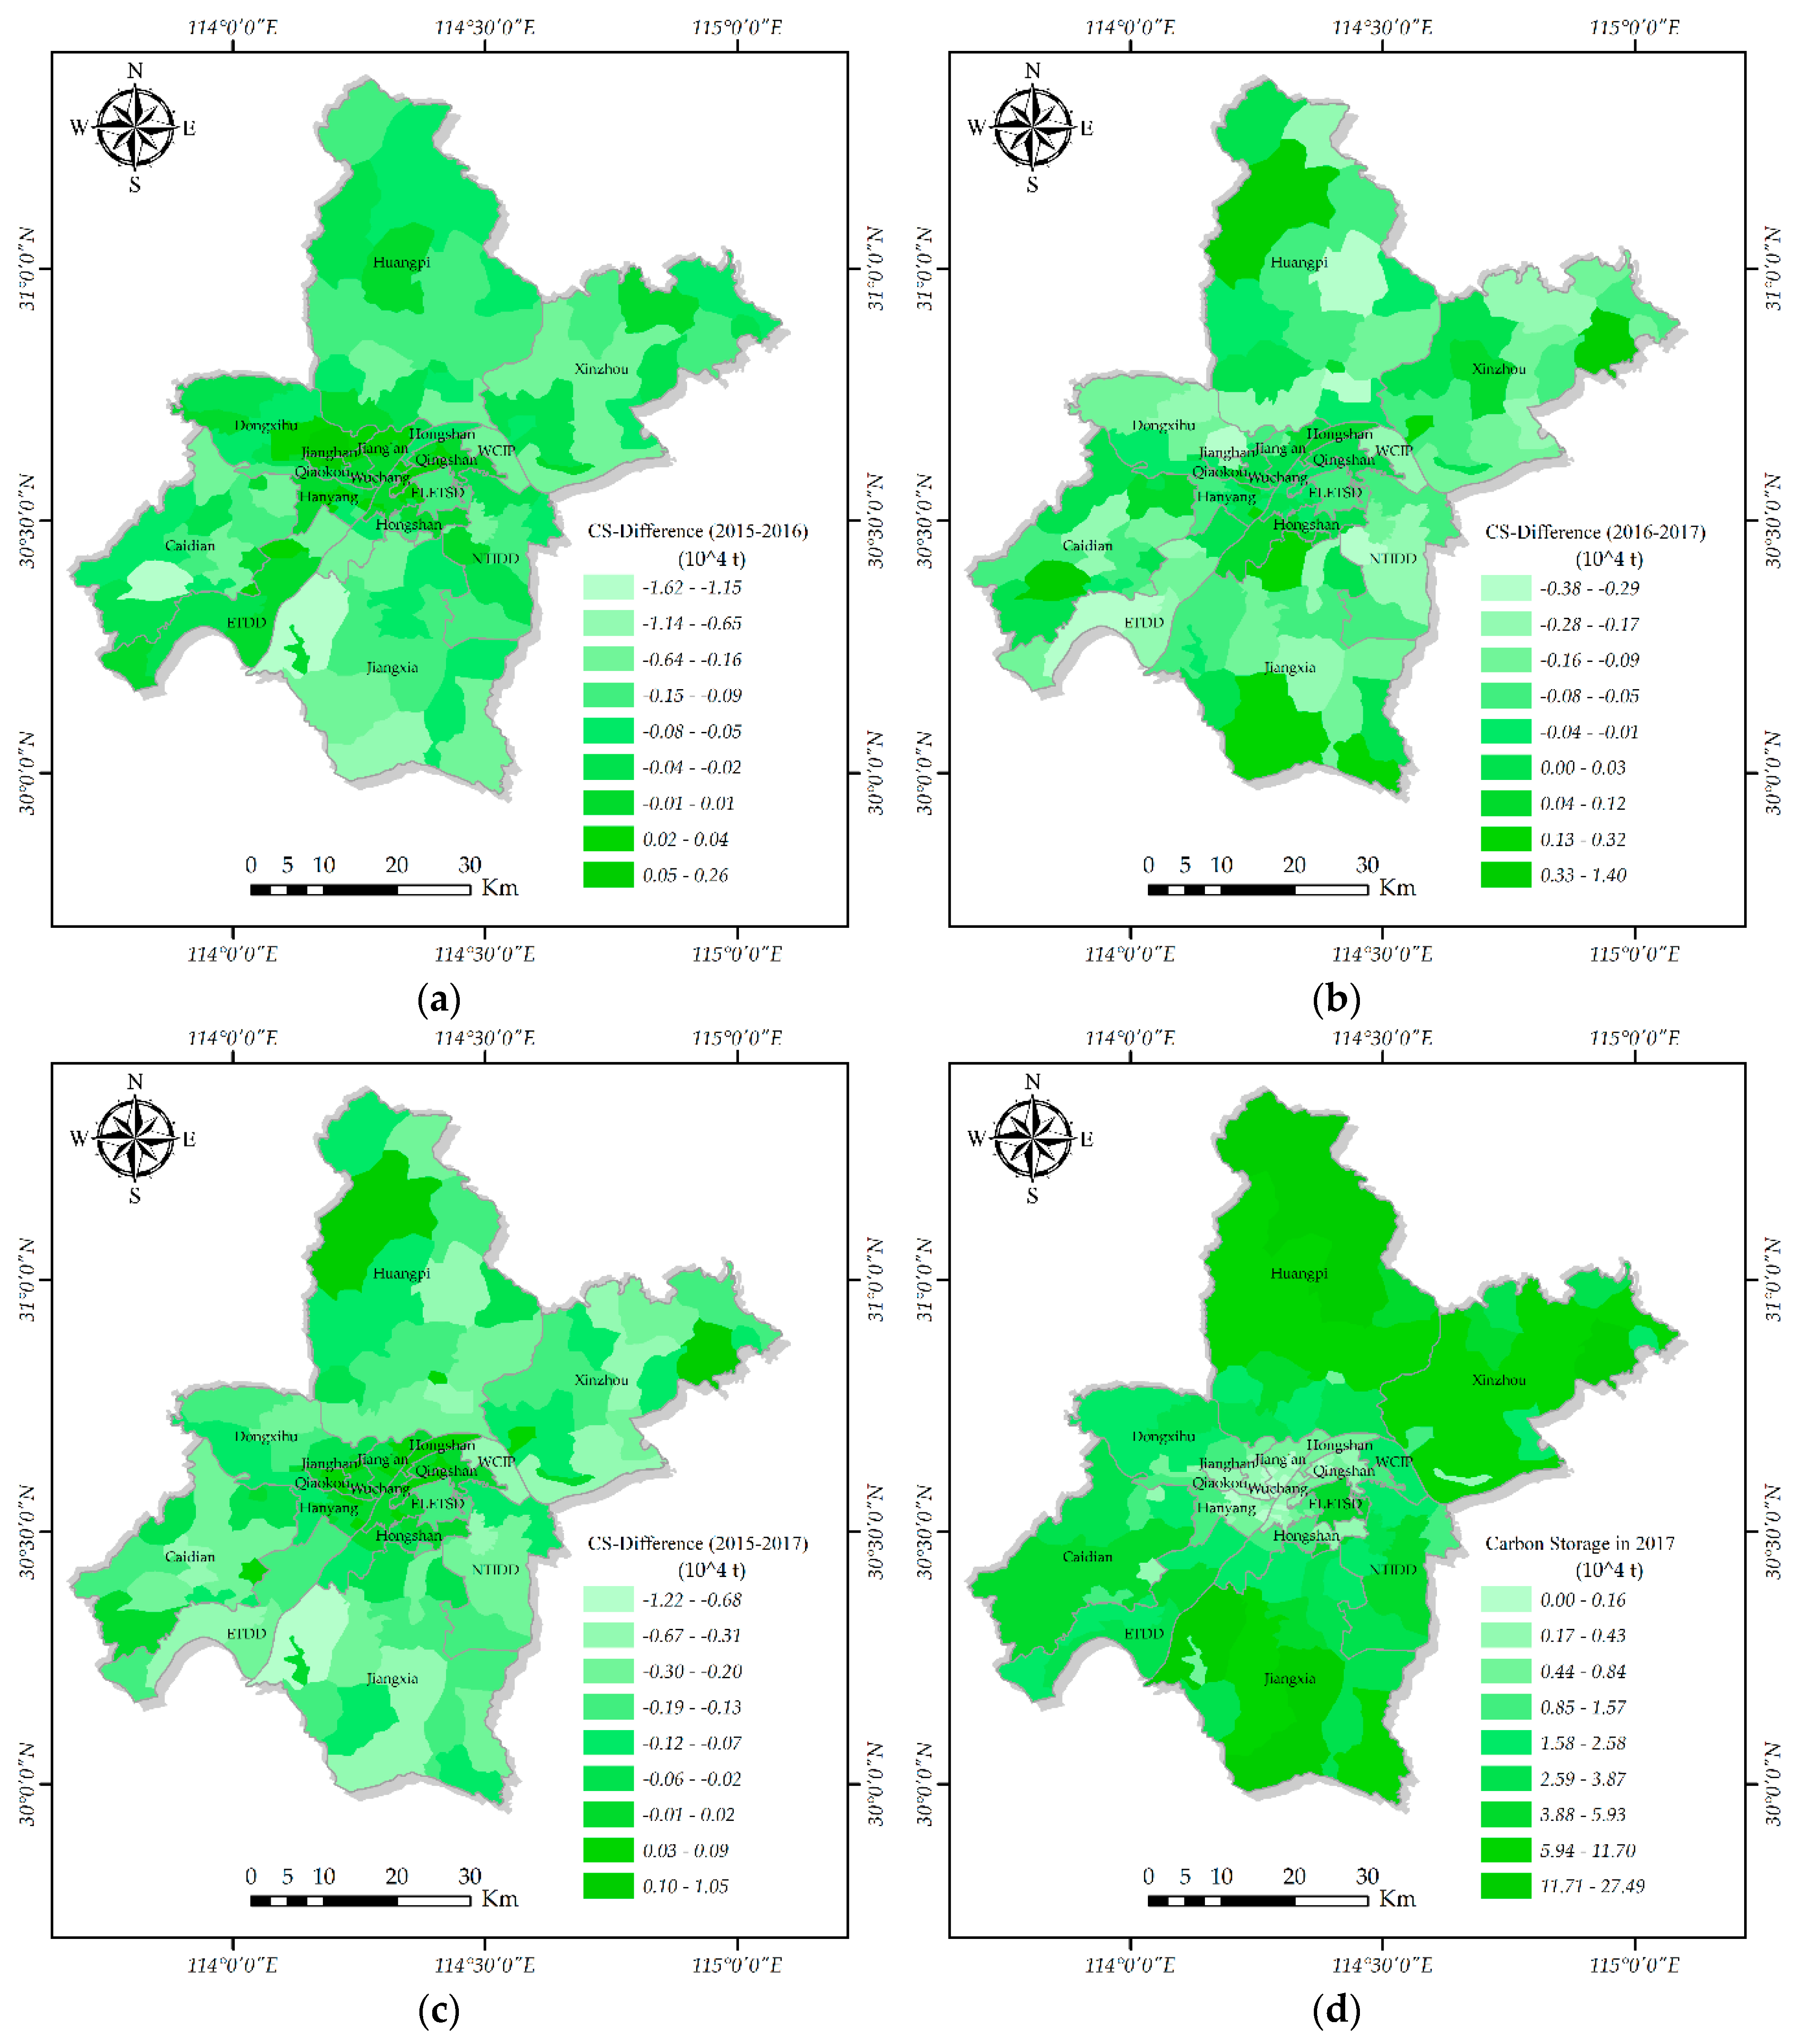
35] achieved a seamless full-coverage of the national geographic survey data, allowing for the realization of high-precision space monitoring of CECS. In this study, the spatial distribution and changes in urban carbon budgets on the level of the 181 administrative divisions based on GNCD was mapped, and a commonly applied demonstration for long-term dynamic monitoring of the carbon budget in urban ecosystems was provided. The aim of this study was (1) to estimate the carbon storage of different vegetation types and evaluate their carbon storage capacities; (2) to estimate the carbon emissions from industry, agricultural production, urban domestic regions, and transportation using the emission-factor model; and, (3) to map and analyze the spatiotemporal changes of carbon emissions, carbon storage, and net carbon emissions based on urban administrative divisions.

2. Materials

2.1. Study Site

The study site (Figure 1), covering an area of 849,441 ha, is located in Hubei Province, in South-central China (29°58′–31°22′N, 113°41′–115°05′E, WGS84). The terrain is high in the southeast and low in the northwest at an altitude of 18–150 m above sea level. The climate of Wuhan belongs to the subtropical monsoon climate with abundant sunlight and rainfall. There is approximately 1202 mm of annual average precipitation and the annual duration of sunlight is approximately 1917 h. The main vegetation cover types in Wuhan are the coniferous forests, broadleaf forests, mixed coniferous and broadleaf forests, shrubs, bamboo forests, greening woodlands, artificial young forests, grasslands, croplands, and gardens. Wuhan is a pilot city for the construction of a low-carbon city and it is one of the largest cities in central China.

2.2. Data Use

China has performed dynamic monitoring of national geographical conditions since 2013, obtaining full coverage, seamless, and high-precision geographic data. According to the contents and indicators of the national conditions information, the GNCD was obtained based on a classification algorithm using multi-source remote sensing imagery at a resolution higher than 1 m [35]. The census work began in 2013, ended in 2015, and it is updated annually, during which the current status and spatial distribution of natural and human geographical elements over terrestrial lands in China were fully investigated [36]. The surface coverage categories of the GNCD are divided into 12 first-level categories, 58 second-level categories, and 133 third-level categories. The GNCD acquisition work required all levels of census institutions and their staff to submit census data on time and in strict accordance with relevant regulations, to ensure that the basic data was complete, accurate, and reliable. Therefore, the GNCD lays the foundation for long-term dynamic monitoring and regional analysis of CECS. In this study, the GNCD obtained in 2015, 2016, and 2017 were used to estimate the carbon budget in Wuhan.
In addition, herein the forest inventory data are used to estimate carbon factors of different forest types that are based on the allometric model, representing a survey of forest resources containing several parameters, including the stand mean height, diameter at breast height (DBH), and dominant tree species. Socioeconomic data regarding industry, agricultural production, and urban domestic regions from 2015 to 2017 were obtained from the Wuhan Statistical Yearbook [37,38,39]. The transportation data from Wuhan in the years of 2015 to 2017 were obtained based on the CO2 emissions from various vehicles over a 100-km journey, as published by the Transport Bureau, in addition to statistical information from the Transport Department Blue Book and Statistical Yearbook [37,38,39].

3. Methods

The proposed methodological framework, as shown in Figure 2, encompasses three key components; carbon emission estimations (Section 3.1), carbon storage estimations (Section 3.2), and net carbon emission estimations (Section 3.3). The carbon storages in Wuhan include the forests, grasslands, croplands, and gardens. The forests in this region include coniferous forests, broadleaf forests, mixed coniferous/broadleaf forests, shrubs, bamboo forests, greening woodlands, and artificial young forests. Moreover, the carbon emission sources were industry, agricultural production, urban domestic sources, and transportation. The carbon storage factors of the different forest types based on the allometric model were estimated. The coefficient approach was then combined to obtain the carbon emissions, carbon storages, and net carbon emissions of Wuhan.

3.1. Carbon Storage Estimate

In this study, the carbon storages were estimated using a coefficient method based on factors, including land cover geo-information obtained from the GNCD and carbon storage factor estimated from forest inventory data as well as other auxiliary information [1]. The formula of the coefficient method can be expressed, as follows:
C a r b o n _ S t o r a g e i = D i A i
where C a r b o n _ S t o r a g e i is the carbon storage of carbon pool i; D i is the carbon storage factor of the carbon pool i, namely, its carbon density; and, A i is the area of carbon pool i (km2). The area of the different carbon pools can be obtained from the GNCD. The main carbon pools in Wuhan are forests, grasslands, croplands, and gardens; of which the forests include coniferous forests, broadleaf forests, mixed coniferous/broadleaf forests, shrubs, bamboo forests, greening woodlands, and artificial young forests.

3.1.1. Forest Carbon Storage Estimate

Forests are the main bodies of terrestrial ecosystems and they significantly influence the global carbon budget by dominating the dynamics of the terrestrial carbon cycle [11]. Forest carbon storage can be estimated by the areas of different forest types and corresponding carbon storage factors (carbon density). The areas and carbon storage factors of different forest types were obtained from the GNCD and forest inventory data, respectively. To calculate the different forest carbon storage factors, the allometric growth model [40] was used. For an individual tree, the biomass was calculated based on a species-specific allometric growth model. Nondestructive allometric equations can be used to measure tree biomass in the field [41]. The tree biomass was estimated based on allometric equations using diameter at breast height (DBH) and height measurements that can be easily measured in field plots [42]. The final carbon storage factor of each forest type is given by the following equation:
D f o r r e s t , i = 0.5 · ( W i · N i S i )
where D f o r e s t , i , W i , N i , and S i are the carbon storage factor, a single tree biomass, number of trees, and area of the i-th forest type, respectively. More particularly, the value of 0.5 is commonly used as a scale factor of the biomass [43,44,45]. The carbon factors of seven forest types were calculated based on the above method using forest inventory data from Wuhan. Table 1 displays the carbon factors of different forest types in Wuhan.

3.1.2. Grassland Carbon Storage Estimate

The carbon stock of a grassland can be estimated using its area and the corresponding carbon storage factor. Herein, the carbon storage factor of grasslands was set to 3.46 tons C/ha according to the data reported in previous studies and regional geographic characteristics [46]. The uncertainty of the grass carbon factor that is used in the study mainly originates from the grassland resource inventory and carbon storage estimation using remote sensing data [46]. The error related to the grassland resource inventory data is less than 10% [47]. The error for grass carbon storage estimation based on remote sensing data is approximately 35.9% [48].

3.1.3. Cropland Carbon Storage Estimates

The carbon storage of a cropland can be estimated using the cropland area obtained from the GNCD and corresponding carbon storage factor. From a previous study [49] regarding the current natural geographical condition of Wuhan, the carbon storage factor of croplands was set to 3.37 tons C/ha. Gardens are generated by the farming of tea plants and fruits, which are classified as a distinct type of cropland. Similarly, the carbon storage factor of gardens was also taken from the literature, i.e., 11.85 tons C/ha. Uncertainty estimates are not available from ref. [49] and very little measurement data on the carbon storage of croplands and gardens have been published. Therefore, it is difficult to accurately assess the uncertainty of the respective carbon factors.

3.2. Carbon Emissions Estimate

The carbon emissions were estimated based on the emission-factor approach that was proposed by the IPCC [28] using the GNCD, traffic data, and Statistical Yearbooks in Wuhan. The basic principle is to construct activity data and emission factors for each source according to the carbon inventory list, and then to use the product of the activity data and emission factors, like the carbon emissions estimate, for the emission item. According to the estimated carbon emissions, the spatiotemporal pattern analysis was performed based on the GNCD, which provided detailed geographic information. The main carbon emissions that are discussed herein originate from industry, agricultural production, urban domestic regions, and transportation. In this study, the carbon emissions from industry consist mainly of energy consumption, industrial production, and industrial waste. The carbon emissions from urban domestic production consist of domestic waste, domestic electricity, and domestic gas use. Therefore, the calculation of carbon emissions is presented with respect to energy consumption, industrial production process, disposal of urban domestic refuse and industrial waste, agriculture, and transportation.

3.2.1. Energy Consumption

Energy consumption refers to the energy consumed during production and living, which comprises the energy consumption of industry, urban life, agricultural production, and transportation. The carbon emissions of energy consumption were estimated by integrating various energy consumption data obtained from the Statistical Yearbook and the corresponding carbon emission factors that are based on ref. [28]. The formula can be expressed, as follows:
C E E = ( Q E i × γ i × α i )
where C E E , Q E i , γ i , and α i are the carbon emissions, quantity, energy coefficient of standard coal in the Statistical Yearbook, and the carbon emission factor per unit of standard coal, respectively.
According to the IPCC guidelines for national greenhouse gas inventories published in 2006 and the actual situation in Wuhan, 14 energy-related carbon emission items were summarized. The carbon emission factors in this study were calculated based on the default values of carbon contents and default net calorific values that were obtained from the IPCC guidelines for national greenhouse gas inventories. Table 2 shows the calculated carbon emission factors for each type of fuel.

3.2.2. Industrial Production Process

In this study, the carbon emissions of industrial production processes were estimated by calculating the carbon dioxide emissions during the production of cement, steel, and other materials. Similarly, the carbon emission factor of cement and steel were obtained from the Guidelines for National Greenhouse Gas Inventories [28]. The formula can be expressed, as follows:
C E j = Q j × α j
where C E j , Q j , and α j represent the carbon emissions, production quantity, and carbon emission factor of cement or steel, respectively.
For the industrial production process, 5 carbon emission items were considered based on the IPCC guidelines and the actual conditions in Wuhan. The corresponding carbon emission factors from the IPCC guidelines for national greenhouse gas inventories are shown in Table 3.

3.2.3. Disposal of Urban Domestic Refuse and Industrial Waste

Urban domestic refuse and industrial waste consist of both solids and liquids, such as industrial solid waste, clinical waste, domestic garbage, and domestic sewage. In this study, carbon emissions from domestic refuse and industrial waste were estimated based on the following formula:
C E D = Q k × α k
where C E D , Q k , and α k are the carbon emissions, quantity, and carbon emission factor from urban domestic refuse or industrial waste [28].
We considered 13 waste types based on the actual conditions in Wuhan and Table 4 lists the total carbon content for each waste type.

3.2.4. Transportation

The carbon emissions from transportation are a major source of urban greenhouse gas emissions and it is produced by the burning of diesel oil and gasoline by vehicles. The carbon emissions from traffic are affected by many factors, such as the carbon content of fuels, energy efficiency, and vehicle-kilometers traveled. A previous study explored how urban form—for example, sprawl or infill development—impacts daily travel patterns and annual vehicle-kilometers traveled and their results on the carbon emissions of traffic [50]. Herein, we estimated carbon emissions of transportation based on vehicle-kilometers traveled, information on the carbon dioxide emissions generated by various vehicles for a 100-kilometer journey, the Blue Book of the Transportation Department, and the Statistical Yearbook. The formula is expressed, as follows:
C T = 12 44 × n ( N n × α n × L n )
where C T represents the quantity of CO2 emissions from transportation; and, α n , N n , and L n represent the quantity of CO2 emissions per 100 km, number of vehicles, and mileage per year from the i-th type, respectively.
Gasoline and diesel vehicles were considered for transportation carbon emissions. The quantity of CO2 emissions per 100 km was calculated using the carbon emission factors of gasoline and diesel oil that were obtained from the IPCC guidelines for national greenhouse gas inventories. Table 5 shows the CO2 emission factors of different vehicle types.

3.3. Net Carbon Emissions Estimate

The estimated carbon emissions represent the emissions of CO2 and the obtained carbon storages represent the absorption of CO2. However, the net carbon emissions estimate more directly represents the amount of CO2 emission [1]. The net carbon emissions refer to the net CO2 emissions, which were estimated based on the following formula:
NC = C Emission C Storage
where NC , C Emission , and C Storage are the net carbon emissions, total carbon emissions, and total carbon sink, respectively. The unit of these variables is tons.

4. Results

4.1. Carbon Storage

The CO2 storage capacities of different vegetation types vary significantly. The carbon density and carbon storage factor were used to assess the carbon storage capacities of different land covers and was represented as the carbon storage per unit area in Figure 3 for various land covers.
Figure 3 presents the carbon storage capacities of different types of land cover in Wuhan. Among all types of vegetation covers, the carbon storage capacity of forests was the largest, followed by croplands, gardens, and grasslands in order. In terms of the carbon pools of different forest types, bamboo showed the largest carbon storage capacity (approximately 91.05 tons/ha), whereas the shrub cover exhibited the smallest carbon storage capacity (9.98 tons/ha).
Capitalizing on a coefficient approach based on factors such as land cover geo-information and carbon storage factors, carbon storage was successfully estimated, as presented in Table 6.
Table 6 lists the calculated carbon storage of different carbon pools, including coniferous forests, broadleaf forests, mixed coniferous/broadleaf forests, shrub forests, bamboo forests, greening woodlands, artificial young forests, grasslands, croplands, and gardens. The total carbon storage decreased from 5,169,400 t in 2015 to 5,030,100 t in 2017. The reduction in forests was shown to be the most significant contributor to the decrease in carbon storage, and carbon storage of shrubs underwent the most significant decrease of 104,100 tons during this period, followed by a decrease of 39,500 tons in coniferous forests. In addition, the carbon storage of gardens decreased by 14,400 tons. In contrast, the carbon storage of grasslands and croplands increased by 23,300 and 10,000 tons, respectively. However, the contribution of grasslands and croplands to carbon storage is minimal when compared to those of forests and gardens.
To provide a basis for decision-making and management for governments engaged in the construction of low-carbon cities, the carbon storage was spatialized by streets (181) and districts (16) in the study area. To map the changes in carbon storage in the urban ecosystems of Wuhan, we produced an annual difference map of carbon storage from 2015 to 2017 and current carbon storage map in 2017, as presented in Figure 4.
Figure 4a–c show the spatial distribution of carbon storage changes from 2015 to 2017 at the street-block level. As can been in Figure 4a, most of the carbon storage in Wuhan decreased from 2015 to 2016. The changes vary between −16,200 tons and 2600 tons, depending on the street block. Though the total carbon storage still showed a downward trend from 2016 to 2017, some blocks showed a significant increase in the carbon stock, as shown in Figure 4b, especially in the downtown area and outer ring of the city. The carbon storage changes of the street-blocks varied between −12,200 tons and 10,500 tons in the past three years, and the overall trend is still declining (Figure 4c). The results in Figure 4d show the spatial distribution of carbon storage of Wuhan in 2017. The differences in the carbon storage grades in Wuhan are circularly distributed from the center to the epitaxial radiation. The closer to the city center, the smaller the carbon storage (the lighter the color); and, vice versa. The largest carbon stores are located in the mountainous areas of northwestern Wuhan, which mainly consist of forests with less interference when compared to those of other areas. The lowest carbon storage areas are mainly found in the central urban area, which may be due to severe disturbances by human activities.

4.2. Carbon Emissions

The carbon emissions of Wuhan were estimated based on an emission-factor approach using the GNCD, traffic data, and Statistical Yearbooks. Similarly, carbon emissions were obtained and summed from all the different carbon sources, as presented in Table 7.
Table 7 shows the carbon emissions from different carbon sources, including industry, agricultural production, urban domestic regions, and transportation. The total carbon emissions of Wuhan increased by 211,600 tons from 2015 to 2016, and subsequently decreased by 3,188,300 tons from 2016 to 2017. The main reason for the initial increase was the rise in carbon emissions from urban life and transportation, whereas the decrease was mainly due to reduced carbon emissions from industry and agriculture. In addition, the carbon emissions from industry and agriculture decreased during the three-year period. In contrast, the carbon emissions from urban domestic regions and transportation increased, which is likely due to the continuous expansion of the city and population growth.
The spatialization of carbon emission changes based on administrative divisions is significant for clarifying responsibilities in terms of direct emissions. In this study, a spatial statistical analysis based on the counted carbon emission changes and GNCD was conducted. The final spatial distribution of carbon emission changes is presented in Figure 5.
Figure 5a–c display the spatial distribution of the carbon emission changes from 2015 to 2017 at the street-block level. During this period, the total carbon emissions first increased and subsequently decreased. The number of blocks with increased carbon emissions is greater than the number of blocks with reduced carbon emissions from 2015 to 2016, as shown in Figure 5a. The changes vary between −1,861,000 and 1,130,600 tons. It is clear from Figure 5b, though the total carbon emissions showed a downward trend from 2016 to 2017, the carbon emissions increased significantly in central and Northern Wuhan. Carbon emissions in the central urban areas declined from 2015 to 2017, and the spatial distribution of the carbon emission changes is similar to the changes from 2016 to 2017. The results in Figure 5d show the spatial distribution of the carbon emissions of Wuhan in 2017. According to the spatialization results, the carbon emissions from urban centers are small, and they gradually increase going outward.

4.3. Net Carbon Emissions

To directly evaluate the amount of CO2 emissions, the net carbon emissions of Wuhan from 2015 to 2017 were estimated using Equation (7), and the details are illustrated in Figure 6.
As can be seen from Figure 6, the net carbon emissions increased by 323,700 tons from 2014 to 2015 and they were reduced by 3,161,100 tons from 2015 to 2016. The net carbon emissions decreased sharply in 2017, due to the reduction in carbon emissions from industry and agriculture. This also indicates that the energy conservation and emission reduction strategies in Wuhan were properly implemented. The final net carbon emission change maps are presented in Figure 7.
Figure 7 shows the spatial distribution of the net carbon emission changes from 2015 to 2017 at the street-block level of Wuhan. As can be seen from Figure 7a, the net carbon emissions in most areas increased from 2015 to 2016, especially in the south-central part of the city. The difference in the changes between different regions is significant from 2016 to 2017 (Figure 7b). The net carbon emissions in the central urban area decreased most drastically, and the net carbon emissions in the outer ring increased most extensively, especially in the north of the city. The net carbon emission changes from 2015 to 2017 were similar to those from 2016 to 2017 (Figure 7c). The results in Figure 7d show the spatial distribution of net carbon emission in 2017. The net carbon emissions of the central and outer ring of the city are the lowest and the net carbon emissions of the outer ring near the central city are the largest.

4.4. Uncertainties

Carbon emissions and carbon storage were estimated using GNCD in Wuhan, China and they included some uncertainties. The uncertainty for all CECS were estimated by combining the uncertainties in activity data, carbon factor, or the CECS estimate for a specific category [28]. However, uncertainties regarding the quantity of activity data in this study are not available. Therefore, it is difficult to estimate the uncertainty of the entire CECS measurement and were estimated based on previous studies.
The uncertainty in the total carbon storage arose mainly from the uncertainties in carbon storage estimates of the forest, grassland, cropland, and gardens. The uncertainty in the forest carbon storage estimates originated from the uncertainties in forest inventory and the use of carbon factors to estimate the regional carbon pool. In general, the uncertainty of the forest inventory data is small, ˂5% in China [51] and the uncertainty for carbon storage estimated using the carbon factor method is ˂3% [52]. The uncertainties from different sources are complex and it is difficult to provide an accurate estimate [53]. The uncertainty of the grass carbon storage estimate mainly arises from the uncertainties of the grass inventory and grass biomass estimated based on remote sensing data [46]. The uncertainty for the grass inventory data is ˂10% [47] and the uncertainty of the grass biomass that is estimated by remote sensing data is approximately 35.6% [48]. For the carbon storage estimate uncertainties of cropland and garden, very little measurement data is available, making it difficult to perform an accurate assessment of carbon storages.
Few studies have addressed the inherent uncertainty of estimating carbon emissions [33,54,55]. The uncertainty of carbon emission estimation arises from the uncertainties in the carbon emission activity data, emission factors, and carbon emissions for each category. However, the uncertainty of the carbon emission factor is considered to be the main source of the entire carbon emissions measurement uncertainty, as no available uncertainty of the activity data is available. The contributions of different factors to the uncertainty of the carbon emission factors are summarized in Section 3.

5. Discussion

5.1. Decrease in Carbon Storage and Possible Causes

The carbon storage estimations indicate that the carbon pools in Wuhan have decreased due to the reduction in forests, grasslands, croplands, and gardens. Moreover, the carbon storage that was provided by forests and gardens played a significant role in the reduction of carbon storage. The forest carbon decreased for all forest types with the exception of mixed forests. The reduced carbon storage of forests and gardens can be attributed to the rapid growth of the economy and population, resulting in the expansion of urban construction and continuous reduction in other types of land cover. This is consistent with the report of Zhang, et al. [56], which demonstrated that most of the large carbon sequestration patches disappeared as a result of urban expansion. In addition, the carbon storage of grasslands and croplands increased from 2015 to 2017, which provided a small contribution to the total carbon storage of Wuhan. Moreover, the carbon pools from forests, grasslands, croplands, and gardens play an important role in the urban ecosystem, because they beautify the urban environment, absorb CO2, and purify the air. However, the total carbon storage of these carbon pools is significantly smaller than the amount of carbon emissions in Wuhan. Therefore, specific urban planning should be performed to enhance the CO2 fixation capacities of urban green areas, which is an effective method for reducing the amount of CO2 [17,18].

5.2. Differences in Carbon Storage per Vegetation Cover Type

For improved urban planning, the carbon storage capacity of each urban vegetation type was also evaluated for the improvement of CO2 fixation in urban ecosystems. Moreover, the evaluation of the carbon storage capacities of different vegetation covers is important for urban ecosystems, to select appropriate urban greening vegetation types in urban planning. For example, increasing the number and/or size of forests in high-carbon emissions areas is an important carbon sequestration strategy, and several scholars have developed methods to increase the forest area or species selection, increasing the overall carbon storage [57].

5.3. Changes in Carbon Emissions and Possible Causes

According to the carbon estimations (Table 7), the total carbon emissions initially increased and subsequently decreased from 2015 to 2017. The carbon emissions from industry and agriculture decreased during this period, which can be attributed to a reduction in energy consumption intensity and optimization of the energy infrastructure [58]. In addition, the rapid expansion of urban regions has resulted in the disappearance of croplands, which caused a decrease in agricultural-related carbon emissions. In contrast, the carbon emissions that were generated by urban domestic regions and transportation increased from 2015 to 2017, mainly due to economic development and population growth. For total carbon emissions (Table 2), industrial carbon emissions are the largest contributors, accounting for 54–60%, followed by urban living carbon emissions, which account for 37–42% of the total. Agricultural carbon emissions are the smallest, accounting for only 0.17–0.19% of the total in Wuhan. In addition, the remainder consisted of traffic carbon emissions, which accounted for approximately 3.1–3.7% of the total carbon emissions. Moreover, population expansion and urban sprawl are inevitable trends in the development of Wuhan, which indicate that the proportion of carbon emissions from urban domestic and transportation will likely continue to increase. Therefore, these data should be part of any potential urban planning improvements or greenhouse gas mitigation strategies—for example, reducing the intensity of energy consumption, addressing cases of extreme congestion, and optimizing the energy structure [4,5].

5.4. Changes in Net Carbon Emissions and Possible Causes

The trend of the changes in the net carbon emissions is similar to that of the carbon sources from 2015 to 2017, both of which initially increased and subsequently decreased. As can be seen from the net carbon sources results (Figure 7), the carbon emissions greatly exceed carbon storage, which indicates a significant imbalance in the carbon budget of the urban ecosystem. This is consistent with the study of Zhang, Linlin, and Weining [56], who investigated the spatial patterns of urban carbon metabolism in Beijing, showing that the carbon emissions were larger than the corresponding carbon storage by a factor of 48.6. When compared to other carbon sources, industrial energy consumption emitted the most CO2, followed by that of urban domestic regions. This can be attributed to the growth of the economy and population of Wuhan [58]. Although the total carbon storage of Wuhan increased from 2015 to 2017, its contribution to net urban carbon emissions was negligible. Moreover, forests, grasslands, croplands, and gardens play an important role in the urban ecosystem [1], as they absorb CO2 from the atmosphere and afforested environment. According to the net carbon emissions in Wuhan and the possible causes, it can be concluded that the reasonable control of urban population growth, gradual optimization of the energy infrastructure, and rational planting of urban vegetation can effectively reduce net carbon emissions.

6. Conclusions

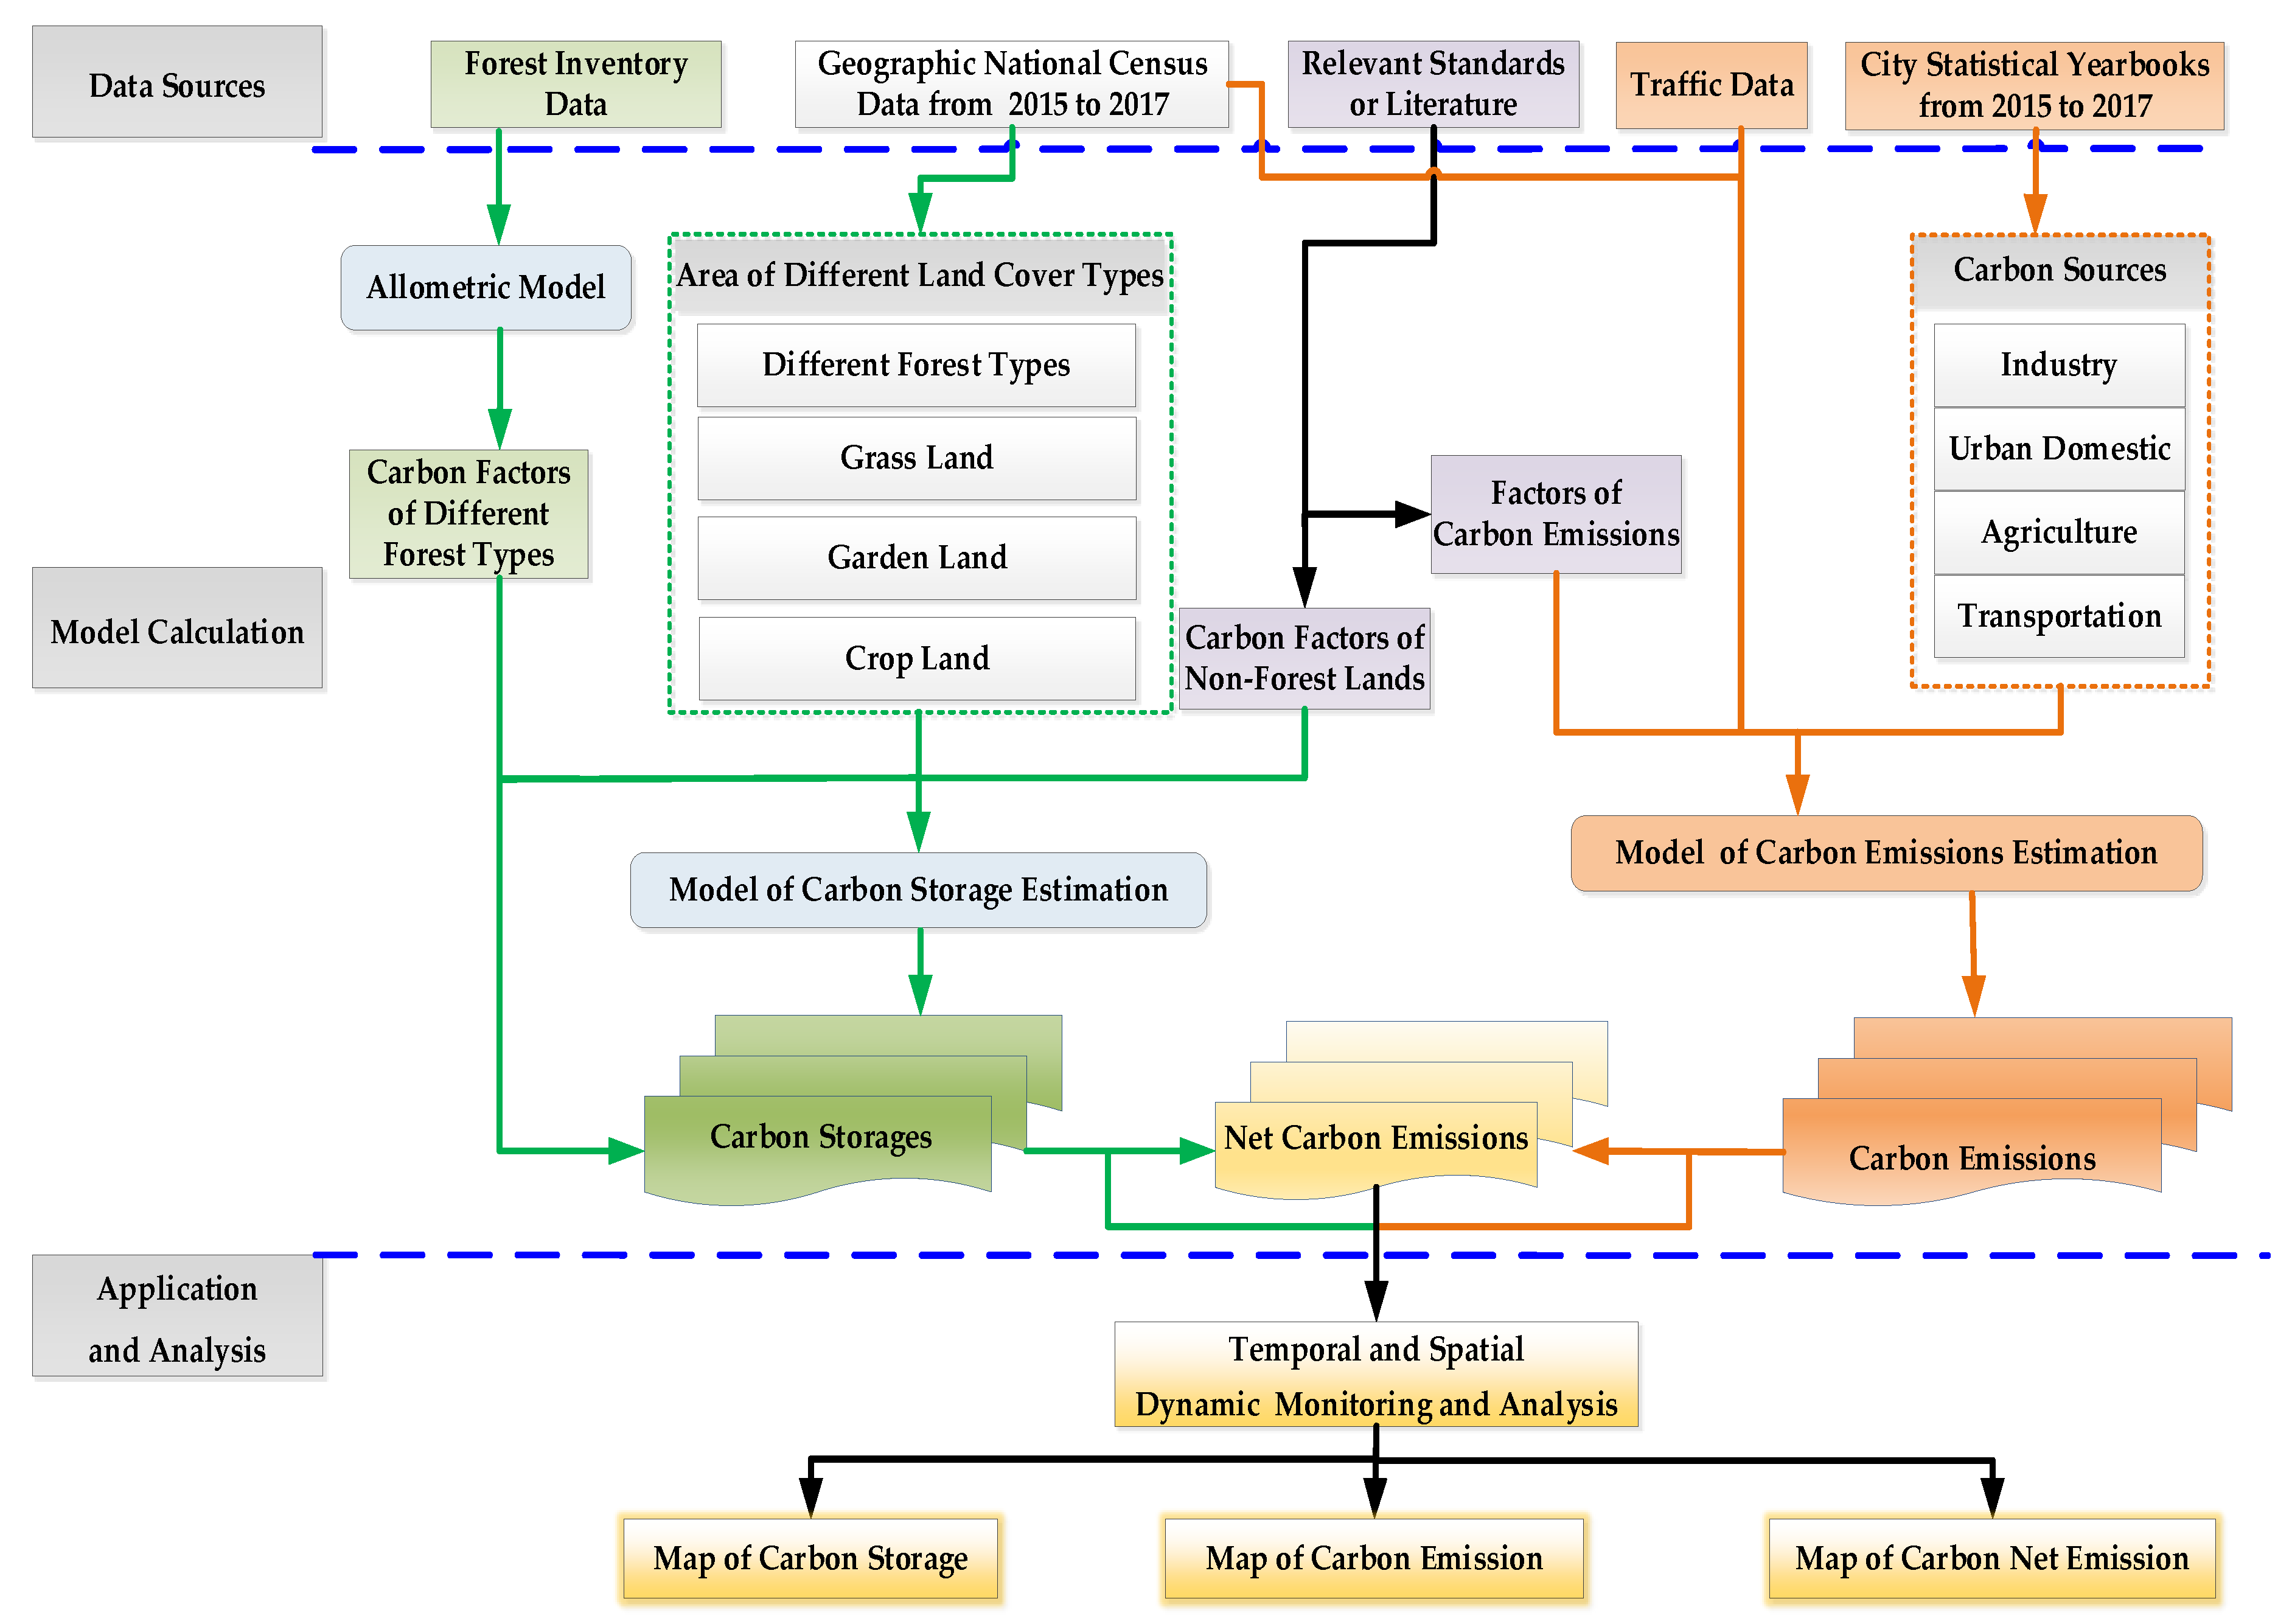
In this study, a framework was developed to estimate carbon emissions, carbon storage, and associate spatiotemporal changes in the urban ecosystem. The GNCD combined with factors affecting carbon emissions and carbon storage was successfully used to obtain the temporal and spatial carbon budget changes in an urban setting. The methods for estimating carbon storage and inventorial carbon emission factors provided by the IPCC guidelines for national greenhouse gas inventories in 2006 can be easily applied to other cities. Urban land use changes and carbon dynamics are important for the global carbon cycle [59]. The land use change data can be obtained from the annually updated GNCD and it offers a possibility for estimation of a carbon budget at the national or large region scale.
Studies regarding the carbon budget of urban regions can offer significant insights for governments that are engaged in decision-making processes with respect to the urban carbon cycle, given that the growth of the population and economy in urban ecosystems has a significant effect on the CECS. Understanding the balance between carbon sources and carbon pools in urban ecosystems can offer insights into mitigation of the impact of CO2 in the atmosphere. The urban carbon cycle, the carbon storage abilities of different vegetation, and changes in land use are complicated. A significant amount of future studies will be required to improve the estimation results. In this study, the carbon budget monitoring-time was short, given that the newly created GNCD was completed in 2015. With the accumulated GNCD for each year, the annual CECS in cities or blocks can be monitored with high-precision and at a small-scale. In addition, only the main carbon sources and carbon pools of Wuhan were considered in this study, and the contribution of other carbon sources and storages, such as human respiration, soil, and water, were not investigated. By considering carbon budgets more comprehensively, a more accurate estimation can be mapped.

Author Contributions

Y..L, X.H., and J.G. designed research, wrote the paper and discussed it together. H.W., A.Z., and J.F. designed research, collected data, and calculated the results.

Funding

This work was partially supported by the research funding by Guangzhou Science, Technology and Innovation Commission (Project No. 201802030008), the National Key Research and Development Program of China (Project No 2017YFB0503700, 2016YFB0501403).

Conflicts of Interest

The authors declare no conflict of interest.

References

  1. Zhang, W.T.; Huang, B.; Luo, D. Effects of land use and transportation on carbon sources and carbon sinks: A case study in shenzhen, china. Landsc. Urban Plan. 2014, 122, 175–185. [Google Scholar] [CrossRef]
  2. Sullivan, P. Energetic cities: Energy, environment and strategic thinking. World Policy J. 2011, 27, 11–13. [Google Scholar] [CrossRef] [PubMed]
  3. Vaccari, F.P.; Gioli, B.; Toscano, P.; Perrone, C. Carbon dioxide balance assessment of the city of florence (italy), and implications for urban planning. Landsc. Urban Plan. 2013, 120, 138–146. [Google Scholar] [CrossRef]
  4. Reckien, D.; Ewald, M.; Edenhofer, O.; Liideke, M.K.B. What parameters influence the spatial variations in CO2 emissions from road traffic in berlin? Implications for urban planning to reduce anthropogenic CO2 emissions. Urban Stud. 2007, 44, 339–355. [Google Scholar] [CrossRef]
  5. Silaydin Aydin, M.B.; Çukur, D. Maintaining the carbon–oxygen balance in residential areas: A method proposal for land use planning. Urban For. Urban Green. 2012, 11, 87–94. [Google Scholar] [CrossRef]
  6. Nowak, D.J.; Crane, D.E.; Stevens, J.C. Air pollution removal by urban trees and shrubs in the United States. Urban For. Urban Green. 2006, 4, 115–123. [Google Scholar] [CrossRef] [Green Version]
  7. Morani, A.; Nowak, D.J.; Hirabayashi, S.; Calfapietra, C. How to select the best tree planting locations to enhance air pollution removal in the milliontreesnyc initiative. Environ. Pollut. 2011, 159, 1040–1047. [Google Scholar] [CrossRef] [PubMed]
  8. Paoletti, E.; Bardelli, T.; Giovannini, G.; Pecchioli, L. Air quality impact of an urban park over time. Procedia Environ. Sci. 2011, 4, 10–16. [Google Scholar] [CrossRef]
  9. Tallis, M.; Taylor, G.; Sinnett, D.; Freer-Smith, P. Estimating the removal of atmospheric particulate pollution by the urban tree canopy of london, under current and future environments. Landsc. Urban Plan. 2011, 103, 129–138. [Google Scholar] [CrossRef]
  10. Zhang, J.; Liu, J.; Zhai, L.; Hou, W. Implementation of geographical conditions monitoring in beijing-tianjin-hebei, china. ISPRS Int. J. Geo-Inf. 2016, 5, 89. [Google Scholar] [CrossRef]
  11. Dong, J.; Kaufmann, R.K.; Myneni, R.B.; Tucker, C.J.; Kauppi, P.E.; Liski, J.; Buermann, W.; Alexeyev, V.; Hughes, M.K. Remote sensing estimates of boreal and temperate forest woody biomass: Carbon pools, sources, and sinks. Remote Sens. Environ. 2003, 84, 393–410. [Google Scholar] [CrossRef]
  12. Asner, G.P.; Powell, G.V.N.; Mascaro, J.; Knapp, D.E.; Clark, J.K.; Jacobson, J.; Kennedy-Bowdoin, T.; Balaji, A.; Paez-Acosta, G.; Victoria, E.; et al. High-resolution forest carbon stocks and emissions in the amazon. Proc. Natl. Acad. Sci. USA 2010, 107, 16738. [Google Scholar] [CrossRef] [PubMed]
  13. Li, H.; Song, S.; Wang, G.; Gu, J. Comprehensive statistical analysis study based on national geographic condition survey data: The case of bei’an agricultural farmland as the pilot area. Geomat. Spat. Inf. Technol. 2014, 37, 137–139. [Google Scholar]
  14. Godwin, C.; Chen, G.; Singh, K.K. The impact of urban residential development patterns on forest carbon density: An integration of lidar, aerial photography and field mensuration. Landsc. Urban Plan. 2015, 136, 97–109. [Google Scholar] [CrossRef]
  15. McPherson, E.G.; Xiao, Q.; Aguaron, E. A new approach to quantify and map carbon stored, sequestered and emissions avoided by urban forests. Landsc. Urban Plan. 2013, 120, 70–84. [Google Scholar] [CrossRef] [Green Version]
  16. Wylie, B.K.; Howard, D.; Dahal, D.; Gilmanov, T.; Ji, L.; Zhang, L.; Smith, K. Grassland and cropland net ecosystem production of the U.S. Great Plains: Regression tree model development and comparative analysis. Remote Sens. 2016, 8, 944. [Google Scholar] [CrossRef]
  17. Zhao, T.; Brown, D.G.; Bergen, K.M. Increasing gross primary production (gpp) in the urbanizing landscapes of southeastern Michigan. Photogramm. Eng. Remote Sens. 2007, 73, 1159–1167. [Google Scholar] [CrossRef]
  18. Golubiewski, N.E. Urbanization increases grassland carbon pools: Effects of landscaping in Colorado’s front range. Ecol. Appl. 2006, 16, 555–571. [Google Scholar] [CrossRef]
  19. Grimm, N.B.; Faeth, S.H.; Golubiewski, N.E.; Redman, C.L.; Wu, J.; Bai, X.; Briggs, J.M. Global change and the ecology of cities. Science 2008, 319, 756. [Google Scholar] [CrossRef]
  20. Alberti, M.; Marzluff, J.M. Ecological resilience in urban ecosystems: Linking urban patterns to human and ecological functions. Urban Ecosyst. 2004, 7, 241–265. [Google Scholar] [CrossRef]
  21. Pataki, D.E.; Alig, R.J.; Fung, A.S.; Golubiewski, N.E.; Kennedy, C.A.; McPherson, E.G.; Nowak, D.J.; Pouyat, R.V.; Romero Lankao, P. Urban ecosystems and the north american carbon cycle. Glob. Chang. Biol. 2006, 12, 2092–2102. [Google Scholar] [CrossRef]
  22. Kellett, R.; Christen, A.; Coops, N.C.; van der Laan, M.; Crawford, B.; Tooke, T.R.; Olchovski, I. A systems approach to carbon cycling and emissions modeling at an urban neighborhood scale. Landsc. Urban Plan. 2013, 110, 48–58. [Google Scholar] [CrossRef]
  23. Hunt, J.D.; Kriger, D.S.; Miller, E.J. Current operational urban land-use–transport modelling frameworks: A review. Transport Rev. 2005, 25, 329–376. [Google Scholar] [CrossRef]
  24. Bi, J.; Zhang, R.; Wang, H.; Liu, M.; Wu, Y. The benchmarks of carbon emissions and policy implications for China’s cities: Case of Nanjing. Energy Policy 2011, 39, 4785–4794. [Google Scholar] [CrossRef]
  25. Wang, H.; Zhang, R.; Liu, M.; Bi, J. The carbon emissions of Chinese cities. Atmos. Chem. Phys. 2012, 12, 6197–6206. [Google Scholar] [CrossRef]
  26. Baldasano, J.M.; Soriano, C.; Boada, L.S. Emission inventory for greenhouse gases in the city of Barcelona, 1987–1996. Atmos. Environ. 1999, 33, 3765–3775. [Google Scholar] [CrossRef]
  27. D’Avignon, A.; Carloni, F.A.; Rovere, E.L.L.; Dubeux, C.B.S. Emission inventory: An urban public policy instrument and benchmark. Energy Policy 2010, 38, 4838–4847. [Google Scholar] [CrossRef]
  28. Eggleston, H.S.; Buendia, L.; Miwa, K.; Ngara, T.; Tanabe, K. IPCC Guidelines for National Greenhouse Gas Inventories; IPCC: Yokohama, Japan, 2006. [Google Scholar]
  29. Nemitz, E.; Hargreaves, K.J.; McDonald, A.G.; Dorsey, J.R.; Fowler, D. Micrometeorological measurements of the urban heat budget and CO2 emissions on a city scale. Environ. Sci. Technol. 2002, 36, 3139–3146. [Google Scholar] [CrossRef] [PubMed]
  30. Crawford, B.; Christen, A. Spatial source attribution of measured urban eddy covariance CO2 fluxes. Theor. Appl. Climatol. 2015, 119, 733–755. [Google Scholar] [CrossRef]
  31. Soegaard, H.; Møller-Jensen, L. Towards a spatial CO2 budget of a metropolitan region based on textural image classification and flux measurements. Remote Sens. Environ. 2003, 87, 283–294. [Google Scholar] [CrossRef]
  32. Clark, J.R.; Matheny, N.P.; Cross, G.; Wake, V. A model of urban forest sustainability. J. Arboricult. 1997, 23, 17–30. [Google Scholar]
  33. Houghton, R.A.; House, J.I.; Pongratz, J.; van der Werf, G.R.; DeFries, R.S.; Hansen, M.C.; Le Quéré, C.; Ramankutty, N. Carbon emissions from land use and land-cover change. Biogeosciences 2012, 9, 5125–5142. [Google Scholar] [CrossRef] [Green Version]
  34. Brovkin, V.; Boysen, L.; Arora, V.K.; Boisier, J.P.; Cadule, P.; Chini, L.; Claussen, M.; Friedlingstein, P.; Gayler, V.; van den Hurk, B.J.J.M.; et al. Effect of anthropogenic land-use and land-cover changes on climate and land carbon storage in cmip5 projections for the twenty-first century. J. Clim. 2013, 26, 6859–6881. [Google Scholar] [CrossRef]
  35. Yang, R.; Dong, C.; Zhang, Y. Method of population spatialization under the support of geographic national conditions data. Sci. Surv. Mapp. 2017, 42, 76–81. [Google Scholar]
  36. Jiang, L.; Liu, H. Geographical conditions census data in forest land monitoring application research. Geomat. Spat. Inf. Technol. 2017, 40, 127–129. [Google Scholar]
  37. National Bureau of Statistical. Wuhan Statistical Yearbook; China Statistics Press: Beijing, China, 2017.
  38. National Bureau of Statistical. Wuhan Statistical Yearbook; China Statistics Press: Beijing, China, 2016.
  39. National Bureau of Statistical. Wuhan Statistical Yearbook; China Statistics Press: Beijing, China, 2015.
  40. CFSDC. China forestry science data center. Available online: http://www.cfsdc.org/ (accessed on 23 June 2017).
  41. Liang, S.; Li, X.; Wang, J. Advanced Remote Sensing: Terrestrial Information Extraction and Applications; Academic Press: Cambridge, MA, USA, 2012. [Google Scholar]
  42. Zhu, X.; Liu, D. Improving forest aboveground biomass estimation using seasonal landsat ndvi time-series. ISPRS J. Photogramm. Remote Sens. 2015, 102, 222–231. [Google Scholar] [CrossRef]
  43. Hakkila, P. Utilization of residual forest biomass. In Utilization of Residual Forest Biomass; Hakkila, P., Ed.; Springer: Berlin/Heidelberg, Germany, 1989; pp. 352–477. [Google Scholar]
  44. Murillo, J.C.R. Temporal variations in the carbon budget of forest ecosystems in Spain. Ecol. Appl. 1997, 7, 461–469. [Google Scholar] [CrossRef]
  45. Brown, S.L.; Schroeder, P.; Kern, J.S. Spatial distribution of biomass in forests of the eastern USA. For. Ecol. Manag. 1999, 123, 81–90. [Google Scholar] [CrossRef]
  46. Fang, J.; Guo, Z.; Piao, S.; Chen, A. Estimation of carbon sequestration of terrestrial vegetation in china during 1981~2000. Sci. China Press 2007, 37, 804–812. [Google Scholar]
  47. Department of Animal Husbandry and Veterinary Medicine. Rangeland Resources of China; China Science and Technology Press: Beijing, China, 1996.
  48. Piao, S.; Fang, J.; He, J.; Yu, X. Spatial distribution of grassland biomass in China. Chin. J. Plant Ecol. 2004, 4, 491–498. [Google Scholar]
  49. Guan, D.; Chen, Y.; Huang, F. The storage and distribution of carbon in urban vegetation and its roles in balance of carbon and oxygen in Guangzhou. China Environ. Sci. 1998, 18, 437–441. [Google Scholar]
  50. Hankey, S.; Marshall, J.D. Impacts of urban form on future us passenger-vehicle greenhouse gas emissions. Energy Policy 2010, 38, 4880–4887. [Google Scholar] [CrossRef]
  51. Fang, J.Y.; Chen, A.P.; Peng, C.; Zhao, S.; Ci, L. Changes in Forest Biomass Carbon Storage in China between 1949 and 1998. Science 2001, 292, 2320–2322. [Google Scholar] [CrossRef] [PubMed]
  52. Fang, J.; Chen, A. Dynamic forest biomass carbon pools in china and their significance. Bull. Bot. 2001, 43, 967–973. [Google Scholar]
  53. Brown, S.; Schroeder, P. Spatial patterns of aboveground production and mortality of woody biomass for eastern us forests. Ecol. Appl. 1999, 9, 968–980. [Google Scholar]
  54. Houghton, R.A. Aboveground forest biomass and the global carbon balance. Glob. Chang. Biol. 2005, 11, 945–958. [Google Scholar] [CrossRef]
  55. Ramankutty, N.; Gibbs, H.K.; Achard, F.; Defries, R.; Foley, J.A.; Houghton, R.A. Challenges to estimating carbon emissions from tropical deforestation. Glob. Chang. Biol. 2006, 13, 51–66. [Google Scholar] [CrossRef]
  56. Zhang, Y.; Linlin, X.; Weining, X. Analyzing Spatial Patterns of Urban Carbon Metabolism: A Case Study in Beijing, China. Landsc. Urban Plan. 2014, 130. [Google Scholar] [CrossRef]
  57. Schulp, C.J.E.; Nabuurs, G.-J.; Verburg, P.H. Future carbon sequestration in europe—Effects of land use change. Agric. Ecosyst. Environ. 2008, 127, 251–264. [Google Scholar] [CrossRef]
  58. Yang, W.; Wang, B.; Xiang, D.; Lu, T.; Yu, J.; Sun, L. Study on decomposition and low-carbon development of energy consumption in Wuhan. China Popul. Resour. Environ. 2018, 28, 13–16. [Google Scholar]
  59. Hutyra, L.R.; Yoon, B.; Hepinstall-Cymerman, J.; Alberti, M. Carbon consequences of land cover change and expansion of urban lands: A case study in the seattle metropolitan region. Landsc. Urban Plan. 2011, 103, 83–93. [Google Scholar] [CrossRef]
Figure 1. Overview of the study site. The left is the true color image of the research area and its geographic location in Hubei Province and China is shown in the bottom-right and top-right outlined in red.
Ijgi 08 00007 g001
Figure 2. A methodological framework for the carbon emissions and carbon storage (CECS) estimation.
Ijgi 08 00007 g002
Figure 3. Carbon storage capacities of different vegetation types in Wuhan. Where the Coniferous Forest (CF), Broadleaf Forest (BF), Mixed Coniferous and Broadleaf Forest (MCB), Shrub Forest (SF), Bamboo Forest (BAF), Greening Woodland (GW), Artificial Young Forest (AYF), Grassland (GL), Cropland (CL), and Garden Land (GAL). SUM represents the total carbon storage of Wuhan in different years.
Ijgi 08 00007 g003
Figure 4. Spatial distribution of carbon storage changes from 2015 to 2017. (ac) are the spatial distribution of annual difference map for carbon storage changes from 2015 to 2016, 2016 to 2017, and 2015 to 2017, respectively; (d) is the spatial distribution map of carbon storage in 2017.
Ijgi 08 00007 g004
Figure 5. Spatial distribution of carbon emission changes from 2015 to 2017. (ac) are the spatial distribution of annual difference map for carbon emission changes from 2015 to 2016, 2016 to 2017, and 2015 to 2017, respectively; (d) is the spatial distribution map of carbon emission in 2017.
Ijgi 08 00007 g005
Figure 6. Total net carbon emissions for Wuhan from 2015 to 2017.
Ijgi 08 00007 g006
Figure 7. Spatial distribution of net carbon emission from 2015 to 2017. (ac) are the spatial distribution of annual difference map for net carbon emission changes from 2015 to 2016, 2016 to 2017, and 2015 to 2017, respectively; (d) is the enlarged spatial distribution map of net carbon emission in 2017.
Ijgi 08 00007 g007aIjgi 08 00007 g007b
Table 1. The carbon factors of different forest types in Wuhan (t/ha).
Forest TypesCarbon Factor (t/ha)SD
CF18.634.53
BF27.004.12
MCB21.754.97
SF10.571.28
BAF91.055.91
GW40.445.62
AYF9.981.13
Note: SD (Standard deviation), CF (coniferous forests), BF (broadleaf forests), MCB (mixed coniferous and broadleaf forests), SF (shrub forests), BAF (bamboo forests), GW (greening woodlands), AYF (artificial young forests).
Table 2. Carbon emission factors for each fuel type.
Fuel Type DescriptionCarbon Emission Factor (t/t)LowerUpper
Crude Oil0.850.780.92
Coke0.820.660.98
Liquefied Petroleum Gases0.810.750.93
Anthracite0.720.560.89
Coking Coal0.730.570.86
Coal Tar0.620.261.43
Natural Gas0.730.690.80
Gas Works Gas0.470.201.16
Coke Oven Gas0.470.201.16
Blast Furnace Gas0.170.070.42
Oxygen Steel Furnace Gas0.350.150.83
Gasoline0.840.780.89
Diesel Oil0.870.820.88
Table 3. Carbon content for each industrial product type.
Industrial Product Type DescriptionCarbon Emission Factors (t/t)Uncertainty
Cement0.524.50%
Lime0.752.00%
Glass0.202.00%
Iron1.355.00%
Steel1.465.00%
Table 4. Carbon content for each waste type.
Waste Type DescriptionTotal Carbon Content (%)Uncertainty/Range
Industrial waste5040%
Clinical waste6040%
Domestic Sewage4540%
Fossil liquid waste8040%
Domestic solid wastePaper/cardboard4642–50
Textiles5025–50
Food waste3820–50
Wood5046–54
Garden and park waste4945–55
Nappies7054–90
Rubber and leather6767
Plastics7567–85
Other, inert waste30–5
Table 5. Carbon emission factors for each vehicle type.
Vehicle Type DescriptionCO2 Emission Factor (kg/100 km)LowerUpper
Large gasoline vehicle29.0326.9630.76
medium gasoline vehicle20.1018.6621.29
small gasoline vehicle16.7515.5517.74
Large diesel vehicle23.4022.0523.66
medium diesel vehicle17.7516.7317.95
small diesel vehicle14.2513.4314.42
Table 6. The carbon storage of different vegetation types in Wuhan from 2015 to 2017. (×106 t).
Vegetation Types201520162017
CF1.32921.29811.2897
BF0.13880.14730.1371
MCB1.161.14111.1804
SF1.08831.02830.9842
BAF0.21480.21140.2108
GW0.41110.39770.3837
AYF0.07420.07290.0723
GL0.42970.44130.453
CL0.01930.02260.0293
GAL0.3040.29650.2896
SUM5.16945.05735.0301
Note: CF (coniferous forests), BF (broadleaf forests), MCB (mixed coniferous and broadleaf forests), SF (shrub forests), BAF (bamboo forests), GW (greening woodlands), AYF (artificial young forests), GL (grasslands), CL (croplands), GAL (gardens).
Table 7. The carbon emissions from different carbon sources in Wuhan from 2015 to 2017.
YearCarbon Emissions (×106 t)
IndustryUrban DomesticTransportationAgricultureSUM
201561.471638.15463.17340.1900102.9896
201658.514741.11923.39310.1742103.2012
201754.009342.17173.66430.1676100.0129

