Article

A GIS-Based Web Approach for Serving Land Price Information

1
School of Environment Science and Spatial Informatics, China University of Mining and Technology, Daxue Road No.1, Xuzhou 221116, China
2
Department of Civil Engineering, Ryerson University, 350 Victoria St., Toronto, ON M5B 2K3, Canada
3
Low Carbon Energy Institute, China University of Mining and Technology, Daxue Road No.1, Xuzhou 221116, China
*
Author to whom correspondence should be addressed.
ISPRS Int. J. Geo-Inf. 2015, 4(4), 2078-2093; https://doi.org/10.3390/ijgi4042078
Submission received: 30 August 2015 / Revised: 7 October 2015 / Accepted: 12 October 2015 / Published: 19 October 2015
(This article belongs to the Special Issue Bridging the Gap between Geospatial Theory and Technology)

Abstract

:
Participants in the land market are usually hampered to browse and analyze the land price information due to the lack of information sources and available analysis tools. A service-oriented GIS-based web system was developed to provide a practical solution, its essential data sources contain basic geographic elements and benchmark land price (BLP)-related information. Core models for land price analysis were implemented, including land price index, spatial distribution, and parcel appraisal. The system was developed based on a four-level Browse Server (B/S) architecture using GIS and web service technologies, which enables the publishing, browsing, and analysis of the land price information via the Internet. With effective functionalities, the system has been employed in a project for updating BLP in a case study city located in China. The main advantage of the GIS-based web approach lies in its integration of spatial-temporal analysis models and web GIS technology, which allows more investors and administrators with limited domain knowledge to obtain further understanding on the change pattern and spatial distribution of land price by an online means. The experience in the case study city demonstrates that the approach has strong practicality for land price information services.

1. Introduction

Land and property transactions play significant roles in governments’ revenues and financial institutions’ banking policies, which is particularly the case for the developing countries with rapid urbanization and heavy reliance on land-based finance [1,2,3,4]. Land is a special kind of commodity, which cannot be moved from place to place. Before making judicious decisions to purchase or rent, investors and property brokers should carry out an analysis of the land market. On-the-spot gathering of the information about the basic condition of parcels, such as their price and location, is often costly [5,6]. Such transaction costs are indeed information costs and a fundamental impediment to land mobility [7,8]. Hence, there are great demands for land price information supply and deep processing. However, it is not an easy task to satisfy these demands by traditional information presentation means because land price is a kind of special geographical information which varies both spatially and temporally [9,10,11,12].
Providing information sources is one of the crucial aspects for reducing transaction costs. Many municipalities and governments gather and store information related to the use, the ownership, and the value of the land using cadaster and land registry [13,14,15]. Traditionally, the public can access such information by an inefficient means, delving into archives. Some more effective information technologies have been applied to improve this situation. Since 1986, databases have been used to store all land properties. London and Toronto began e-registration in 1999, which has since been adopted by many developing countries with the development of information communications technology [16,17,18,19,20]. Although many information systems that aim at land monitoring and management have been built in recent years, only a few of them are specialized in providing urban land price information to the public. For example, the real estate information systems employed by local governments in many countries have been developed mainly to enhance information gathering and management [21,22,23]. Scholars in Germany have developed a GIS-based system that offers brokers information to support hotel room pricing [24]. A web page with GIS tools in Spain serves as an information platform for leasing rural land plots [25]. However, these research works indicate the importance of available information about land related transactions.
On the other hand, analysis tools are another aspect, which is of particular importance in land transactions. Considering that the value of property is primarily determined by its location [26], people realized the importance of geographical information system (GIS) techniques [27,28,29]. GIS provides not only a geo-database to store relevant data with spatial relationships, but also a visual representation of information. Land price research has long recognized GIS as an ideal tool for appraisal processes and spatial analysis [30,31,32,33]; for instance, creating land price maps by using spatial distribution models [31,32]. Although researchers can gain further understanding of the characteristics of urban land prices by these professional tools or systems installed on isolated computers, for general participants of the land market it is difficult to carry out land price analysis if they do not have access to such professional analysis tools.
Regarding land price services, both information sources and analysis tools are essential, given the geographical characteristics of land price. This paper presents a novel, GIS-based web approach that combines land price analysis models and web GIS technologies. Firstly, the functional requirements and core models of land price services are described based on the review of benchmark land price (BLP) and data sources. The architecture, development, and use cases of the system are then explained, followed by an application in a project entitled “Updating of BLP in Feng County (Jiangsu Province, China)”. The interactive web-based graphical user interfaces enables users to acquire land price information efficiently on the internet.

2. Backgrounds

The urban land market in China has been put into operation in recent years, in which land-use rights (LUR) of urban land (for each type of land use, generally including commercial, residential, industrial) can be transferred between land-users. Participants in the land market mainly include administrator, seller (state or existing user), buyer (new land-user), and brokers [34,35]. Land price (LUR’s price) may depend on private treaty, tender, auction or bargain under the evaluation of location and other conditions of land parcels. BLP refers to the average LUR’s price established within a specific time period in a particular area for a particular land use. It provides an important reference for the government macro-control premium, land use tax collection, setting base prices for the LUR of state-owned land transferred, appraisal of the land parcel, negotiation of land price between buyer and seller, and reasonable adjustment of land use structure [36,37].
Local land administrations regularly monitor land prices and update BLP so as to manage land pricing and ensure macro-economic regulation for land development activities and LUR transactions [38,39]. The information generated from these works is usually published by means of the Internet or public documents, which gives the participants opportunities to analyze and appraise the land price. Such work is recognized as an information base to support efficient land market operations and an important task of Chinese Land and Resources Information 12th Five-Year Plan aimed at improving the informationization level of the land market. Currently, there are two official websites, China Urban Land Price Dynamic Monitor (http://www.landvalue.com.cn/) [40] and Jiangsu Land Market Website (http://www.landjs.com/) [41], where people can browse land price information and some transaction cases in different cities via the Internet but without the support of GIS-based analysis tools.
Researchers concerning the establishment of the land market in China emphasized the importance of making information available to the public on a fee-for-service basis and the role of GIS, considering that the young land market with lacking transaction cases needs to be improved in a market mechanism [36,37,38,39]. Without effective information sources and available analysis tools, participants of the land market will be hampered to browse and analyze the land price, such as its change and distribution in different urban regions. Therefore, a service-oriented, land-price information system will be more helpful if it provides some analysis functions that perform online analysis of effectively published land price information. Literature study and the use requirements analysis of the actual project indicate some very basic needs for such a system. They are summarized as follows: (1) regular publishing of land price information with online map, especially the information generated from land price monitoring (LPM) and BLP updating, and (2) analysis of land price, including the land price index, spatial distribution modeling of land price, and appraisal of land parcels based on LPM and BLP.

3. Data Sources

According to China National Standards “Regulations for valuation on urban land (GB/T18508-2014)” and “Regulations for Gradation and Classification on Urban Land (GB/T18507-2001)”, after dividing a city into several homogenous regions, land price of these regions are appraised and graded to establish a land price system, called the benchmark land price (BLP). BLP is updated every three years. Meanwhile, in order to monitor the dynamics of the urban land price, a number of standard parcels are selected as monitoring points, and their prices are appraised quarterly. The information about BLP and those monitoring points, such as standard condition, correction coefficient, location, and other data are opened to the public. These data, in the form of digital or paper map and documents, can be collected from local land administrations. To organize these data, two geographic data sets have been established, benchmark land price and land price monitoring. Apart from these, basic geographic data and land use planning data are also taken into consideration for the purposes of online map services and land price analysis. Table 1 lists the data sets and their contents. The processing of map data includes digitizing paper maps and documents, unifying coordinate reference systems, and building a topological structure using GIS. Attribute data of each map features are stored in a relational database and linked to each graphic element. The established geo-database serves as the data source of land-price information service.
Table 1. Data sets for serving land price information.
Name of Data SetFeature LayersAttribute Data
Basic geographic dataRoad, river, topography, building, etc.Name, category, code, grade, etc.
Land use planningLand use situation, overall plan for land utilization, city planning.Land use type, city function zones, land use conditions, degree of development, etc.
Benchmark land priceBenchmark land price of commercial, residential, industrial land.Land price, grade, average condition, table of adjustment factors, appraisal time, etc.
Land price monitoringMonitoring points of commercial, residential, industrial land.Land use type, land price, location, tenure, ownership, appraisal time, etc.

4. Analysis Models

This section describes the analysis models that are used in building the proposed GIS-based, web land price information system.

4.1. Land Price Index

As mentioned above, the price of standard parcels are appraised quarterly so as to monitor the urban land price. This means that there is a long series of price figures for each monitoring point. The land price index (LPI) is employed for the purpose of detecting and comparing the change of land price of each point. As a relative indicator of the trend of land price, LPI is actually a ratio between two land prices at different appraisal times. Depending on the base appraisal time, there are two types of LPI, chain ( L P I c ), and fixed base ( L P I f ), can be determined by the formula in Equations (1) and (2) and the land price monitoring data sets, where P 0 , P t , and P t 1 are the land price of monitoring point at base, t, and t-1quarter, respectively.
L P I c = P t P t 1 × 100
L P I f = P t P 0 × 100

4.2. Spatial Distribution Model

In urban areas, it is not appropriate to use land price index to reflect the distribution of land price because land price index is in the form of point data instead of regional data. For different land use types (e.g., commercial, residential, and industrial), characterizing the spatial distribution is essential for understanding the structure of land price and predicting values for those areas without monitoring points [30,31]. Kriging is an interpolation technique of which the surrounding measured values are weighted to obtain a predicted value for an un-sampled location. It has been found that this technique has great advantages to analyze complex spatial land price distribution [42,43,44]. Equation (3) illustrates that the predicted value is a function of known values and their weights. Based on regionalized variable theory, the kriging technique assumes that the spatial variation in the data being modeled is homogeneous across the surface. That is, the same pattern of variation can be observed at all locations on the surface. In Equation (3), Z * ( x 0 ) and Z ( x i ) represent the predicted and the measured values (land price monitoring points) of land price at point x 0 and x i , respectively. λ i are the weights of the surrounding measured values, which are based on the distance between the measured points and the predicted points, and the overall spatial arrangement among the measured points. To obtain unbiased and optimal estimation of predicted values ( Z * ( x 0 ) ), there are two constrained conditions in Equation (4) that should be satisfied. The first one is that the sum of λ 1 , λ 2 , …, and λ i should be equal to 1, and the second is that the variance between Z ( x i ) and Z * ( x 0 ) is minimum.
Z * ( x 0 ) = i = 1 n λ i Z ( x i )
{ i = 1 n λ i = 1 V a r [ Z * ( x 0 ) Z ( x i ) ] m i n
The solution of Equation (4) relies on a construction of a Lagrange function (interested readers can find more details from Appendix A in reference [44]). Equation (5) is called the equation set of kriging by which λ i can be solved, where γ( x i , x 0 ) is the semi-variance between predicted and measured value at points x 0 and x i , γ( x i , x j ) is the semi-variance between two measured values at point x i and x j . μ is the Lagrange multiplier used for calculating of minimum variance. By using the data provided by the land price monitoring dataset and interpolation technique, a predicted surface of the land price of an entire urban area can be obtained.
{ i = 1 n λ i γ ( x i ,   x j ) + μ = γ ( x i ,   x 0 ) γ ( x i ,   x j ) = 1 2 V a r [ Z ( x i ) Z ( x j ) ] γ ( x i ,   x 0 ) = 1 2 V a r [ Z ( x i ) Z ( x 0 ) ]

4.3. Parcel Appraisal Model

Common methods of parcel appraisal, such as the cost approach, sales comparison approach, and income capitalization approach, are not applicable due to the lack of historical transactions or income benchmarks. In this situation, the land datum value method based on BLP is recommended to be another option according to “Regulations for valuation on urban land (GB/T18508-2014)”. This method is especially suitable for those areas whose regional transactions are inactive or the land market is immature, and is widely used for fast evaluation of a number of parcels when there is a large area of housing demolition or land development. BLP is an average price of a region with average land conditions at a specific time point. Obviously, this average price cannot serve as the price of each parcel within the region because the heterogeneity of land parcels will be overlooked. Practically, each parcel holds different land conditions, such as their regional (business density, accessibility, etc.) and individual conditions (size, shape, etc.), plot ratio, degree of development, etc. In applying the land datum value method, the land conditions of the subject parcel are compared with the average land conditions stored in the dataset of the benchmark land price, and the difference is the basis to determine the adjustment coefficients from the table of adjustment factors accordingly. Mathematically, the calculation of the land price of a subject parcel (P) includes multiplying the regional average land price (Pb) by adjustment coefficients and adding adjustment value. Hence, P can be determined by Equation (6), where Pb is the regional average land price, Ki is the ith adjustment coefficient of the regional or individual condition, Kj is the jth adjustment coefficient of the appraisal time, plot ratio, and tenure, and D is the adjustment value of the degree of development.
P = P b × ( 1 ± K i ) × K j + D

5. System Design and Prototyping

A GIS-based web land-price information system was designed and developed following a prototyping methodology to satisfy the requirements discussed in previous sections. A four-level B/S architecture was used for the system development, where analysis models are part of GIS/application server components.

5.1. System Design

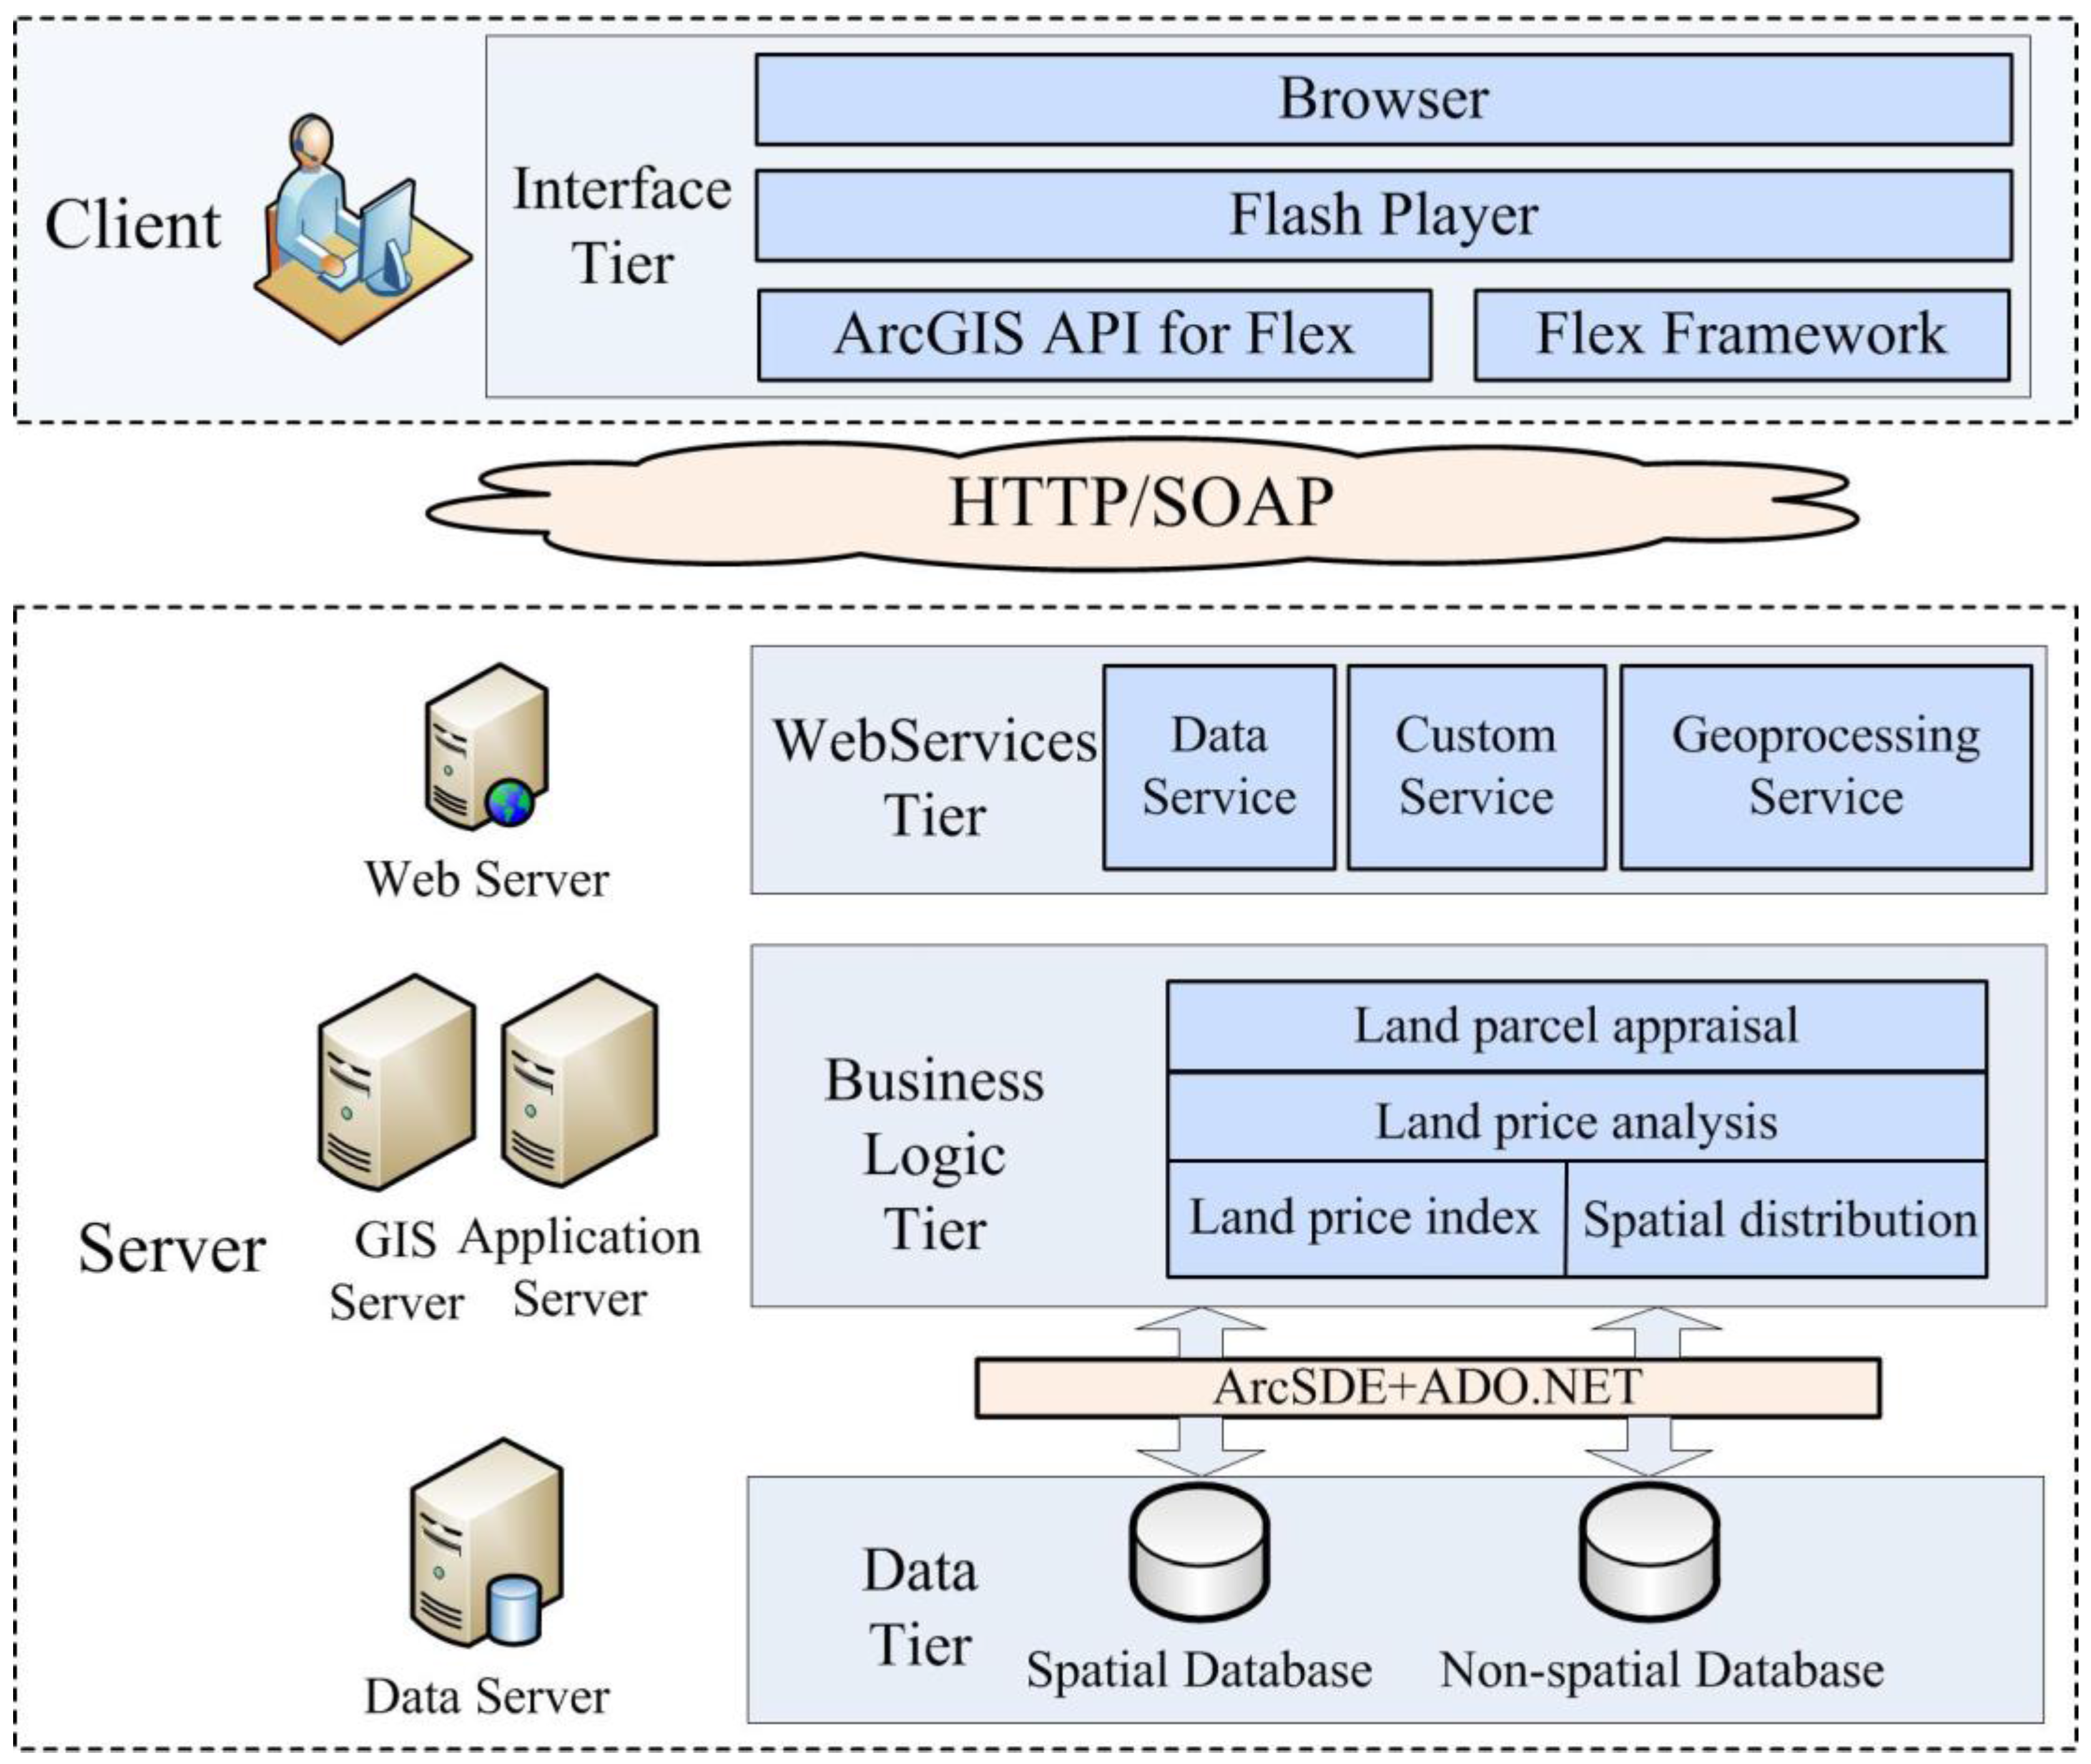
5.1.1. System Architecture

The purpose of designing and developing this system is to provide a platform to support online publishing, browsing, and analyzing of land price information. The architecture of the system is illustrated in Figure 1. The system adopts a four-level Browser/Server architecture that includes an interface tier, web services tier, business logic tier, and data tier. The interface tier provides client visualization of land price information. In addition, in this tier, the browser can send requests and receive analysis results related to land price. With published map objects and geo-processing services, the web services tier acts as a gate between the client and the server, and connects the interface tier and the business logic tire. The business logic tier is the core of the system, where land price analysis models are carried out when there is a request from the web browser. Finally, at the fourth level, the data tier, since there is a variety of spatial data and land price attribute information, a spatial and non-spatial database can be used to store and handle these data.
Figure 1. System architecture.
Ijgi 04 02078 g001

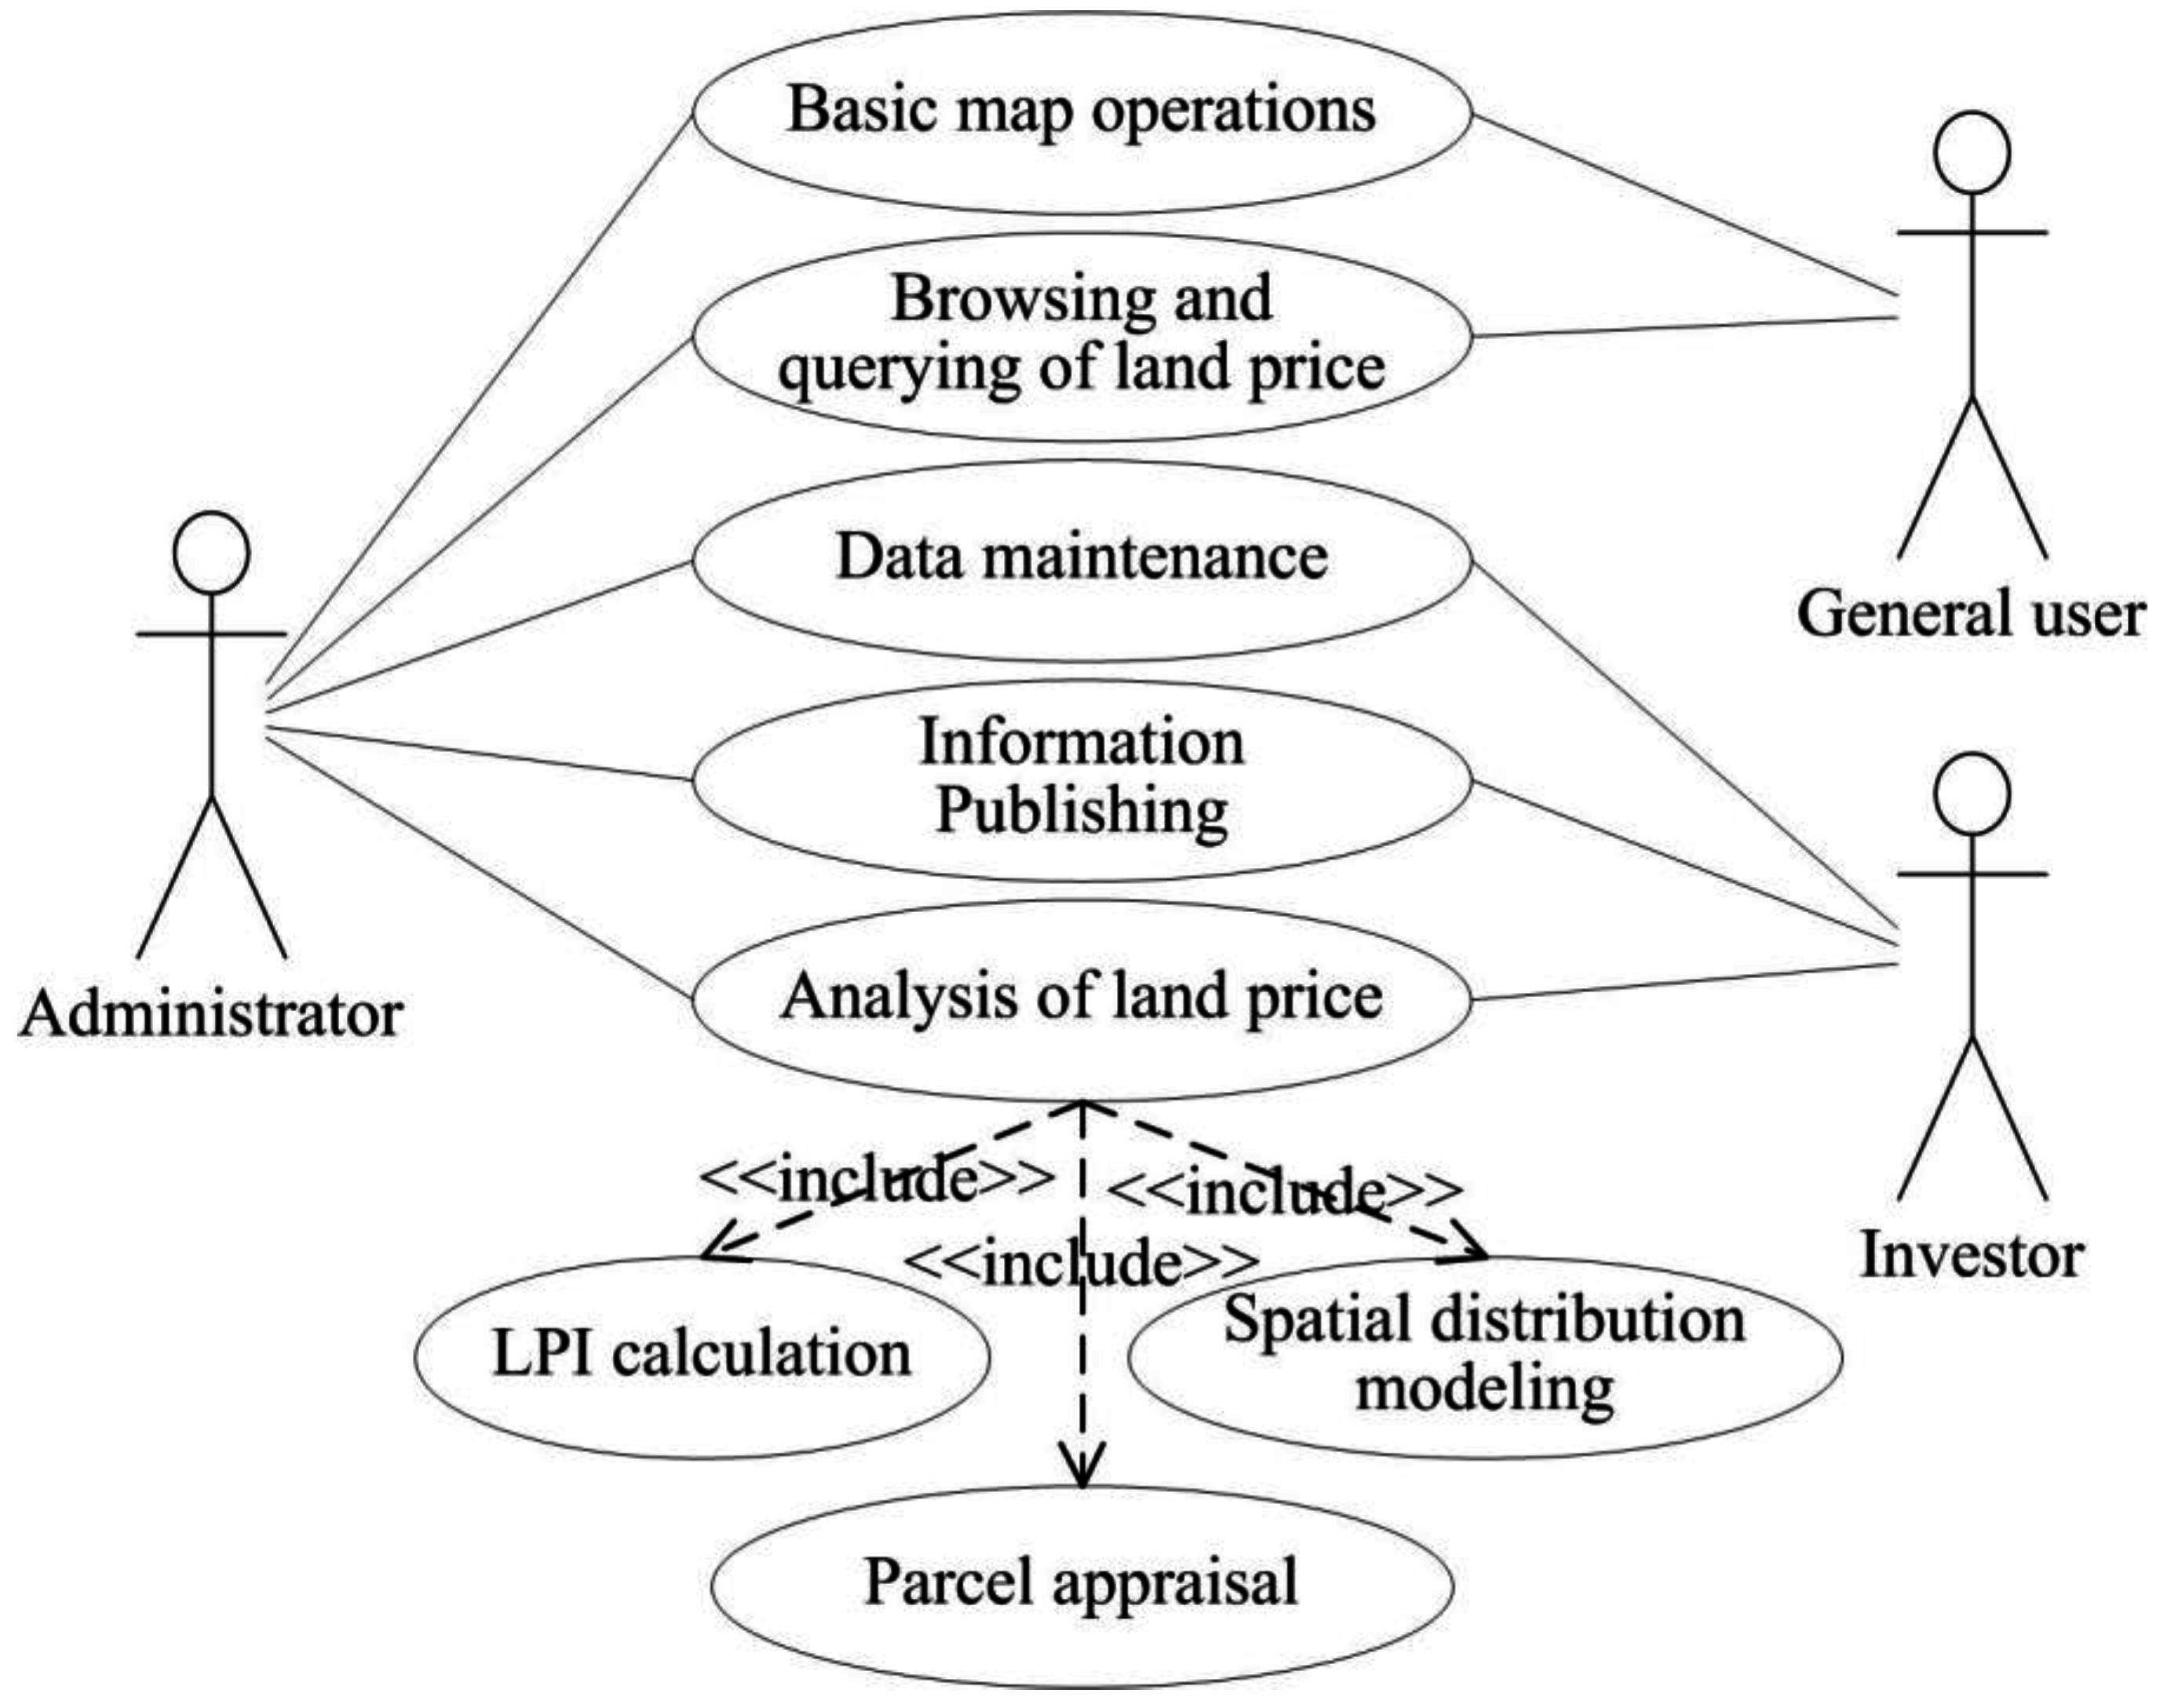
5.1.2. Users and User Requirements

Users of the GIS-based web information system consist of participants of land market such as sellers, buyers, and brokers. The user requirements presented in Figure 2, as a use case diagram of the Unified Modeling Language (UML), describe the functional requirements of the system. The system can be abstracted to some functional modules, such as basic map operation, information publishing, browsing, querying and analysis of land price, parcel appraisal, management and maintenance of data, etc. The users can be divided into three types of roles: administrator, from local land administration, investor, and general user. Different roles have different access privileges in the system. Administrators have the highest right to use almost all functions of the system, but mainly for publishing land price information by updating the database regularly. As for investors, in-depth analysis of land price, including the land price index, spatial distribution modeling, and appraisal of interesting parcels, are essential procedures before they make a wise decision of investing. General users with limited knowledge and authority can utilize the functional modules, for example, basic map operation, browsing, and querying, to access the land price information published by land administrators.
Figure 2. Use case.
Figure 2. Use case.
Ijgi 04 02078 g002

5.2. Prototype Development

To facilitate the development of the proposed approach, Feng County was selected as a case study city. It was selected because it is a typical county-level city in China, whose land market has gradually become active but without sufficient information support.
The county is located in Jiangsu Province of Eastern China with a total urban area of 50.89 km2. As a city experiencing rapid economic development and large expansion of urban areas in recent years, the Feng County’s urban population rose from 83,900 to 397,700 and Gross Domestic Product (GDP) increased from 2.68 billion yuan to 32.00 billion yuan during the period of 1994–2014. Before the Chinese reform and opening-up, the urban area of the Feng County was restricted to the old town district situated in the Midwest. The land use right of a large amount of state-owned land has been transferred to the investors for the purpose of land development in the process of expansion to the south and east. As a result, a new city center equipped with better infrastructure has been formed in the central urban area. In the past three years, the LUR of more than 6.86 km2 of land has been transferred and the land price (LUR’s price) has held a growth rate around 1% quarterly. Although Feng County is one of the 2717 county-level cities in mainland China that have established BLP [45], the publication of BLP information still relies on traditional ways such as paper-based maps and documents. Therefore, adopting the GIS-based web information system has considerably practical significance and demonstrable effect.

5.2.1. Data Preparation

As part of the project “Updating of BLP in Feng County (Jiangsu Province, China)”, the land resources bureau decided to shift the traditional way to publish land price information. We had collected the latest city maps, reports of BLP, LPM database, and land use planning of the urban area in Feng County. ArcGIS was used for data processing and establishment of land price datasets. Under the authority of administrator, the datasets were uploaded to the server of the system after validity checking.

5.2.2. System Implementation

Based on the system architecture designed above, a land-price information system with web map services via the Internet had been developed using such technologies as ArcGIS Server 10.0, ArcSDE, Flex Builder 4.6, and SQL Server 2008. As shown in Figure 1, due to its advantage of being easy to integrate with other software, SQL Server was selected as a database management system in this development. ArcSDE and ADO.NET technology were adopted as communication tools between the business logic tier and the data tier to facilitate management of spatial and attribute data in a relational database. ArcGIS Server was employed to ensure the display, query, and analysis of land price information. In this system, in order to provide effective land price services via the Internet, the Flex technology was used for the interface tier. Flex is a kind of Rich Internet Application (RIA) technology which lets users not only create nice look-and-feel and highly interactive interfaces, but also share some work of the servers, e.g., map layer control, map query, etc. Flex client uses Simple Object Access Protocol (SOAP) to call the data and function services provided by the server. By using ArcGIS API for Flex, map and other application tasks are integrated into the system. Additionally, two open source technologies, Open Flash Chart and Flash Away3D (version 4.07), were used to display spatial distributions of land prices in the forms of charts and 3D views.

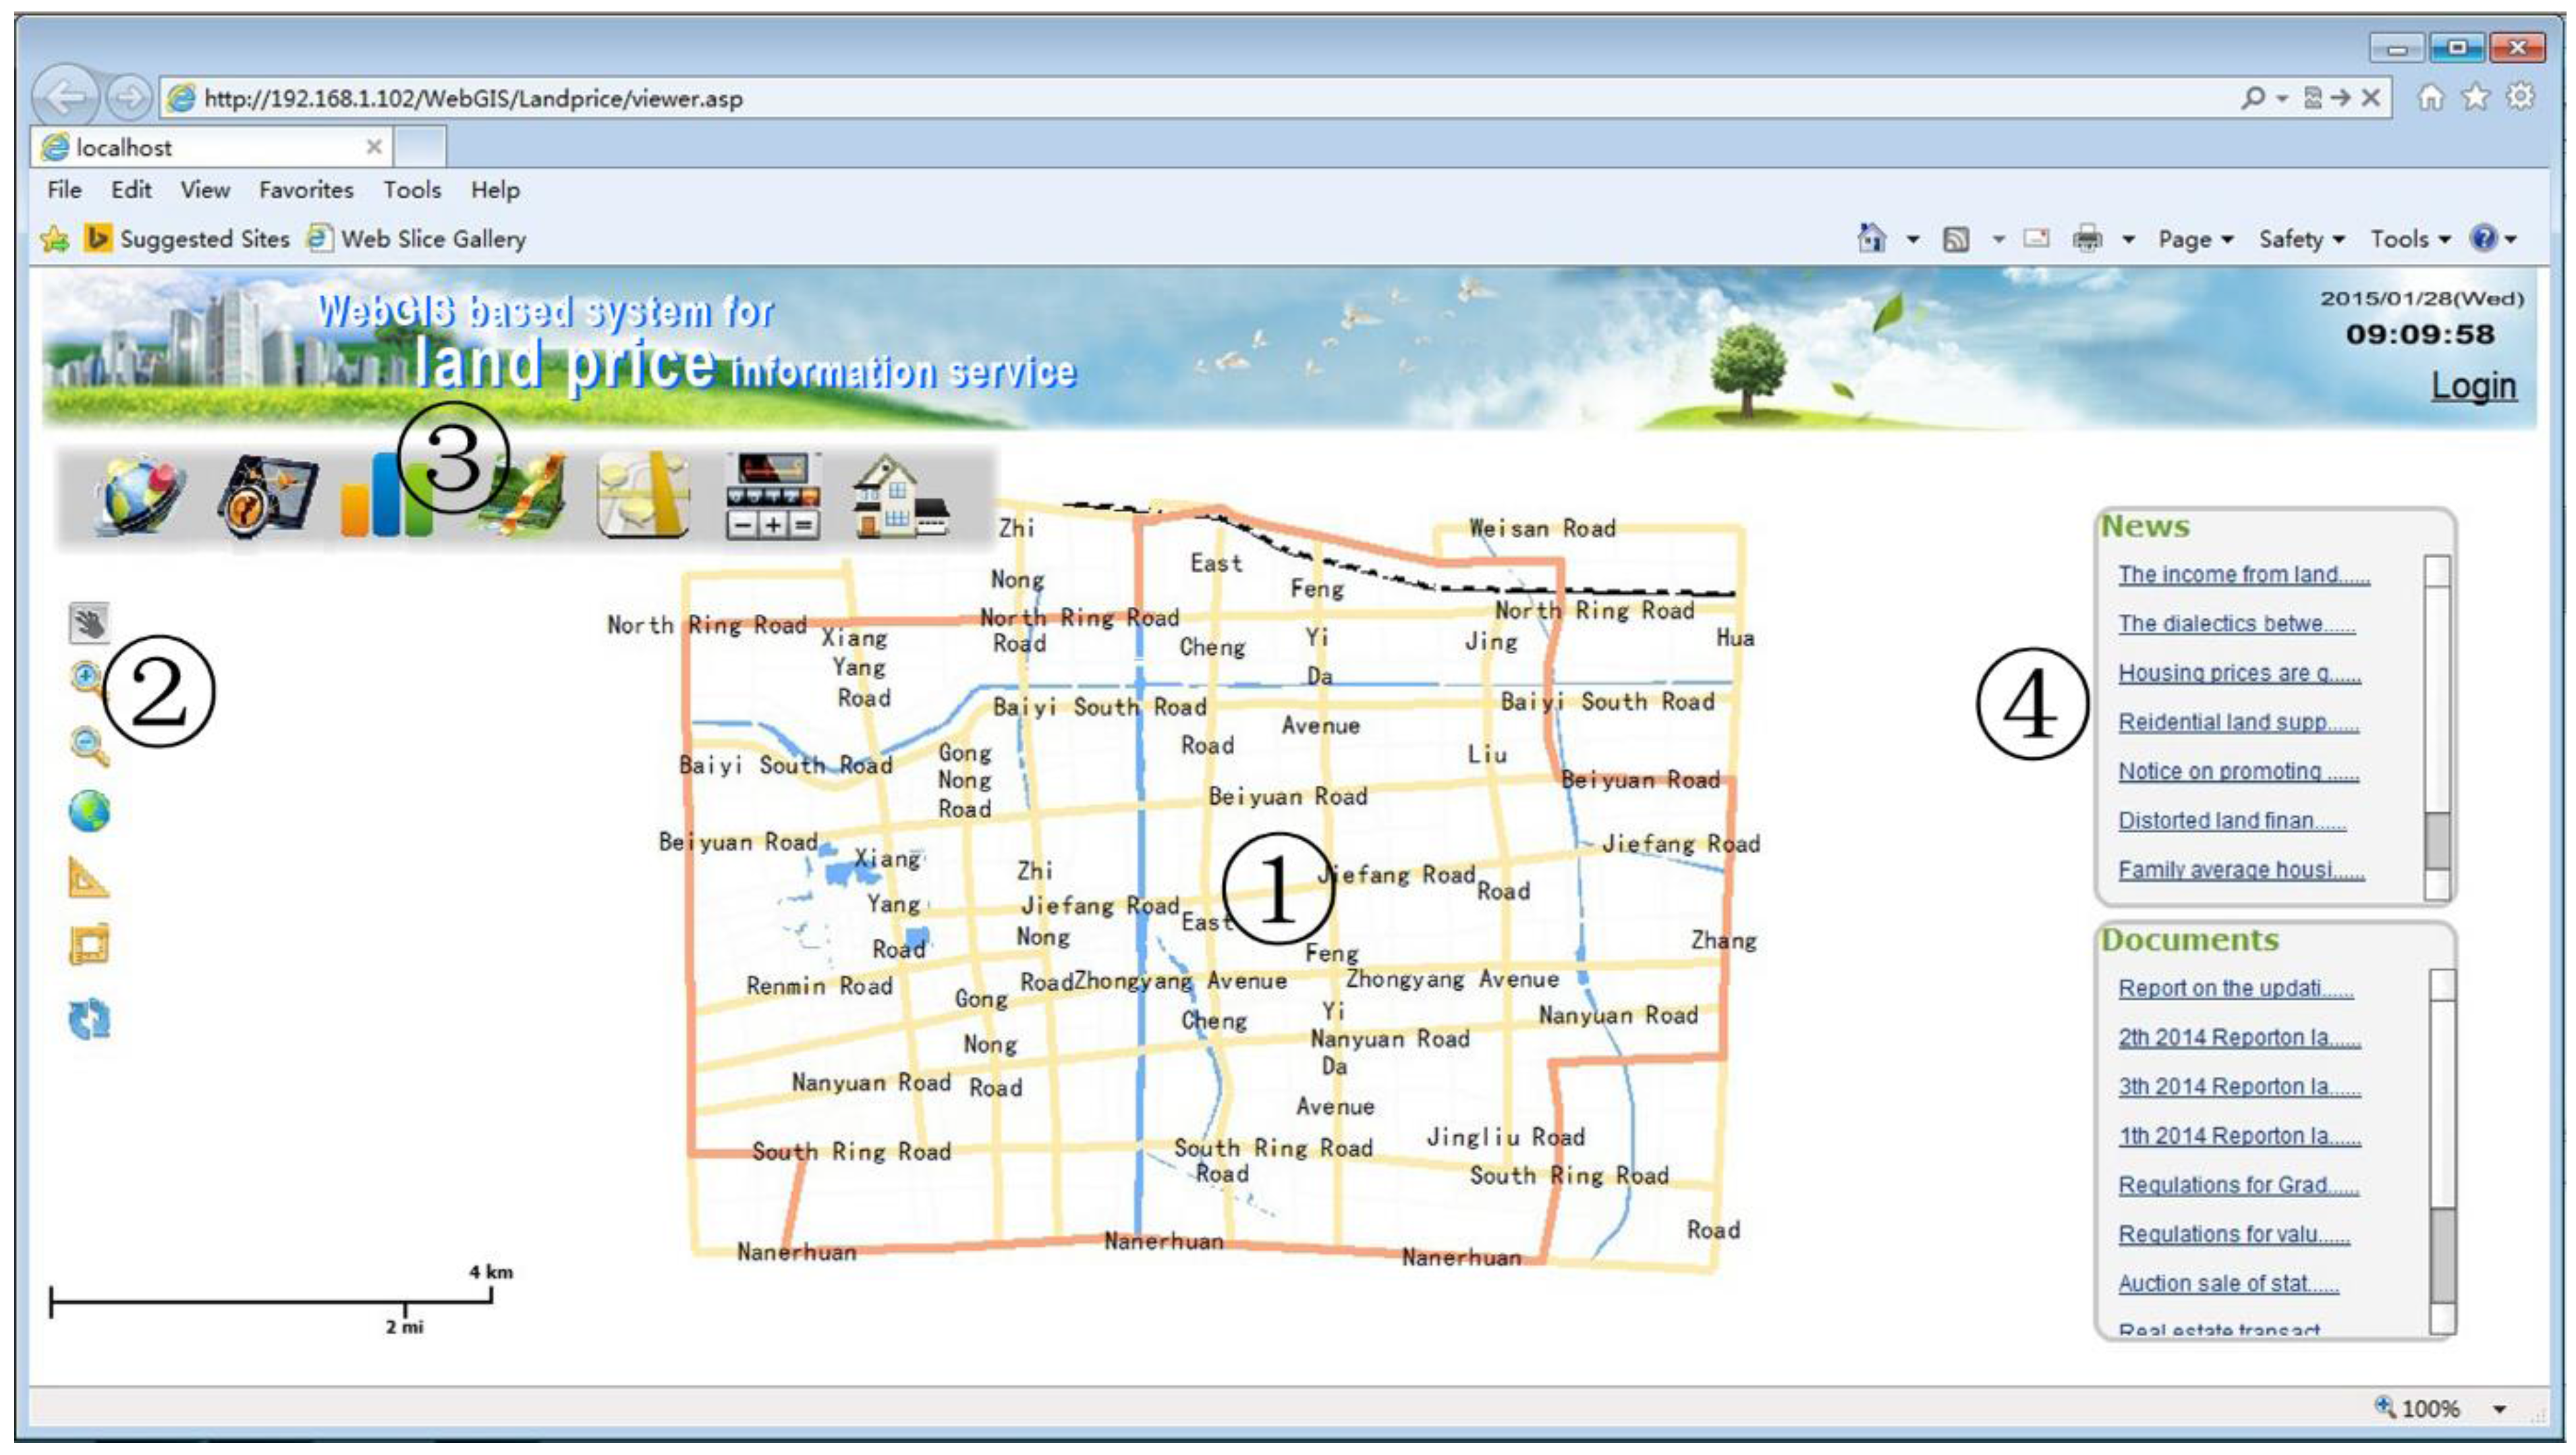
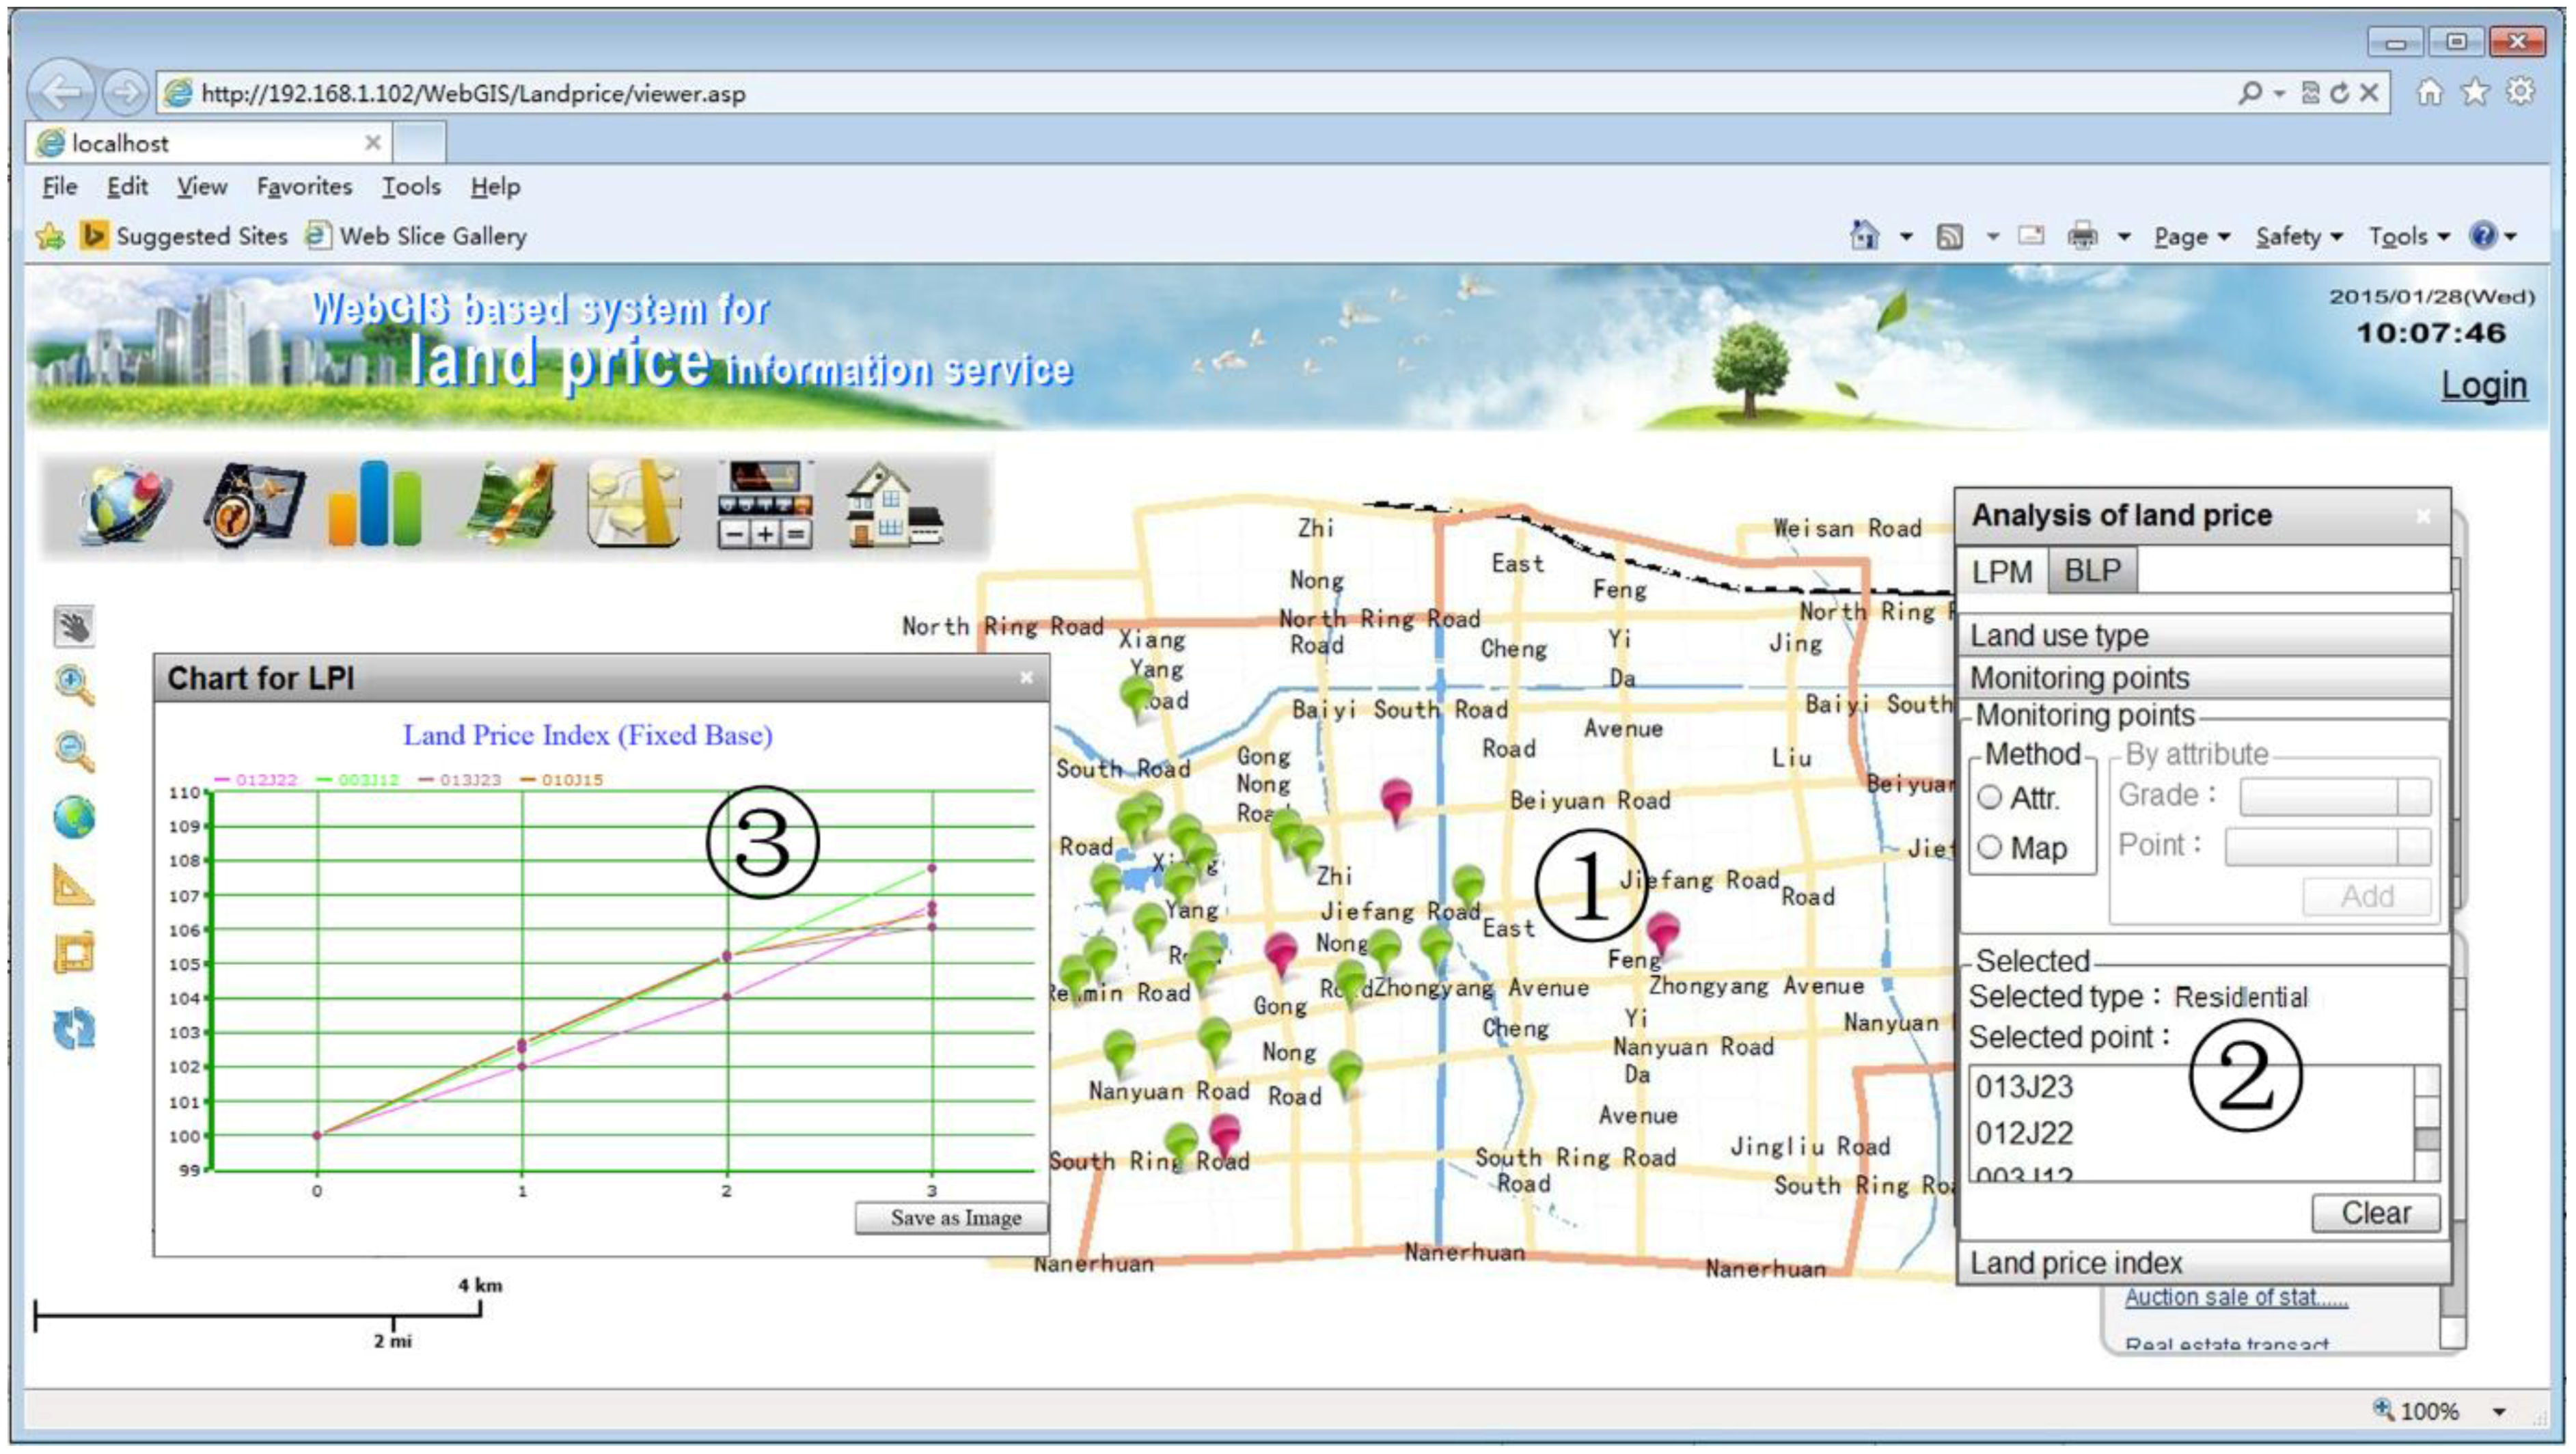
5.2.3. Main Functions

Figure 3 shows the main interface of the prototype system, whose elements are organized around the county’s map. The implementation of the main functions relies on several components shown in the user interface: (1) a map frame for viewing of spatial land price information (labeled as 1 in Figure 3), (2) universal GIS tools for manipulating maps, such as “zoom in”, “zoom out”, “identify”, “print map”, etc. (labeled as 2), (3) menu items for controlling the interesting map layers of land price data sets to be displayed (labeled as 3), and (4) an information board for browsing land price-related news and downloading documents (labeled as 4). Button-driven handling and scrolling ensures that the users can easily control the displayed map layers and browse the interested land price information. In addition, the requested results can be presented in the map frame and can be downloaded as images and documents. Compared with the traditional way, the proposed approach makes it a convenient and public-oriented way to publish land price information.
Figure 3. Main interface of the prototype system.
Ijgi 04 02078 g003

(1) Information publishing

After the system receives the request from the user via the user interface to browse and query the land price information, it retrieves the datasets stored in the data tier and then presents the inquiry results in the map frame. Apart from this, the publishing of land price information also includes the management and maintenance of data sources. Administrators of the land market have the right to upload new datasets to replace the old regularly, especially the datasets of benchmark land prices (every three years) and land price monitoring (every quarter). The automated process includes validating and updating the datasets layer by layer. In 2014, BLP and LPM were first opened to the public by this GIS-based web approach instead of using traditional methods.

(2) LPI calculation

LPI calculation is designed to know the trend of land price. To run this function (see an example in Figure 4), users need to select the objective land price monitoring points using either the map or the attribute-based query, and input time range, labeled as 1 and 2, respectively, in Figure 4. The system is designed to record these two parameters and send the instructions to the server to start the function. The server-side program performs the required computation based on the equations in Section 4.1 and the data retrieved from the data sets of land price monitoring. Line graphs are used to display the results within web browsers. To acquire a glimpse into the tendency of land price in the Feng County, L P I f of four randomly selected land price monitoring points were determined by using the function of LPI calculation (the result is labeled as 3). The line chart illustrates that all of them maintain the same increasing trend with a maximum growth rate of more than 7% (land price monitoring point No. 003J12) during the time range of the four quarters in 2014.
Figure 4. Land price calculation of selected monitoring points.
Ijgi 04 02078 g004
Figure 5. Spatial distribution modeling of land price.
Ijgi 04 02078 g005

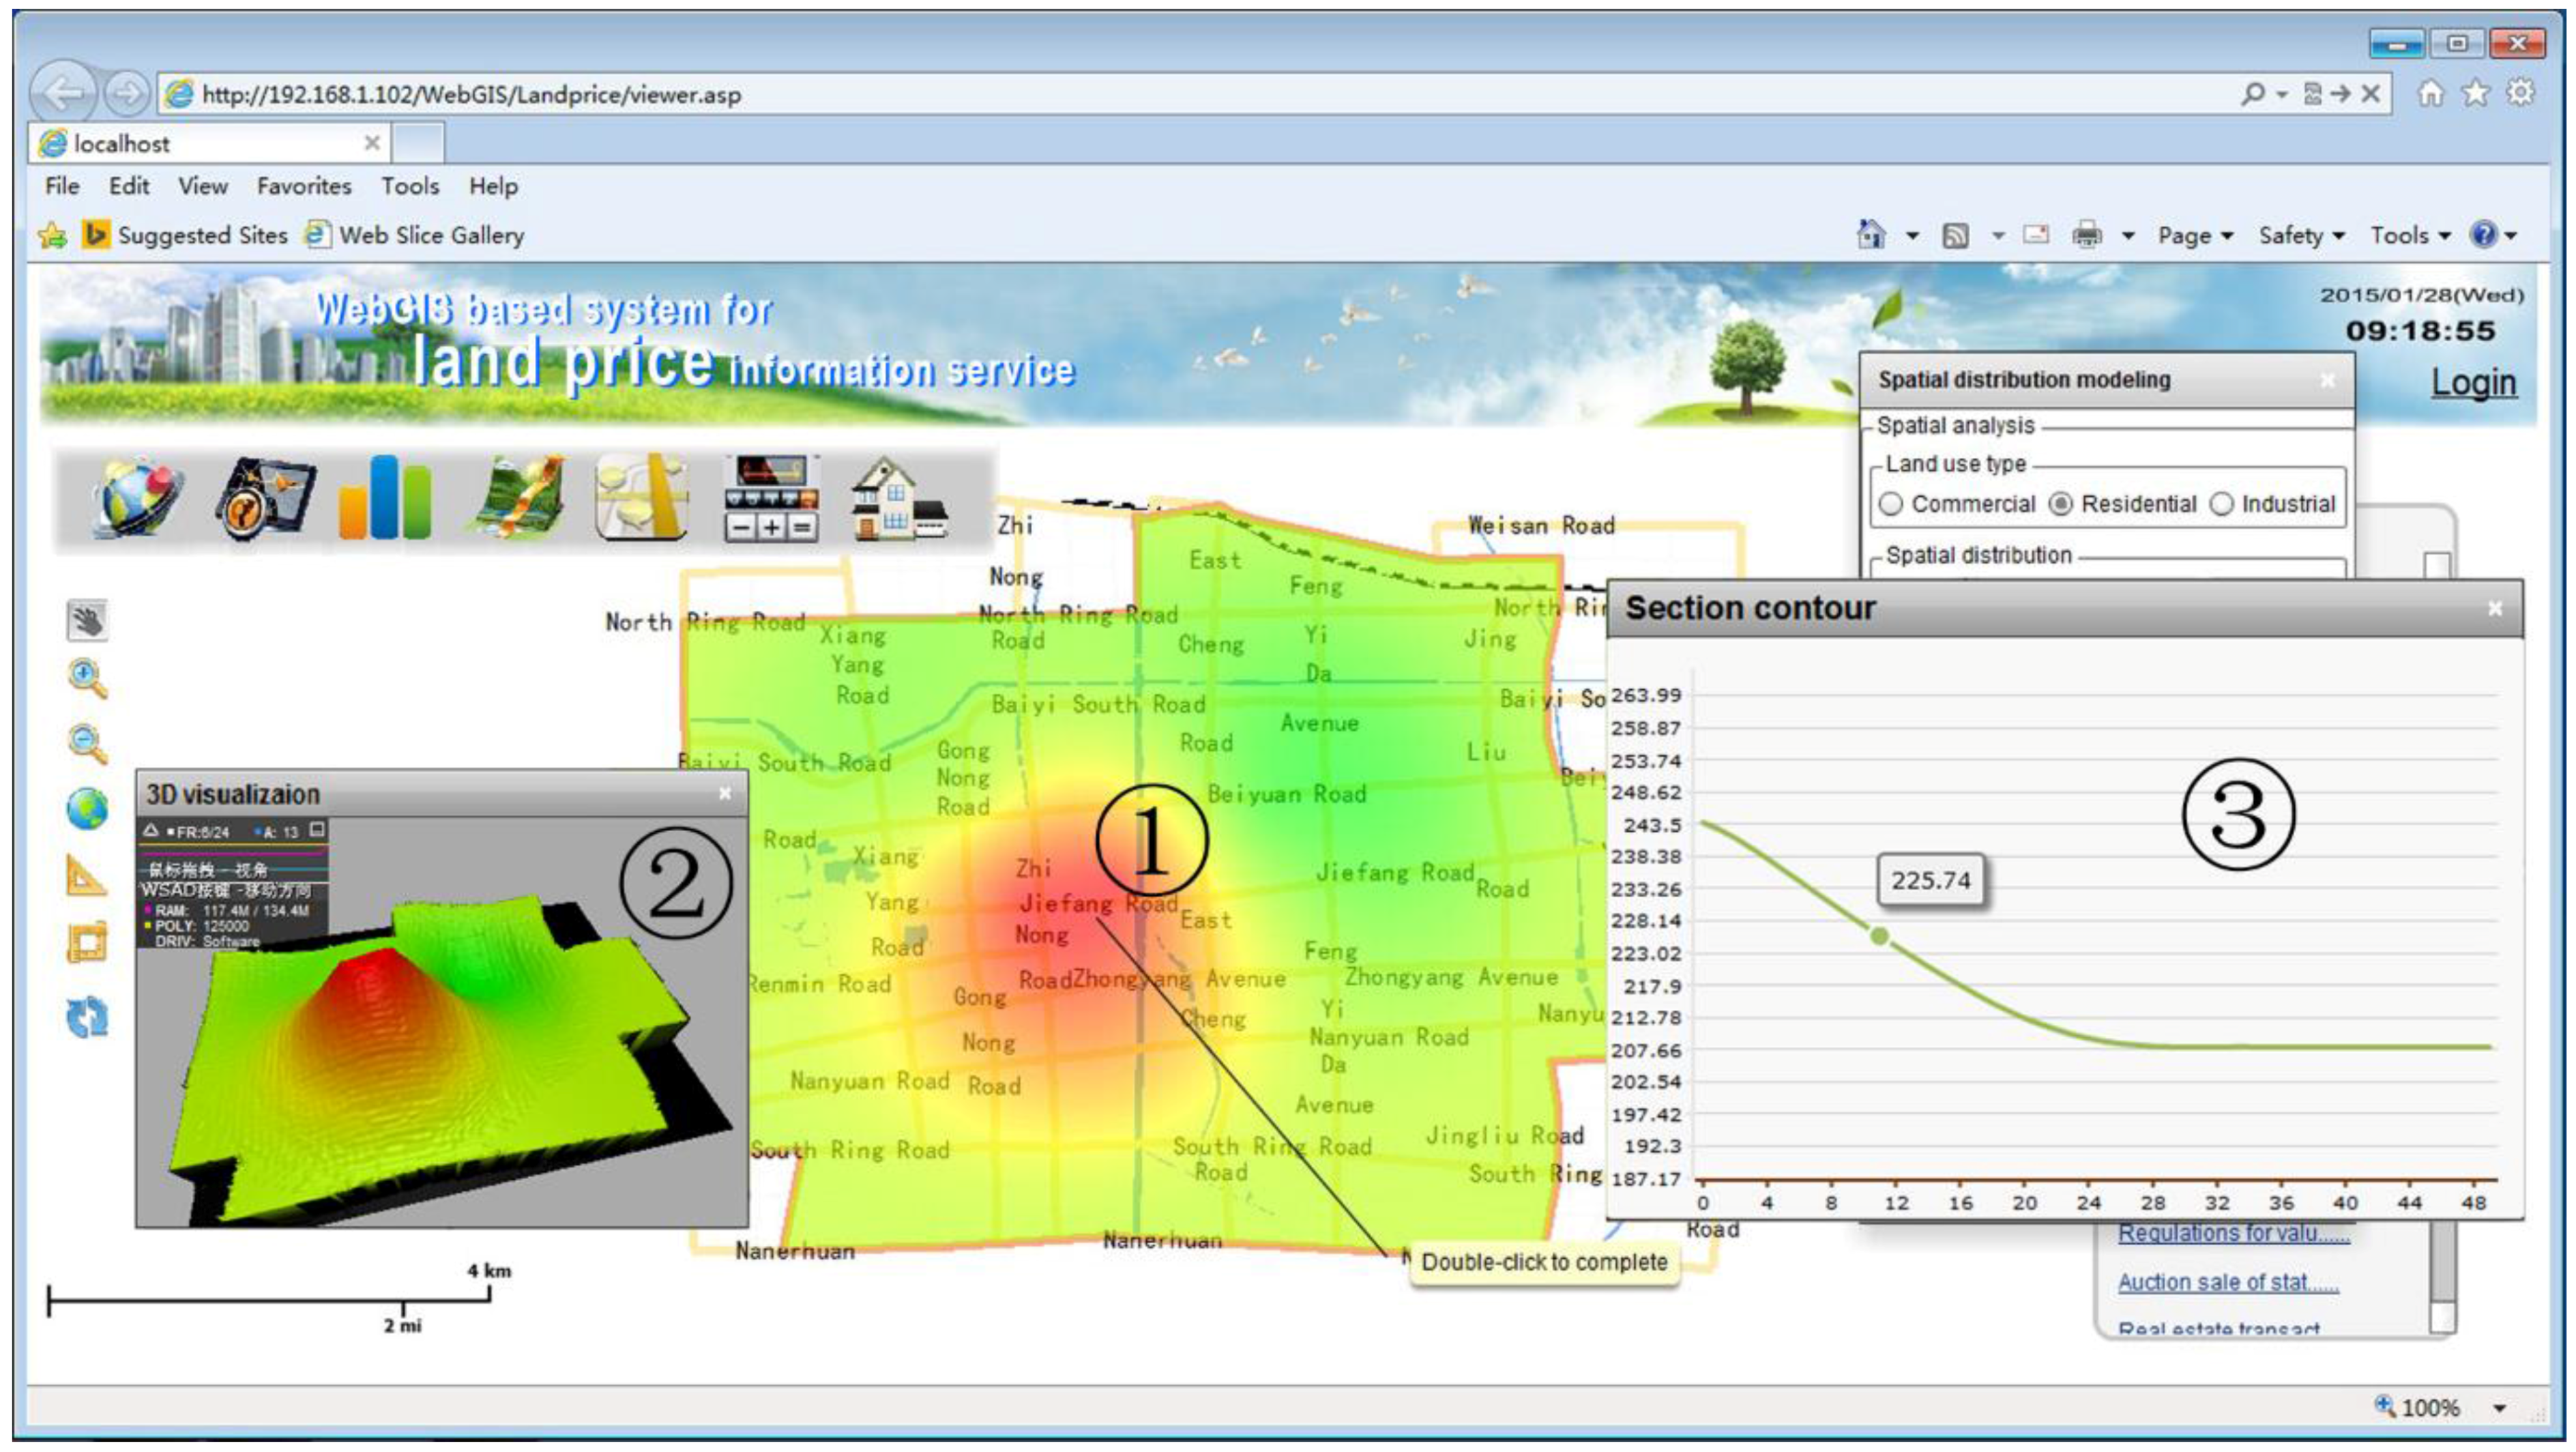
(3) Spatial distribution modeling

Based on the model presented in Section 4.2, the system allows investors or other users to explore the spatial structure of land price for a particular land use type. The two required parameters, land use type and appraisal time, are listed in a drop-down menu for users’ selection. There are several steps to model land price distributions after the server receives the submitted parameters from the user interface, including data retrieve and check, modeling the semi-variogram, cross-validation of results, and prediction of the land price surface. All of these processes are handled by server-side components, and the results are displayed on the map viewing frame of the user interface. A three-dimensional tool is provided to visualize the surface of the land price from different angles. Figure 5 gives an example of modeling the distribution of the land price with an industrial land use type and an appraisal time in the first quarter in 2014. The result is displayed as a grid surface in the map viewing frame (labeled as 1) and a three-dimensional visualization (labeled as 2). The section contour indicates that the Feng County’s industrial land price has distribution patterns characterized by “high in central area, low in fringe area (range from red to green)” (labeled as 3), which is mainly in accordance with the quality of infrastructure in this case city.
Figure 6. An example of using pracel appraisal function.
Ijgi 04 02078 g006

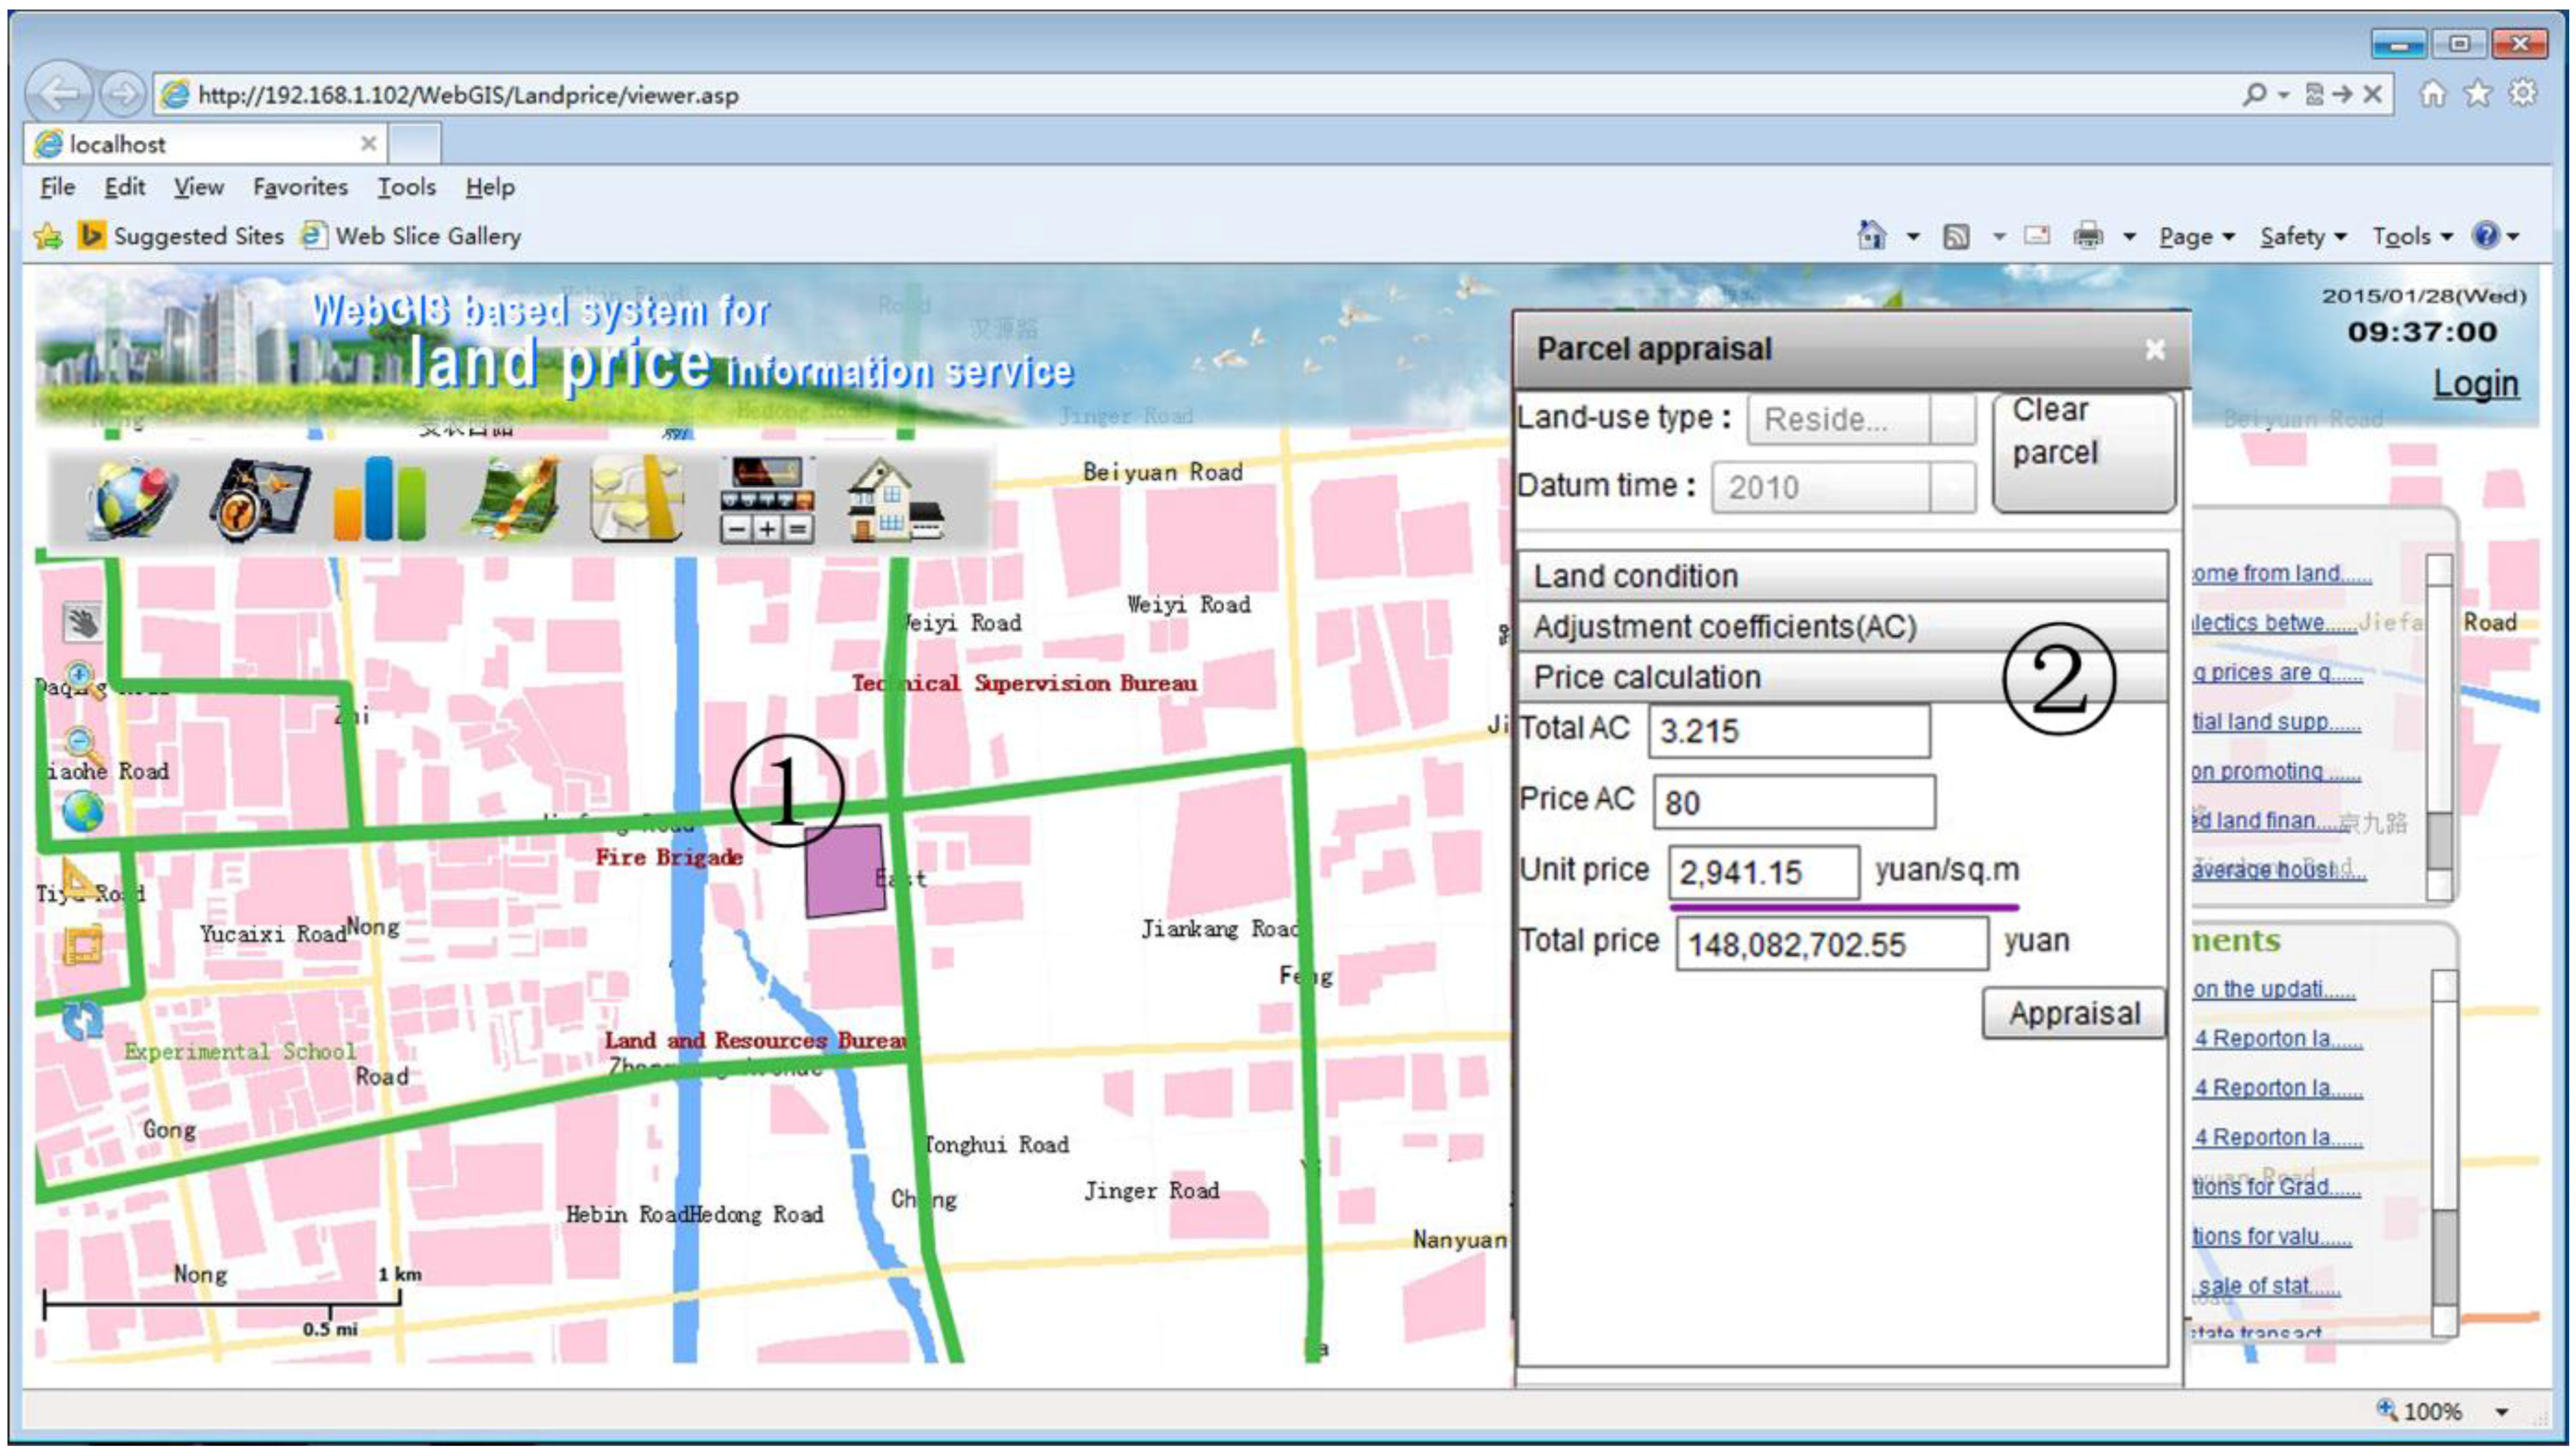
(4) Parcel appraisal

This function is intended for appraising the parcels of interest. Here, the term “parcel” is employed to describe a plot within an ownership boundary. The operation of this function starts from drawing or picking up a parcel (a polygon) on the map frame and specifying a few parameters of land conditions (i.e., land use type, regional and individual conditions, plot ratio, and degree of development) on the pop-up form (labeled as 1 and 2, respectively, in Figure 6). The server first figures out whether the land conditions of the parcel conform to the city’s land use planning. If negative, for example, the specified plot ratio is higher than the control standards of the district where the parcel is located, users will be prompted to change the parameters. Then, the server determines the adjustment coefficients of land conditions by making a comparison of the parcel and BLP region. The final step is to calculate the land price using the land datum value method and send back the results to the user interface. Based on the land datum value method and web-based approach, investors or administrators can achieve a quick and batch appraisal without physically appearing in the Feng County and collecting massive materials. The example in Figure 6 shown the price of the interested parcel is appraised as 2941.15 yuan per square meter (underlined in Figure 6). Since Feng County is undergoing urban expansion and renewal, more than 35 parcels (LUR) had been transferred during 2014. Their appraised values computed by the system have proved to be practical in providing a reference for the determination of floor price before parcel transaction. These results generated from the web system have given people further understanding and application of land price rather than tedious information.

6. Conclusion

Operation of urban land markets calls for an information base to support efficient data sharing and analysis. Great progress has been made in both GIS and land price theory areas. However, land price information service remains unsatisfied due to the lack of information sources and available spatial-temporal analysis tools. This paper makes efforts to integrate GIS-based web technology and land price analysis models to provide a novel approach for serving land price information. After reviewing the background and analysis models of land price, a system with a four-level B/S architecture was designed and implemented to meet the requirements of participants of land market.
The application in the case study city demonstrates that the novel approach helps connect land information providers and users, i.e., land administrators are able to publish BLP-related information, thus reducing paper works, and other participants of the land market can query such information simply using web browsers through handy functions. Another advantage is that the system has implemented the spatial-temporal analytic techniques that consider the geographical features of land price, which allows investors and other users to conduct further analyses to understand the change in pattern and spatial distribution of land prices. With practical functionality and effective architecture, the combination of land price-related models and GIS techniques shows its potential to apply the approach to some other cities and to be extended as a model to the development of similar information systems.
However, the analytic methods and information sources of land price remain limited in the developed system. In the near future, the promotion of the system should include providing more analysis models, such as sales comparison approaches for parcel appraisal. Apart from the BLP-related data provided by land administrators, the volunteered geographic information is another promising data source; for this, the system can provide a platform for those system users to upload their data, such as the comparable cases of land transaction.

Acknowledgments

This work reported in this paper was supported by the National Natural Science Foundation of China (Grant No.41301433), and the Priority Academic Program Development of Jiangsu Higher Education Institutions. The authors would like to thank anonymous reviewers for their constructive comments.

Author Contributions

Yongjun Yang, Yaqin Sun and Songnian Li conceived and designed the study. Yongjun Yang, Kuoyin Wang and Shishuo Xu developed the system. Huping Hou collected and processed the data. Yongjun Yang and Yaqin Sun wrote the paper. Songnian Li and Shaoliang Zhang contributed in the preparation of the manuscript. All authors read and approved the manuscript.

Conflicts of Interest

The authors declare no conflict of interest.

References

  1. Kettani, O.; Oral, M.; Siskos, Y. A multiple criteria analysis model for real estate evaluation. J. Glob. Optim. 1998, 12, 197–214. [Google Scholar] [CrossRef]
  2. Cao, G.; Feng, C.; Tao, R. Local “land finance” in China’s urban expansion: Challenges and solutions. China World Econ. 2008, 16, 19–30. [Google Scholar] [CrossRef]
  3. Tao, R.; Su, F.; Liu, M.; Cao, G. Land leasing and local public finance in China’s regional development: Evidence from prefecture-level cities. Urban Stud. 2010, 47, 2217–2236. [Google Scholar]
  4. Lin, G.; Yi, F. Urbanization of capital or capitalization on urban land? Land development and local public finance in urbanizing China. Urban Geogr. 2011, 32, 50–79. [Google Scholar] [CrossRef]
  5. Buitelaar, E. A transaction-cost analysis of the land development process. Urban Stud. 2004, 41, 2539–2553. [Google Scholar] [CrossRef]
  6. Deininger, K.; Savastano, S.; Carletto, C. Land fragmentation, cropland abandonment, and land market operation in Albania. World Dev. 2012, 40, 2108–2122. [Google Scholar] [CrossRef]
  7. Dahlman, C.J. The problem of externality. J. Law Econ. 1979, 22, 141–162. [Google Scholar] [CrossRef]
  8. Zevenbergen, J.; Bogaerts, T. Alternative approaches for successful cadastral systems. In Proceedings of the 22nd Urban and Regional Data Management Symposium, Delft, The Netherlands, 11–15 September 2000; pp. 67–76.
  9. Paz, P. Determinants of housing prices in Spanish cities. J. Prop. Invest. Financ. 2003, 21, 109–135. [Google Scholar]
  10. Cichociński, P.; Dąbrowski, J. Spatio-temporal analysis of the real estate market using geographic information systems. Real Estate Manag. Valuat. 2013, 21, 72–82. [Google Scholar] [CrossRef]
  11. Nanda, A.; Yeh, J. Spatio-temporal diffusion of residential land prices across Taipei regions. SpringerPlus 2014, 3, 505–520. [Google Scholar] [CrossRef] [PubMed]
  12. Saefuddin, A.; Widyaningsih, Y.; Ginting, A.; Mamat, M. Land price model considering spatial factors. Asian J. Math. Stat. 2012, 5, 132–141. [Google Scholar] [CrossRef]
  13. Williamson, I.; Ting, L. Land administration and cadastral trends—A framework for re-engineering. Comput. Environ. Urban Syst. 2011, 25, 339–366. [Google Scholar] [CrossRef]
  14. Bennett, R.; Wallace, J.; Williamson, I. Organising land information for sustainable land administration. Land Use Policy 2008, 25, 126–138. [Google Scholar] [CrossRef]
  15. Mađer, M. Land information management-Cadastre. Cartogr. Geoinf. 2012, 11, 186. [Google Scholar]
  16. Bordyuzha, A. Development of land cadastral system in Ukraine. Balanc. Nat. Using 2012, 5, 65–69. [Google Scholar]
  17. Divithure, H.; Tang, C. Evolution of land registration and cadastral survey systems in Sri Lanka. Surv. Rev. 2013, 45, 126–135. [Google Scholar]
  18. Kurwakumire, E. Digital cadastres facilitating land information management. South Afr. J. Geomat. 2014, 3, 64–77. [Google Scholar]
  19. Hanstad, T. Designing land registration systems for developing countries. Am. Univ. Int. Law Rev. 1997, 13, 647–703. [Google Scholar]
  20. Azad, B.; Faraj, S. E-Government institutionalizing practices of a land registration mapping system. Gov. Inf. Q. 2009, 26, 5–14. [Google Scholar] [CrossRef]
  21. Nasralla, Z.H.; Aleqabie, H.J.; Thamer, Z. Design and implementation of Karbala real estate information system. J. Kerbala Univ. 2013, 1, 240–248. [Google Scholar]
  22. De Vries, P.; Faber, R. Towards a real estate monitoring information system in Romania. Romanian Econ. J. 2009, 32, 187–214. [Google Scholar]
  23. Stanfield, D.; Raço, M. Land markets, information, and a property registration system in Albania. Comput. Environ. Urban Syst. 1994, 18, 133–141. [Google Scholar] [CrossRef]
  24. Kisilevich, S.; Keim, D.; Rokach, L. A GIS-based decision support system for hotel room rate estimation and temporal price prediction: The hotel brokers’ context. Decis. Support Syst. 2013, 54, 1119–1133. [Google Scholar] [CrossRef]
  25. Porta, J.; Parapar, J.; García, P.; Fernández, G.; Touriño, J.; Doallo, R.; Ónega, F.; Santé, I.; Díaz, P.; Miranda, D.; et al. Web-gis tool for the management of rural land markets application to the land bank of Galicia (NW Spain). Earth Sci. Inf. 2013, 6, 209–226. [Google Scholar] [CrossRef]
  26. Pagourtzi, E.; Assimakopoulos, V.; Hatzichristos, T.; French, N. Real estate appraisal: A review of valuation methods. J. Prop. Invest. Financ. 2003, 21, 383–401. [Google Scholar] [CrossRef]
  27. Zeng, T.Q.; Zhou, Q.M. Optimal spatial decision making using GIS: A prototype of a real estate geographical information system (REGIS). Int. J. Geogr. Inf. Sci. 2001, 15, 307–321. [Google Scholar] [CrossRef]
  28. Rodriguez, M.; Sirmans, C.F.; Marks, A.P. Using geographic information systems to improve real estate analysis. J. Real Estate Res. 1995, 10, 163–173. [Google Scholar]
  29. Li, H.; Yu, L.; Cheng, E.W. A GIS-based site selection system for real estate projects. Constr. Innov. 2005, 5, 231–241. [Google Scholar] [CrossRef]
  30. Pagourtzi, E.; Nikolopoulos, K.; Assimakopoulos, V. Architecture for a real estate analysis information system using GIS techniques integrated with fuzzy theory. J. Prop. Invest. Financ. 2006, 24, 68–78. [Google Scholar]
  31. Tsutsumi, M.; Shimada, A.; Murakami, D. Land price maps of Tokyo metropolitan area. Procedia Soi. Behav. Sci. 2011, 21, 193–202. [Google Scholar] [CrossRef]
  32. Hu, S.; Cheng, Q.; Wang, L.; Xu, D. Modeling land price distribution using multifractal IDW interpolation and fractal filtering method. Landsc. Urban Plann. 2013, 110, 25–35. [Google Scholar] [CrossRef]
  33. Tsutsumi, M.; Seya, H. Measuring the impact of large-scale transportation projects on land price using spatial statistical models. Pap. Reg. Sci. 2008, 87, 385–401. [Google Scholar] [CrossRef]
  34. Xie, Q.; Parsa, A.R.G.; Redding, B. The emergence of the urban land market in China evolution, structure constraints and perspectives. Urban Stud. 2002, 39, 1375–1398. [Google Scholar] [CrossRef]
  35. Liu, Y.; Zheng, B.; Huang, L.; Tang, X. Urban residential land value analysis: Case Danyang, China. Geo-Spat. Inf. Sci. 2007, 10, 228–234. [Google Scholar] [CrossRef]
  36. Li, L.H.; Walker, A. Benchmark pricing behaviour of land in China’s reforms. J. Prop. Res. 1996, 13, 183–196. [Google Scholar] [CrossRef]
  37. Xu, Z.; Li, Q. Integrating the empirical models of benchmark land price and GIS technology for sustainability analysis of urban residential development. Habitat Int. 2014, 44, 79–92. [Google Scholar] [CrossRef]
  38. Wang, R. The structure of Chinese urban land prices: Estimates from benchmark land price data. J. Real Estate Financ. Econ. 2009, 39, 24–38. [Google Scholar] [CrossRef]
  39. Ding, C. The benchmark land price system and urban land use efficiency in China. Chin. Geogr. Sci. 2001, 11, 306–314. [Google Scholar] [CrossRef]
  40. China Land Surveying and Planning Institute. China Urban Land Price Dynamic Monitor. Available online: http://www.landvalue.com.cn/ (accessed on 3 July 2015).
  41. Jiangsu Land and Resources Department. Jiangsu Land Market Website. Available online: http://www.landjs.com/ (accessed on 3 July 2015).
  42. Martinez, M.G.; Lorenzo, J.M.M.; Rubio, N.G. Kriging methodology for regional economic analysis: Estimating the housing price in Albacete. Int. Adv. Econ. Res. 2000, 6, 438–450. [Google Scholar] [CrossRef]
  43. José-Ma, M.; Beatriz, L. Estimating housing price: Kriging the mean. Int. Adv. Econ. Res. 2006, 12, 419. [Google Scholar]
  44. Johnston, K.; Ver Hoef, J.M.; Krivoruchko, K.; Lucas, N. Using ArcGIS Geostatistical Analyst; ESRI: Redlands, CA, USA, 2001; Volume 300. [Google Scholar]
  45. Dong, W. Benchmark Land Price in China: Present State and Outlook. Available online: http://www.fig.net/pub/fig2013/ppt/ts06e/TS06E_dong_6561_ppt.pdf (accessed on 3 July 2015).

