Article

Evidentially Driven Uncertainty Decomposition for Weakly Supervised Point Cloud Semantic Segmentation

1
Heilongjiang Province Key Laboratory of Pattern Recognition and Information Perception, Harbin University of Science and Technology, Harbin 150080, China
2
School of Electronics and Information Engineering, Harbin Institute of Technology, Harbin 150001, China
*
Author to whom correspondence should be addressed.
ISPRS Int. J. Geo-Inf. 2026, 15(4), 167; https://doi.org/10.3390/ijgi15040167
Submission received: 5 February 2026 / Revised: 28 March 2026 / Accepted: 10 April 2026 / Published: 12 April 2026
(This article belongs to the Special Issue Indoor Mobile Mapping and Location-Based Knowledge Services)

Abstract

Point cloud semantic segmentation is a core component in indoor scene understanding and autonomous driving. Under weak point-level supervision, only a small subset of points is annotated, making effective use of unlabeled points critical yet non-trivial. Many existing approaches rely on prediction confidence to filter pseudo labels or enforce consistency, which can bias training toward easy points and amplify early mistakes. Consequently, confidently wrong predictions may be reinforced, while uncertain points around class boundaries or in geometrically complex regions are less utilized, limiting further gains. An evidential uncertainty decomposition framework is introduced for weakly supervised point cloud semantic segmentation. Network outputs are interpreted as evidential distributions, and uncertainty is decomposed to separate lack-of-knowledge uncertainty from boundary-related ambiguity, providing a more informative reliability signal for unlabeled points. Based on this signal, different constraints are applied to different subsets: reliable points are trained with pseudo labels together with prototype-based regularization to encourage intra-class compactness; boundary-ambiguous points are guided by evidential consistency to improve boundary learning; and points with high epistemic uncertainty are excluded from pseudo-label-based supervision to mitigate error reinforcement. In addition, an uncertainty calibration term on sparsely labeled points helps stabilize training. Experiments on S3DIS, ScanNet-V2, and SemanticKITTI yield 67.7%, 59.7%, and 53.3% mIoU, respectively, with only 0.1% labeled points, comparing favorably with prior weakly supervised point cloud segmentation methods.

1. Introduction

With the rapid development of 3D perception and computer vision, large-scale point cloud semantic segmentation has become a central task in 3D scene understanding. It has broad applications in indoor modeling, remote sensing mapping, urban planning, and autonomous driving. In recent years, fully supervised methods have continuously advanced segmentation performance [1,2,3,4,5], achieving strong accuracy and robustness on standard benchmarks [6,7,8]. However, their reliance on dense point-wise annotations remains a major obstacle for practical deployment. To reduce labeling effort, weakly supervised point cloud semantic segmentation has attracted increasing attention, aiming to train and infer with only a small fraction of labeled points. Existing weakly supervised approaches can be roughly grouped into two categories. The first follows label propagation [9,10,11], expanding sparse annotations into richer supervision via clustering, query strategies, or region-level consistency. The second focuses on selective use of unlabeled points together with consistency regularization [12,13], and improves performance through iterative optimization. Notably, many methods adopt prediction confidence as the reliability criterion and use a fixed threshold to filter supervisory signals. However, this strategy often discards low-confidence points near class boundaries or in structurally complex regions. Consequently, informative geometric and semantic cues may be overlooked, and erroneous supervision may accumulate and propagate during iterative training.
Under extremely low annotation rates, the key to weakly supervised training lies in how to reliably exploit supervisory signals from unlabeled points. Conventional approaches typically assess prediction reliability using confidence scores or heuristic rules, and then filter or reweight samples accordingly. However, this single-probability characterization has two major limitations. First, the confidence magnitude does not reveal the source of uncertainty. Low-confidence predictions around class boundaries and fine-grained structures may stem from intrinsic class ambiguity, but can also be caused by insufficient model knowledge or noise perturbations. Relying solely on confidence therefore makes it difficult to distinguish these cases. This may lead to selection bias, where confidently wrong predictions are reinforced while informative low-confidence points are overlooked. Second, predictions on unlabeled points often fluctuate during training and exhibit local inconsistency. If hard filtering or uniform consistency constraints are applied indiscriminately, erroneous decisions may persist in disputed regions. This can amplify noise-driven gradients and lead to unstable learning at boundaries and other difficult regions.
To address these challenges, an evidentially driven uncertainty decomposition (EviUD) approach for weakly supervised point cloud semantic segmentation is presented. The main idea is to represent point-wise predictions as evidential distributions and to decompose uncertainty into two components. These components capture epistemic uncertainty and boundary ambiguity, respectively. This provides a more reliable basis for learning from unlabeled points. Specifically, an evidential output is first constructed to enable explicit uncertainty modeling, and uncertainty decomposition is performed to obtain a fine-grained reliability assessment for unlabeled points. Based on this assessment, different training constraints are applied to unlabeled points. Reliable predictions are trained with pseudo-label supervision together with prototype regularization to enhance intra-class consistency. Boundary-ambiguous predictions are regularized by a boundary-aware soft constraint to stabilize boundary learning. Meanwhile, predictions with high epistemic uncertainty are excluded from pseudo-label-based supervision. In addition, an uncertainty calibration term is imposed on sparsely labeled points. This term encourages consistency between the evidence strength and prediction correctness, thereby further improving training stability.
To summarize, our key contributions are the following:
  • Reliability measurement via evidential modeling and uncertainty decomposition. Point-wise predictions are modeled as evidential distributions. Uncertainty is then decomposed to provide a finer-grained reliability measure for unlabeled points. This helps mitigate the selection bias introduced by confidence-only criteria.
  • Uncertainty-aware differentiated weak supervision. Pseudo-label supervision, prototype regularization, and evidential consistency are applied to unlabeled points according to their reliability and boundary characteristics. This promotes intra-class compactness and stabilizes boundary learning.
  • Uncertainty calibration under sparse labels. A calibration constraint is imposed on sparsely labeled points to align uncertainty estimation with prediction correctness. This enables more robust exploitation of unlabeled points and more stable optimization.

2. Related Work

2.1. Weakly Supervised Point Cloud Semantic Segmentation

Weakly supervised point cloud semantic segmentation aims to perform dense semantic prediction with only a small number of labeled points. This reduces annotation costs for 3D scene segmentation and improves the utilization of unlabeled data. To address the critical issue of how to obtain effective supervision from unlabeled points, research under the sparse point-level annotation setting has proven effective, with notable works including [9,11,13,14,15,16,17,18,19,20,21,22]. These methods generally rely on pseudo label generation as the basis and combine strategies such as consistency constraints, structure propagation, and discriminative representation learning. Methods like PSD [15] and PointMatch [17] apply consistency constraints on predictions after perturbations (e.g., rotation, mirroring, and sampling) to stabilize training. DAT [13] constructs region-level augmented samples using structural units like superpoint graphs to enhance cross-view consistency. OTOC [9] iteratively expands sparse annotations through a graph propagation module, explicitly learning similarities between graph nodes. HybridCR [18] strengthens intra-class compactness and inter-class separability through multi-level contrastive constraints, including transformation pairs, local geometric pairs, and class prototype pairs. CPCM [19] and similar methods improve feature discrimination from a context modeling perspective. PointContrast [20] uses contrastive pre-training to provide transferable representations, offering effective initialization for weakly labeled segmentation. Additionally, SQN [11] improves structural identification under weak supervision by utilizing hierarchical representations from sparse neighborhoods, and Pan et al. [21] enhance the coverage and effectiveness of limited annotations through label recommendations. REAL [22] introduces 2D priors to assist with supervision construction in difficult regions. These weakly supervised point cloud segmentation methods generally rely on confidence thresholds to filter pseudo labels, which can introduce selection bias and weaken the effectiveness of supervision in boundary and hard-to-segment regions. In this paper, we introduce uncertainty characterization and decomposition based on evidential representation. This framework provides an explicit reliability assessment for pseudo labels and supports differentiated strategies for sample utilization.

2.2. Evidential Learning and Uncertainty Modeling

Uncertainty estimation has been exploited in weakly supervised point cloud segmentation for pseudo-label reliability assessment and training scheduling. For instance, RAC-Net [23] and PA-Net [24] incorporate uncertainty to impose hierarchical consistency or to characterize prediction risk. OCOC [25] uses temporal output discrepancy to guide sample querying under limited annotation budgets. UCL [26] integrates uncertainty into contrastive learning and feature regularization by modulating pair construction or constraint strength. Overall, uncertainty-aware reliability measures have become a key tool for improving pseudo-label quality, boundary learning, and training stability.
Unlike the uncertainty usage based on prediction distributions or output differences, evidential learning offers a more structured approach to uncertainty modeling. A representative idea is to use the Dirichlet distribution to characterize class probabilities. Evidence is then used as an explicit representation of the model’s support for each class. In this way, both predictions and uncertainty estimates can be obtained in a single forward pass. Sensoy et al. [27] introduced evidential deep learning (EDL). Subsequent work [28,29,30] applied evidential uncertainty to semantic and medical segmentation. These studies reported improved tolerance to noisy supervision and ambiguous boundaries, and using it for interactive annotation and consistency learning.
It should be noted that, although some existing weakly supervised point cloud segmentation methods use uncertainty for pseudo-label evaluation and differentiated constraints [23,24,25,26], end-to-end uncertainty modeling and decomposition based on evidential representation remain relatively limited. Previous studies have shown that evidential learning can provide more interpretable support for noisy supervision and boundary ambiguity in image and medical segmentation tasks [27,28,29,30]. However, unlike 2D images with regular grid structures, 3D point clouds are sparse, unordered, and geometrically irregular. Their local semantic evidence is easily affected by variations in sampling density, occlusion, and complex geometric boundaries. This may lead to unstable evidence estimation and make low-confidence samples harder to identify and exploit. As a result, informative boundary points may be mistakenly discarded during training, while noisy samples may still be retained. Therefore, introducing evidential learning into weakly supervised point cloud segmentation requires targeted adaptation to 3D geometric representation and weakly supervised sample utilization. This helps characterize pseudo-label risk more precisely and improve the use of samples in boundary regions.

3. Method

This section is organized as follows. Section 3.1 overviews the framework. Section 3.2 presents evidential modeling and uncertainty decomposition. Section 3.3 describes reliability-based partition and differentiated constraints for unlabeled points. Section 3.4 summarizes the loss functions and optimization objective.

3.1. Overview

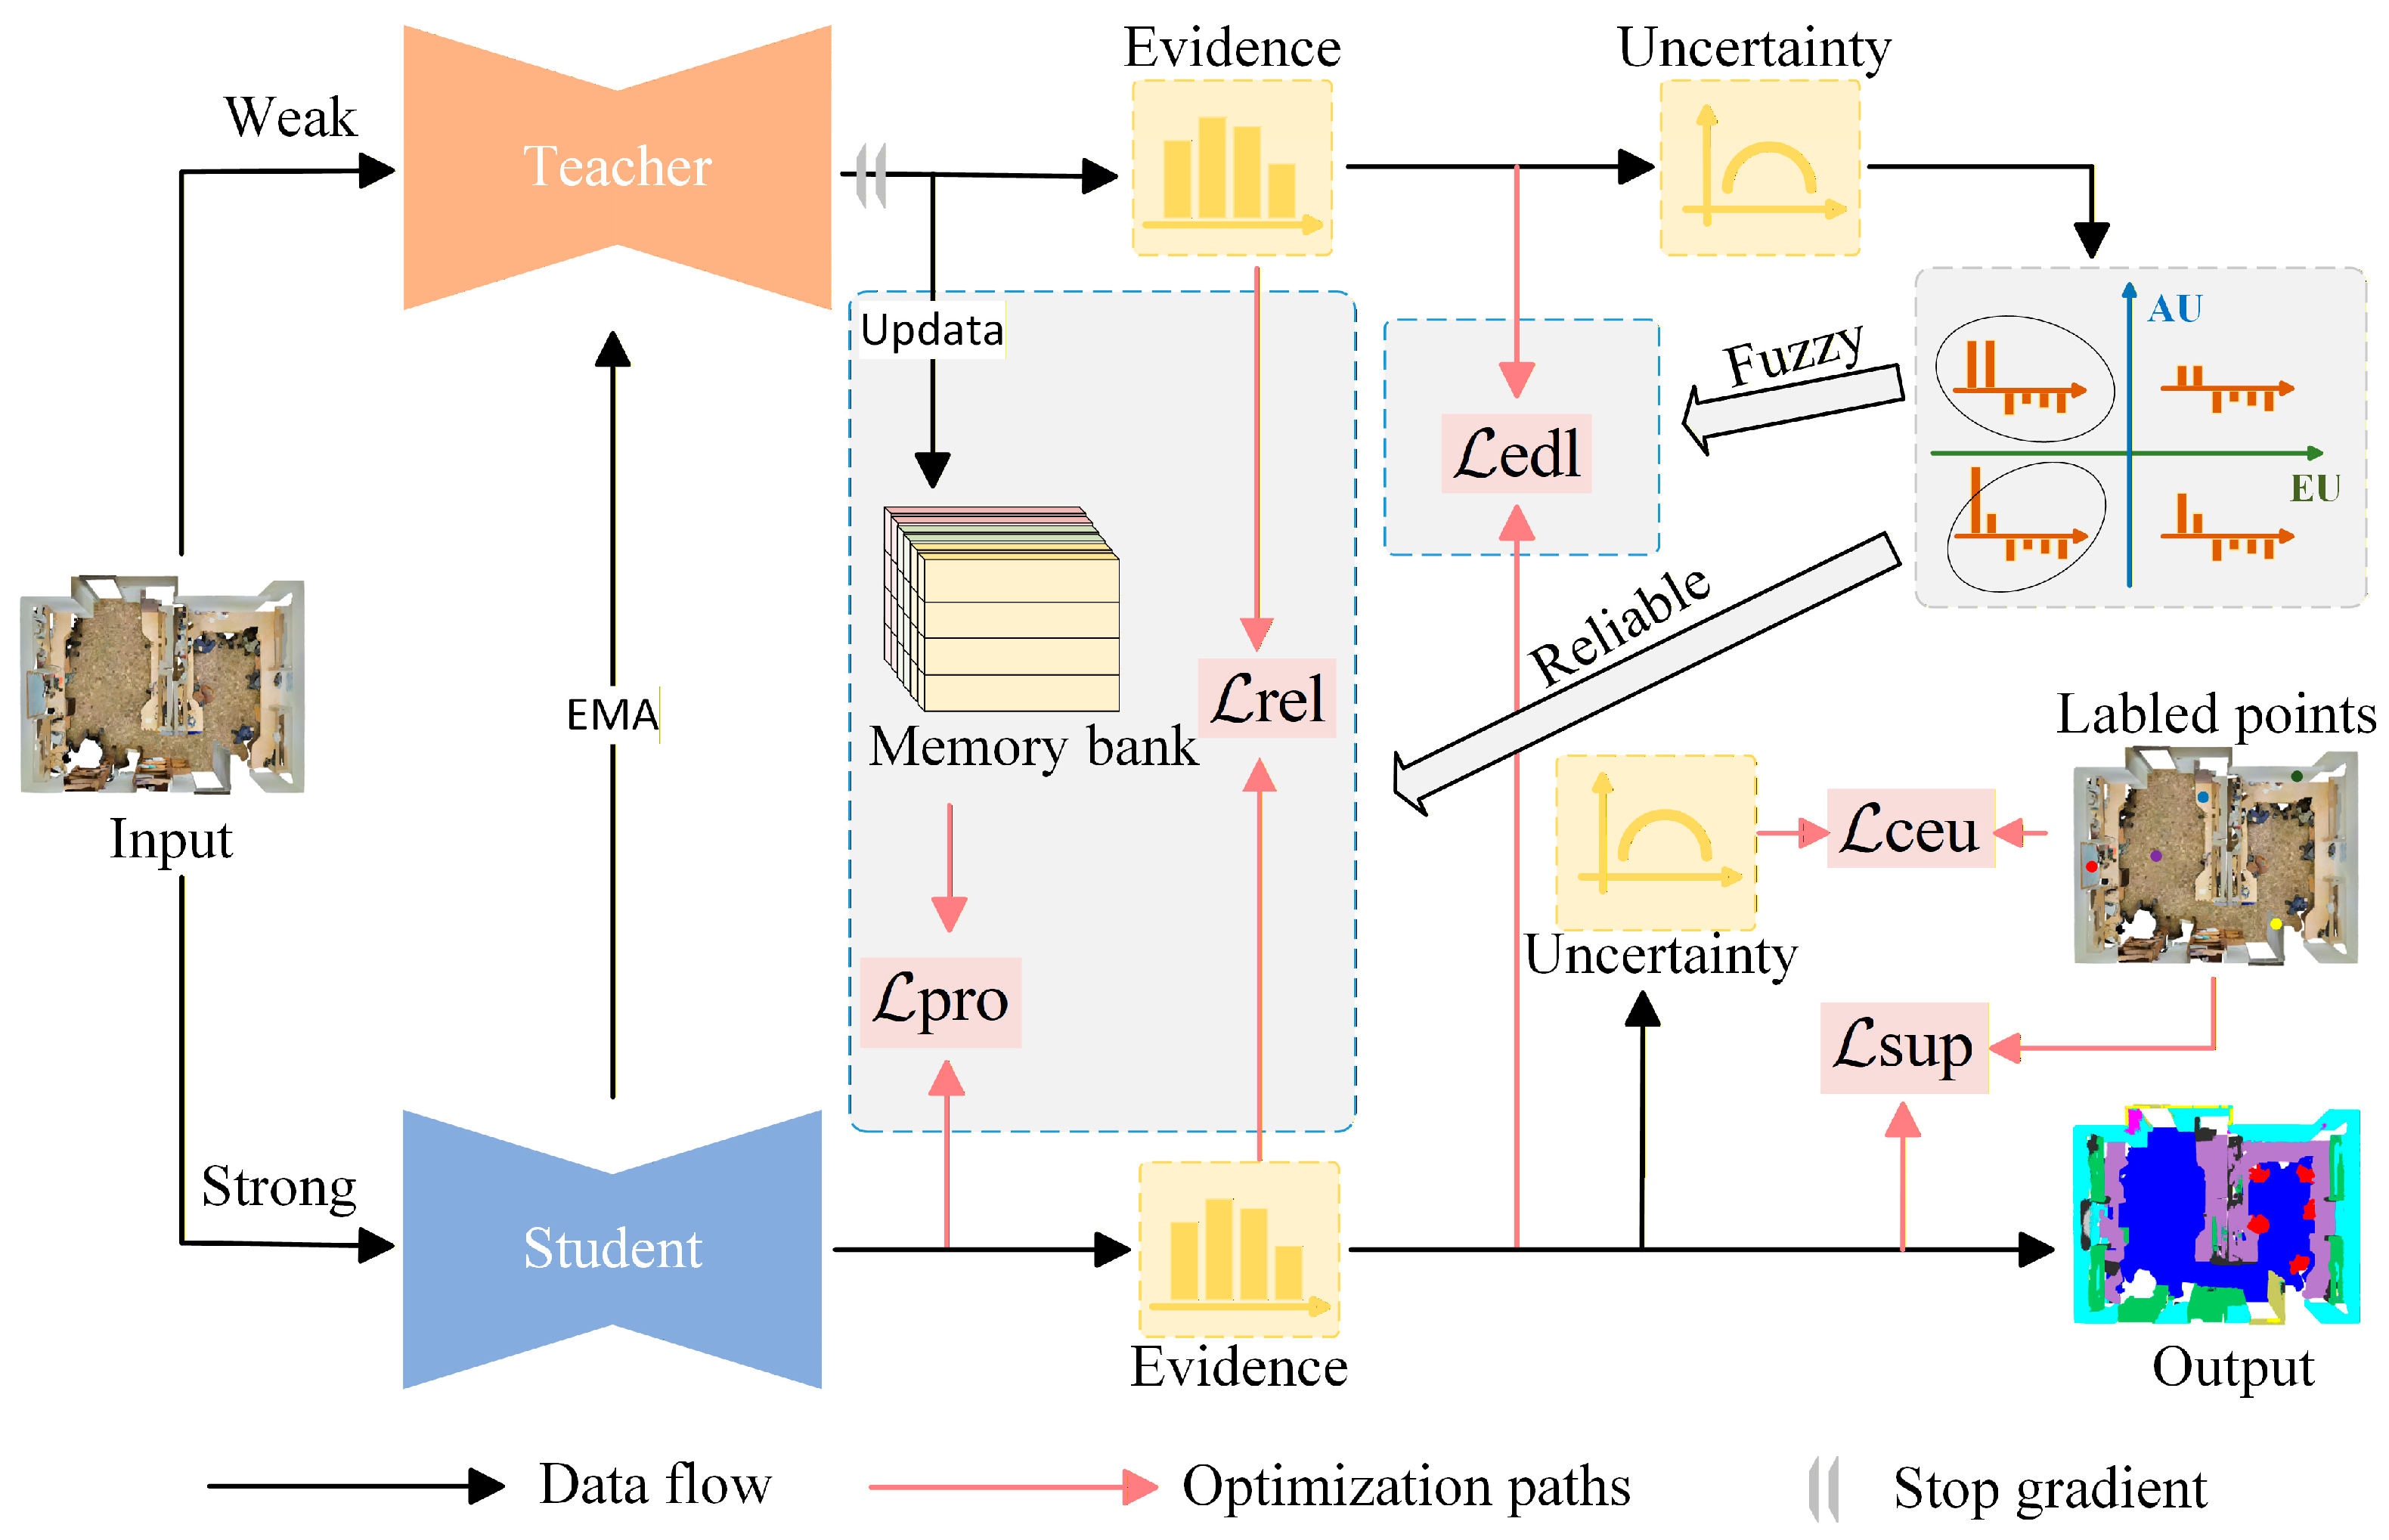
An evidentially driven uncertainty decomposition method for weakly supervised point cloud semantic segmentation, termed EviUD, is proposed. The overall framework is illustrated in Figure 1. The core idea of EviUD is to explicitly quantify point-level uncertainty through evidential modeling and to use the decomposed uncertainty to guide selective utilization of unlabeled points during training.
The input training set X consists of N points, including both labeled and unlabeled points. For each input point i X , the teacher–student framework produces
z i t , f i t = F t ( i , θ t ) z i s , f i s = F s ( i , θ s ) ,
where F t and F s denote the teacher and student networks, respectively, with θ t and θ s being their corresponding parameters. For each model, two outputs are obtained: z i denotes the logits (unnormalized class scores), and f i represents the embedding feature associated with point i .
In weakly supervised point cloud semantic segmentation, low-confidence predictions do not always correspond to unusable samples. On the one hand, sparse sampling, occlusion, missing regions, and local geometric noise may prevent the model from acquiring sufficient knowledge, which makes the prediction itself unreliable. On the other hand, class boundaries, fine-grained structures, and local geometric transition regions can also produce high uncertainty, while such samples often still contain useful discriminative information. If sample selection relies only on a unified confidence score or a single uncertainty measure, informative boundary samples may be wrongly discarded, while noisy samples may still be retained during training.
To address the unstable local evidence, mixed sources of low-confidence samples, and the easy propagation of noise under sparse supervision in point clouds, this paper constructs evidential representations based on geometric feature representations and further performs uncertainty decomposition in the evidential space. In this way, high-risk samples caused by insufficient model knowledge can be distinguished from ambiguous samples caused by boundary mixing and complex local structures. Based on the decomposition results, unlabeled points are divided into a reliable set and a fuzzy set, and differentiated constraints are imposed during subsequent training to achieve a sample utilization strategy that is more suitable for weakly supervised point clouds.
During training, a teacher–student scheme is adopted to provide a more stable reference prediction, and weak/strong perturbations are used to construct complementary views. The teacher network produces reference predictions under weak perturbations, while the student network is optimized under strong perturbations to improve robustness. The teacher parameters are updated as an exponential moving average (EMA) of the student parameters.
θ t ( k + 1 ) = β θ t ( k ) + ( 1 β ) θ s ( k + 1 ) ,
where θ t ( k ) denotes the teacher parameters at the current (i.e., k -th) step, and θ s ( k + 1 ) represents the updated student parameters after the ( k + 1 )-th gradient update. The coefficient β [ 0 , 1 ) controls the extent to which the teacher retains its previous parameters. With this update scheme, the teacher network maintains a temporally smoothed version of the student’s historical parameters. It gradually accumulates knowledge and reduces parameter fluctuations. As a result, the teacher network produces more stable predictions. The final overall training loss is used to update only the student network parameters.

3.2. Evidential Representation and Uncertainty Decomposition

3.2.1. Evidential Representation

A key difficulty in weakly supervised point cloud semantic segmentation is that a large number of unlabeled points must be incorporated into training, while sparse sampling, local occlusion, and complex geometric boundaries make point-wise reliability estimation more unstable. Unlike images with regular grids, where local context is relatively continuous, the local semantic evidence of point clouds usually depends on aggregation over discrete neighborhoods. As a result, its stability is more easily affected by changes in sampling density and local geometric perturbations. A common practice is to treat softmax probabilities as confidence scores and use them to filter or reweight pseudo labels. However, the normalization in softmax implicitly assumes a closed-set setting: probability mass is forced to be assigned to the predefined class set. Even when the model lacks sufficient evidence, softmax may still yield a seemingly confident distribution via relative normalization, thereby amplifying confirmation bias from erroneous pseudo labels. To this end, Dempster–Shafer Theory (DST) is introduced as the theoretical foundation, and its parametric extension, Subjective Logic (SL), is adopted for evidential representation. This design explicitly separates class support from unknown mass, thereby improving the interpretability and stability of point-wise reliability modeling in weakly supervised point cloud scenes.
Specifically, the teacher outputs the logits as follows:
z i = [ z i 1 , , z i C ] .
To enable DST/SL for evidential representation, a non-linear activation function A ( 🞄 ) is applied to the logits, mapping them into class-specific evidence
e i c = A ( z i c ) , e i c 0 ,
where A ( 🞄 ) can take functions such as R e L U ( 🞄 ) , S o f t p l u s ( 🞄 ) , or e x p ( 🞄 ) for activation. Considering the point cloud segmentation of logits, they may exhibit wide fluctuation, whereas S o f t p l u s ( 🞄 ) maintains smooth monotonicity, making it more stable numerically.
After obtaining the non-negative evidence e i c , SL decodes the support strength for each class and interprets the prediction of i as a dominant hypothesis
ω i = ( b i , u i ) , b i = { b i 1 , , b i c } , u i [ 0 , 1 ] ,
where b i c denotes the belief mass assigned to class c , and u i represents the uncertainty for the point. Unlike the closed-world assumption of softmax, SL/DST allows the explicit modeling of uncertainty mass, with its core constraint being
u i + c = 1 C b i c = 1 .
This illustrates the key requirement in weakly supervised segmentation: the model must not only assign belief mass among classes, but also reserve mass for uncertainty, avoiding forcing unreliable pseudo labels to be interpreted as certain classes. Furthermore, SL provides a parametric form for the distribution of belief mass. Let the Dirichlet strength of point i (i.e., total evidence strength) be defined as
S i = c = 1 C α i c , α i c = e i c + 1 .
The belief mass and uncertainty mass can then be expressed as
b i c = e i c S i , u i = C S i .
Equation (8) demonstrates the consistency of the belief signature with weak supervision and the high degree of alignment with the single adjustment property: When no evidence is available ( c e i c 0 S i C ), then u i 1 , the model outputs “I don’t know”. When evidence becomes increasingly abundant ( S i ), then u i 0 , the prediction converges to certainty. In contrast, softmax, even when evidence is scarce, is forced to output a normalized probability peak, leading to a pseudo-label trap with superficially high confidence but no actual supporting evidence. SL’s uncertainty mass explicitly exposes this ignorance, providing a controllable risk signal for subsequent training.
To enable end-to-end learning in the discriminative segmentation network and provide a finer-grained uncertainty characterization, we further formalize this subjective opinion using the Dirichlet distribution. From Equation (7), the evidence associated with each point i is modeled by a Dirichlet distribution:
π i Dir ( α i ) , α i = [ α i 1 , , α i C ] .
The expected predictive probability:
p i c = Ε [ π i c ] = α i c S i .
It is worth emphasizing that the introduction of the Dirichlet distribution serves a purpose beyond merely producing a predictive probability. The Dirichlet distribution jointly encodes both the predictive mean and the evidence strength. Thus, two points may have similar probability shapes but different S i , distinguishing well-supported certainty from normalization-amplified certainty. This property is crucial for risk-aware pseudo-label utilization and forms the basis for uncertainty decomposition and sample partitioning described in the following sections.

3.2.2. Uncertainty Decomposition

Uncertainty in weakly supervised point cloud segmentation does not arise from a single source, and this mixed nature is more pronounced in point cloud scenes. One part comes from insufficient model knowledge, such as long-tailed categories, domain shift, and atypical structures caused by occlusion or partial observations. The other part comes from the intrinsic ambiguity of the data, including class boundary overlap and the vagueness of thin structures under sparse sampling. If these sources are not distinguished, training may over-trust seemingly high-confidence pseudo labels and reinforce early errors. At the same time, informative but uncertain boundary points may be underused. To address this issue, we further decompose uncertainty on top of evidential modeling to answer two questions: whether a pseudo label is reliable and how uncertain samples should be constrained.
Building upon the evidential representation, we further decompose point-wise uncertainty into epistemic uncertainty (EU) and aleatoric uncertainty (AU). EU reflects insufficient knowledge caused by limited evidence. AU describes the intrinsic ambiguity of the predictive distribution when the evidence is relatively adequate, which is often related to boundary mixing and locally ambiguous structures. EU therefore measures model-level ignorance. When the model lacks sufficient knowledge, the evidence assigned to all classes e i c tends to be globally small, which is reflected by a low S i and consequently a high u i . Based on this property, we adopt the u i as the quantitative form of epistemic uncertainty.
E U i = u i = C S i .
Even when the softmax output exhibits a sharp, peaked probability for certain points, a low total evidence strength may still result in high EU. Such points often constitute a major source of high-risk pseudo labels.
In contrast, AU measures data-level uncertainty. Since Dirichlet provides a posterior form over class probabilities, the expected entropy of this distribution can quantify the intrinsic ambiguity.
A U i = Ε π i [ H ( π i ) ] = Ε [ c = 1 C π i c log π i c ] .
Owing to the availability of an analytic expectation of the logarithmic terms under the Dirichlet distribution, the above formulation admits a closed-form expression.
A U i = c = 1 C α i c S i ( φ ( α i c + 1 ) φ ( S i + 1 ) ) ,
where φ denotes the digamma function φ ( x ) = d d x log Γ ( x ) , and Γ denotes the gamma function, Γ ( x ) = 0 t x 1 e t d t .
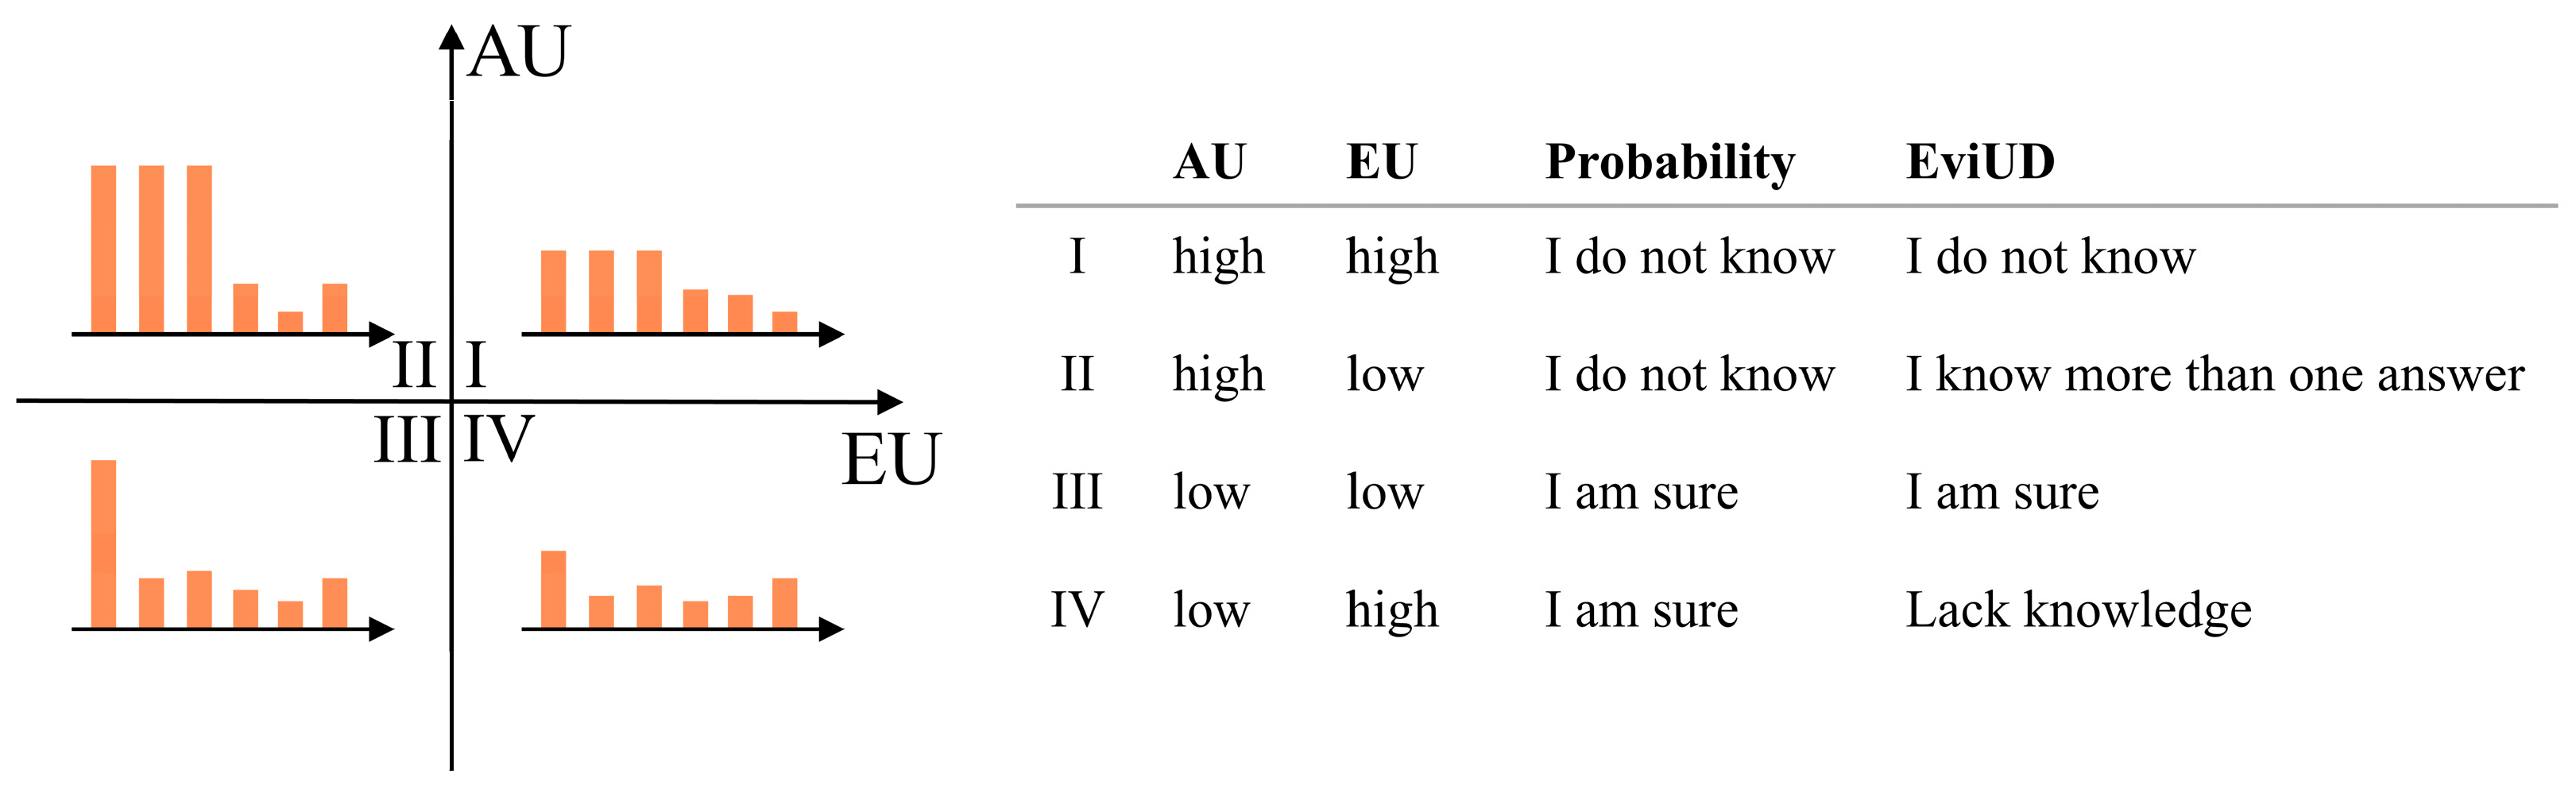
Figure 2 illustrates the relationship between EU and AU. To consistently schedule the utilization of unlabeled points during training, we partition samples on the (EU, AU) plane using two thresholds ( τ E U , τ A U ) . We adopt percentile-based adaptive thresholds. τ E U and τ A U are dynamically determined at each iteration according to the statistical distributions of the teacher-estimated corresponding uncertainty measures, using predefined percentile ratios rather than fixed constants. If an unlabeled point satisfies E U i τ E U and A U i τ A U , it is considered reliable and included in reliable Ω R .
Ω R = i | E U i τ E U , A U i τ A U
If E U i τ E U but A U i > τ A U , the point typically lies near class boundaries or exhibits multi-modality, and is assigned to the fuzzy set Ω B .
Ω B = i | E U i τ E U , A U i > τ A U .
Finally, when E U i > τ E U , it indicates that the point lies in a region of model ignorance with insufficient evidence. Even if its mean prediction exhibits a sharp probability peak, this is more likely due to normalization-induced apparent certainty and represents a primary source of high-risk pseudo labels.
Overall, the EU/AU decomposition provides a clear routing criterion for subsequent differentiated constraints. Reliable points support pseudo-label supervision and intra-class consistency. Fuzzy points preserve boundary information and are handled with gentler constraints.

3.3. Weakly Supervised Constrained Optimization

Based on evidential predictions and their uncertainty decomposition, the learning problem for unlabeled points is formulated as a reliability-aware weakly supervised constrained optimization problem: reliable signals should be fully utilized, while boundary-ambiguous signals should participate in a soft manner.

3.3.1. Calibration of Epistemic Uncertainty with Sparse Annotations

In weakly supervised point cloud segmentation with extremely sparse point-level annotations, complex local geometric structures and limited supervision further amplify scale bias in evidence estimation. To improve the stability of evidence estimation in point cloud scenes, sparse labeled points are used to explicitly calibrate epistemic uncertainty.
In the early stages of weakly supervised training, the network’s evidential outputs and uncertainty quantification often exhibit scale bias. For instance, the model may produce low EU even when making incorrect predictions, or exhibit excessively high EU on correct predictions. To address this, we introduce a Calibrated Epistemic Uncertainty (CEU) loss. This loss uses sparsely labeled points to provide supervised calibration for EU.
Specifically, for a set of labeled points Ω L , where the true label of point i is y i , the predicted class by the student network is defined as follows:
y i s = arg max p i c s .
Defining an indicator variable for prediction correctness:
r i = I y ^ i = y i , r i { 0 , 1 } .
Here, r i = 1 indicates a correct prediction, and r i = 0 indicates an incorrect prediction. Based on the epistemic uncertainty E U i s output by the student network, it is mapped to a risk scalar.
e u i s = clip ( E U i s , 0 , 1 ) ,
where clip ( ) is used to constrain the uncertainty within a stable range.
Subsequently, the CEU loss calibrates the uncertainty using a binary cross-entropy formulation.
L c e u = 1 Ω L i Ω L ( r i log ( 1 e u i s ) ( 1 r i ) log e u i s ) .
This loss explicitly establishes a consistency constraint between prediction correctness and epistemic uncertainty, enabling the model to learn a stable and interpretable scale of epistemic uncertainty. As a result, it effectively mitigates confirmation bias in weakly supervised learning and enhances overall training stability.

3.3.2. Pseudo Label Supervision and Feature Alignment on the Reliable Set

The reliable set Ω R , obtained through double-threshold partitioning, is supported by relatively sufficient evidence and exhibits weak class competition. Therefore, it can be regarded as the lowest-risk and highest-value source of unlabeled points for weakly supervised training. On this set, we construct a pseudo-label supervision term and further impose a feature alignment constraint. This design mitigates representation drift and inter-class ambiguity in weakly supervised learning, thus improving the stability and transferability of pseudo-label learning.
Specifically, for i Ω R , a hard pseudo-label is generated based on the class with the maximum response predicted by the teacher network.
y ^ i = arg max p i c , i Ω R .
However, even within the reliable set, the strength of evidence may vary across points. Applying uniform supervision to all reliable points could still amplify the effect of a small number of noisy pseudo labels. To address this, we construct continuous weights based on epistemic uncertainty, allowing the supervision strength to adaptively scale with the degree of evidence sufficiency. Concretely, the continuous weight is defined using the teacher network’s epistemic uncertainty E U i t .
ω i = 1 clip ( EU i t , 0 , 1 ) , i Ω R .
For i Ω R , a weighted pseudo-label supervision loss is constructed using the pseudo-label y ^ i obtained from Equation (16).
L r e l = 1 Ω R i Ω R ω i log p i , y ^ i s ,
where p i , y ^ i s denotes the prediction probability of the student network for the pseudo-label class. We perform supervision by combining hard pseudo-labels with evidential weighting. This allows the supervision strength to be adaptively adjusted according to the sufficiency of the teacher’s evidence. As a result, the supervisory sample set is expanded, while the risk of confirmation bias is minimized.
To further stabilize the feature space, a teacher-side class prototype memory bank is constructed as a cross-iteration semantic anchor.
P = ρ c c = 1 C , ρ c D ,
where D denotes the dimension of point-level embeddings. For each class c , the weighted class center is computed from points in the reliable set predicted by the teacher network as class c .
μ c = i Ω R c ω i f i t i Ω R c ω i + ε , Ω R c = i Ω R y ^ i = c ,
where ε is a small term for numerical stability. The global prototypes are then updated using an EMA strategy.
ρ c = η ρ c + 1 η μ c ,
where ρ c is the prototype from the previous iteration and η is the EMA coefficient. If a class is not sampled in the current iteration, or if its reliable set is empty, its prototype is retained from the previous iteration.
To encourage student features to form stable class clusters under reliable pseudo-label guidance, the student embeddings f i s are pulled towards the corresponding teacher prototype ρ y ^ i . First, embeddings are normalized:
f ^ i s = f i s f i s , ρ ^ c = ρ c ρ c .
Then, the prototype alignment loss is defined as follows:
L p r o = 1 Ω R i Ω R ω i ( 1 f ^ i s , ρ ^ y ^ i ) ,
where 🞄 denotes the cosine similarity. The prototype alignment loss and the pseudo-label supervision loss are complementary. The former constrains feature-level representations, whereas the latter regularizes network predictions. Together, they promote stable and robust learning.

3.3.3. Soft Consistency Constraint on the Fuzzy Set

Points in the fuzzy set possess some evidence support, but the evidence exhibits significant competition across multiple classes. Such points are often located near semantic boundaries, in regions with unclear local structures, or in transitional class areas. Based on this, we adopt a soft consistency regularization instead of hard supervision, using the teacher’s soft output distribution to constrain the student’s output to remain consistent. This approach improves training stability without undermining boundary uncertainty.
Specifically, for i Ω B , a soft distribution is constructed:
q i = softmax ( z i ) ,
it is important to note that the softmax here is not used for uncertainty modeling or final prediction decisions. Its sole purpose is to represent the class distribution pattern and does not provide a reliability measure, thus remaining consistent with the original intent of introducing evidence theory.
To simultaneously constrain both the teacher-to-student and student-to-teacher discrepancies, and to avoid the instability of a one-way KL divergence under extreme distributions, we employ a symmetric KL to construct the evidence consistency loss.
L e d l = 1 Ω B i Ω B γ i ( D K L ( q i t q i s ) + D K L ( q i s q i t ) ) ,
here, γ i is an adaptive decay coefficient, which is constructed based on the teacher-side aleatoric uncertainty A U i t .
γ i = exp ( A U i t ) .
The evidence consistency loss essentially imposes a soft pseudo-label consistency constraint on points in the fuzzy set. It does not require the student output to converge to a single class; rather, it encourages the student’s predicted distribution to align with the teacher’s prediction at the same point. In this way, training oscillations are suppressed without compromising the inherent boundary ambiguity.

3.4. Overall Loss

For the sparsely labeled point set Ω L , which provides limited supervision in the weakly supervised scenario, a hard supervision is applied to the student model using the cross-entropy loss.
L s u p = 1 Ω L i Ω L y i log ( p i s ) ,
where y i denotes the ground-truth label of point i , represented as a one-hot vector.
The final overall loss is formulated as:
L a l l = L s u p + L c e u + L p r o + L r e l + L e d l .

4. Experimental Results

4.1. Dataset

The S3DIS [6] dataset is currently the most widely used point cloud dataset for indoor scene segmentation. It contains six indoor areas, comprising a total of 271 scenes and 13 semantic categories. XYZ coordinates and RGB colors are used as input. Area 5 is designated as the validation and test set, while the remaining areas are used for training.
The ScanNet-V2 [7] dataset is a large-scale point cloud dataset for indoor scene understanding, annotated with 20 object categories covering common indoor structures and furniture. The dataset contains 1513 independent scanning scenes, with 1201 scenes in the training set and 312 scenes in the validation set.
The SemanticKITTI [8] dataset is a large-scale autonomous driving dataset for semantic segmentation and object detection. It provides dense point-level semantic annotations for every LiDAR scan frame across all odometry sequences, covering a full 360° field of view. In this work, 19 semantic categories are selected for training and testing.

4.2. Experimental Setup

4.2.1. Data Perturbation

During training, different levels of geometric perturbations are applied to the input point clouds. For weak perturbations, only constrained spatial transformations are applied, including a random rotation around the z-axis within [−π/6, π/6] and random scaling within [0.9, 1.0]. No random noise or point dropout is introduced, so the overall geometric structure remains stable. For strong perturbations, the magnitude of geometric changes is further increased based on the weak perturbations: random rotation around the z-axis is performed within [−π, π], random scaling within [0.9, 1.1], and random jitter with an amplitude of 5% is added. All perturbations do not alter the semantic labels of the points, but increase input diversity at the geometric level. Such rotation, scaling, and jitter augmentations have been widely adopted and validated as effective in point cloud classification and semantic segmentation tasks [3,24].

4.2.2. Evaluation Metrics

To objectively assess the performance of weakly supervised point cloud semantic segmentation methods, we adopt the mean Intersection over Union (mIoU), the most commonly used metric in semantic segmentation, as the primary evaluation criterion. The mIoU reflects both the segmentation accuracy for each class and the balance across different classes. For any class, the Intersection over Union (IoU) is defined as the ratio of the intersection to the union of the predicted and ground-truth point sets for that class.
IoU c = T P TP + F P + F N
where TP , FP and FN denote the numbers of true positives, false positives, and false negatives.
The mIoU is then defined as the arithmetic mean of IoU c across all classes.
mIoU = 1 C c = 1 C IoU c

4.2.3. Implementation Details

All experiments for the proposed EviUD method are conducted on a GeForce RTX 4090 GPU. The method is evaluated on the S3DIS, ScanNet-V2, and SemanticKITTI datasets, with weak supervision ratios set to 0.1% and 1%. Considering its good balance between performance and efficiency, PointMeta [31] is adopted as the backbone network in this paper. The teacher model is updated using an EMA strategy, with the required weight β set to 0.99 according to the standard mean-teacher paradigm [32]. The prototype update weight is set to 0.75. The AdamW optimizer is used with a weight decay of 10−4.
On S3DIS, point clouds are first voxel-downsampled with a voxel size of 0.04 m. Sub-blocks are queried by selecting a random point as the center and retrieving its neighboring points, with a fixed input of 24,000 points per block. The batch size is set to 8, the initial learning rate is 0.01, and the model is trained for 100 epochs.
On ScanNet-V2, voxel-downsampling uses a size of 0.02 m, with a fixed input of 64,000 points per training iteration. The batch size is set to 2, and the model is trained for 100 epochs using a step-wise learning rate decay strategy.
On SemanticKITTI, to accommodate the varying density of outdoor sparse point clouds, a coarser downsampling scale is applied, with the first layer downsampling interval set to 0.06 m. The model is trained for 250 epochs with an initial learning rate of 0.04 using cosine scheduling, and an L2 weight decay of 3 × 10⁻⁴ is applied to mitigate overfitting.
For uncertainty-driven sample partitioning, we adopt a double-threshold strategy, where τ E U and τ A U are set as the 50th and 60th percentiles of the EU/AU distributions over unlabeled points in the current batch, respectively.

4.3. Comparative Experiments

As shown in Table 1, the proposed EviUD achieves consistently strong performance on the S3DIS Area-5 test set under weak supervision. With a 0.1% annotation ratio, EviUD attains 67.7% mIoU, outperforming SQN by 6.3 points and UCL by 2.3 points. Notably, its performance is comparable to that of fully supervised KPConv (67.1%), indicating that EviUD can effectively narrow the performance gap between weakly supervised and fully supervised approaches under extremely low annotation ratios. This result validates the effectiveness of evidential representation and uncertainty-guided training. It should be noted that all compared methods in this paper are based on the pure point-cloud weakly supervised semantic segmentation setting. Some recent methods rely on additional image information, foundation segmentation models, or vision-language priors. Since their supervision assumptions and data dependencies differ from ours, a fair comparison under consistent conditions is difficult, and thus they are not included in our comparative experiments.
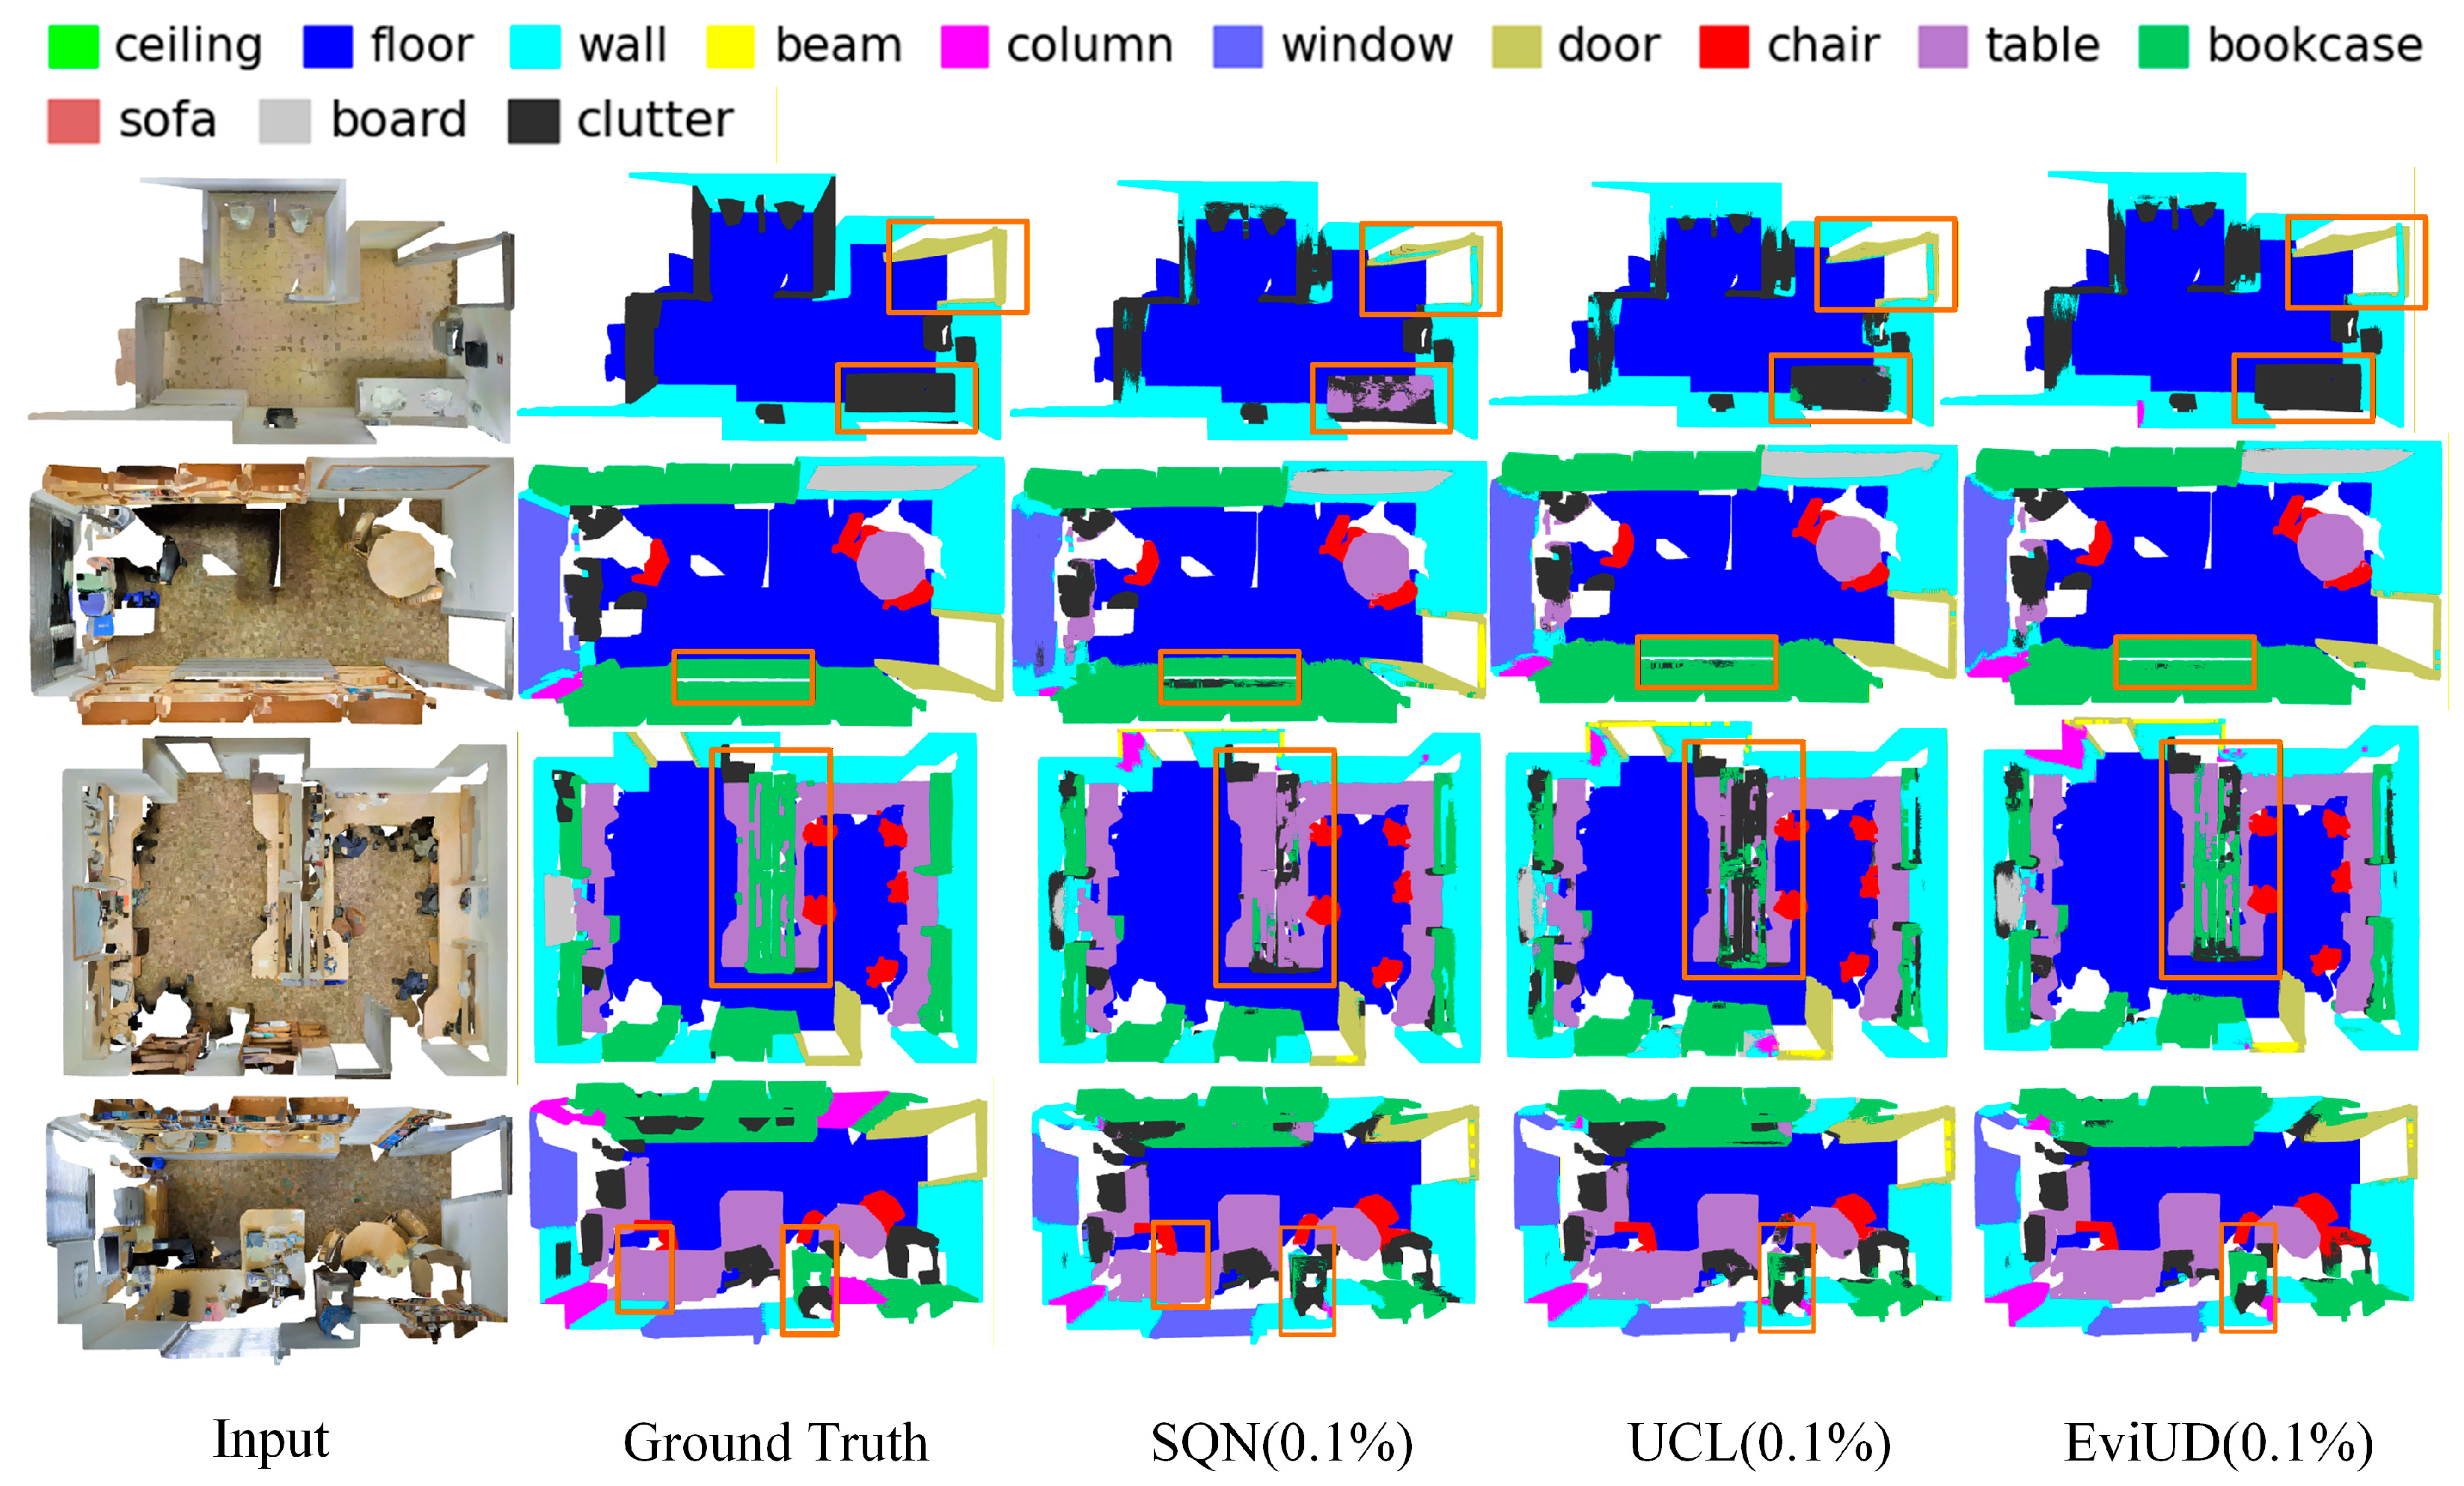
From the visualization results in Figure 3, it can be further observed that EviUD produces more precise segmentation in boundary regions and fine-grained structures. In the S3DIS Area-5 scenes, for local contours of categories such as “chair” and “table,” our method is able to preserve more structural details along the edges and reduce the adhesion and misclassification between adjacent categories at boundaries. In particular, within the boxed regions highlighted in the figure, EviUD demonstrates more stable predictions in areas with complex geometric transitions, closely aligning with the ground-truth contours. This improvement is mainly attributed to our evidential uncertainty decomposition and sample-wise partitioning strategy: boundary-ambiguous points are treated as high-AU regions and constrained separately, which enhances the coherence and robustness of boundary learning without introducing noisy pseudo labels. Moreover, EviUD yields more complete semantic layouts and fewer fragmented predictions in regions containing cluttered objects and narrow structures.
Further analysis of the performance across different datasets is presented in Table 2. The proposed EviUD method also achieves strong results on ScanNet-V2 and SemanticKITTI. On ScanNet-V2, the mIoU at a 0.1% annotation ratio even surpasses that of HybridCR at a 1% annotation ratio, demonstrating the method’s strong generalization capability in indoor scenes. On SemanticKITTI, the mIoU reaches 53.3%, outperforming other weakly supervised methods, indicating that the method is also effective for large-scale, sparse outdoor point cloud scenarios.
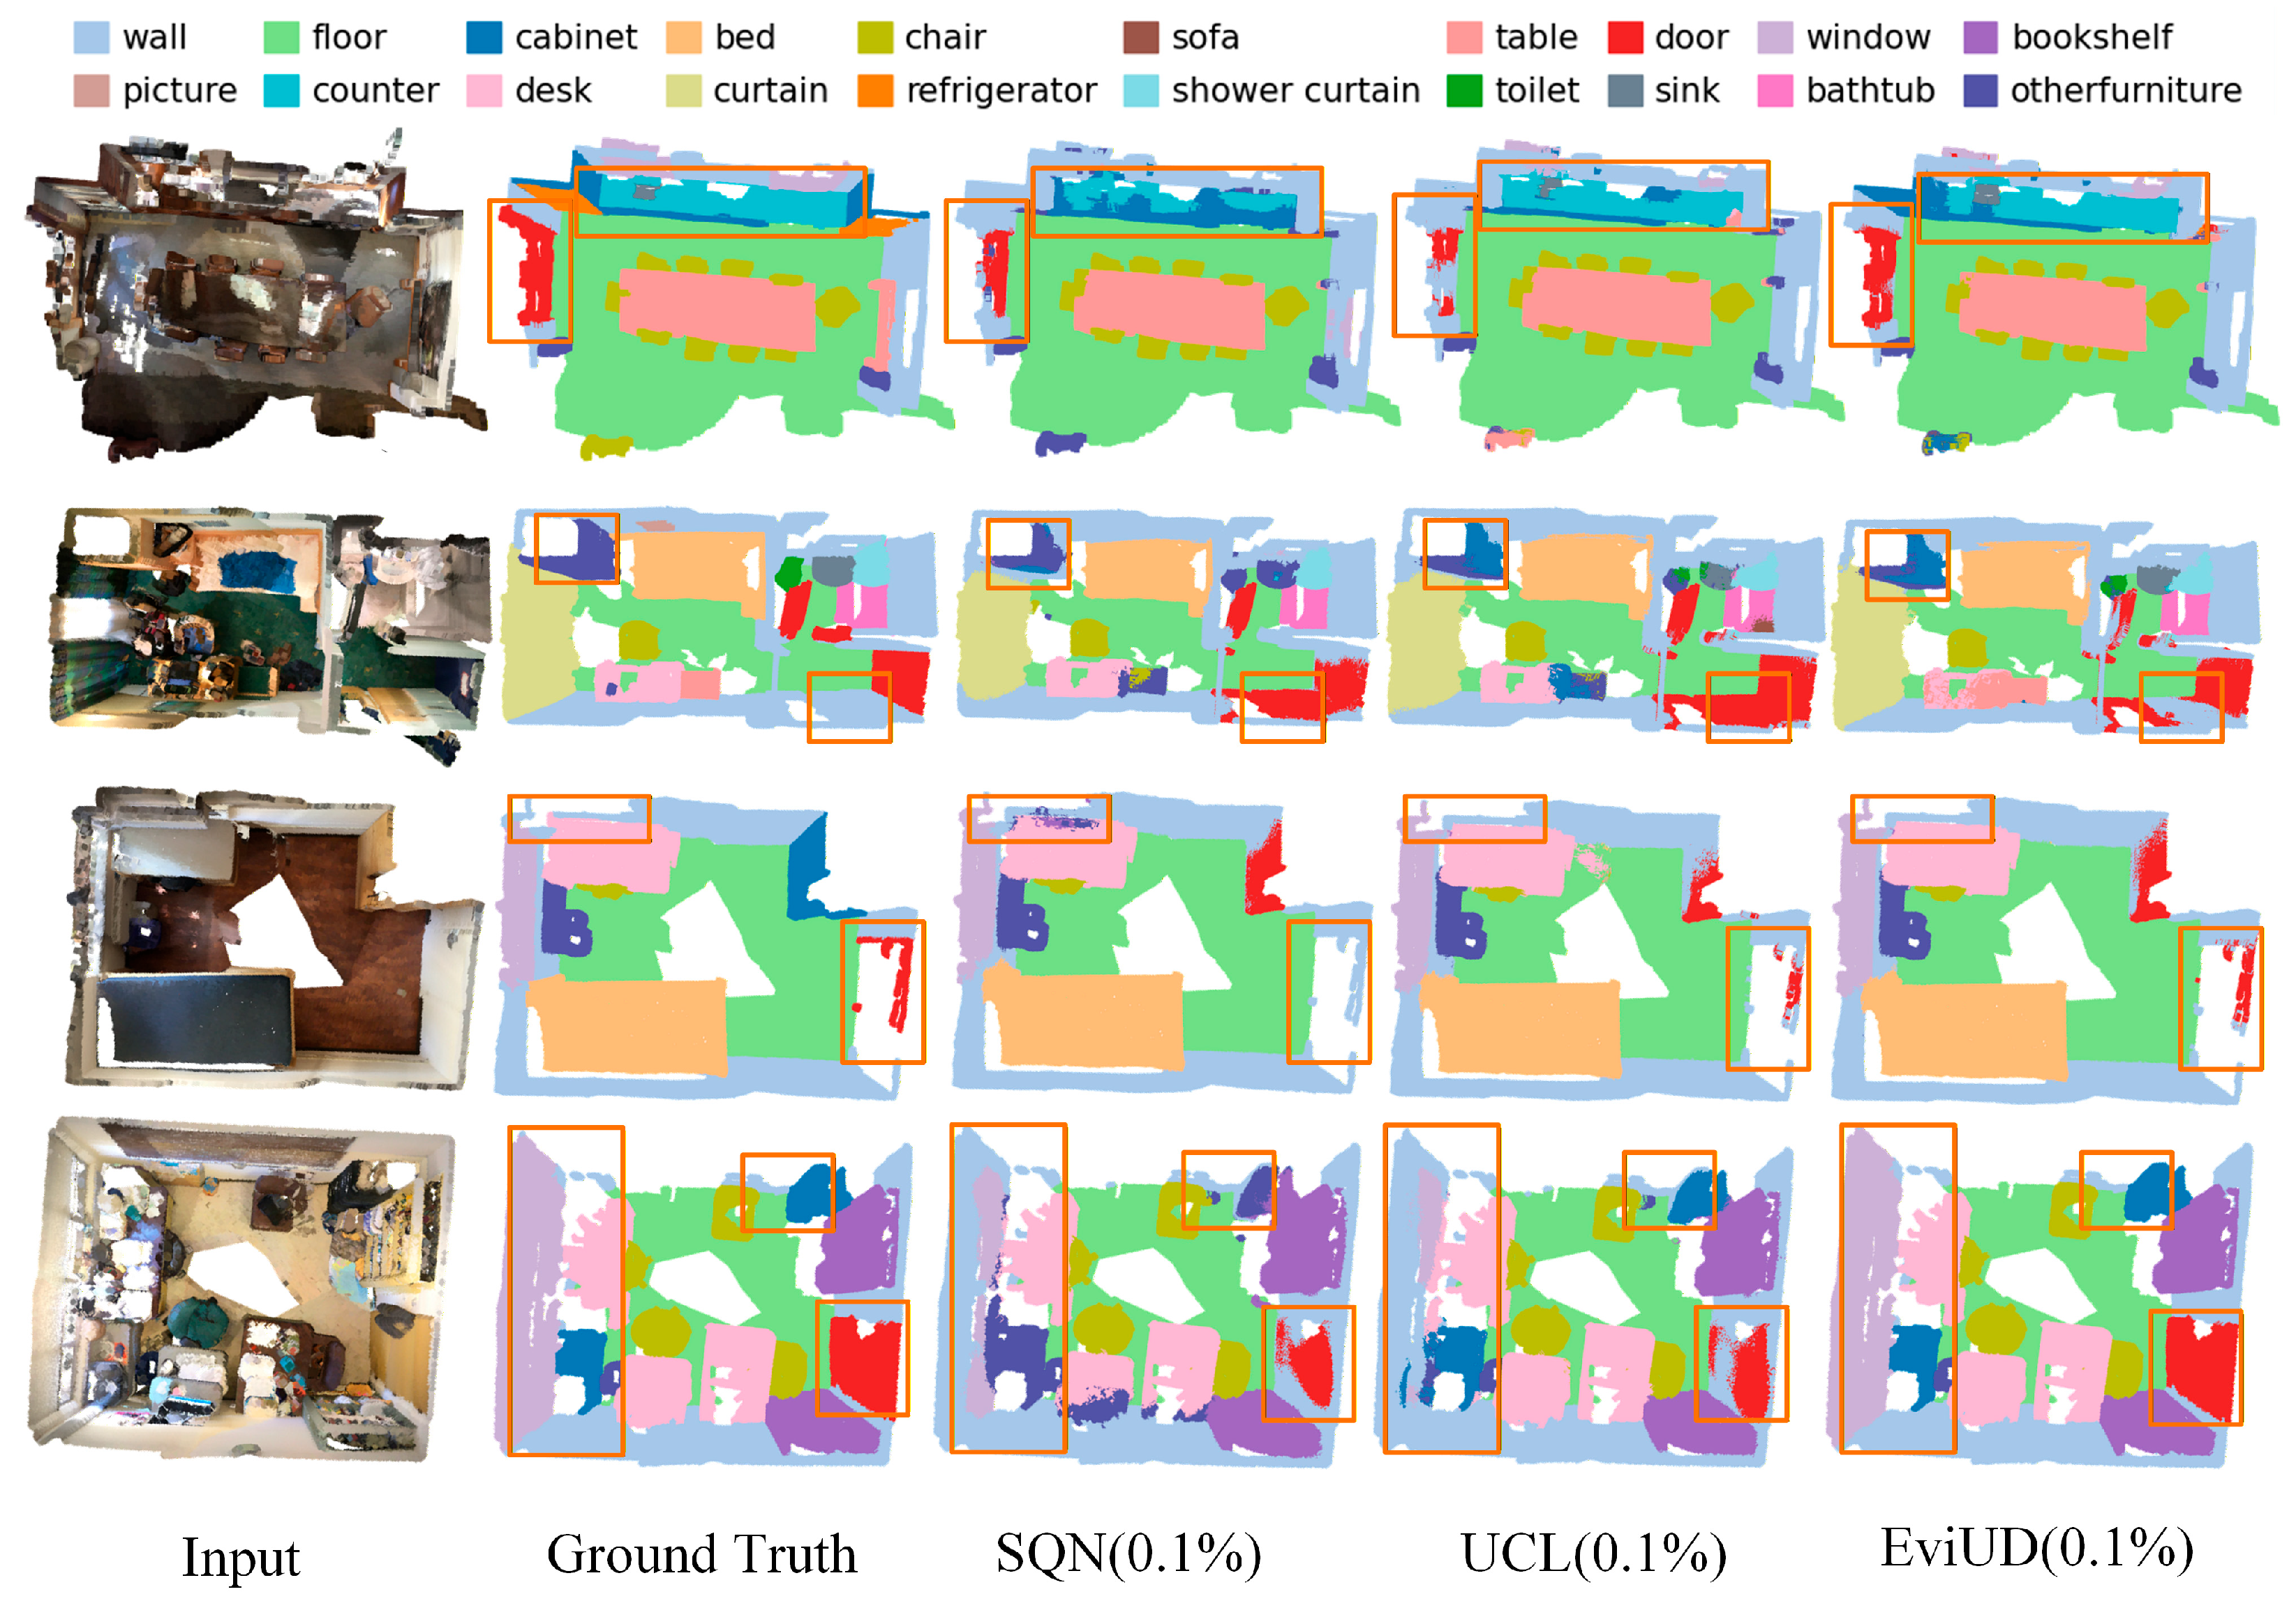
As shown in Figure 4, in ScanNet-V2 scenes, the proposed method produces predictions that closely follow the true contours in geometrically intricate and boundary-dense regions such as furniture corners and door frames, with noticeably fewer misclassifications and omissions. This result demonstrates that evidential point-level uncertainty characterization and decomposition provide a reliable indication of sample difficulty during training, enabling the model to apply appropriate supervision and constraints to reliable points and boundary-ambiguous points, rather than simply discarding low-confidence points. Consequently, the method improves both the fidelity of fine details in complex boundary regions and the overall segmentation coherence.
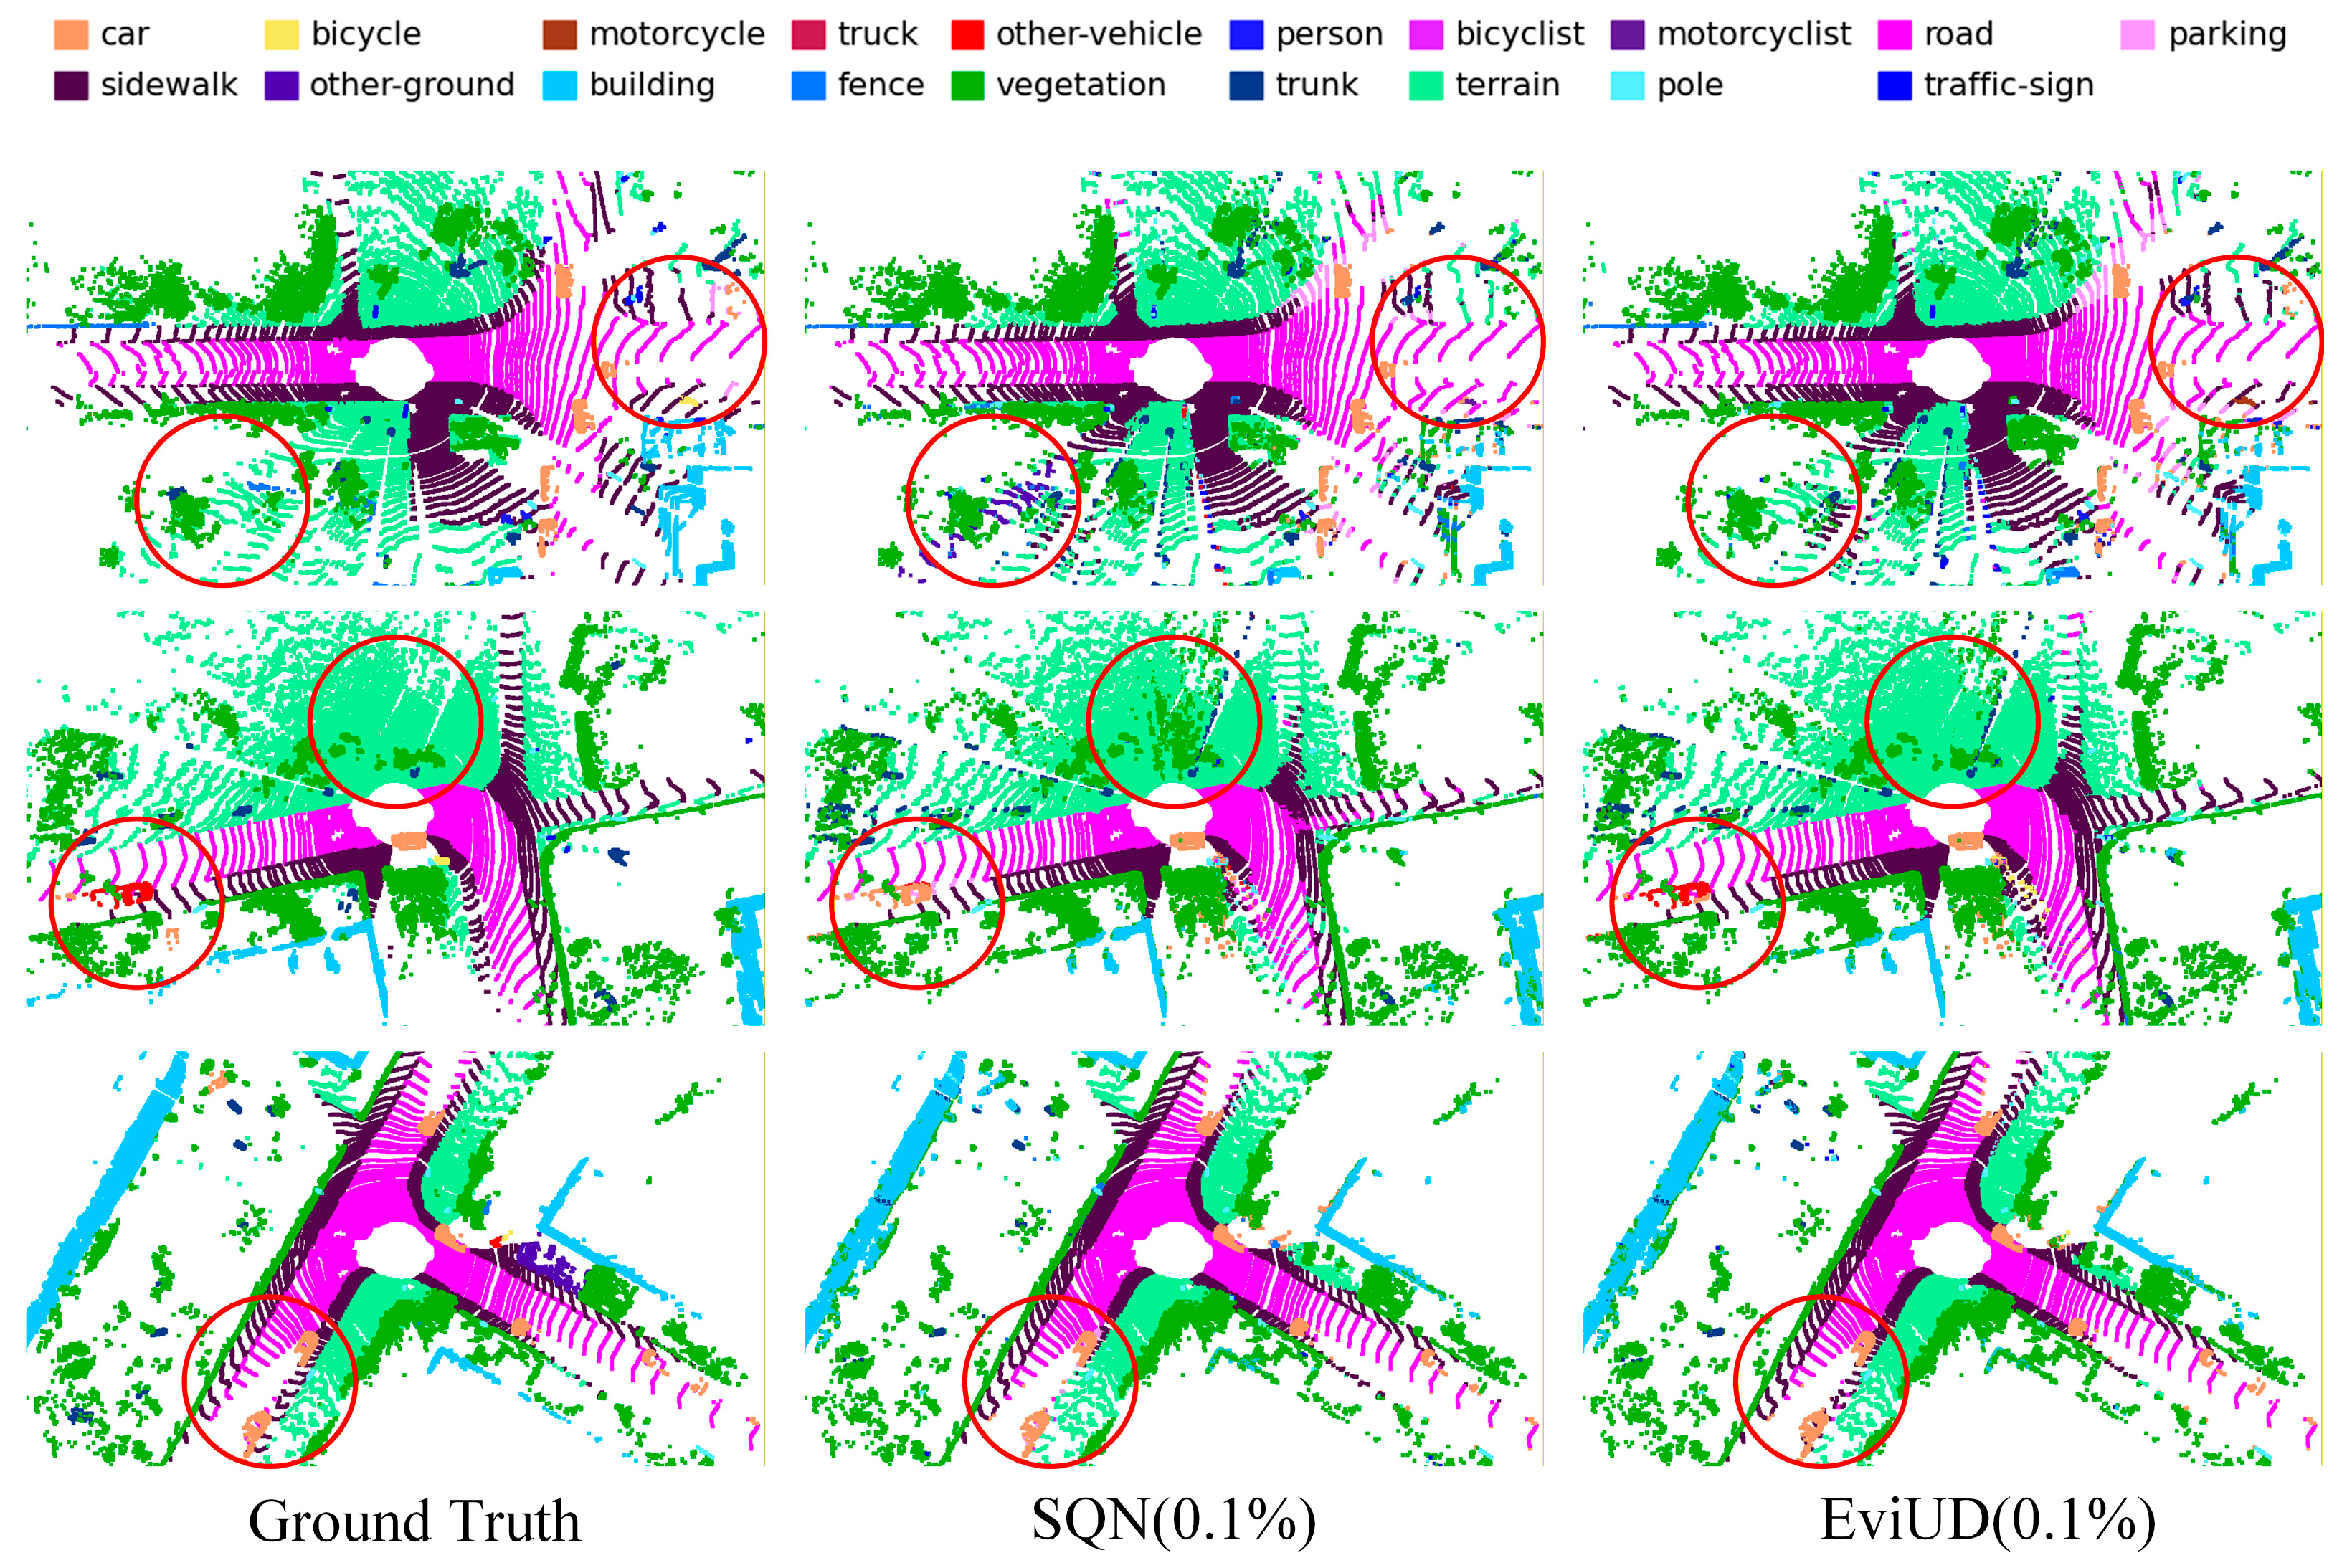
As shown in Figure 5, in SemanticKITTI outdoor LiDAR point cloud scenes, the proposed method demonstrates more stable segmentation consistency even in complex environments with large-scale road structures and sparsely distributed objects. Compared with SQN, EviUD maintains better connectivity in continuous regions of ground-related classes such as road, sidewalk, and parking, reducing fragmentation caused by point cloud sparsity and occlusion. Around dynamic traffic objects such as cars, trucks, and other vehicles, class boundaries are clearer and object contours are closer to the ground truth, with fewer background misclassifications and missed detections. In particular, in the regions highlighted by red circles in the figure, SQN misclassifies vegetation or ground points as small objects or incorrectly merges object edges into adjacent classes. In contrast, our method leverages sample reliability indications obtained from uncertainty decomposition to impose targeted constraints on boundary and ambiguous points, effectively suppressing class drift caused by outlier noise and improving geometric consistency and semantic continuity in long-range outdoor scenes.
In summary, the quantitative results and visual comparisons show that our method works well with sparse annotations. It improves segmentation quality and stays stable across different scenes and datasets. This suggests that the method reduces error accumulation from noisy pseudo labels and produces more consistent boundaries. Therefore, it is suitable for practical point cloud segmentation in complex, label-limited settings.

5. Discussion

5.1. Ablation Study

A series of ablation studies are conducted on the S3DIS dataset with a 0.1% annotation ratio. The backbone network supervised solely by sparse labeled points is used as the baseline model. Based on this baseline, we incrementally introduce each loss component to construct a set of ablation variants, enabling a quantitative analysis of the individual contributions and synergistic effects of each module on weakly supervised segmentation performance.
As shown in Table 3, under a 0.1% annotation ratio on the S3DIS dataset, the baseline model achieves an mIoU of 61.0%. By progressively introducing each module’s loss, the performance is ultimately improved to 67.7%, yielding a cumulative gain of 6.7 percentage points. Specifically, introducing only the uncertainty calibration L c e u component increases mIoU by 0.6%, while introducing only the pseudo-label supervision L r e l on the reliable set boosts performance by 2.5%. The latter improvement is attributed to stronger supervision on high-confidence samples, which enhances intra-class consistency. Combining both modules increases performance by 3.7% over the baseline, indicating that evidential uncertainty calibration can partially mitigate supervision noise under extremely low annotation rates, but its effectiveness is limited without a corresponding sample utilization strategy. This demonstrates the complementarity between uncertainty calibration and reliable sample utilization: the former provides a basis for judging sample reliability, while the latter transforms high-confidence samples into more effective training signals.
As shown in cases 3–6, further incorporating the prototype constraint L p r o increases performance to 66.1%, demonstrating that applying structural or prototype-based constraints on reliable samples effectively shapes the feature space, enhancing intra-class compactness and inter-class separability. Moreover, introducing the evidence consistency loss L e d l on the fuzzy set further improves performance to 67.7%, indicating that applying soft consistency constraints in boundary-ambiguous regions effectively suppresses the propagation of noisy pseudo-labels and stabilizes training. Overall, these results show that the module losses exhibit significant complementarity and synergy, jointly contributing to the performance gains under extremely low annotation rates.

5.2. Uncertainty Decomposition and Sensitivity Analysis of Parameters

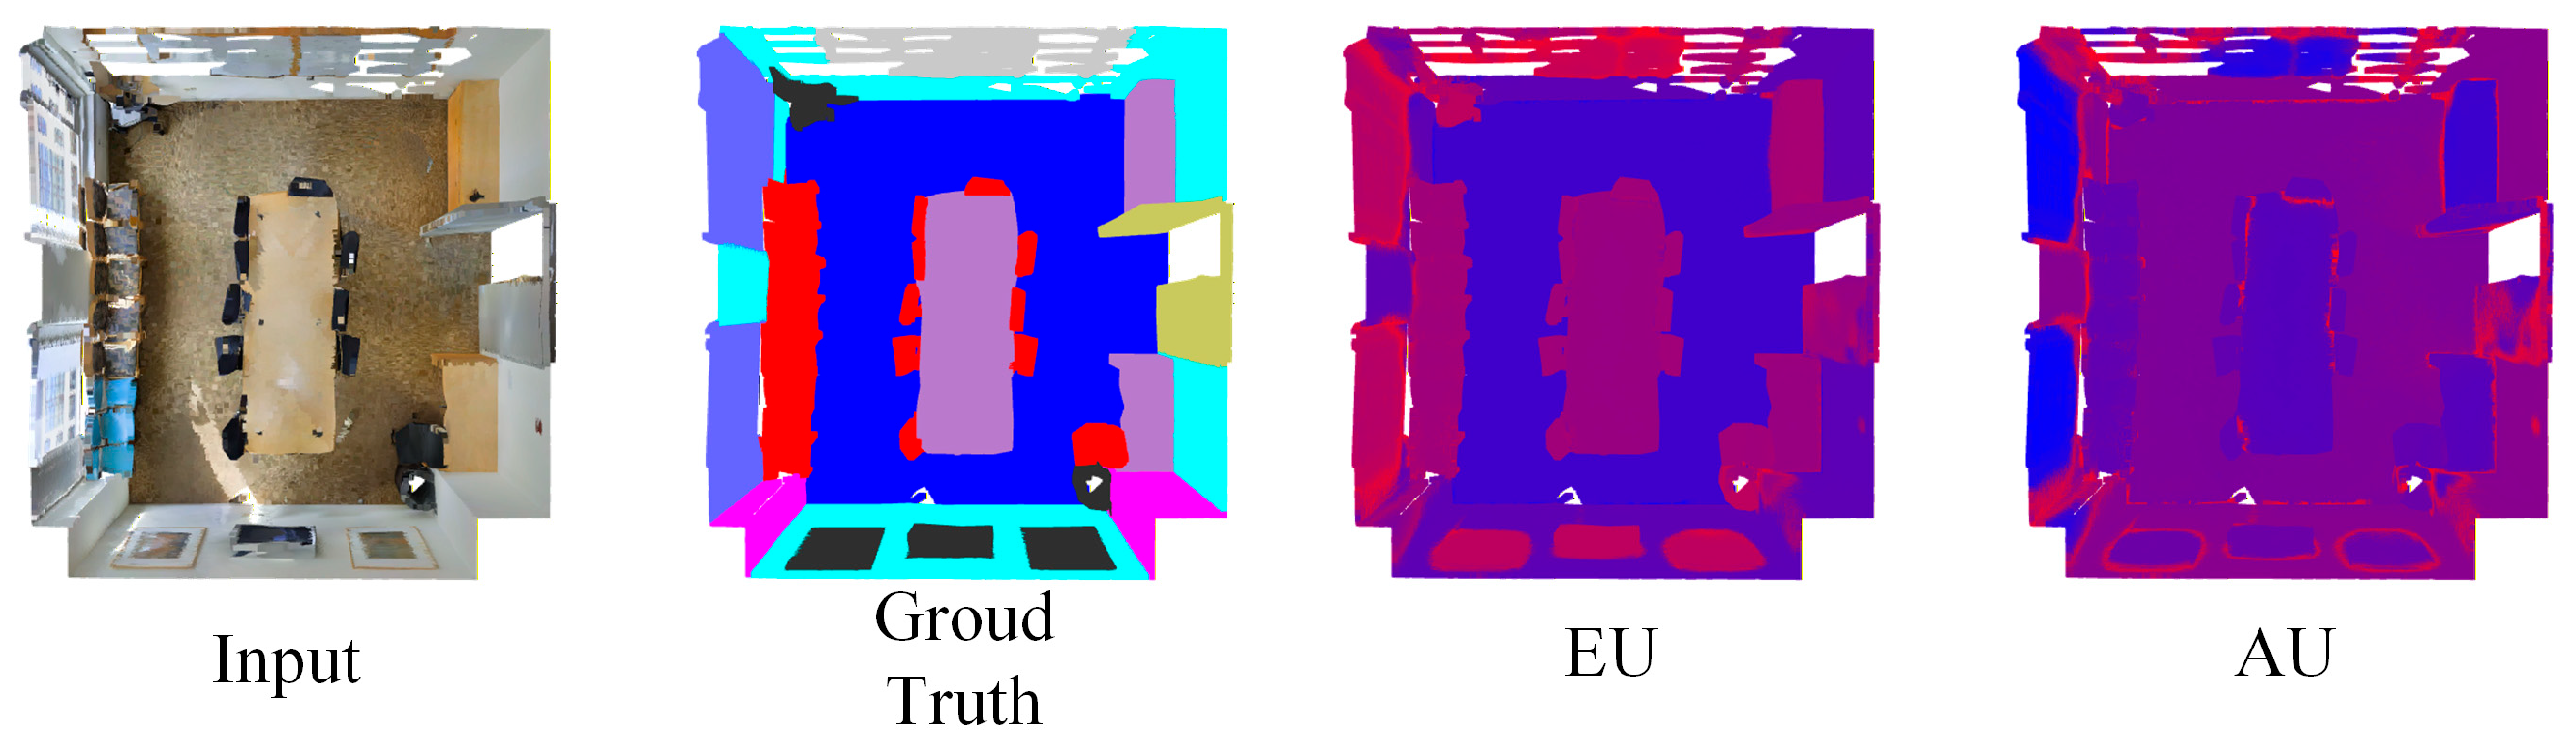
We decompose point-wise uncertainty into EU and AU, and split points according to predefined partition ratios, forming a reliable set and a fuzzy set. As shown in Figure 6, spatial visualization of EU and AU reveals distinctly different distribution patterns: EU tends to exhibit high values in regions with complex geometric structures, heavy occlusion, or missing local information, indicating insufficient overall evidence and weak support for the model’s predictions, which manifests as stronger epistemic uncertainty. In contrast, AU is more pronounced at class boundaries, often appearing as thin or band-like high-response regions, reflecting stronger inter-class competition and inherent ambiguity in these boundary neighborhoods. These observations are consistent with the theoretical definitions of EU and AU, providing empirical support for the rationality of the proposed uncertainty decomposition strategy.
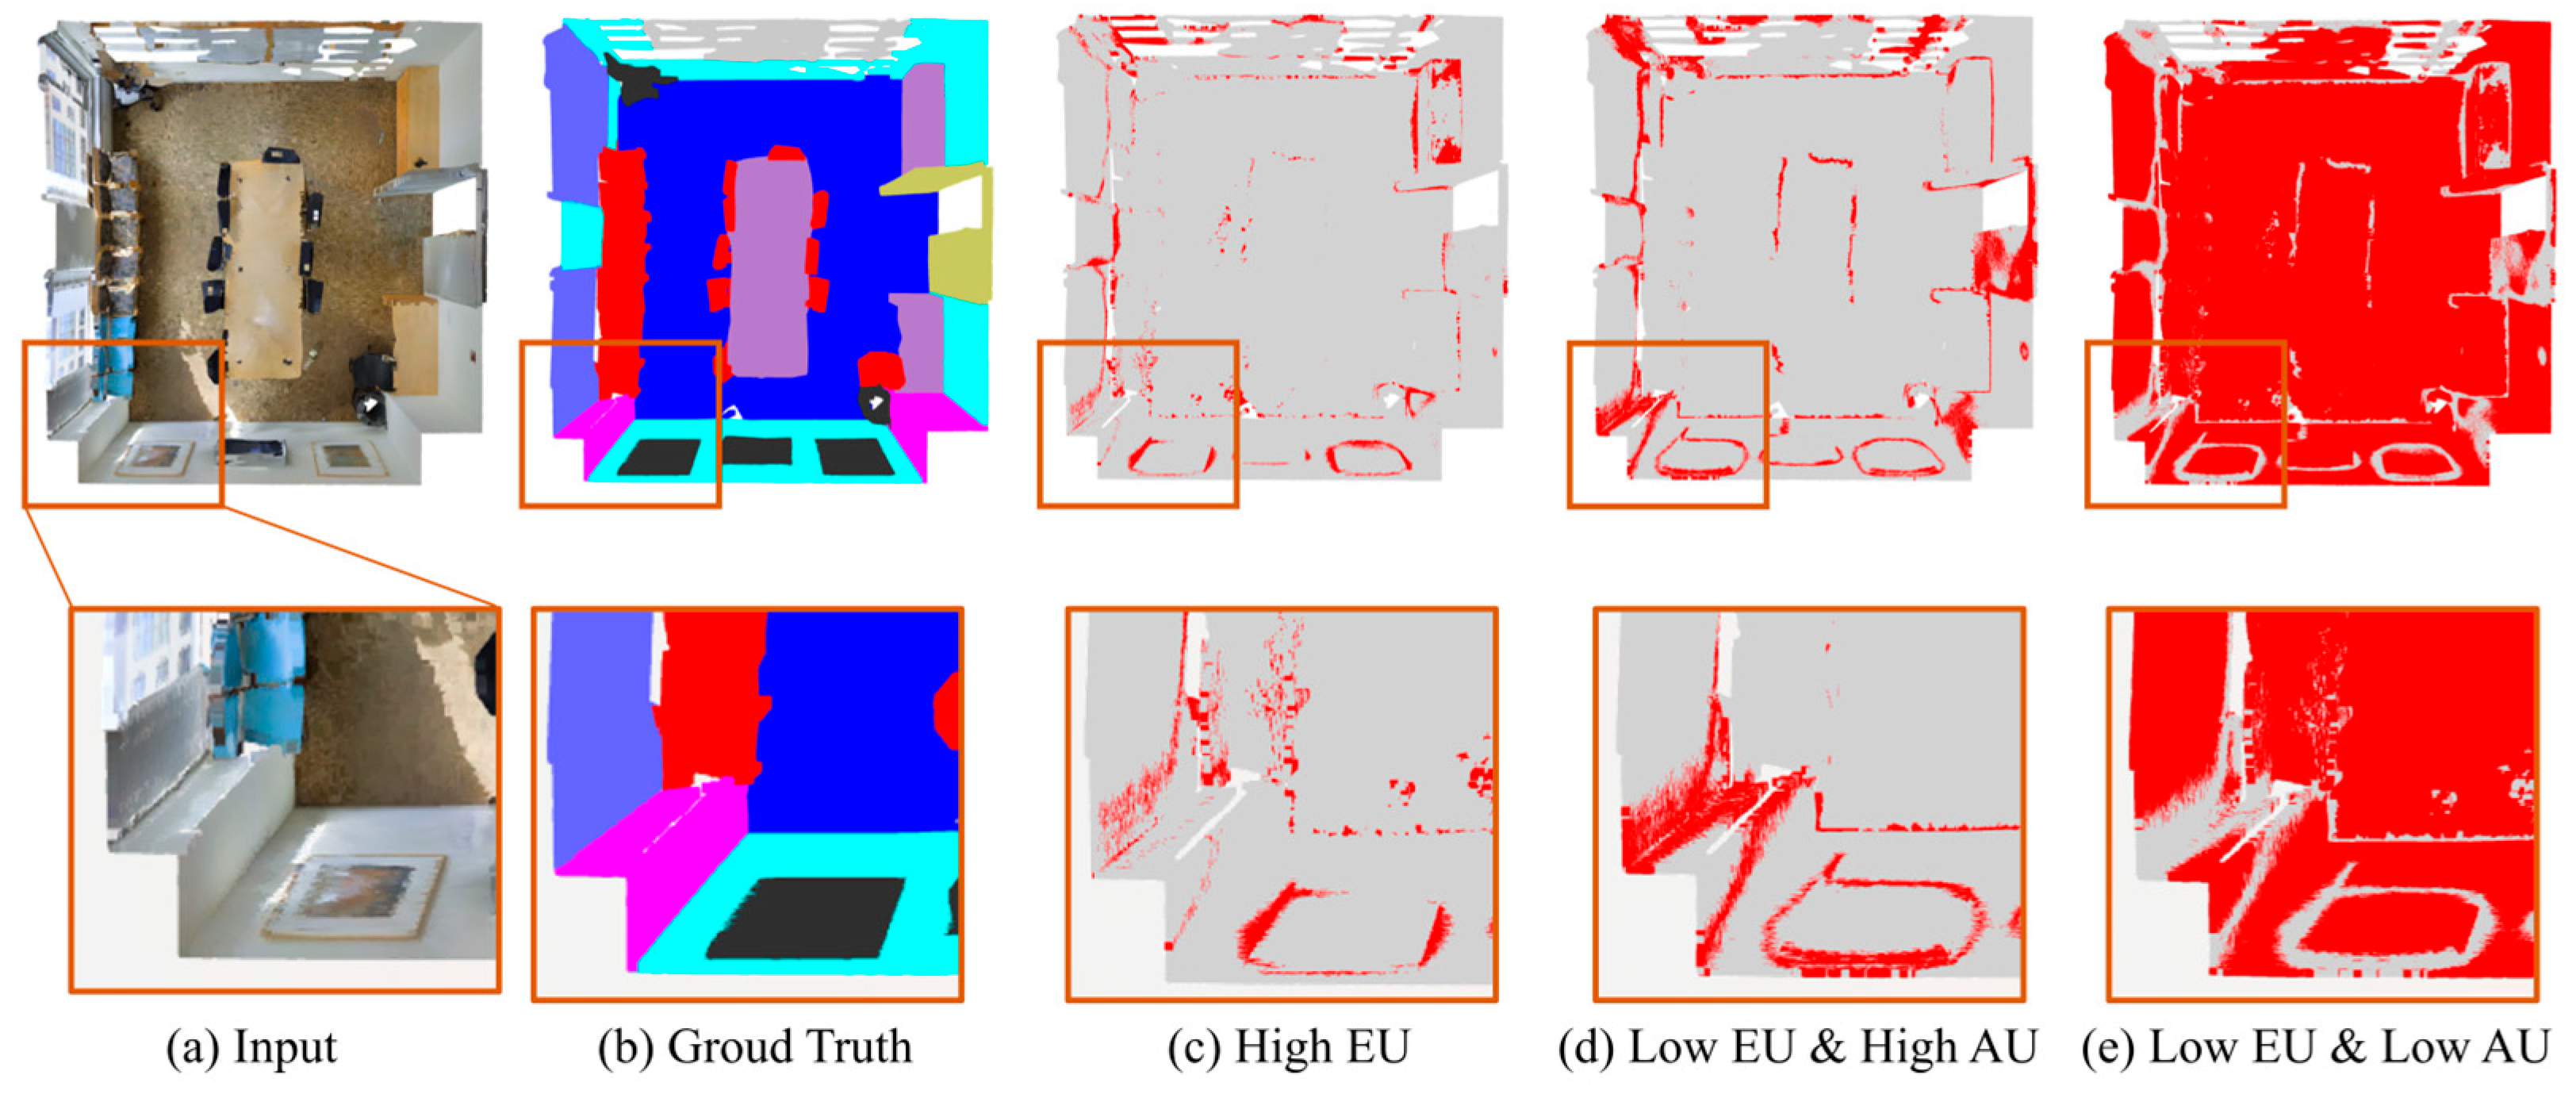
Further visualization of point cloud region distributions under different uncertainty partition conditions is shown in Figure 7. In Figure 7c, regions with high EU are mainly concentrated around semantic boundaries and structurally complex areas, where sufficient evidential support is lacking and the reliability of model predictions is relatively low. Therefore, their pseudo labels should be prevented from directly participating in training. In Figure 7d, after further screening with high AU under the low-EU condition, the resulting regions are more concentrated in category-transition and semantically ambiguous areas, such as the neighboring regions between wall and door, wall and window, as well as column and window. Although these samples exhibit strong category competition and prediction ambiguity, making them unsuitable for direct use as high-confidence pseudo labels, they still contain critical information for characterizing decision boundaries and mining potential discriminative cues. Therefore, instead of discarding them, this paper assigns them to the ambiguous set and exploits them through the corresponding constraint loss. In Figure 7e, regions with low EU and low AU are mainly distributed in semantically consistent and structurally stable interior areas. These points usually possess higher prediction reliability and lower semantic ambiguity; thus, they are assigned to the reliable set and serve as an important source of pseudo labels supervision.
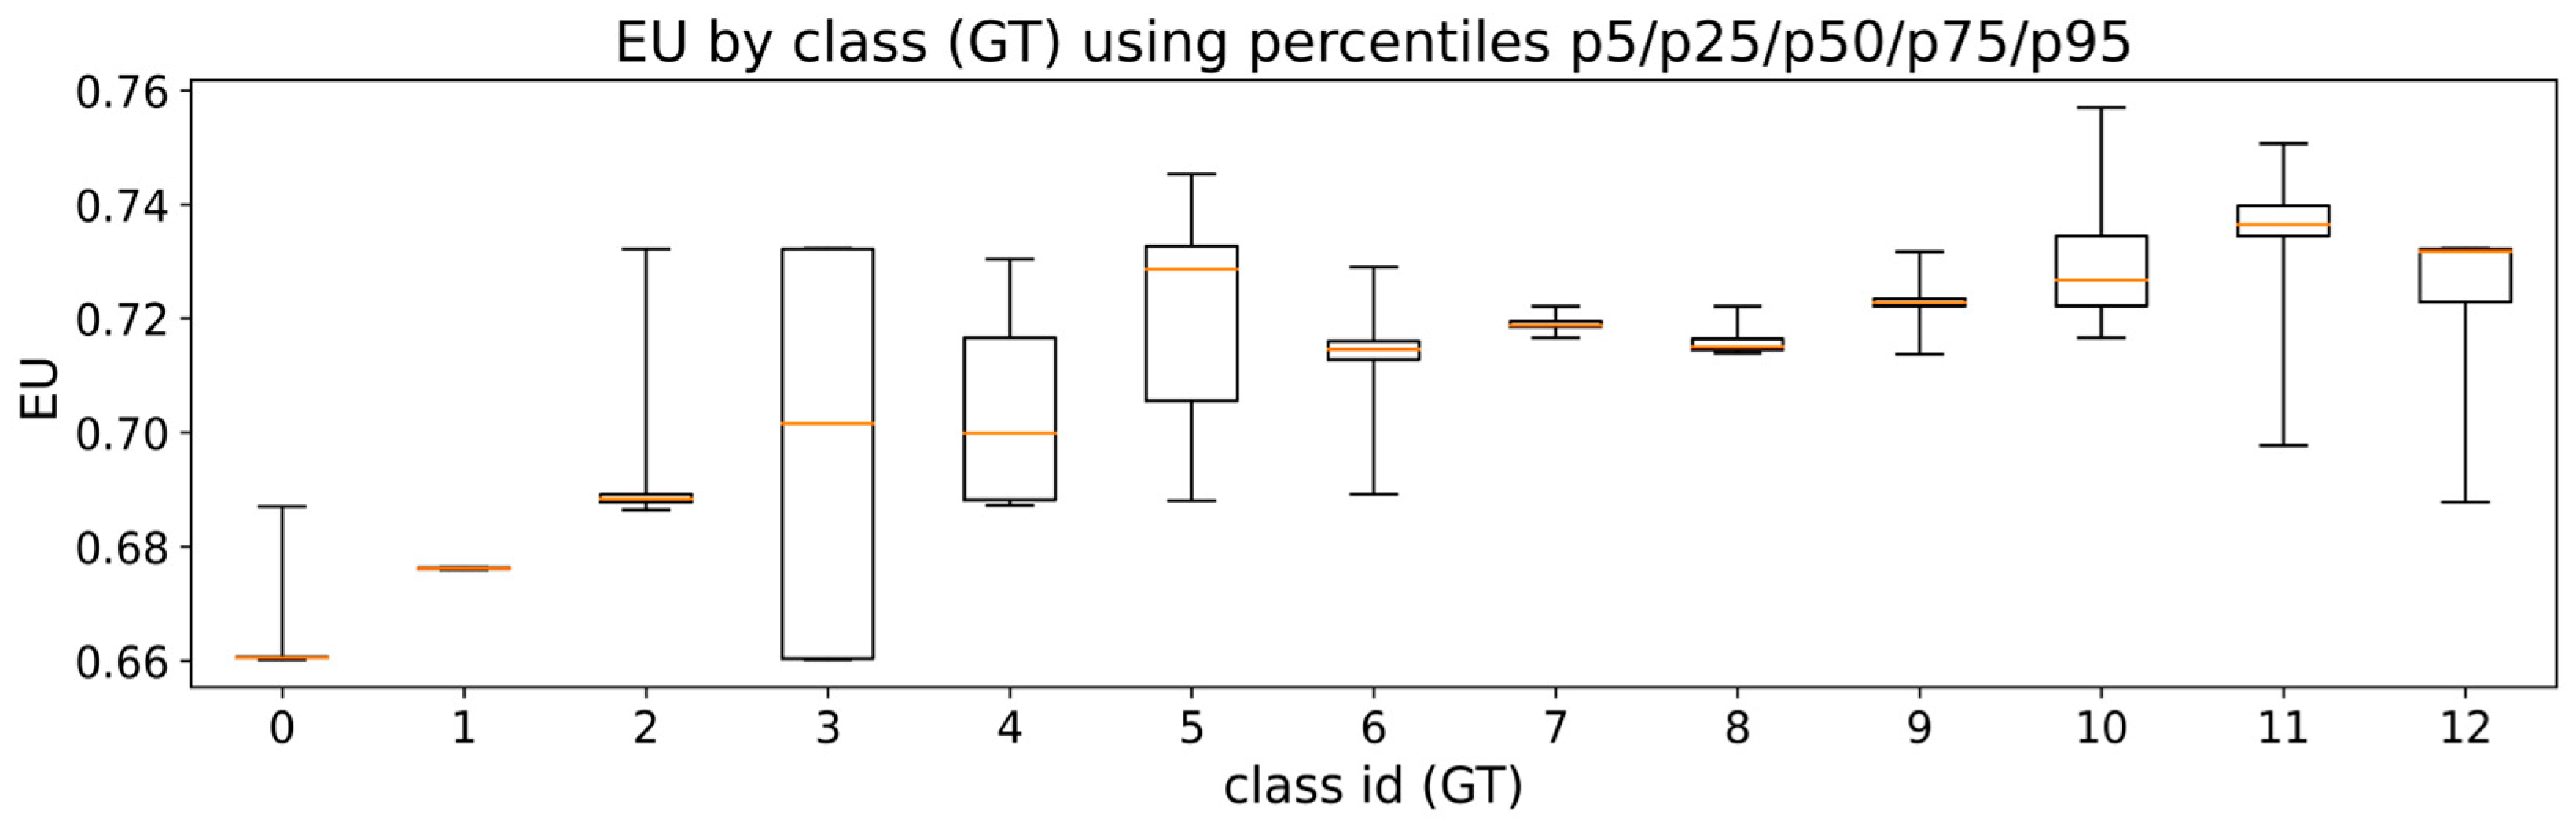
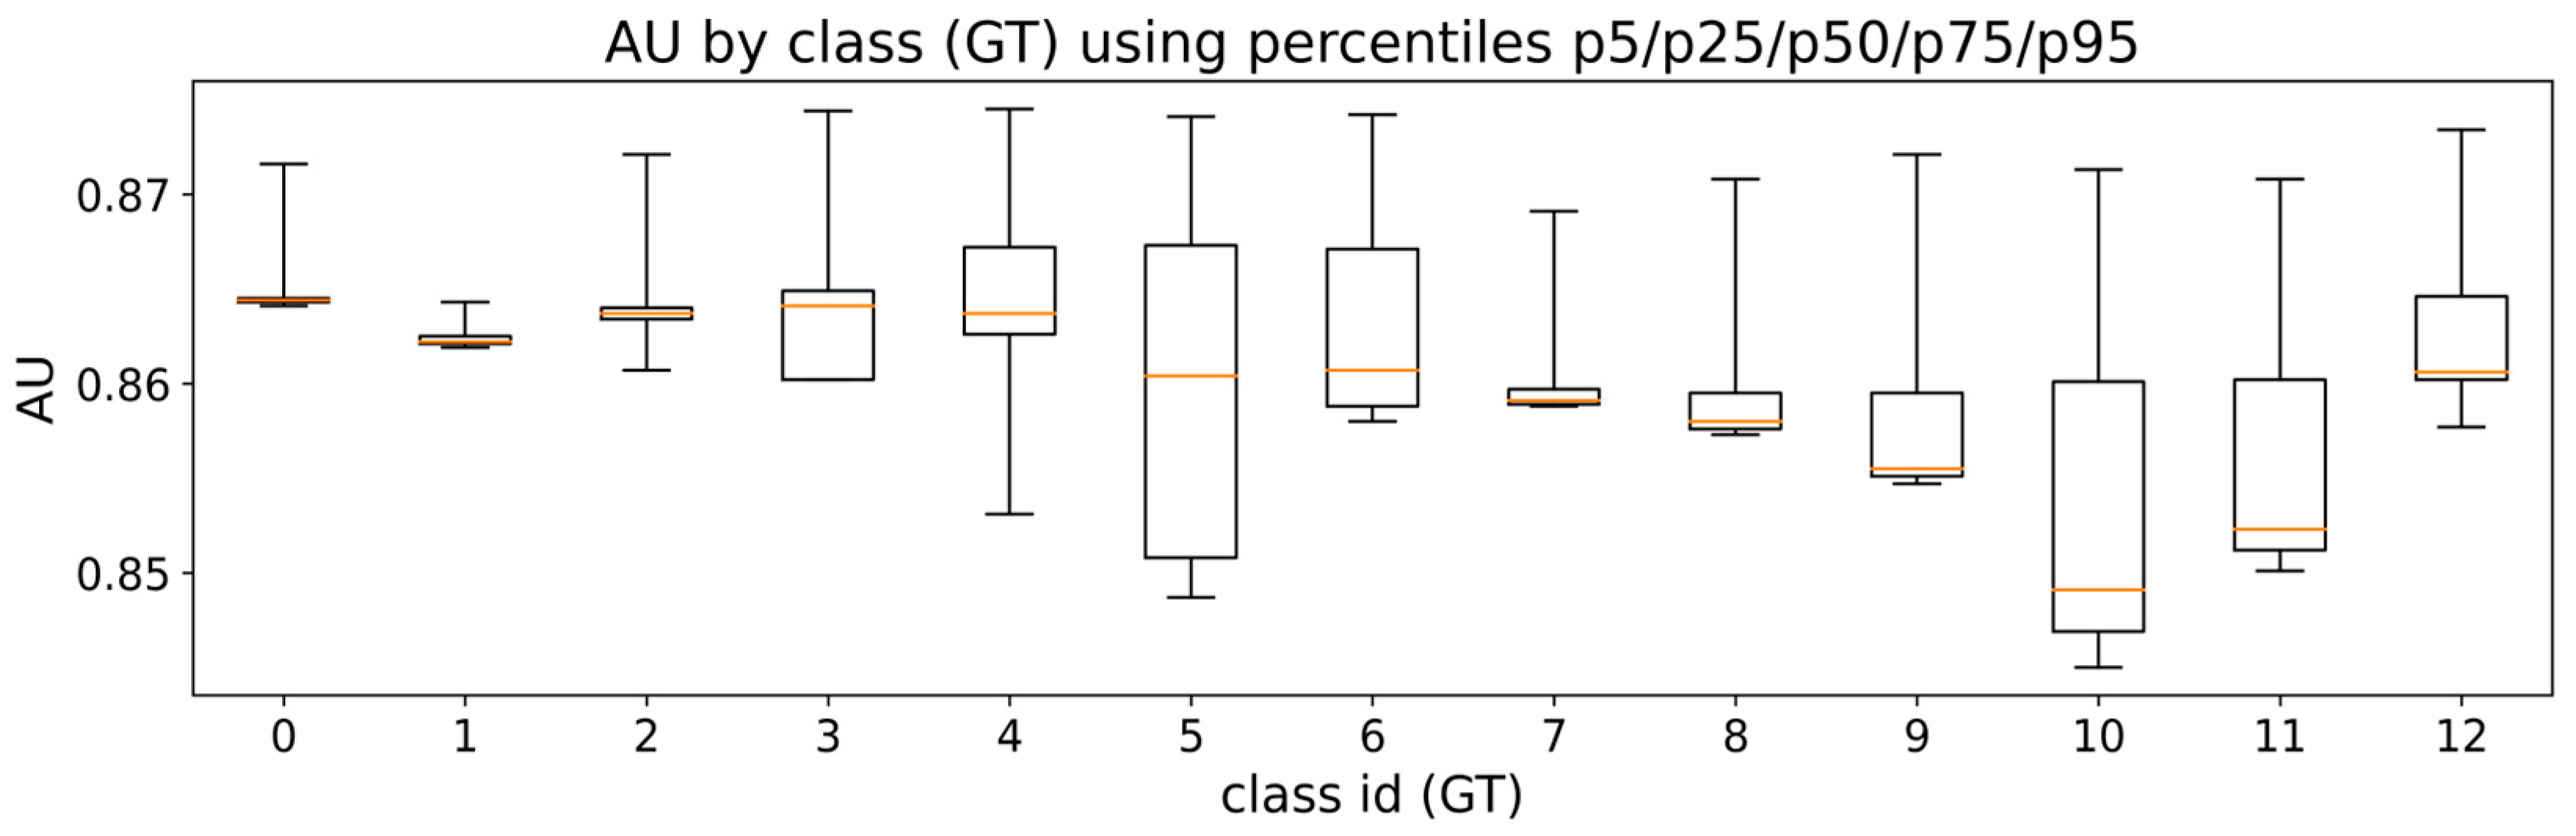
Notably, as can be further observed from the class-wise distribution statistics of EU and AU shown in Figure 8 and Figure 9, there exist clear differences among categories in both uncertainty level and fluctuation range, indicating that their inter-class distributions are not consistent. In particular, the median values and percentile intervals of EU vary more significantly across categories, while AU, although exhibiting relatively smaller overall variation, still shows distinct distribution ranges for certain classes. This suggests that directly applying a unified threshold for sample partition may introduce systematic bias toward categories with inherently higher or lower uncertainty, thereby affecting the partition of the reliable set and the ambiguous set. To address this, class-wise percentile-based thresholds are adopted, which maintain a consistent overall selection strength while mitigating biases caused by inter-class differences. Experiments with different threshold ratios for EU and AU are presented in Table 4 and Table 5, and a unified parameter setting is applied across all datasets.
Further examination of Table 4 and Table 5 shows that when the EU and AU partition ratios vary from 40% to 70%, the overall model performance remains stable, with only limited fluctuations. This indicates that the dual-threshold partition strategy does not rely on delicate parameter tuning. Its effectiveness mainly comes from the functional routing of unlabeled samples after EU and AU decomposition, rather than from any specific threshold combination. Moderate changes in the percentile ratios mainly affect a small number of samples near the boundaries, and do not substantially alter the functional roles of the reliable set, the fuzzy set, and the high-EU risk set. Therefore, the necessity of the dual-threshold strategy lies in enabling differentiated sample utilization according to uncertainty sources, rather than introducing a complex and sensitive hyperparameter design. Based on the results in Table 4 and Table 5, a unified parameter setting is finally adopted for different datasets.

5.3. Annotation Ratio

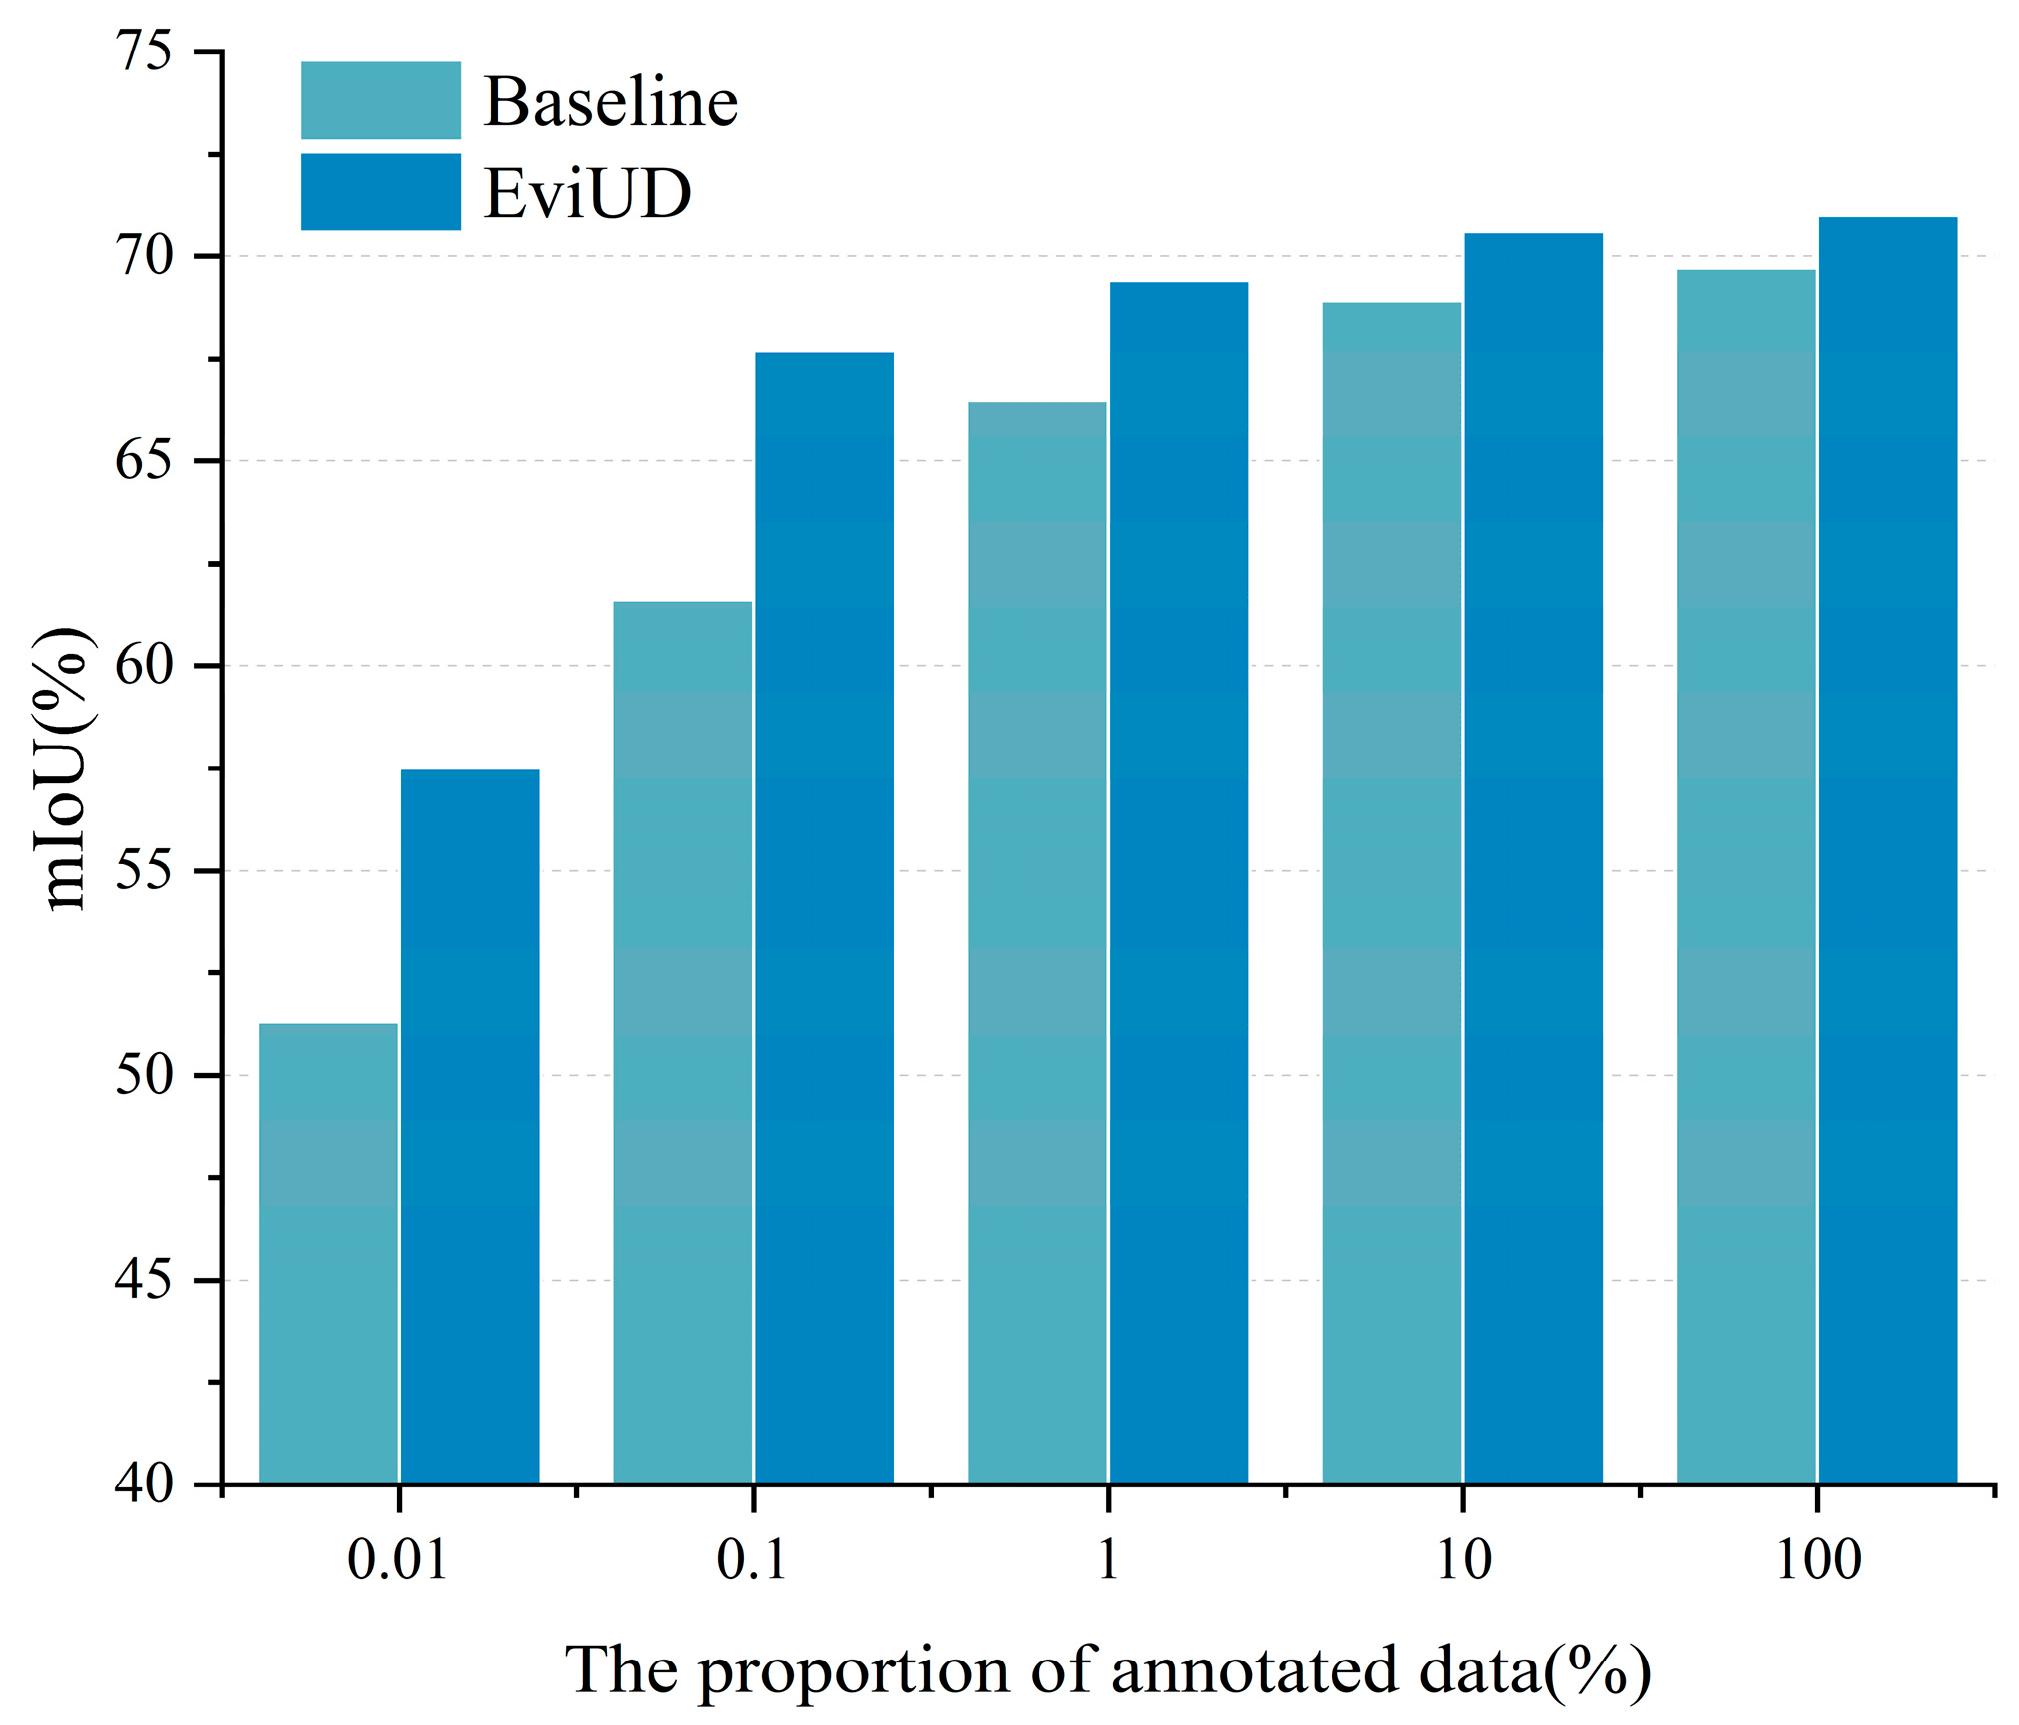
The relationship between annotation ratio and segmentation performance is shown in Figure 10. It can be observed that as the annotation ratio gradually increases from 0.01% to 100%, the mIoU of both the proposed EviUD and the baseline model steadily improves, indicating that more point-level supervision effectively enhances the model’s class discrimination capability. Compared with the baseline, EviUD achieves higher mIoU across all annotation ratios, with the advantage being particularly pronounced under extremely low annotation scenarios: when the annotation ratio is 0.01% or 0.1%, EviUD exhibits a more significant improvement. This demonstrates that under supervision-scarce conditions, the proposed evidence representation and uncertainty decomposition strategy more effectively mitigates the misleading effects of noisy pseudo-labels, allowing the model to preferentially learn stable intra-class representations from high-reliability samples.
Overall, Figure 10 suggests that EviUD is more data-efficient than the baseline, especially in the low-annotation regime. This trend supports the use of uncertainty-aware sample utilization to stabilize training when supervision is scarce, and motivates applying EviUD as a practical solution for reducing point-level labeling cost in large-scale point cloud segmentation.

5.4. Feature Visualization

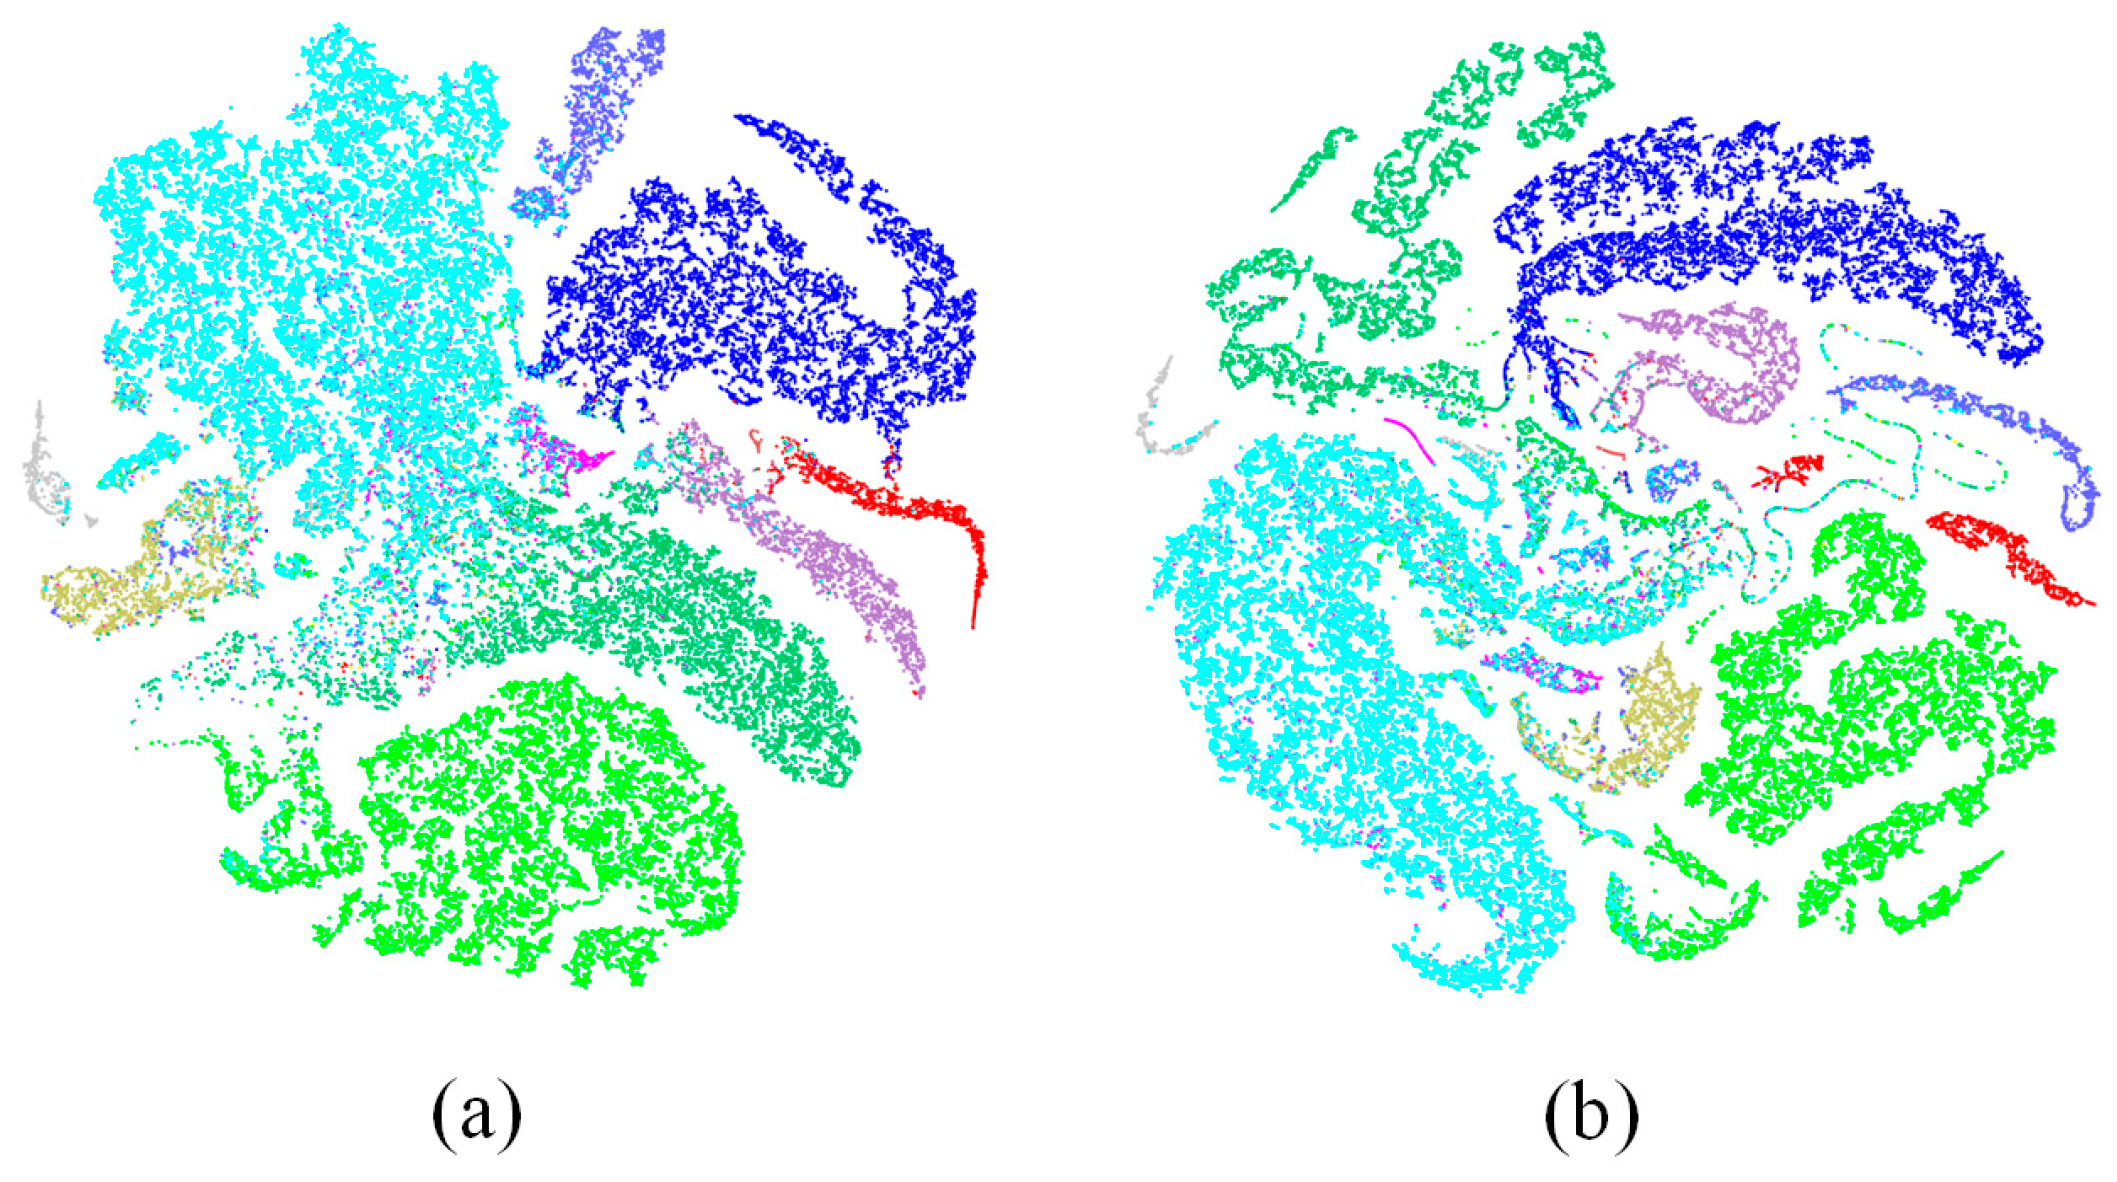
Figure 11 presents the visualization of point embeddings generated by the baseline method and EviUD on the S3DIS dataset with a 0.1% annotation ratio. It can be observed that, compared with the baseline, EviUD produces more compact and discriminative intra-class clusters in the feature space, with clearer separation boundaries between different classes. This comparison highlights the superiority of EviUD in learning more discriminative features.

5.5. Generalization Ability

To verify the applicability of the proposed method to different backbones, EviUD is further implemented on two point cloud segmentation backbones, KPConv and MinkUNet, under the same weakly supervised setting. The results are reported in Table 6. It can be seen that, under the two labeling ratios of 0.02% and 0.06%, EviUD achieves better segmentation performance on both backbones, indicating that the proposed method has good cross-backbone applicability.

5.6. Model Efficiency

The per-epoch training time, peak GPU memory, network parameters, inference speed, and floating-point operations (FLOPs) of the models are summarized in Table 7. Since EviUD adopts a mean-teacher framework during training, it requires maintaining both the teacher and student models and involves additional uncertainty modeling and training-stage computations. As a result, compared with the Baseline, the number of network parameters is doubled, and the per-epoch training time increases by 46 s, and the GPU memory rises from 2.79 GB to 5.83 GB. Compared with UCL, EviUD achieves lower training time, GPU memory usage, and FLOPs, indicating that its training overhead is relatively lighter. Meanwhile, during inference, only the student model is retained for prediction, without involving the teacher branch or extra training-stage computations, so the inference speed remains comparable to that of the Baseline. Overall, although EviUD introduces additional training overhead compared with the Baseline, its inference speed remains essentially unchanged while the segmentation performance improves by 6.7 percentage points; compared with UCL, it incurs a relatively lower training cost, demonstrating a favorable balance between performance improvement and practical efficiency.

6. Conclusions

In this work, we propose EviUD for weakly supervised point cloud segmentation. We develop an evidential uncertainty modeling scheme to assess the reliability of point predictions. By decomposing uncertainty into epistemic and aleatoric components, the framework can separate errors caused by insufficient evidence from those caused by boundary ambiguity. With this decomposition, reliable points are exploited by weighted pseudo-label learning and prototype guidance, while boundary-ambiguous points are optimized by a boundary-aware soft constraint to stabilize boundary prediction. In addition, we introduce an uncertainty calibration loss on sparse labeled points to improve uncertainty reliability. Experiments on popular benchmarks validate the effectiveness of our framework and demonstrate superior performance over existing weakly supervised methods in both indoor and outdoor scenes.

Author Contributions

Conceptualization, Qingyan Wang; methodology, Yixin Wang; validation, Junping Zhang; formal analysis, Yujing Wang and Shouqiang Kang; investigation, Qingyan Wang and Yixin Wang; resources, Yujing Wang; writing—original draft preparation, Qingyan Wang and Yixin Wang; writing—review and editing, Junping Zhang, Yujing Wang and Shouqiang Kang; visualization, Yixin Wang; supervision, Junping Zhang and Yujing Wang; project administration, Qingyan Wang and Yujing Wang; funding acquisition, Qingyan Wang. All authors have read and agreed to the published version of the manuscript.

Funding

This research was funded by the National Natural Science Foundation of China, grant number 62271171; the Heilongjiang Provincial Natural Science Foundation, grant number No. PL2025F016; and the Heilongjiang Provincial Postdoctoral Research Start-up Fund, grant number 2901051708.

Data Availability Statement

The original data presented in this study are openly available from S3DIS, ScanNet-v2 and SemanticKITTI at https://cvgl.stanford.edu/resources.html (accessed on 20 January 2026), https://kaldir.vc.in.tum.de/scannet_benchmark/ (accessed on 20 January 2026) and www.semantic-kitti.org (accessed on 20 January 2026).

Conflicts of Interest

The authors declare no conflicts of interest.

Abbreviations

The following abbreviations are used in this manuscript:
EviUDEvidentially driven uncertainty decomposition
EDLEvidential deep learning
DSTDempster–Shafer theory
EMAExponential moving average
SLSubjective logic
EUEpistemic uncertainty
AUAleatoric uncertainty

References

  1. Qi, C.R.; Su, H.; Mo, K.; Guibas, L.J. Pointnet: Deep learning on point sets for 3d classification and segmentation. In Proceedings of the IEEE Conference on Computer Vision and Pattern Recognition, Honolulu, HI, USA, 21–26 July 2017; pp. 652–660. [Google Scholar]
  2. Wang, Y.; Sun, Y.; Liu, Z.; Sarma, S.E.; Bronstein, M.M.; Solomon, J.M. Dynamic graph CNN for learning on point clouds. ACM Trans. Graph. 2019, 38, 1–12. [Google Scholar] [CrossRef]
  3. Thomas, H.; Qi, C.R.; Deschaud, J.E.; Marcotegui, B.; Goulette, F.; Guibas, L.J. KPConv: Flexible and deformable convolution for point clouds. In Proceedings of the IEEE/CVF International Conference on Computer Vision, Seoul, Republic of Korea, 27 October–2 November 2019; pp. 6411–6420. [Google Scholar]
  4. Sun, H.; Wang, Y.; Chen, W.; Deng, H.; Li, D. Parameter-efficient prompt learning for 3D point cloud understanding. In Proceedings of the IEEE International Conference on Robotics and Automation, Yokohama, Japan, 13–17 May 2024; pp. 9478–9486. [Google Scholar]
  5. Han, L.; Song, B.; Wu, S.; Nie, D.; Chen, Z.; Wang, L. Semantic segmentation of distribution network point clouds based on NF-PTV2. Electronics 2025, 14, 812. [Google Scholar] [CrossRef]
  6. Armeni, I.; Sener, O.; Zamir, A.R.; Jiang, H.; Brilakis, I.; Fischer, M.; Savarese, S. 3D semantic parsing of large-scale indoor spaces. In Proceedings of the IEEE Conference on Computer Vision and Pattern Recognition, Las Vegas, NV, USA, 27–30 June 2016; pp. 1534–1543. [Google Scholar]
  7. Dai, A.; Chang, A.X.; Savva, M.; Halber, M.; Funkhouser, T.; Nießner, M. ScanNet: Richly-annotated 3D reconstructions of indoor scenes. In Proceedings of the IEEE Conference on Computer Vision and Pattern Recognition, Honolulu, HI, USA, 21–26 July 2017; pp. 2432–2443. [Google Scholar]
  8. Behley, J.; Garbade, M.; Milioto, A.; Quenzel, J.; Behnke, S.; Stachniss, C.; Gall, J. SemanticKITTI: A dataset for semantic scene understanding of LiDAR sequences. In Proceedings of the IEEE/CVF International Conference on Computer Vision, Seoul, Republic of Korea, 27 October–2 November 2019; pp. 9297–9307. [Google Scholar]
  9. Liu, Z.; Qi, X.; Fu, C.-W. One thing one click: A self-training approach for weakly supervised 3D semantic segmentation. In Proceedings of the IEEE/CVF Conference on Computer Vision and Pattern Recognition, Nashville, TN, USA, 19–25 June 2021; pp. 1726–1736. [Google Scholar]
  10. Tao, A.; Duan, Y.; Wei, Y.; Lu, J.; Zhou, J. SegGroup: Seg-level supervision for 3D instance and semantic segmentation. IEEE Trans. Image Process. 2022, 31, 4952–4965. [Google Scholar] [CrossRef] [PubMed]
  11. Hu, Q.; Yang, B.; Fang, G.; Guo, Y.; Leonardis, A.; Trigoni, N.; Markham, A. SQN: Weakly-supervised semantic segmentation of large-scale 3D point clouds. In Proceedings of the European Conference on Computer Vision, Tel Aviv, Israel, 23–27 October 2022; pp. 600–619. [Google Scholar]
  12. Wu, J.; Sun, M.; Xu, H.; Jiang, C.; Ma, W.; Zhang, Q. Class agnostic and specific consistency learning for weakly-supervised point cloud semantic segmentation. Pattern Recognit. 2025, 158, 111067. [Google Scholar] [CrossRef]
  13. Wu, Z.; Wu, Y.; Lin, G.; Cai, J.; Qian, C. Dual adaptive transformations for weakly supervised point cloud segmentation. In Proceedings of the European Conference on Computer Vision, Tel Aviv, Israel, 23–27 October 2022; pp. 78–96. [Google Scholar]
  14. Xu, X.; Lee, G.H. Weakly supervised semantic point cloud segmentation: Towards 10× fewer labels. In Proceedings of the IEEE/CVF Conference on Computer Vision and Pattern Recognition, Seattle, WA, USA, 13–19 June 2020; pp. 13706–13715. [Google Scholar]
  15. Zhang, Y.; Qu, Y.; Xie, Y.; Li, Z.; Zheng, S.; Li, C. Perturbed self-distillation: Weakly supervised large-scale point cloud semantic segmentation. In Proceedings of the IEEE/CVF International Conference on Computer Vision, Montreal, QC, Canada, 11–17 October 2021; pp. 15520–15528. [Google Scholar]
  16. Lan, Y.; Zhang, Y.; Qu, Y.; Wang, C.; Li, C.; Cai, J.; Xie, Y.; Wu, Z. Weakly supervised 3D segmentation via receptive-driven pseudo label consistency and structural consistency. In Proceedings of the AAAI Conference on Artificial Intelligence, Washington, DC, USA, 7–14 February 2023; pp. 1222–1230. [Google Scholar]
  17. Wu, Y.; Yan, Z.; Cai, S.; Wang, J.; Zhang, Y.; Li, C.; Xie, Y. PointMatch: A consistency training framework for weakly supervised semantic segmentation of 3D point clouds. Comput. Graph. 2023, 116, 427–436. [Google Scholar] [CrossRef]
  18. Li, M.; Xie, Y.; Shen, Y.; Ke, S.; Qian, C.; Li, C. HybridCR: Weakly-supervised 3D point cloud semantic segmentation via hybrid contrastive regularization. In Proceedings of the IEEE/CVF Conference on Computer Vision and Pattern Recognition, New Orleans, LA, USA, 19–24 June 2022; pp. 14930–14939. [Google Scholar]
  19. Liu, L.; Zhuang, Z.; Huang, S.; Wang, J.; Shen, Y.; Xie, Y. CPCM: Contextual point cloud modeling for weakly-supervised point cloud semantic segmentation. In Proceedings of the IEEE/CVF International Conference on Computer Vision, Paris, France, 2–6 October 2023; pp. 18413–18422. [Google Scholar]
  20. Xie, S.; Gu, J.; Guo, D.; Qi, C.R.; Guibas, L.J.; Litany, O. PointContrast: Unsupervised pre-training for 3D point cloud understanding. In Proceedings of the European Conference on Computer Vision, Glasgow, UK, 23–28 August 2020; pp. 574–591. [Google Scholar]
  21. Pan, Z.; Zhang, N.; Gao, W.; Chen, X.; Li, Z.; Xie, Y. Less is more: Label recommendation for weakly supervised point cloud semantic segmentation. In Proceedings of the AAAI Conference on Artificial Intelligence, Vancouver, BC, Canada, 20–27 February 2024; pp. 4397–4405. [Google Scholar]
  22. Kweon, H.; Kim, J.; Yoon, K.J. Weakly supervised point cloud semantic segmentation via artificial oracle. In Proceedings of the IEEE/CVF Conference on Computer Vision and Pattern Recognition, Seattle, WA, USA, 17–21 June 2024; pp. 3721–3731. [Google Scholar]
  23. Wu, Z.; Wu, Y.; Lin, G.; Cai, J.; Qian, C. Reliability-adaptive consistency regularization for weakly-supervised point cloud segmentation. Int. J. Comput. Vis. 2024, 132, 2276–2289. [Google Scholar] [CrossRef]
  24. Niu, Y.; Yin, J. PA-Net: Trustworthy weakly supervised point cloud semantic segmentation with primary–auxiliary structure. Comput. Electr. Eng. 2024, 119, 109555. [Google Scholar] [CrossRef]
  25. Wang, P.; Yao, W.; Shao, J. One class one click: Quasi scene-level weakly supervised point cloud semantic segmentation with active learning. ISPRS J. Photogramm. Remote Sens. 2023, 204, 89–104. [Google Scholar] [CrossRef]
  26. Yao, B.; Dong, L.; Qiu, X.; Song, K.; Yan, D.; Peng, C. Uncertainty-guided contrastive learning for weakly supervised point cloud segmentation. IEEE Trans. Geosci. Remote Sens. 2024, 62, 1–13. [Google Scholar] [CrossRef]
  27. Sensoy, M.; Kaplan, L.; Kandemir, M. Evidential deep learning to quantify classification uncertainty. Adv. Neural Inf. Process. Syst. 2018, 31, 3183–3193. [Google Scholar]
  28. Li, H.; Nan, Y.; Del Ser, J.; Yang, G. Region-based evidential deep learning to quantify uncertainty and improve robustness of brain tumor segmentation. Neural Comput. Appl. 2023, 35, 22071–22085. [Google Scholar] [CrossRef] [PubMed]
  29. Shang, J.; Wu, Y.; Han, X.; Chen, X.; Zhang, Q. Evidential calibrated uncertainty-guided interactive segmentation paradigm for ultrasound images. arXiv 2025, arXiv:2501.01072. [Google Scholar] [CrossRef]
  30. Han, X.; Li, X.; Shang, J.; Wu, Y.; Zhao, Y.; Liu, Y. MambaEviScrib: Mamba and evidence-guided consistency enhance CNN robustness for scribble-based weakly supervised ultrasound image segmentation. Inf. Fusion 2026, 126, 103590. [Google Scholar] [CrossRef]
  31. Lin, H.; Zheng, X.; Li, L.; Chao, F.; Wang, S.; Wang, Y.; Tian, Y.; Ji, R. Meta architecture for point cloud analysis. In Proceedings of the IEEE/CVF Conference on Computer Vision and Pattern Recognition, Vancouver, BC, Canada, 18–22 June 2023; pp. 17682–17691. [Google Scholar]
  32. Tarvainen, A.; Valpola, H. Mean teachers are better role models: Weight-averaged consistency targets improve semi-supervised deep learning results. Adv. Neural Inf. Process. Syst. 2017, 30, 1195–1204. [Google Scholar]
  33. Hu, Q.; Yang, B.; Xie, L.; Rosa, S.; Guo, Y.; Wang, Z.; Trigoni, N.; Markham, A. RandLA-Net: Efficient semantic segmentation of large-scale point clouds. In Proceedings of the IEEE/CVF Conference on Computer Vision and Pattern Recognition, Seattle, WA, USA, 13–19 June 2020; pp. 11108–11117. [Google Scholar]
  34. Zhang, L.; Bi, Y. Weakly-supervised point cloud semantic segmentation based on dilated region. IEEE Trans. Geosci. Remote Sens. 2024, 62, 1–20. [Google Scholar] [CrossRef]
  35. Zhan, L.; Li, W.; Jiang, J.; Zhou, T.; Wen, C.; Wang, C. QPCR: Weakly-supervised semantic segmentation of large-scale point cloud via gradual query points component reasoning. IEEE Trans. Geosci. Remote Sens. 2025, 63, 5700211. [Google Scholar] [CrossRef]
  36. Zhang, Y.; Lan, Y.; Xie, Y.; Li, C.; Qu, Y. Cross-cloud consistency for weakly supervised point cloud semantic segmentation. IEEE Trans. Neural Netw. Learn. Syst. 2025, 36, 14452–14463. [Google Scholar] [CrossRef] [PubMed]
  37. Choy, C.; Gwak, J.; Savarese, S. 4D spatio-temporal ConvNets: Minkowski convolutional neural networks. In Proceedings of the IEEE/CVF Conference on Computer Vision and Pattern Recognition, Long Beach, CA, USA, 15–20 June 2019; pp. 3075–3084. [Google Scholar]
Figure 1. Overall framework of EviUD. The input point cloud is fed into the student and teacher networks under strong and weak perturbations, respectively. The teacher branch produces evidential outputs and performs uncertainty decomposition, and unlabeled points are partitioned into a reliable set and a fuzzy set according to two thresholds. Reliable points are trained with pseudo-label supervision and prototype regularization, while fuzzy points are constrained by evidential consistency to stabilize boundary learning and suppress noise.
Ijgi 15 00167 g001
Figure 2. EU-AU quadrants with dual thresholds. Using ( τ E U , τ A U ) as the origin, the lower-left region (low EU, low AU) corresponds to reliable samples for pseudo-label supervision. The upper-left region (low EU, high AU) contains fuzzy boundary samples handled with soft constraints. The right-side region (high EU) indicates points excluded from pseudo-label-based supervision.
Ijgi 15 00167 g002
Figure 3. Qualitative visualization results on the S3DIS Area-5. From left to right: input point cloud, ground truth, SQN (0.1%), UCL (0.1%) and EviUD (0.1%). Boxed regions highlight representative areas where EviUD produces more accurate than the competing weakly supervised methods.
Ijgi 15 00167 g003
Figure 4. Qualitative visualization results on the ScanNet-V2 test sets. From left to right: input point cloud, ground truth, SQN (0.1%), UCL (0.1%) and EviUD (0.1%). Boxed regions highlight representative areas where EviUD produces more accurate than the competing weakly supervised methods.
Ijgi 15 00167 g004
Figure 5. Qualitative visualization results on the SemanticKITTI validation set. From left to right: ground truth, SQN (0.1%), and EviUD (0.1%). Regions marked by red circles indicate areas where EviUD produces more accurate predictions than SQN.
Ijgi 15 00167 g005
Figure 6. Prediction uncertainty of the baseline model on the S3DIS dataset with a 0.1% annotation ratio. The closer to red, the higher the uncertainty, and the closer to blue, the lower the uncertainty.
Ijgi 15 00167 g006
Figure 7. Visualization of point-wise uncertainty on the S3DIS dataset under the 0.1% annotation ratio. The figure presents the input scene, the ground-truth labels, and the point cloud distributions under different EU and AU conditions, where red points denote the regions satisfying the corresponding criteria, gray points indicate the remaining regions, and the brown rectangles mark locally enlarged areas.
Ijgi 15 00167 g007
Figure 8. Class-wise distribution of EU on the S3DIS dataset under the 0.1% annotation ratio. The figure shows the percentile-based box plots of EU for each semantic class, where the boxes and whiskers correspond to the p25–p75 and p5–p95 intervals, respectively, and the central line denotes the median value.
Ijgi 15 00167 g008
Figure 9. Class-wise distribution of AU on the S3DIS dataset under the 0.1% annotation ratio. The figure shows the percentile-based box plots of AU for each semantic class, where the boxes and whiskers correspond to the p25–p75 and p5–p95 intervals, respectively, and the central line denotes the median value.
Ijgi 15 00167 g009
Figure 10. Comparison between EviUD and the baseline model on the S3DIS dataset under annotation ratios ranging from 0.01% to 100%.
Ijgi 15 00167 g010
Figure 11. Comparison of point embeddings generated by the baseline model and EviUD on the S3DIS dataset with a 0.1% annotation ratio. Different colors represent different categories. (a) Point embeddings generated by the baseline model; (b) Point embeddings generated by EviUD.
Ijgi 15 00167 g011
Table 1. Comparison of results on the S3DIS dataset under different annotation ratios.
MethodsRate (%)mIoU (%)Ceil.FloorWallBeamCol.Wind.DoorChairTableBook.SofaboardClut.
RandLA-Net [33]10063.092.496.880.80.018.657.254.187.979.874.570.266.259.3
KPConv [3]10067.192.897.382.40.023.958.069.091.081.575.375.466.758.9
HybridCR [18]10065.893.698.182.30.024.459.566.987.979.673.067.166.855.7
DR-Net [34]0.158.792.196.678.00.015.652.358.469.277.152.865.257.848.5
SQN [11]0.161.491.795.678.70.024.255.963.183.170.567.860.756.150.6
UCL [26]0.165.493.397.282.00.026.560.362.179.285.668.473.765.755.6
EviUD(Ours)0.167.793.696.884.50.026.063.264.687.985.374.576.669.157.5
SQN [11]163.692.096.481.30.021.453.773.277.886.056.770.066.652.5
QPCR [35]165.493.597.882.40.026.758.569.178.486.262.673.264.857.4
UCL [26]168.293.497.382.60.025.759.966.381.989.775.975.478.560.0
EviUD(Ours)169.493.897.582.20.027.062.372.182.489.577.676.679.262.1
All bold values indicate the best performance.
Table 2. Comparison of results on the ScanNet-V2 and SemanticKITTI datasets under different annotation ratios.
MethodsRate (%)mIoU(%)
ScanNet-V2SemanticKITTI
RandLA-Net [33]10064.553.9
KPConv [3]10068.458.8
HybridCR [18]10059.954.0
SQN [11]0.156.950.8
RPSC [16]0.157.550.9
UCL [26]0.158.9-
C3 [36]0.158.151.6
EviUD(Ours)0.159.753.3
SQN [11]1-52.2
HybridCR [18]156.852.3
UCL [26]162.3-
EviUD(Ours)163.856.1
All bold values indicate the best performance.
Table 3. Ablation study of the proposed modules on the S3DIS.
Model L c e u L r e l L p r o L e d l 0.1%
Baseline 61.0
1 61.6
2 63.5
3 64.7
4 64.2
5 63.9
6 66.1
767.7
Table 4. Analysis of EU partitioning ratios under a 0.1% annotation ratio.
DatasetsProportion (%)
40%50%60%70%
S3DIS67.2267.6867.0366.65
ScanNet-V258.9359.7159.5459.25
SemanticKITTI52.9653.3453.1053.24
Table 5. Analysis of AU partitioning ratios under a 0.1% annotation ratio.
DatasetsProportion (%)
40%50%60%70%
S3DIS67.1367.4567.6867.55
ScanNet-V259.6159.7559.7159.56
SemanticKITTI52.7653.2953.3453.16
Table 6. Comparison of mIoU (%) of different backbone networks on the S3DIS dataset at 0.02% and 0.06% annotation ratios.
BackbonesMethodsSupervision
0.02%0.06%
KPConv [3]Baseline50.154.3
DAT [13]56.558.5
RAC-Net [23]58.460.5
UCL [26]59.260.9
EviUD(Ours)60.661.7
MinkUNet [37]Baseline48.755.0
DAT [13]54.658.2
RAC-Net [23]58.659.9
UCL [26]59.862.7
EviUD(Ours)61.364.2
Table 7. Comparison of model complexity and efficiency.
MethodsTraining Time 1
(s)
GPU
Memory 2
(GB)
Network
Parameters
(M)
Inference Speed
(ms)
FLOPs 3
(G)
Baseline1072.79 G2.71048.63
UCL [26]1537.42 G5.410425.89
EviUD(Ours)1385.83 G5.410417.26
1 The reported training time corresponds to the time consumed in one training epoch. 2 The reported GPU memory corresponds to the peak memory allocated during one training epoch. 3 The reported FLOPs correspond to the computational cost of the complete training framework.
Disclaimer/Publisher’s Note: The statements, opinions and data contained in all publications are solely those of the individual author(s) and contributor(s) and not of MDPI and/or the editor(s). MDPI and/or the editor(s) disclaim responsibility for any injury to people or property resulting from any ideas, methods, instructions or products referred to in the content.