Article

Assessing Supply Equity of Community Sports and Fitness Facilities: A Case Study of Shijingshan District, Beijing

1
School of Architecture and Art, North China University of Technology, Beijing 100144, China
2
Beijing Hyrea Solidale Technology Co., Ltd., Beijing 100071, China
*
Author to whom correspondence should be addressed.
ISPRS Int. J. Geo-Inf. 2026, 15(3), 94; https://doi.org/10.3390/ijgi15030094
Submission received: 20 October 2025 / Revised: 3 February 2026 / Accepted: 21 February 2026 / Published: 25 February 2026

Abstract

Developing a more equitable, efficient, and sustainable system of community sports and fitness facilities, while improving the accessibility and popularity of national fitness activities, is crucial to advancing the Healthy China Initiative. However, existing studies have limitations: insufficiently granular classification of community-level facilities, failure to account for how differences in facility types affect service equity, absence of integrated validation that combines objective quantification and subjective perception, and inattention to group differences. These gaps provide the motivation for this study. This study uses Shijingshan District, Beijing, as a case study, categorizing community sports and fitness facilities into two categories: for-profit commercial facilities and non-profit community sports parks. Employing GIS technology, Z-score standardization, and questionnaire surveys, an evaluation was conducted from three aspects: accessibility, supply–demand dynamics, and group perception. The results show that: (1) Facility accessibility exhibits significant spatial heterogeneity. Commercial facilities are densely clustered in core subdistricts, whereas community sports parks exhibit higher accessibility in the southern and eastern areas than in the northern and western areas, with inadequate coverage in peripheral areas; (2) most facilities are in short supply shortage, and the supply–demand imbalance is particularly pronounced in peripheral areas; and (3) regarding group equity, gender equity is outperforms age equity, and the supply–demand structure aligns closely with gender-specific preferences. This study argues that the spatial mismatch between facility distribution and resident demand, as well as imbalances in the supply of facility types, are the key factors undermining equity. It proposes optimization strategies, including augmenting facility supply in peripheral areas and coordinating the provision of commercial facilities and community sports parks.

1. Introduction

As a vital component of the urban service system that is readily accessible to residents, community sports and fitness facilities serve as a key vehicle for safeguarding residents’ rights to national fitness and enhancing their health and well-being. Their equitable distribution not only facilitates sound urban planning but also directly reflects progress toward social equity and justice. Studies have demonstrated that regular physical activity can significantly lower the risk of chronic diseases, alleviate mental stress, and improve individuals’ well-being and physical and mental health [1]. The World Health Organization (WHO) emphasized in its Global Action Plan on Physical Activity (2018–2030) that improving physical activity levels from a human rights and equity perspective is an important approach to protecting public health [2]. Furthermore, the Healthy China 2030 and the Regulations on National Fitness of the People’s Republic of China emphasize that expanding and improving community sports and fitness facilities is essential to promoting widespread participation in national fitness activities, providing policy guidance for the construction of facility equity.
However, the equitable supply of community sports and fitness facilities in China still faces practical challenges. In some regions, facilities are unevenly distributed, with resources concentrated in core areas and insufficient services in peripheral areas [3,4]. Furthermore, analyses of service levels for diverse types of community-level facilities, as well as examinations of spatial heterogeneity in accessibility and supply–demand characteristics, remain inadequate.
Domestic and international research on sports and fitness facilities has evolved into multi-dimensional explorations, with research perspectives gradually shifting from macro-level standard formulation to meso-level planning implementation and meso-level equity evaluation. However, considerable room remains for improving the precision of analyses at the community level.
Research on equity primarily revolves around the spatial disparities in resource allocation and the balance of services, with mainstream methodologies including the Gini coefficient, Lorenz curve, location quotient, and spatial autocorrelation analysis [5,6]. Researchers have generally confirmed that sports facilities exhibit significant characteristics of regional imbalance—whether in the community open spaces of economically developed regions such as the Yangtze River Delta, or in the layout of national fitness facilities across the country—a “core-high, periphery-low” agglomeration pattern has been reported [7,8], followed by a decreasing core–periphery gradient, a feature that is reflected in both urban and rural areas [9,10,11,12]. Existing studies indicate that human, financial, and material resources are the core factors influencing facility equity [10]. Nevertheless, most research focuses on meso–macro scales such as the municipal and district levels, with insufficient attention paid to community-level facilities. In particular, the absence of detailed classified analysis on commercial and public welfare facilities makes it difficult to accurately identify disparities in service coverage across facilities with distinct attributes, thereby leading to poorly targeted optimization strategies.
Accessibility research focuses on the convenience of residents’ access to facilities, with the two-step floating catchment area (2SFCA) method and GIS-based spatial analysis as the dominant approaches [6,9,13,14]. Studies have widely documented that sports facilities are sparsely distributed in urban peripheral areas, marked by inadequate provision of public sports facilities [13,15]. Additionally, there are significant differences in accessibility among facilities of different levels, and the accessibility of community-level facilities often presents a dispersed distribution characteristic [9]. Some studies have noted the positive correlation between facility accessibility and spatial vitality [6]. However, most studies treat community-level facilities as a single entity, failing to distinguish between commercial and public welfare facilities in terms of service radius and usage thresholds. This makes it impossible to accurately reveal the differentiated impacts of different types of facilities on residents’ perceived accessibility and also hinders the provision of targeted layout optimization strategies.
Research on supply–demand characteristics focuses on the adaptability between facility supply and residents’ demand. Existing studies have constructed a multi-dimensional analytical framework, confirming that supply–demand mismatch is a prevalent phenomenon that is particularly reflected in the differences among age groups [8,16]. Moreover, the level of supply–demand matching is significantly influenced by factors such as population distribution and accessibility [17,18,19]. Some studies have also explored the mediating role of facility supply in residents’ sports participation [20], as well as the correlation between public satisfaction and facility accessibility and activity diversity [21]. Despite these advances, existing research still has obvious limitations. On the one hand, most studies rely on objective data to quantify the supply–demand relationship [17,19,22,23], lacking investigations into residents’ subjective perceptions, such as usage intention, satisfaction, and payment preferences. The integration of “objective indicators + subjective evaluation” for dual verification is inadequate. On the other hand, although some studies have examined the demand differences among groups such as adolescents and the elderly [23,24], they have not further analyzed the adaptability between group demands and facility supply by combining facility types, indicating that equity evaluation from the perspective of group differences needs to be further improved.
In summary, existing research has established a research framework for sports facilities from three dimensions: equity, accessibility, and supply–demand matching. However, there are still the following gaps in the precise, classified, and multi-dimensional evaluation of community-level facilities:
(1) In the analysis of equity and accessibility, existing studies mostly focus on public welfare facilities (e.g., fitness trails, community parks), with insufficient attention paid to commercial facilities [9,11,12]. Furthermore, community-level sports facilities are generally regarded as a whole in accessibility and supply–demand assessment [11,14], ignoring the significant differences in service attributes and usage characteristics between commercial and public welfare facilities. Inadequate layout of public welfare facilities restricts the satisfaction of residents’ inclusive sports needs; while commercial facilities may enhance service diversity, their payment thresholds tend to exclude low-income groups. Meanwhile, different types of facilities also exhibit differentiation in target population groups and usage frequency. For example, commercial gyms mainly attract young people, whereas community sports parks serve residents of all age groups. The lack of such classification awareness not only masks the specific supply–demand mismatch shortcomings of various facilities but also renders optimization strategies less targeted and operable.
(2) The evaluation perspective and methodology are not comprehensive enough. Most existing studies rely on objective data such as facility quantity, spatial distance, and population size for quantitative analysis [17,19,22], lacking the integration of residents’ subjective perceptions, which makes it difficult to fully reflect the actual experience of facility equity. Meanwhile, group difference analysis only focuses on macro dimensions such as age and urban–rural areas [23,24], without further exploring the adaptive demands of different groups in combination with facility types. This leads to imprecise equity evaluation and fails to provide robust support for the “age-inclusive” facility layout.
To address the aforementioned research gaps, this study focuses on two core issues: (1) What is the current status of spatial accessibility and supply–demand matching equity of community-level sports and fitness facilities, and does the “core–periphery” imbalance characteristic exist? (2) Do the differences in service levels among different types of facilities reflect supply–demand adaptation shortcomings, and how can overall equity be improved through classified optimization? This study constructs a framework based on the approach of “classified refinement + dual-dimensional evaluation + group adaptation,” with the specific paths as follows: First, community-level sports and fitness facilities are divided into two categories (commercial and public welfare) and 11 subcategories, making up for the limitation of the coarse facility classification system in existing research. Second, GIS spatial analysis technology, the 2SFCA accessibility model, and the Z-score supply–demand matching evaluation method are integrated to improve the objective quantitative analysis system. Meanwhile, a residents’ subjective perception survey is incorporated to achieve dual verification combining “objective indicators + subjective evaluation.” Finally, based on the community scale, with “spatial heterogeneity” as the core entry point, this study reveals the differences in accessibility and supply–demand characteristics among different types of facilities, providing data support for the precise optimization of facility layout.

2. Materials and Methods

2.1. Study Area

2.1.1. Geographical Location

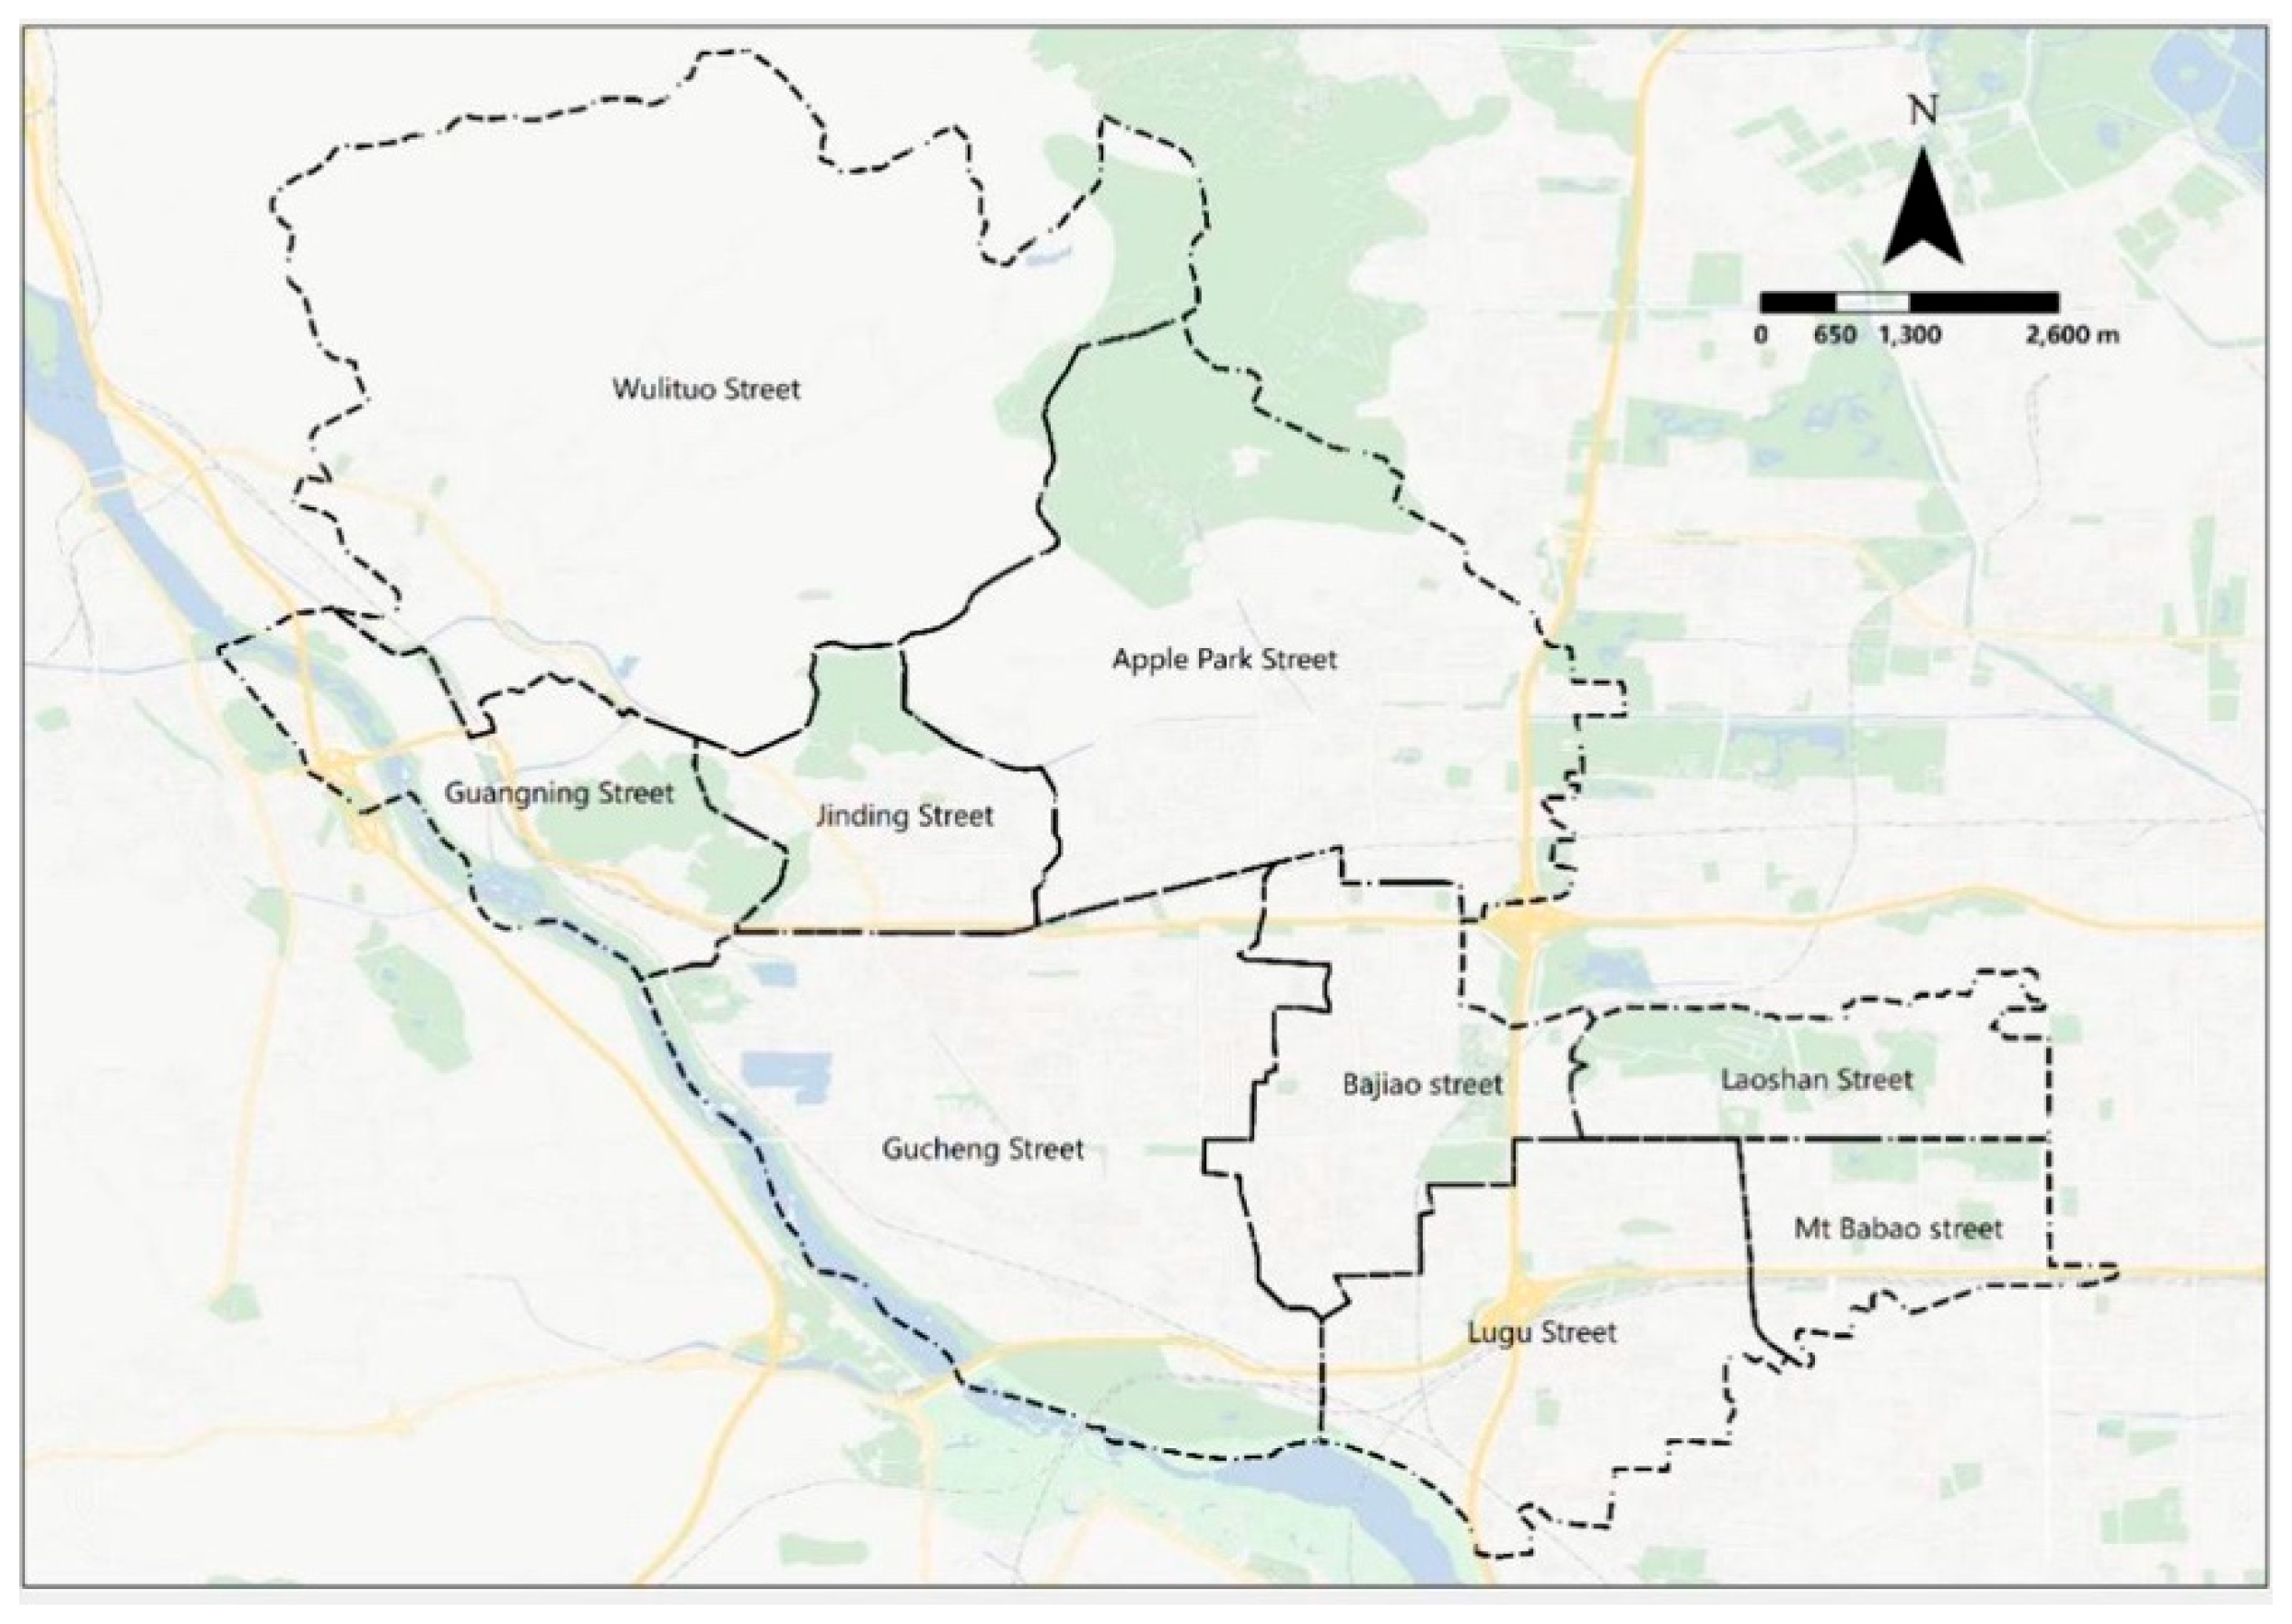
Beijing, China’s capital and the world’s only “Dual Olympic City” (hosting the 2008 Summer and 2022 Winter Olympics), comprises 16 administrative districts with a resident population exceeding 20 million and numerous advanced sports facilities. This study focuses on Shijingshan District [25], one of Beijing’s six core urban districts and a “Dual Olympic District” due to its role in both Olympic events. Located in western Beijing, Shijingshan spans 85.74 km2, situated between 39°53′–39°59′ N and 116°07′–116°14′ E (Figure 1). Following its successful hosting of two Olympics, the district has developed substantial and diverse sports and fitness infrastructure and organized numerous high-profile sports events. Shijingshan’s robust foundation in the quantity and diversity of fitness facilities serves as a national model. Thus, the measurement study on the equity of community sports and fitness facilities in Shijingshan District not only possesses the typicality of a specific region, but also its research conclusions and relevant analytical ideas can provide useful references for the planning and construction of sports and fitness facilities in similar cities.

2.1.2. Population Distribution

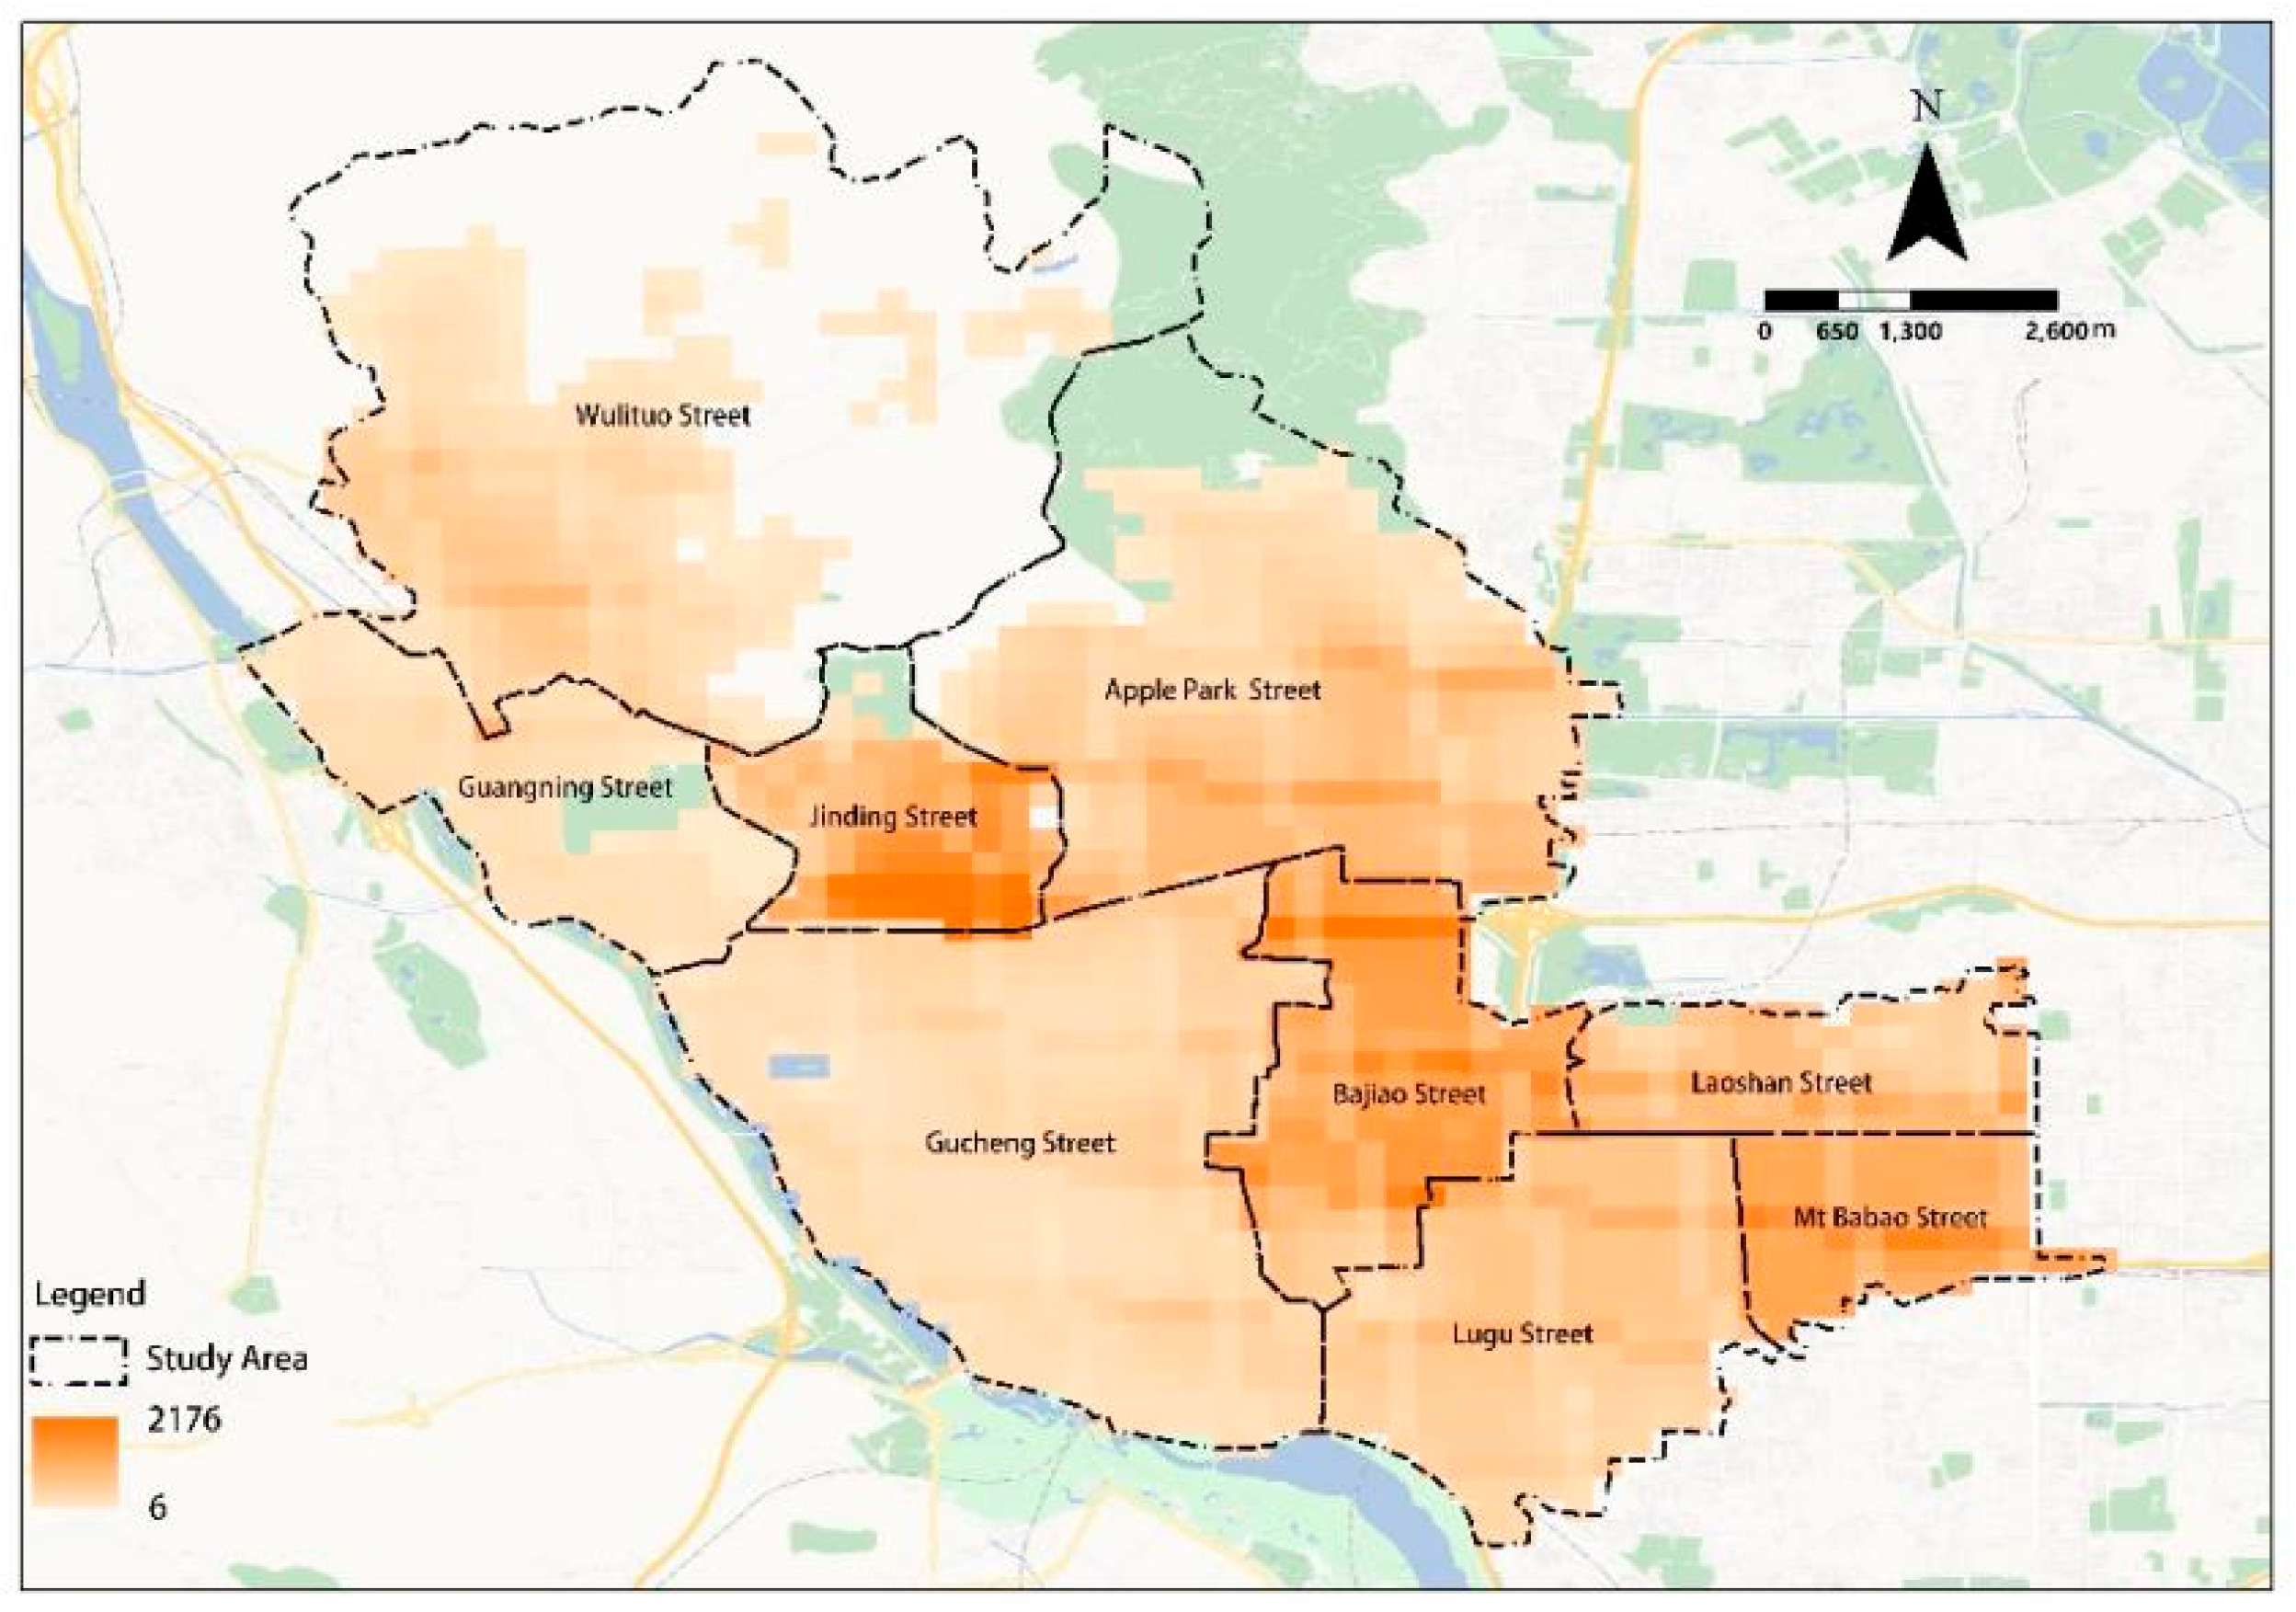
Shijingshan District comprises nine administrative subdistricts, with a resident population of 567,851 according to the Seventh National Population Census (2020). The population distribution is as follows: Babaoshan Subdistrict (61,211), Laoshan Subdistrict (40,023), Bajiao Subdistrict (110,929), Gucheng Subdistrict (67,685), Pingguoyuan Subdistrict (97,543), Jinding Subdistrict (67,734), Guangning Subdistrict (14,684), Wulituo Subdistrict (41,248), and Lugu Subdistrict (66,794). Bajiao Subdistrict has the largest population, with 110,929 residents (19.53% of the district’s total), followed by Pingguoyuan Subdistrict with 97,543 (17.18%). Guangning Subdistrict has the smallest population, with 14,684 residents (2.59%). In terms of population density, residents are primarily concentrated in Babaoshan, Laoshan, Lugu, and Bajiao subdistricts, as well as portions of Gucheng, Jinding, and Pingguoyuan subdistricts, exhibiting a spatial pattern that is partially clustered and partially dispersed across the district (Figure 2).

2.2. Data Sources and Classification

2.2.1. Data Sources

This study’s data comprise population distribution, administrative boundaries, community sports and fitness facilities, and geospatial regional maps (Table 1).
(1) Population Distribution Data of Shijingshan District
This study adopts the 2020 China population data from WorldPop (with a resolution of 100 m × 100 m), which is clipped to the scope of Shijingshan District using ArcGIS 10.8. To ensure data accuracy, the population data of each subdistrict is calibrated via GIS by combining with the data from the 7th National Population Census, resulting in the population distribution characteristic data of Shijingshan District. Given that the average scale of residential communities in Shijingshan District is approximately 200 m × 200 m, the population raster is divided into 200 m × 200 m grids (each grid corresponding to one residential community). Finally, the population size of each community is obtained through zonal statistical analysis.
(2) Sports and Fitness Facility Data of Shijingshan District
The sports and fitness facility data used in this study is derived from multi-platform integration supplemented by on-site surveys, specifically including commercial fitness facilities, national fitness facilities, and parks. The data acquisition, preprocessing, and integration process is detailed as follows:
Raw Point-of-Interest (POI) data for commercial fitness facilities was obtained from the Amap Open Platform, with a data cutoff date of March 2022. To enhance data accuracy, this study further cross-validated the information by comparing it with relevant data from third-party lifestyle service platforms such as Meituan and Dazhong Dianping. Through name matching, address verification, and other cross-validation techniques, duplicate, invalid, or closed facility records were eliminated during the data cleaning process, resulting in a reliable inventory of commercial fitness facility locations. Additionally, telephone surveys were conducted to collect actual operational area data for each fitness establishment, which compensated for the lack of quantitative analysis dimensions in publicly available data.
Public welfare fitness resources were sourced from the “Beijing National Fitness Public Service Platform,” which provides structured data on national fitness facilities, including specific geographic locations and the quantity of fitness equipment installed. These resources serve as a crucial component of public sports service provision.
Park POI data was also obtained from the Amap Open Platform. After data cleaning and screening (e.g., excluding non-open parks or non-green space parks), only park locations with public fitness functions were retained. Subsequently, based on the spatial distribution of these points, Geographic Information System (GIS) technology was employed to either manually digitize or generate buffer zones to define park boundaries, thereby assigning polygonal geospatial attributes to these point features for subsequent spatial analysis.
(3) Residents’ Fitness Data of Shijingshan District
After acquiring the sports and fitness facility data, it is necessary to understand residents’ usage of these facilities. Since there are no official statistics on data such as residents’ fitness preferences, this study obtained fitness-related data of Shijingshan residents (including facility usage, fitness frequency, and age distribution) through questionnaire surveys.

2.2.2. Data Classification

The classification of community-level sports and fitness facilities serves as the foundation for conducting supply–demand matching and equity evaluation. To ensure the scientificity and practical adaptability of the classification, this study takes “serving residents’ daily fitness needs” as the core orientation and establishes a classification system by integrating policy norms and the operational characteristics of facilities.
At the policy level, the Beijing Special Plan for Sports Facilities (2018–2035) [26] divides sports facilities into a four-level classification system, specifying that community-level public sports facilities shall serve the 15 min (1 km) fitness circle, including small-scale national fitness centers and community sports parks. The 14th Five-Year Plan for National Economic and Social Development of Beijing Municipality and the Outline of Long-Range Objectives Through 2035 puts forward the requirement of “integrated layout of parks and sports facilities”, which provides policy support for defining the scope and functional orientation of the research objects.
Combined with the research objectives and the differences in facility operation, on the basis of the policy-based classification, this study further divides community-level sports and fitness facilities into two major categories according to their operational nature, as follows:
Community Sports Parks: With a non-profit-oriented approach as the core characteristic, they are constructed based on community public green spaces or dedicated spaces and open to residents free of charge. Equipped mainly with infrastructure such as low-intensity fitness equipment, fitness trails, and small-scale activity venues, they focus on residents’ needs for daily leisure fitness and parent–child activities, serving as the core carrier of community-level public welfare sports facilities.
Commercial Sports and Fitness Facilities: With a profit-oriented approach as the core characteristic, they target residents with professional and diversified fitness needs and provide paid specialized services. Covering 11 subcategories—including fitness centers, yoga studios, martial arts and combat venues, swimming pools, basketball courts, billiards halls, ice and snow sports venues, taekwondo studios, table tennis halls, tennis courts, and badminton courts—they effectively supplement the supply gap of public welfare facilities in professional services.
This classification not only strictly adheres to the policy requirements of Beijing’s sports facility planning but also clearly distinguishes the supply subjects, service attributes, and functional positioning of facilities through the dual division of “public welfare + commercial.” It provides a standardized data foundation for the subsequent targeted analysis of the supply–demand matching degree, spatial distribution balance of the two types of facilities, and usage differences among different groups, thereby ensuring the pertinence and effectiveness of the equity evaluation.

2.3. Research Methods

To evaluate the equity of public service facility provision, previous studies have widely adopted various analytical methods. Kyushik Oh [27] employed GIS technology to evaluate the accessibility and availability of urban parks within a 1 km radius in Seoul, demonstrating the utility of spatial analysis. Gary Higgs et al. [13] utilized the 2SFCA model to measure residents’ access to sports facilities in Wales, underscoring the accuracy of spatial coverage metrics. Wei Fang et al. [28] applied the 2SFCA model to assess sports facility accessibility in Hangzhou, identifying population density, facility size, and travel barriers as critical factors, informing the methodological framework of this study. Yusuke Kataoka [29] analyzed facility accessibility across various aspects using a distance decay function, confirming the efficacy of distance-based models. Jinguang Zhang et al. [30] developed an enhanced Huff-2SFCA model to calculate park accessibility and pinpoint areas with inadequate service provision. Siqin Wang et al. [31] proposed three approaches to measure park accessibility, revealing that distance thresholds and transportation modes influence results more than destination choices, offering guidance for methodological refinement. Ran Zhang et al. [32] developed an index combining park accessibility and quality to evaluate urban park equity, effectively highlighting disparities in service levels. Ouyang Linxin [33] examined residents’ fitness-related travel distances, proposing a planning framework for a 15 min cycling fitness zone. Xu Qianli [12] used a demand function to investigate the spatial balance of public sports facilities and population distribution in Shanghai, focusing on quantitative supply–demand alignment.
To address the insufficiency of objective data in covering “residents’ subjective needs and perceptions,” this study simultaneously introduces the questionnaire survey method, forming a research framework of “objective quantification + subjective perception” together with the 2SFCA model and Z-score standard deviation analysis. This study takes accessibility, supply–demand characteristics, and group perception as the core characterization dimensions of the equity of the community sports and fitness facility service system. Specifically, the 2SFCA model is adopted for accessibility measurement to quantify the spatial coverage capacity of facilities; Z-score standard deviation analysis is used to analyze supply–demand characteristics, revealing the matching degree between supply and demand and their spatial differences; and group equity is based on questionnaire survey data, supplementing and verifying the results of objective equity from the perspectives of subjective satisfaction and demand adaptability. By integrating these three methods, this study aims to systematically and multi-dimensionally evaluate the equity of community fitness facilities in Shijingshan District, providing a scientific basis for optimizing the layout.

2.3.1. Questionnaire Survey

To accurately identify the usage needs, satisfaction perceptions, and group difference characteristics of community residents in Shijingshan District regarding sports and fitness facilities, and to provide subjective empirical support for the evaluation of facility equity, this questionnaire survey was conducted. The survey focuses on three core aspects: first, residents’ usage behaviors and preferences for fitness facilities, such as usage frequency, preferred facility types, and travel modes; second, multi-dimensional evaluation of facility satisfaction, including venue area, accessibility, and richness of facility types; and third, demand differences and equity perceptions among different groups, providing a data foundation for group equity analysis.
The questionnaire adopts a structured design, with an overall framework divided into 5 modules and a total of 22 items, covering demographic characteristics, usage behaviors, satisfaction evaluation, demand preferences, and open-ended suggestions (Table 2). Among them, the satisfaction evaluation items use a 5-point Likert scale (1 = Strongly Dissatisfied, 5 = Strongly Satisfied) to ensure the feasibility of quantitative analysis; the demographic characteristic items include core grouping variables such as gender and age; and the open-ended items are used to collect residents’ specific suggestions for facility optimization, supplementing the limitations of quantitative data. After the questionnaire design was completed, a pre-survey (n = 30) was conducted to test its reliability and validity. The results show that the overall Cronbach’s α coefficient is 0.876, the α coefficients of each dimension range from 0.723 to 0.851, the KMO value is 0.812, and the p-value of Bartlett’s test of sphericity is <0.001. These indicate that the questionnaire exhibits good reliability and validity, meeting the requirements of social science surveys.
The survey covers all 9 subdistricts of Shijingshan District. Given that the total population of the study area is approximately 600,000 and with reference to conventional sample size standards for community sports facility research, a stratified random sampling method was adopted to determine the sample distribution: sample quotas were allocated based on the population proportion of each subdistrict, ensuring full coverage of all administrative units in the district. In the sampling process, a combined method of “offline interception assisted by community grid workers + targeted online distribution via Wenjuanxing” was employed, balancing different age and gender groups to avoid sample concentration bias and ensure regional representativeness and group diversity of the samples.
The survey was conducted from April to October, 2023, with a total of 321 questionnaires distributed, all of which were valid—meeting the ≥70% valid recovery rate standard for social science surveys. In the data processing stage, Excel was used for data entry and cleaning, and missing values were handled using the “group mean imputation method.” Statistical analysis was performed using SPSS 26.0 software, including descriptive statistics (mean, standard deviation), reliability and validity tests, one-way analysis of variance (ANOVA), and independent samples t-tests, providing quantitative support for group equity evaluation.

2.3.2. Accessibility Measurement

The accessibility of sports facilities, namely, the ease with which residents access them, is a key metric for assessing service equity. High accessibility ensures broader resident access, demonstrating service fairness. The two-step floating catchment area (2SFCA) method, a standard approach for assessing facility accessibility, uses supply and demand points in two-stage calculations. As accessibility is influenced by distance and time, this study employs a Gaussian decay function to set decay coefficients, ensuring more realistic accessibility estimates.
The process begins by calculating the supply–demand ratio, with the facility area as the measure of supply capacity and population as the measure of demand. The formula is as follows:
R j = S j Σ k d k j d 0 G ( d i j ) D k
where R j denotes the supply–demand ratio, S j represents the facility area as a measure of supply capacity, d k j is the distance between demand point k and facility j, d 0 is the facility’s maximum service distance, D k denotes the population of each demand unit, and G d i j represents the Gaussian decay function. The formula is as follows:
G d i j = e 1 2 × d i j d 0 2 e 1 2 1 e 1 2 d i j < d 0
The second step employs the supply–demand ratio and a Gaussian decay function to assess facility accessibility. The formula is as follows:
A i D = j d I d 0 G d i j R j
where A i D denotes facility accessibility, with higher values indicating greater accessibility.
Sports facility data are evaluated for accessibility using the Gaussian 2SFCA method, which integrates supply and demand. This approach first assesses population demand based on facility supply and then evaluates facility accessibility based on population demand, yielding a comprehensive accessibility measure through two steps. The supply side comprises sports and fitness facilities of different types, with the facility area serving as a proxy for supply capacity; supply-side data were collected via surveys (by confirming the facility area through telephone surveys). The demand side is represented by the total population, with the population of each neighborhood unit determining demand-side needs.

2.3.3. Supply–Demand Dynamics

The supply–demand dynamics of facilities, encompassing supply volume, distribution, and capacity to meet residents’ needs, significantly influence service equity. Facilities with ample, evenly distributed supplies that address diverse resident needs exhibit greater equity. The Z-score method standardizes data by subtracting the mean and dividing by the standard deviation, yielding scores with a mean of 0 and a variance of 1. Positive Z-scores indicate values above the mean, while negative scores indicate values below it. This study employs Z-scores to accurately measure the standardized distance of sports facility supply and demand from their means. The formula is:
Z x = x x ¯
where x is the data value, x ¯ is the mean, and is the standard deviation.
To analyze fitness facility supply–demand dynamics, the Z-score method standardizes the accessibility metric A and the facility area required to meet population demand P, expressed as Z A i (standardized supply score) and Z P i (standardized demand score). Z A i > 0 indicates abundant supply, Z A i < 0 indicates limited supply; Z P i > 0 signifies high demand, Z P i < 0 signifies low demand. Combinations include: Z A i > 0, Z P i > 0 (elevated supply and demand); Z A i > 0, Z P i < 0 (surplus supply, low demand); Z A i < 0, Z P i > 0 (insufficient supply, high demand); and Z A i < 0, Z P i < 0 (low supply and demand).
Z A i = A i A / σ A
Z P i = P i P / σ P
A i denotes the area of facility I, A is the mean facility area, and σ A is the standard deviation of the facility area.
P i represents the facility area needed at location i, calculated as the population at i multiplied by the 2025 target value from the 14th Five-Year Plan, with P as the mean and σ P as the standard deviation of the required facility area.
These supply–demand dynamics yield four scenarios:
Elevated supply and demand: High population density drives strong demand, necessitating evaluation of supply–demand alignment to ensure adequate provision.
Surplus supply: Abundant supply with moderate population density requires assessment to prevent resource inefficiency.
Insufficient supply: High demand from population concentration, but limited supply signals urgent enhancement needs.
Low supply and demand: Low current demand and supply, but future population growth could generate supply demands, requiring proactive planning.

3. Results

3.1. Questionnaire Analysis

3.1.1. Overall Results

A total of 321 valid questionnaires were collected in this survey, including 163 from male respondents and 158 from female respondents. The survey results indicated that residents’ exercise frequency was predominantly characterized by “occasional exercise” (1–2 times per week), accounting for 51.4%. This was followed by “regular exercise” (3 times or more per week), making up 32.7%. Additionally, 15.9% of the respondents reported “almost never exercising”. Regarding the primary reasons for non-participation in exercise, 54.2% of the respondents cited “lack of interest in physical activity”, 32.1% attributed it to “insufficient leisure time”, and 13.7% pointed out “failure to find suitable exercise venues or methods”.
In terms of exercise location preferences, 40.0% of the respondents tended to exercise within residential compounds or community parks, while 31.1% chose to go to gyms or fitness clubs, most of whom were regular exercisers. These findings demonstrate that community-level public sports spaces play a fundamental role in supporting residents’ daily exercise behaviors, and their convenience and accessibility are key factors influencing residents’ willingness to use them.
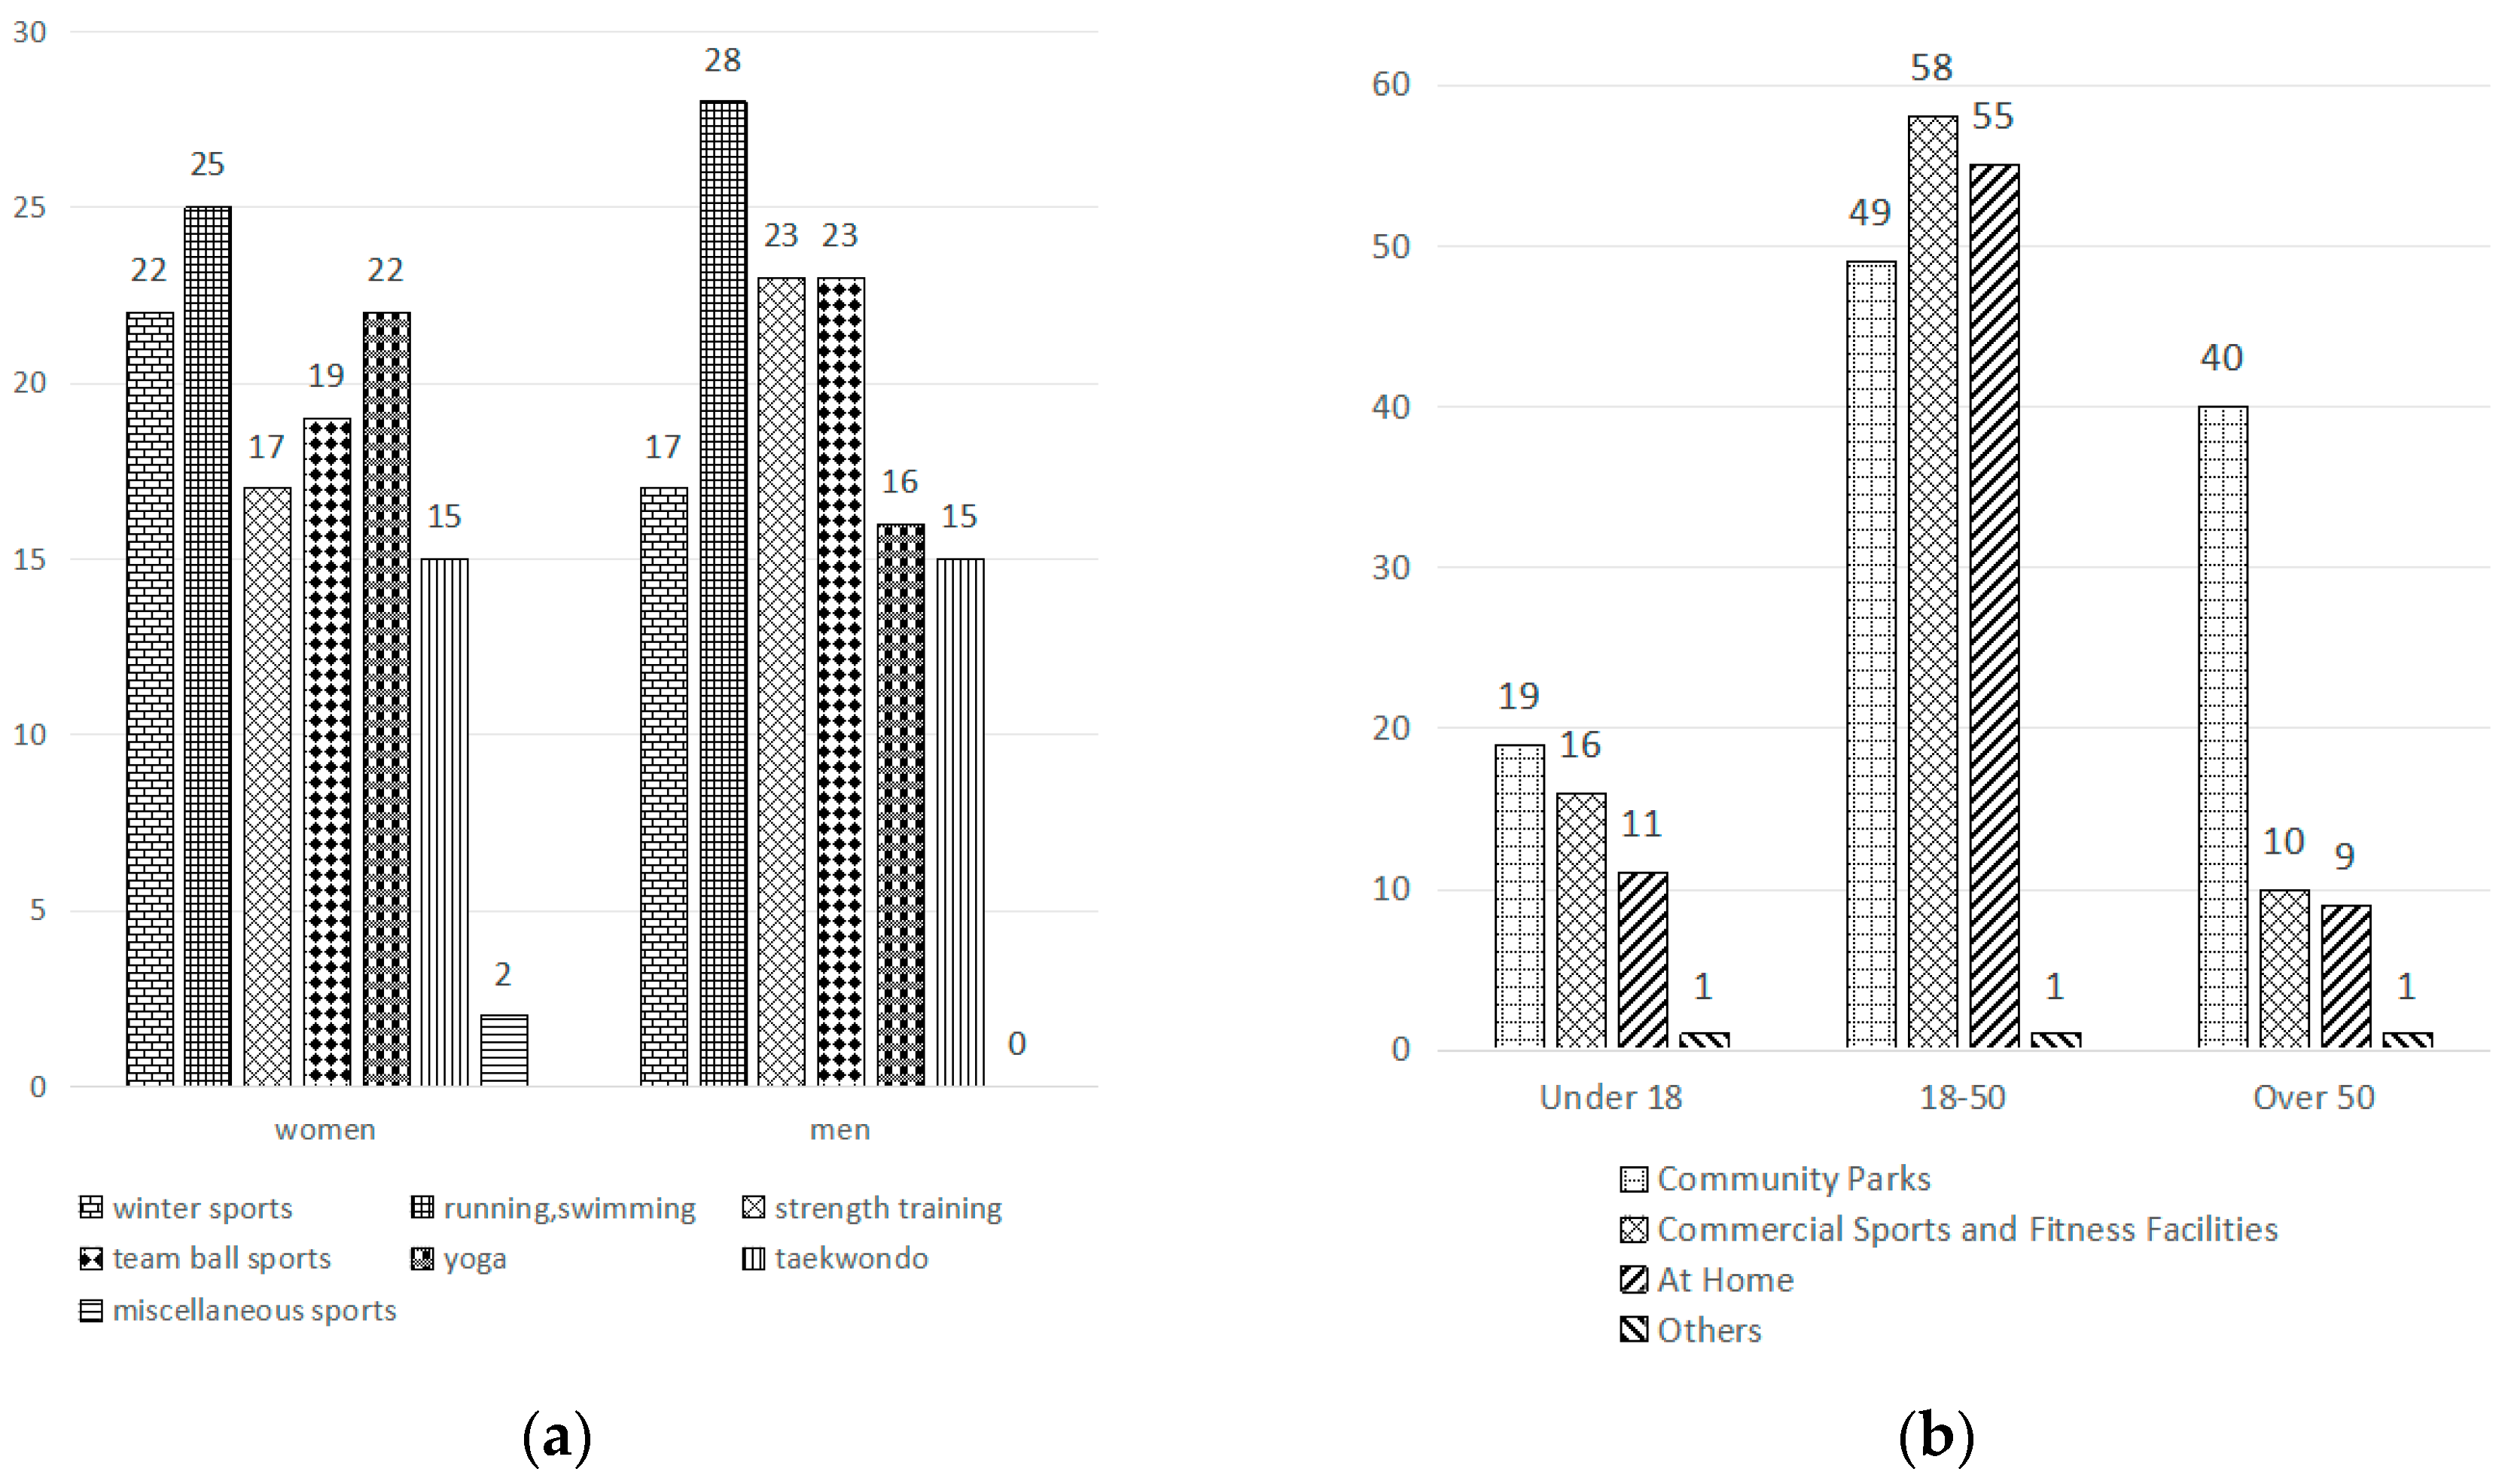
With respect to facility preferences (Figure 3), female respondents showed a greater inclination toward low-intensity and relaxing activities such as yoga, whereas male respondents preferred strength training and ball sports. Nevertheless, most facilities exhibited good inclusiveness across gender groups. More pronounced differentiation was observed across age groups. The 18–50 age group dominated high-intensity and specialized sports programs, and extensively utilized both commercial fitness venues and home-based exercise settings. In contrast, the population aged over 50 years demonstrated relatively low overall participation in physical activities, but were highly concentrated in public welfare spaces such as community parks, reflecting a rigid reliance on nearby, free, and open-access facilities. The differentiation in such demand structures provides a key empirical basis for the in-depth analysis of the equity and effectiveness of facility allocation from the dual dimensions of spatial accessibility and supply–demand matching in subsequent research.

3.1.2. Group Satisfaction Difference Analysis

Based on 321 valid questionnaires, age groups were divided into three categories: under 18 years old (adolescents), 18–50 years old (young and middle-aged adults), and over 50 years old (middle-aged and elderly adults). Taking three core indicators—satisfaction with venue area (S1), satisfaction with accessibility (S2), and satisfaction with facility type diversity (S3)—and combining the gender dimension, inter-group differences were analyzed through statistical tests to evaluate the equity of facility allocation.
I. Descriptive Statistical Analysis
The sample size and mean satisfaction score of each age group meet the requirements of statistical analysis, with specific performances as follows: the over-50 age group has the highest comprehensive satisfaction, leading in all dimensional scores; the 18–50 age group ranks in the middle in comprehensive satisfaction, with dimensional scores showing the characteristic of “accessibility > venue area > facility type”; the under-18 group exhibited the lowest comprehensive satisfaction level, with the most prominent deficit observed in satisfaction with facility type diversity, which scored 0.22 points below the overall average (Table 3).
To ensure the reliability of the difference test results, normality tests and homogeneity of variance tests were first performed on the dataset. The results indicated that the data of all satisfaction dimensions across all groups satisfied the requirements of normality (all p-values > 0.05) and homogeneity of variance (all p-values > 0.05), thus meeting the prerequisites for subsequent statistical analyses.
II. Fairness Analysis of Age Groups
The one-way ANOVA results (Table 4) indicated that there were statistically extremely significant differences in overall satisfaction and most sub-dimensions among different age groups (p < 0.001). Specifically, the statistics were as follows: overall satisfaction (F = 8.723, p = 0.0003); satisfaction with venue area (F = 6.915, p = 0.0015); satisfaction with accessibility (F = 7.258, p = 0.0011); and satisfaction with facility type diversity (F = 5.382, p = 0.006). Across all satisfaction dimensions and overall satisfaction, highly significant or extremely significant differences were observed among age groups (all p < 0.01), indicating that age is a core factor influencing residents’ satisfaction with community sports facilities.
Further verification via the post hoc LSD (Table 5) test indicated that the differences were mainly concentrated between the over-50 age group and the other two younger groups.
III. Gender Group Equity Analysis
An independent-samples t-test was conducted with gender as the independent variable and all satisfaction dimensions, as well as overall satisfaction, as dependent variables. The results are presented in Table 6 below:
The independent-samples t-test results indicated that the p-values of gender groups across all satisfaction dimensions and overall satisfaction were all greater than 0.05, failing to meet the criteria for statistical significance.
Combined with the “gender-facility preference cross-analysis” from the questionnaire, the supply proportion of yoga studios and outdoor trails (preferred by females) accounts for 28%, while the supply proportion of ball courts (preferred by males) reaches 32%. The supply–demand structure shows a high degree of matching with gender-specific needs, and there is no issue of “biased resource allocation.” Thus, the gender-based equity of community sports facility satisfaction in Shijingshan District was determined to be highly equitable.

3.2. Accessibility Analysis

Based on the improved two-step floating catchment area (2SFCA) method, a 15 min walking distance (approximately 1000 m) was adopted as the service radius to systematically measure the spatial accessibility of commercial sports and fitness facilities, as well as community sports parks in Shijingshan District. The results show that there are fundamental differences in coverage logic and spatial pattern between the two types of facilities, resulting in a composite pattern of market-driven efficiency, government-guaranteed basic access, and persistent shortcomings in structural equity.
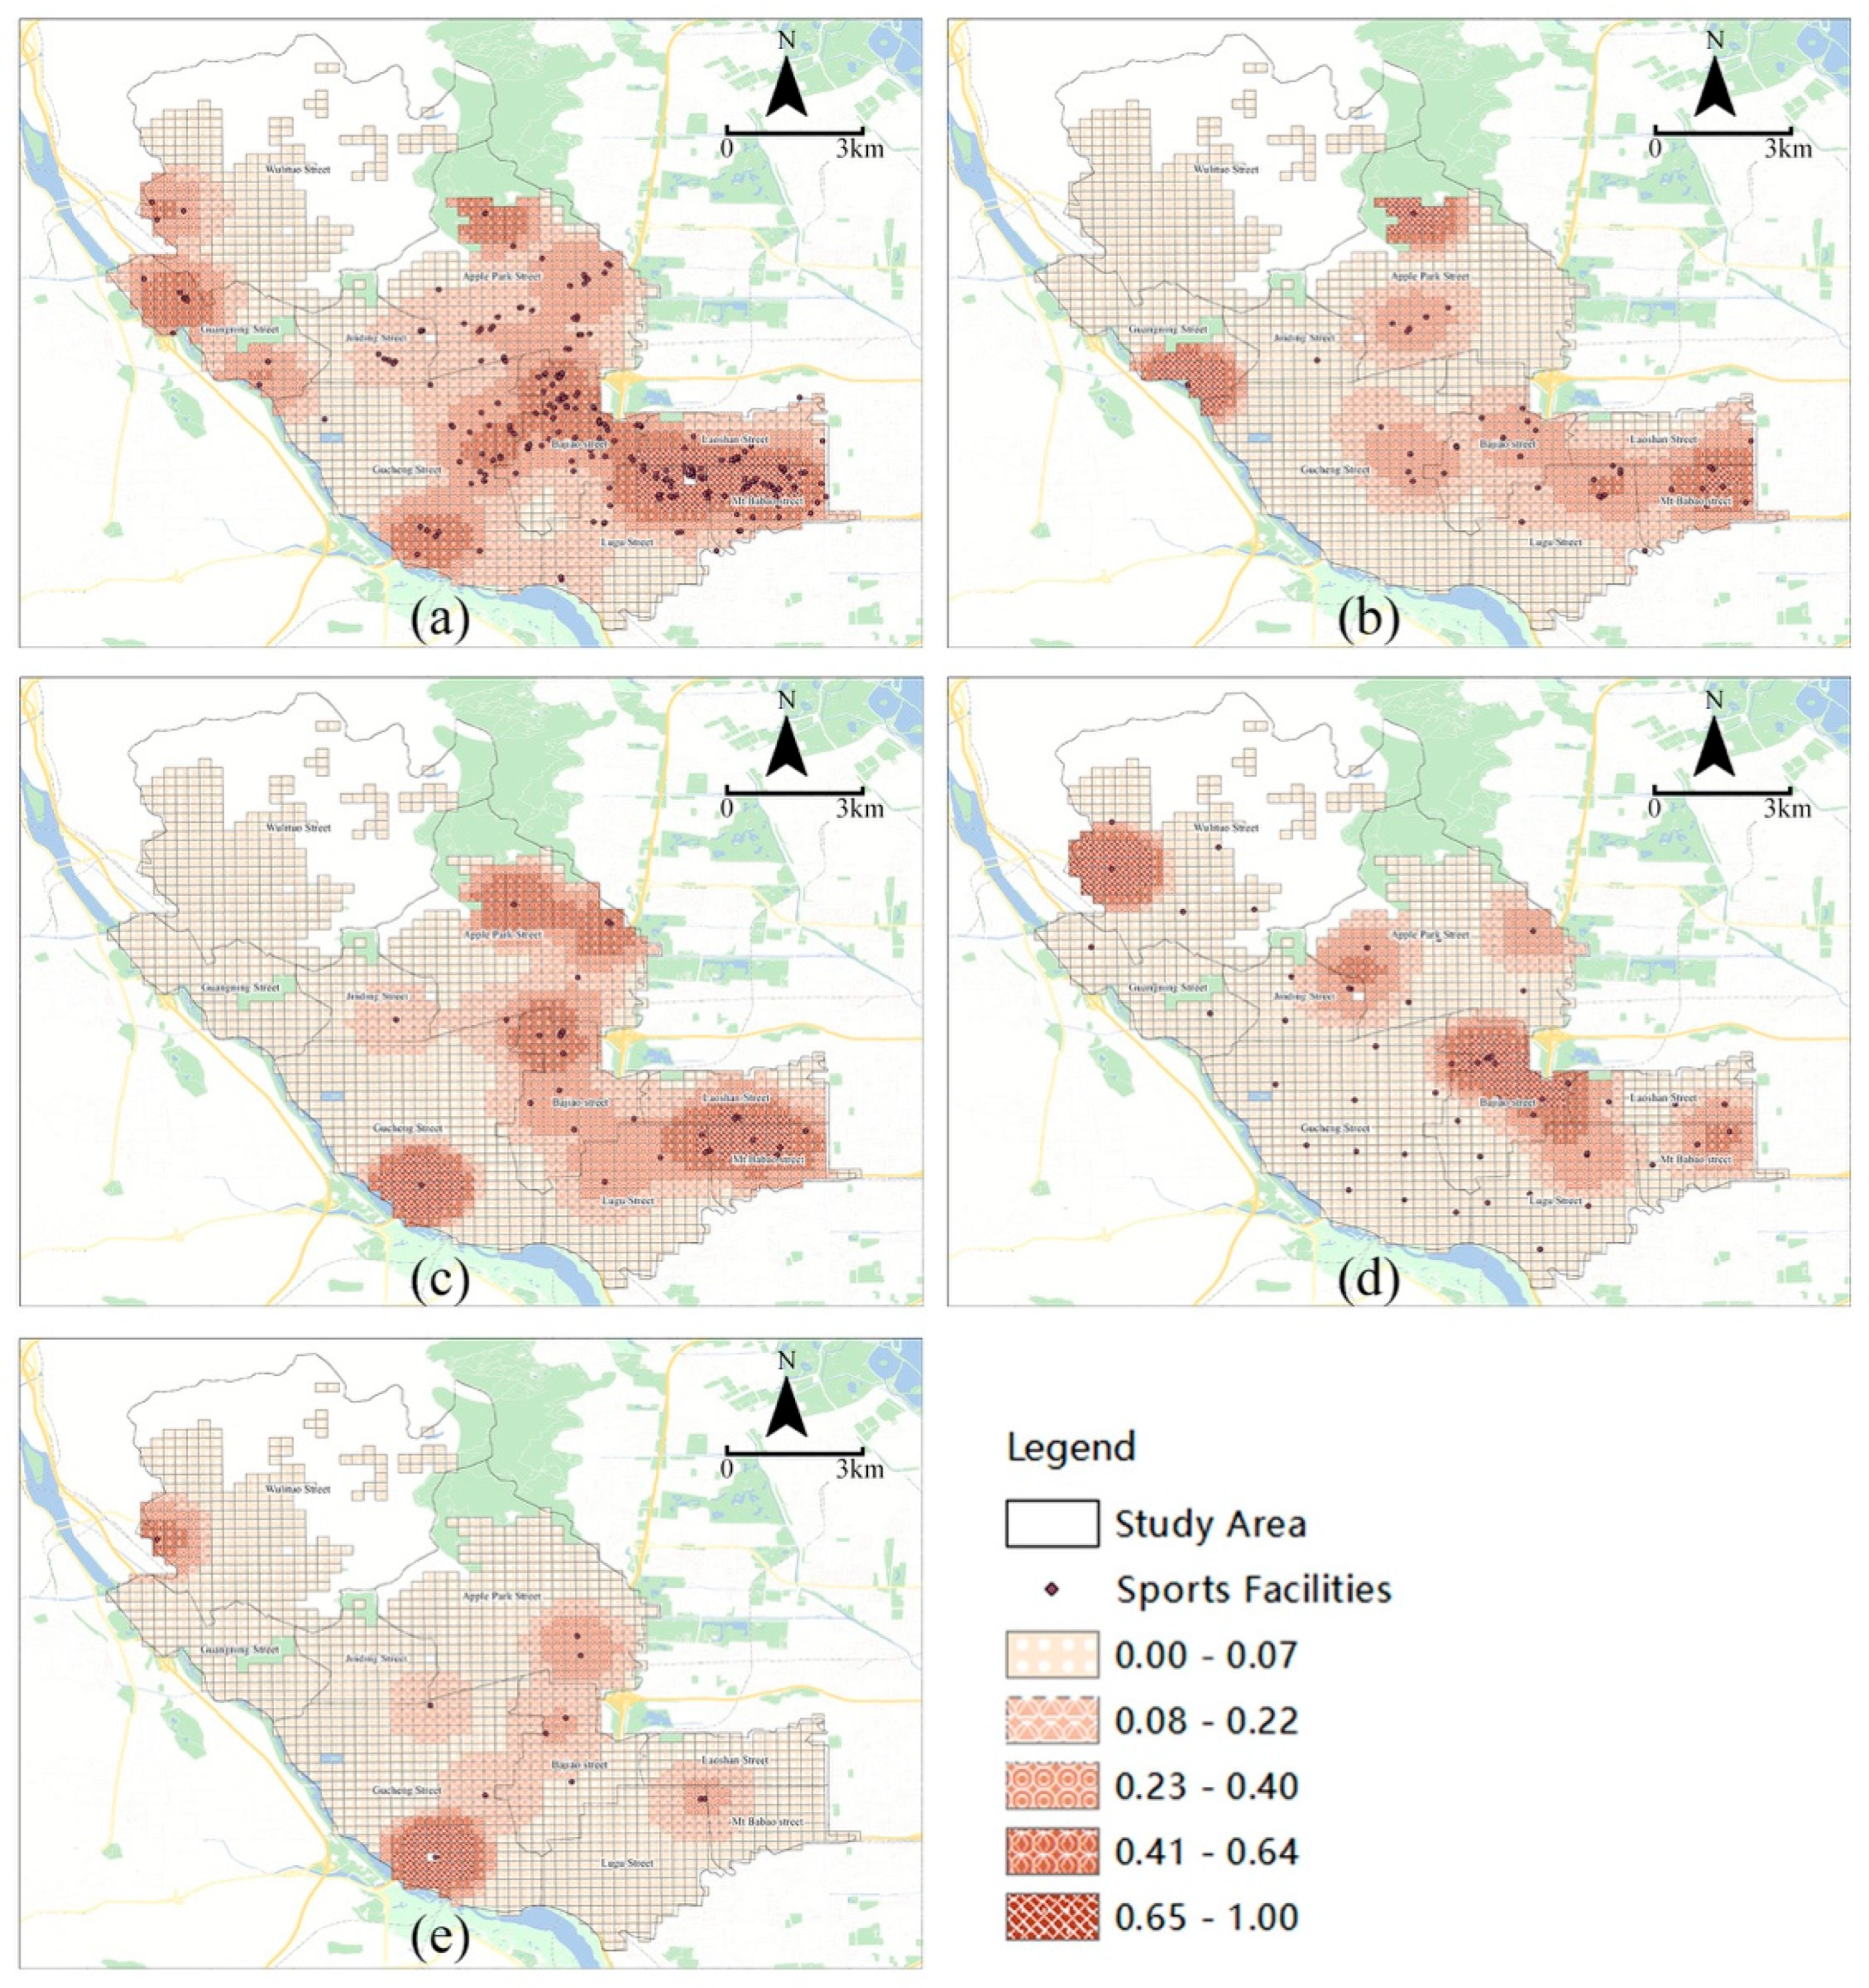
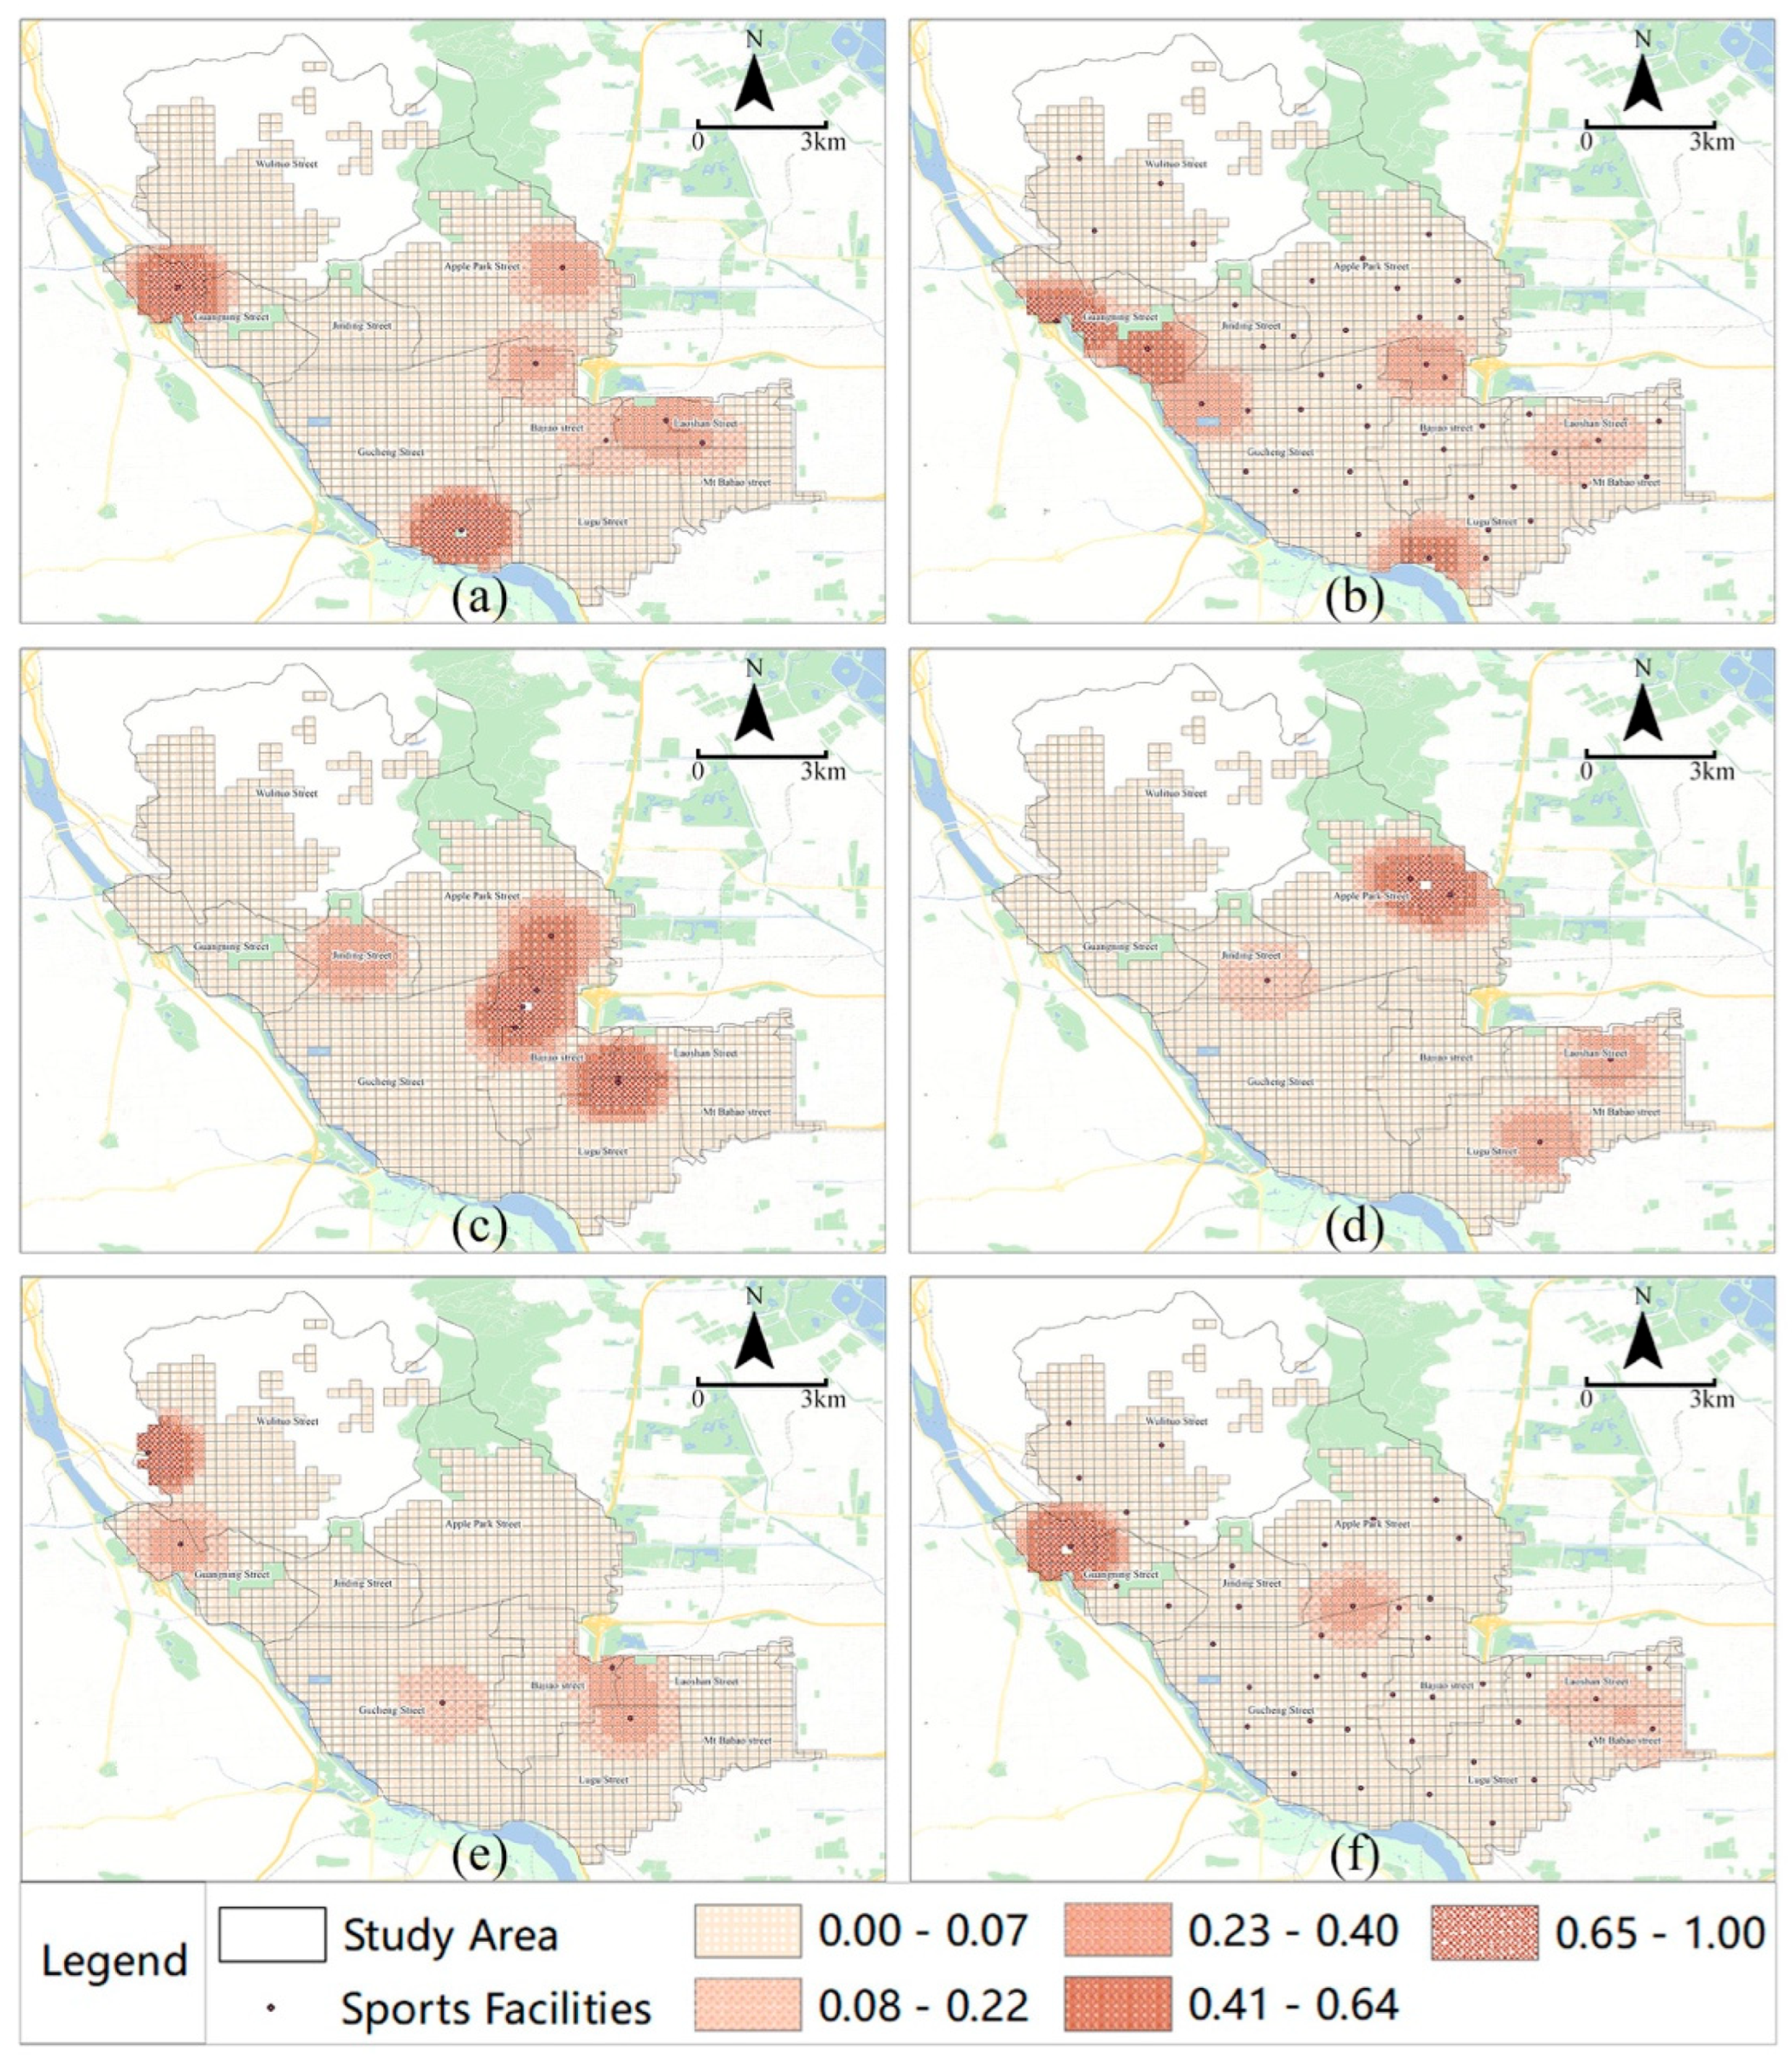
The accessibility of commercial facilities is highly dependent on market logic, exhibiting a distinct core–periphery differentiation. Areas with high accessibility are mainly distributed in subdistricts such as Pingguoyuan, Gucheng, Bajiao, Laoshan, Babaoshan, and Lugu. These populous areas with strong consumption capacity have attracted an agglomeration of a large number of market-oriented operators, reflecting the dominant influence of population density and purchasing power on the siting of commercial facilities. Further observations reveal a clear type differentiation within commercial facilities: popular facilities (e.g., comprehensive gyms, yoga studios, martial arts halls, swimming pools, and billiard halls) demonstrate contiguous high-value distribution, with relatively balanced service coverage (Figure 4). In contrast, facilities constrained by venue costs and customer base scale (e.g., basketball courts, ice and snow sports venues, taekwondo studios, table tennis halls, tennis courts, and badminton courts) feature scattered point-like layouts, with high accessibility concentrated only in a few nodes and a widespread absence in peripheral areas (Figure 5).
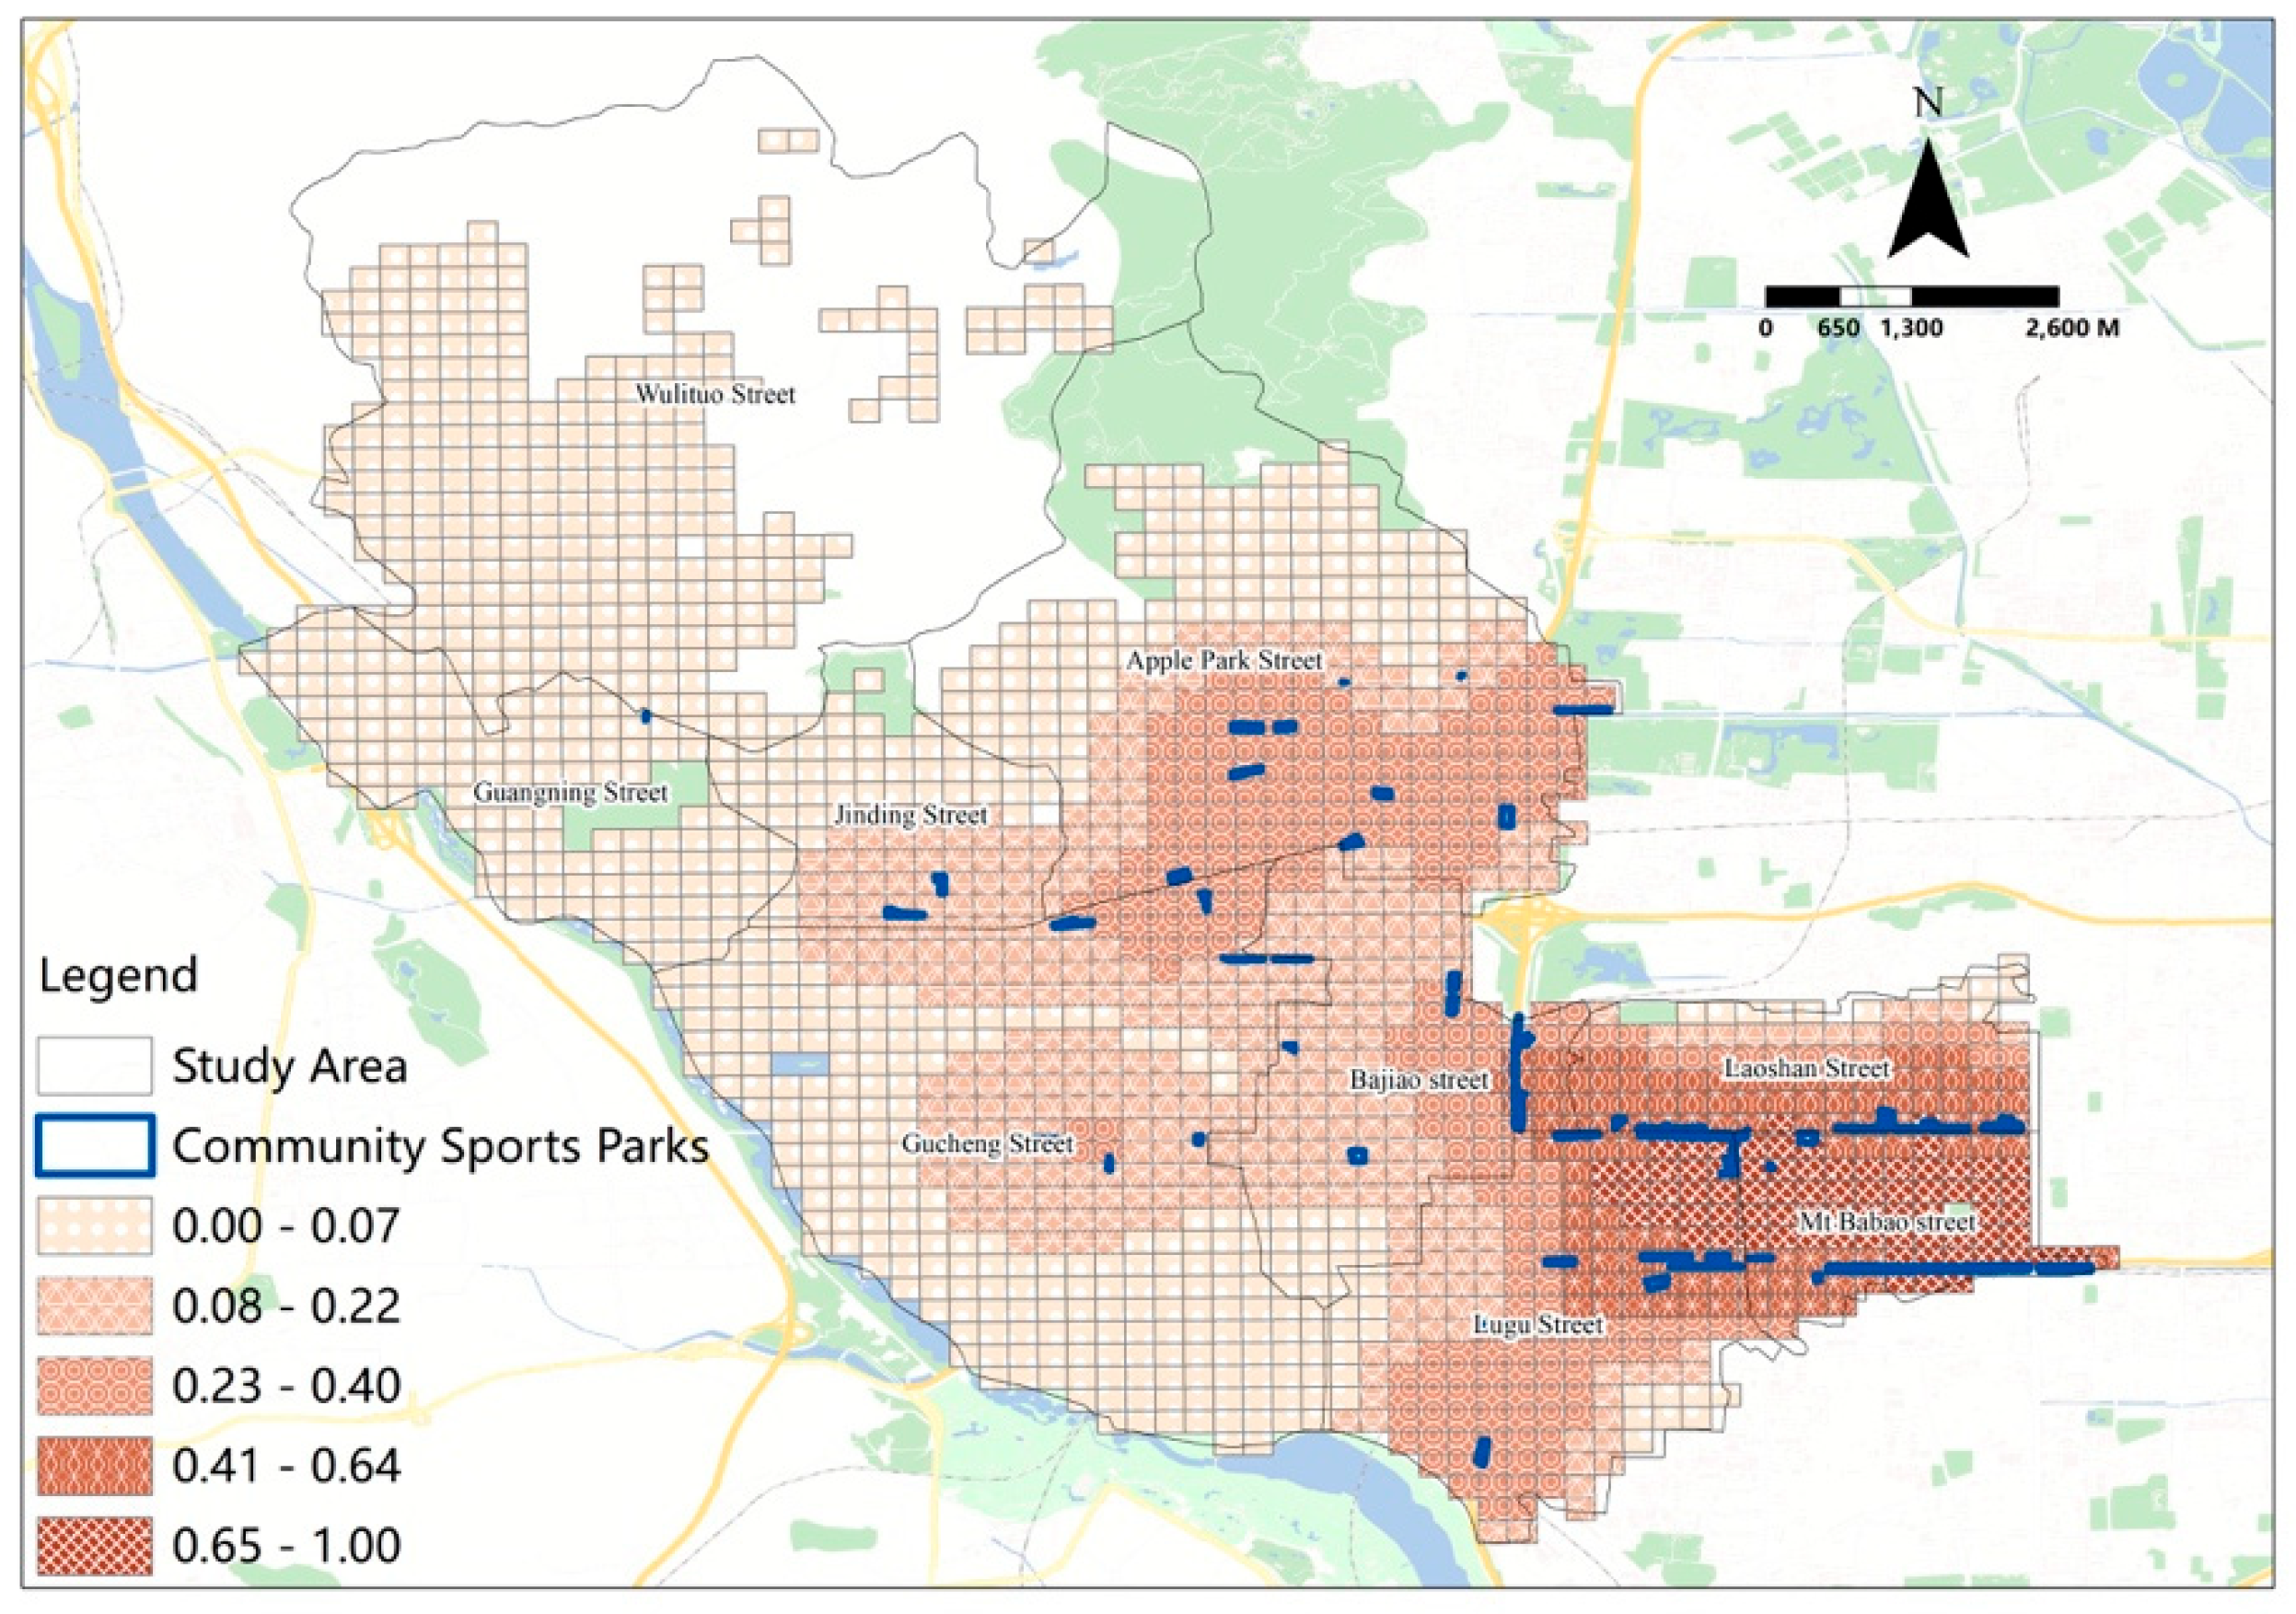
As public welfare facilities, community sports parks generally outperform commercial facilities in terms of overall accessibility, which demonstrates the effectiveness of government-led allocation in safeguarding basic public services. Most subdistricts across the district achieve coverage by at least one community sports park within the 15 min walking catchment area, with particularly high accessibility observed in subdistricts including Pingguoyuan, Jindding, Gucheng, Bajiao, Lugu, Babaoshan, and Laoshan. Nevertheless, localized disparities persist: subdistricts such as Wulituo and Guangning exhibit relatively lower accessibility to community sports parks, where the number of facilities falls below the district average. Even so, in contrast to the pronounced core–periphery differentiation exhibited by commercial facilities, community sports parks feature a more balanced spatial distribution overall. This reflects the positive role played by public resource allocation in advancing the accessibility of basic fitness services for residents (Figure 6).
In summary, the accessibility pattern of sports and fitness facilities in Shijingshan District is essentially the result of the interplay between the two logics of market efficiency and public equity. This finding not only reveals the structural shortcomings in the current construction of the “15 min fitness circle” but also provides a spatial basis for subsequent supply–demand matching analysis, conclusions, and recommendations.

3.3. Supply–Demand Analysis

Based on the spatial pattern of accessibility, this study further adopted the Z-score standardization method to integrate facility service capacity and residential demand intensity, thereby quantifying the supply–demand matching status of sports and fitness facilities in each subdistrict (Z > 0 indicates a state of oversupply, while Z < 0 denotes a state of insufficient supply). The results show that the supply and demand of sports and fitness facilities in Shijingshan District exhibit characteristics of spatial mismatch, which reveals the dual contradictions of “overall shortage and type imbalance of commercial facilities” and “peripheral shortage and uneven coverage of public welfare facilities”. This contradiction confirms that simply expanding the supply scale is insufficient to address the issue of “difficulty in accessing fitness services”. Future optimization efforts need to shift toward a refined path that involves accurately identifying demand structures, implementing differentiated allocation of facility types, and prioritizing the enhancement of facilities in peripheral areas.
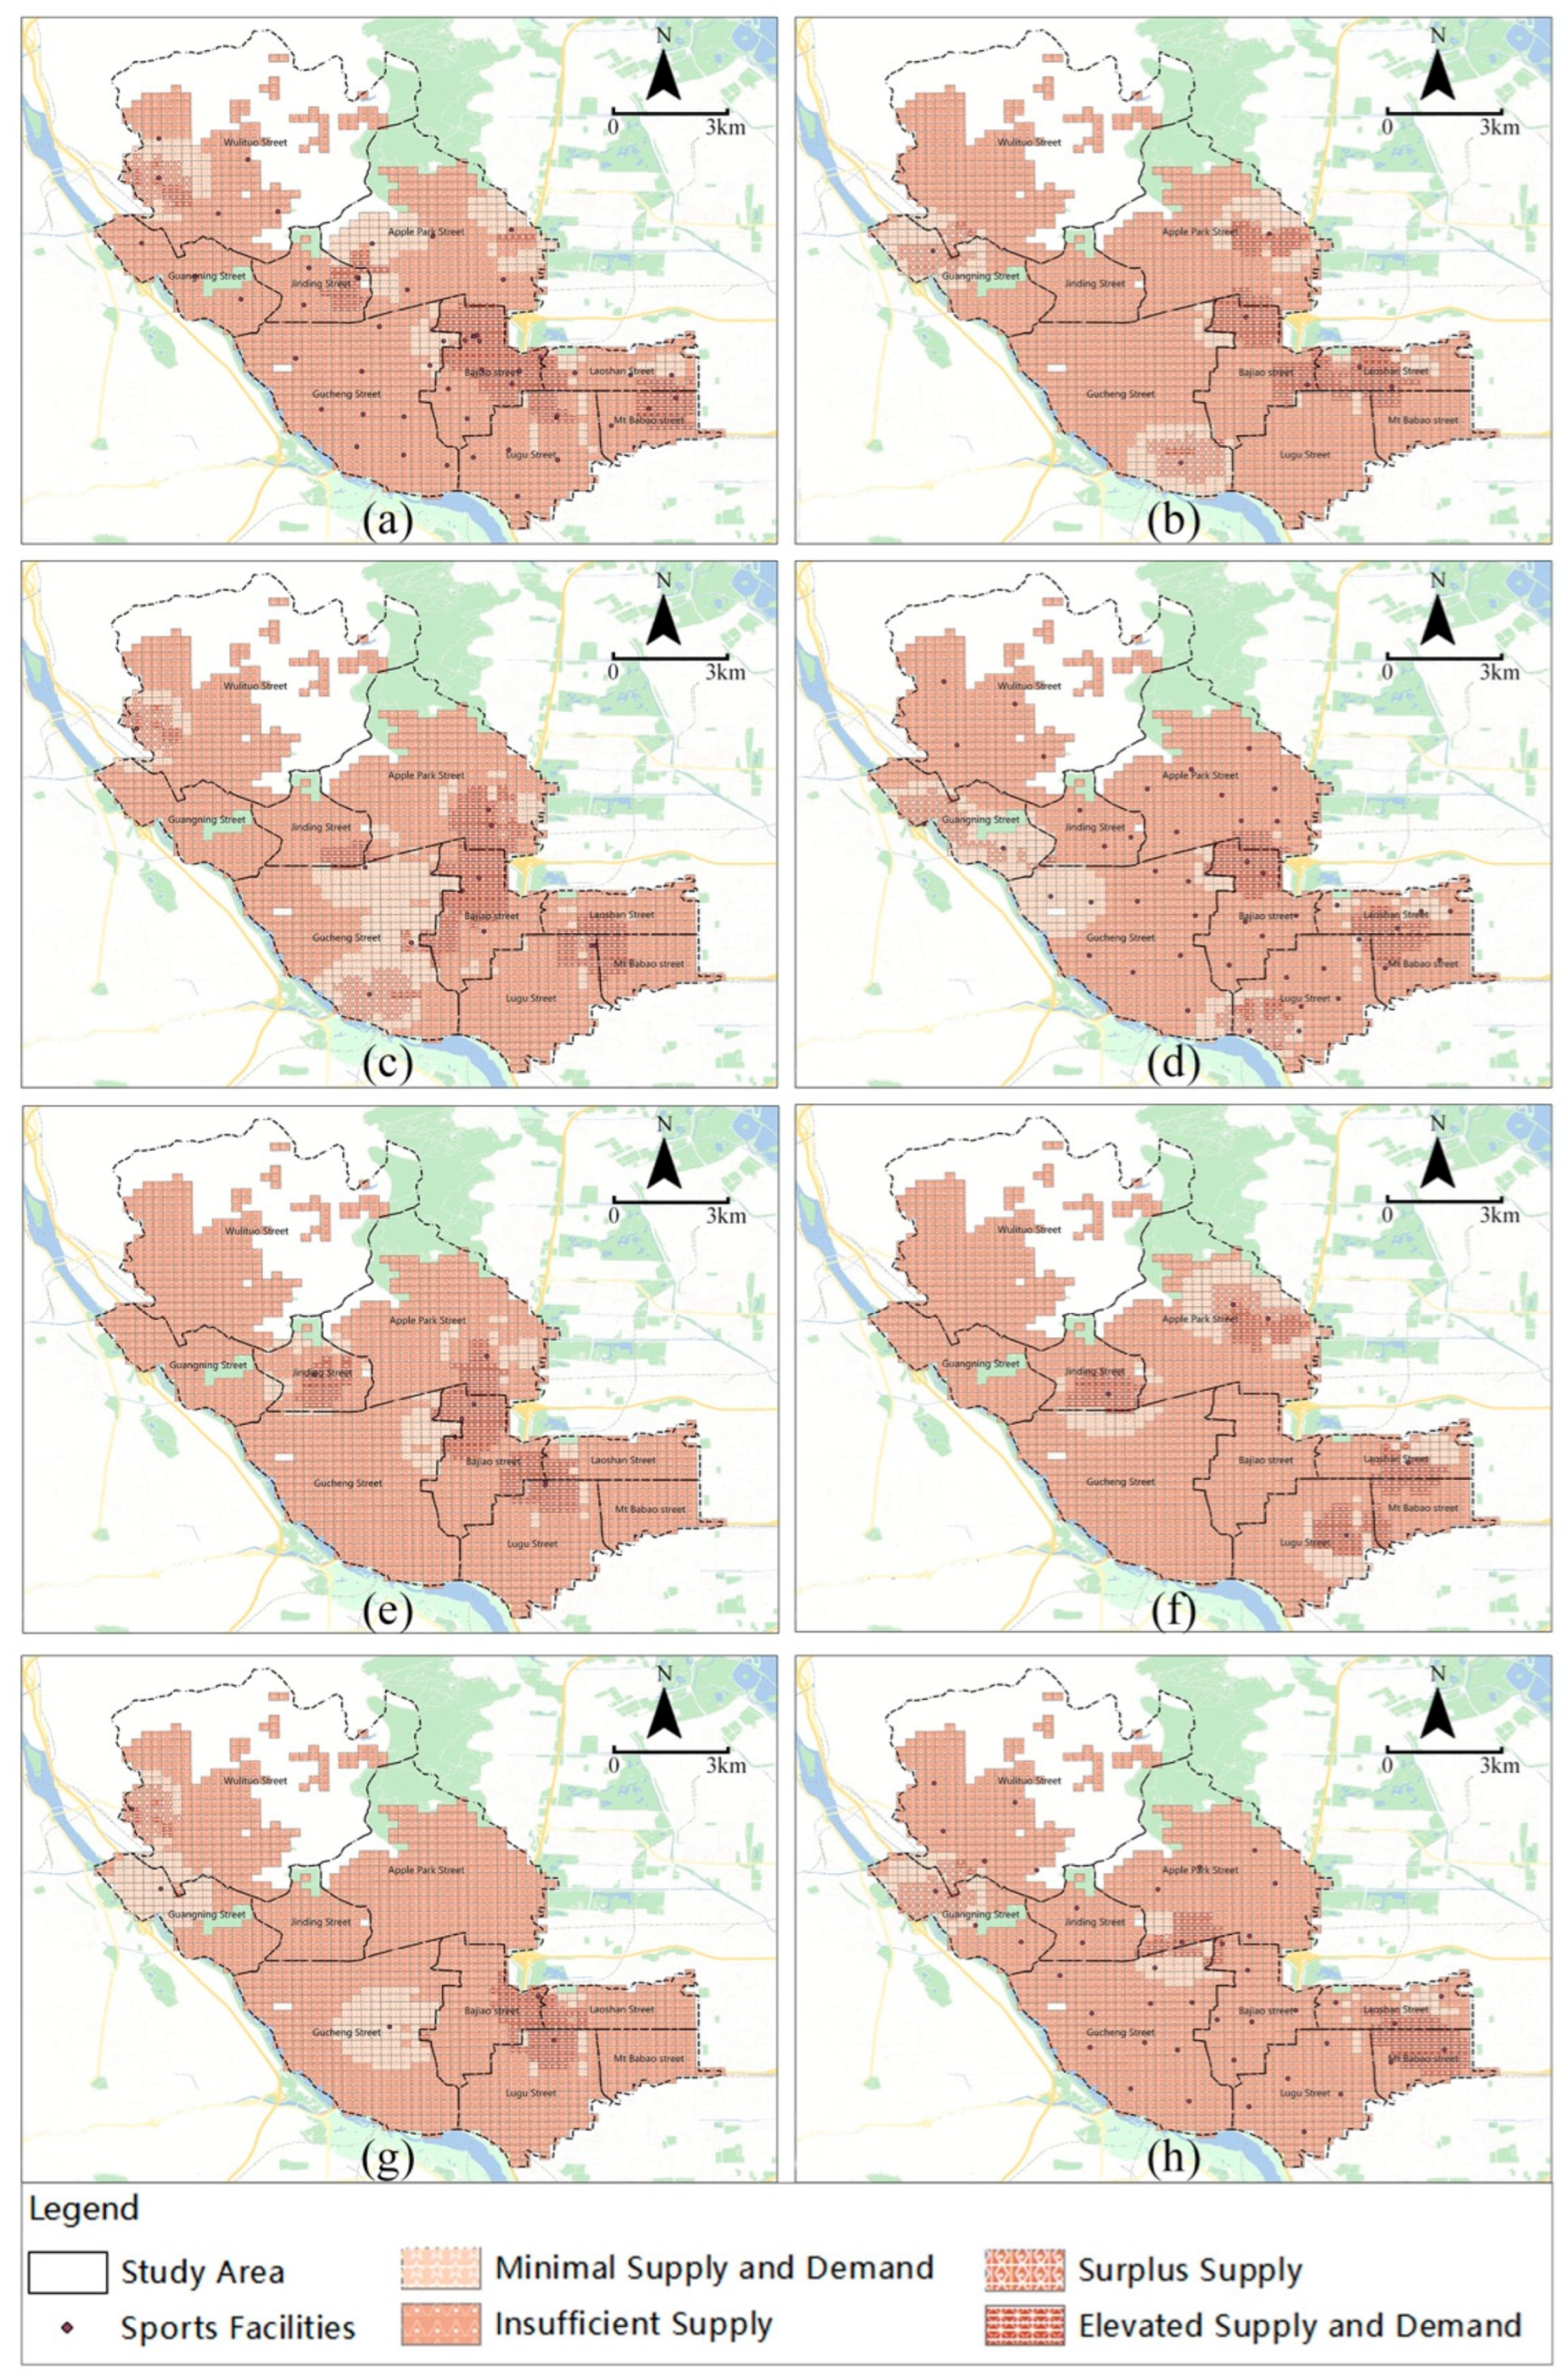
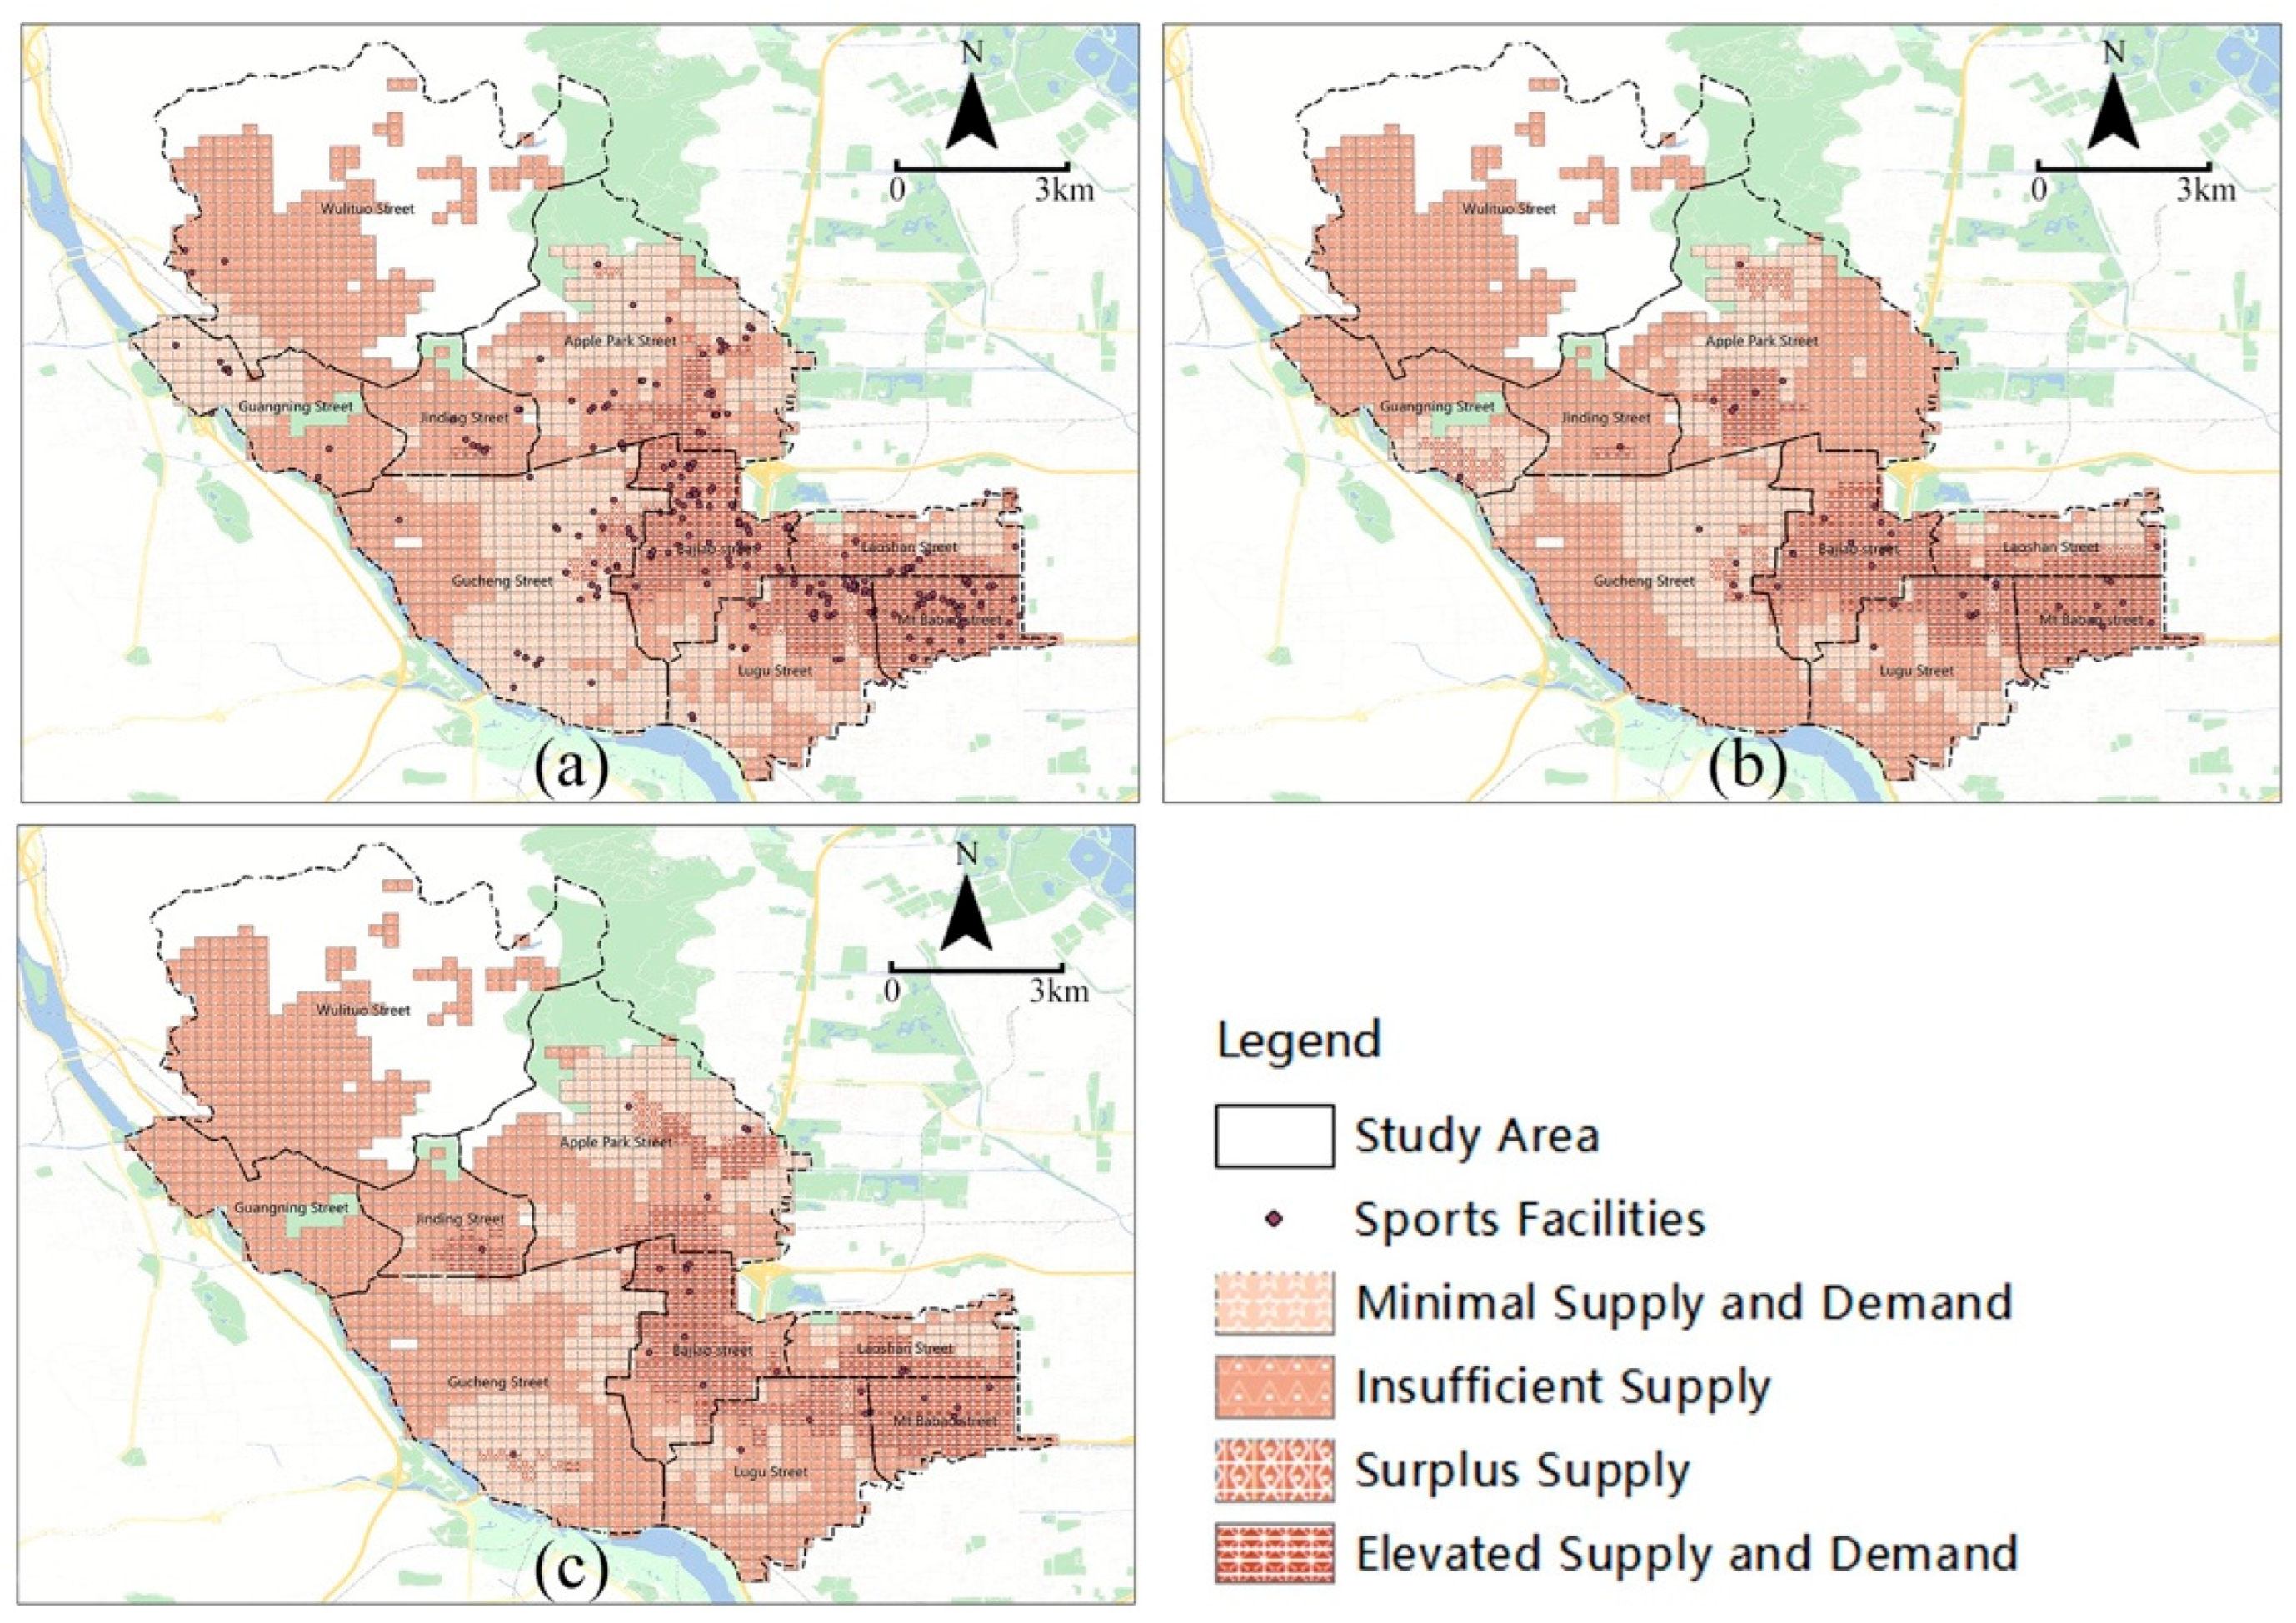
Commercial sports and fitness facilities are confronted with severe structural supply shortages. Among the 11 categories of commercial facilities across the district, eight categories are in a state of insufficient supply (Z < 0) in over 70% of the areas, with badminton, taekwondo, swimming, and tennis facilities being particularly prominent (Figure 7). Although these facilities demonstrate a certain level of accessibility in core areas (see Section 3.2), their service capacity falls far short of meeting the actual demand intensity, reflecting the quantitative lag in market supply. A few popular categories (e.g., comprehensive gyms, yoga studios) exhibit a slight oversupply in a small number of subdistricts (e.g., Laoshan Subdistrict), but the overall supply still remains in a tight balance of insufficient supply (Figure 8), indicating that the current market-oriented supply has not yet formed effective redundancy.
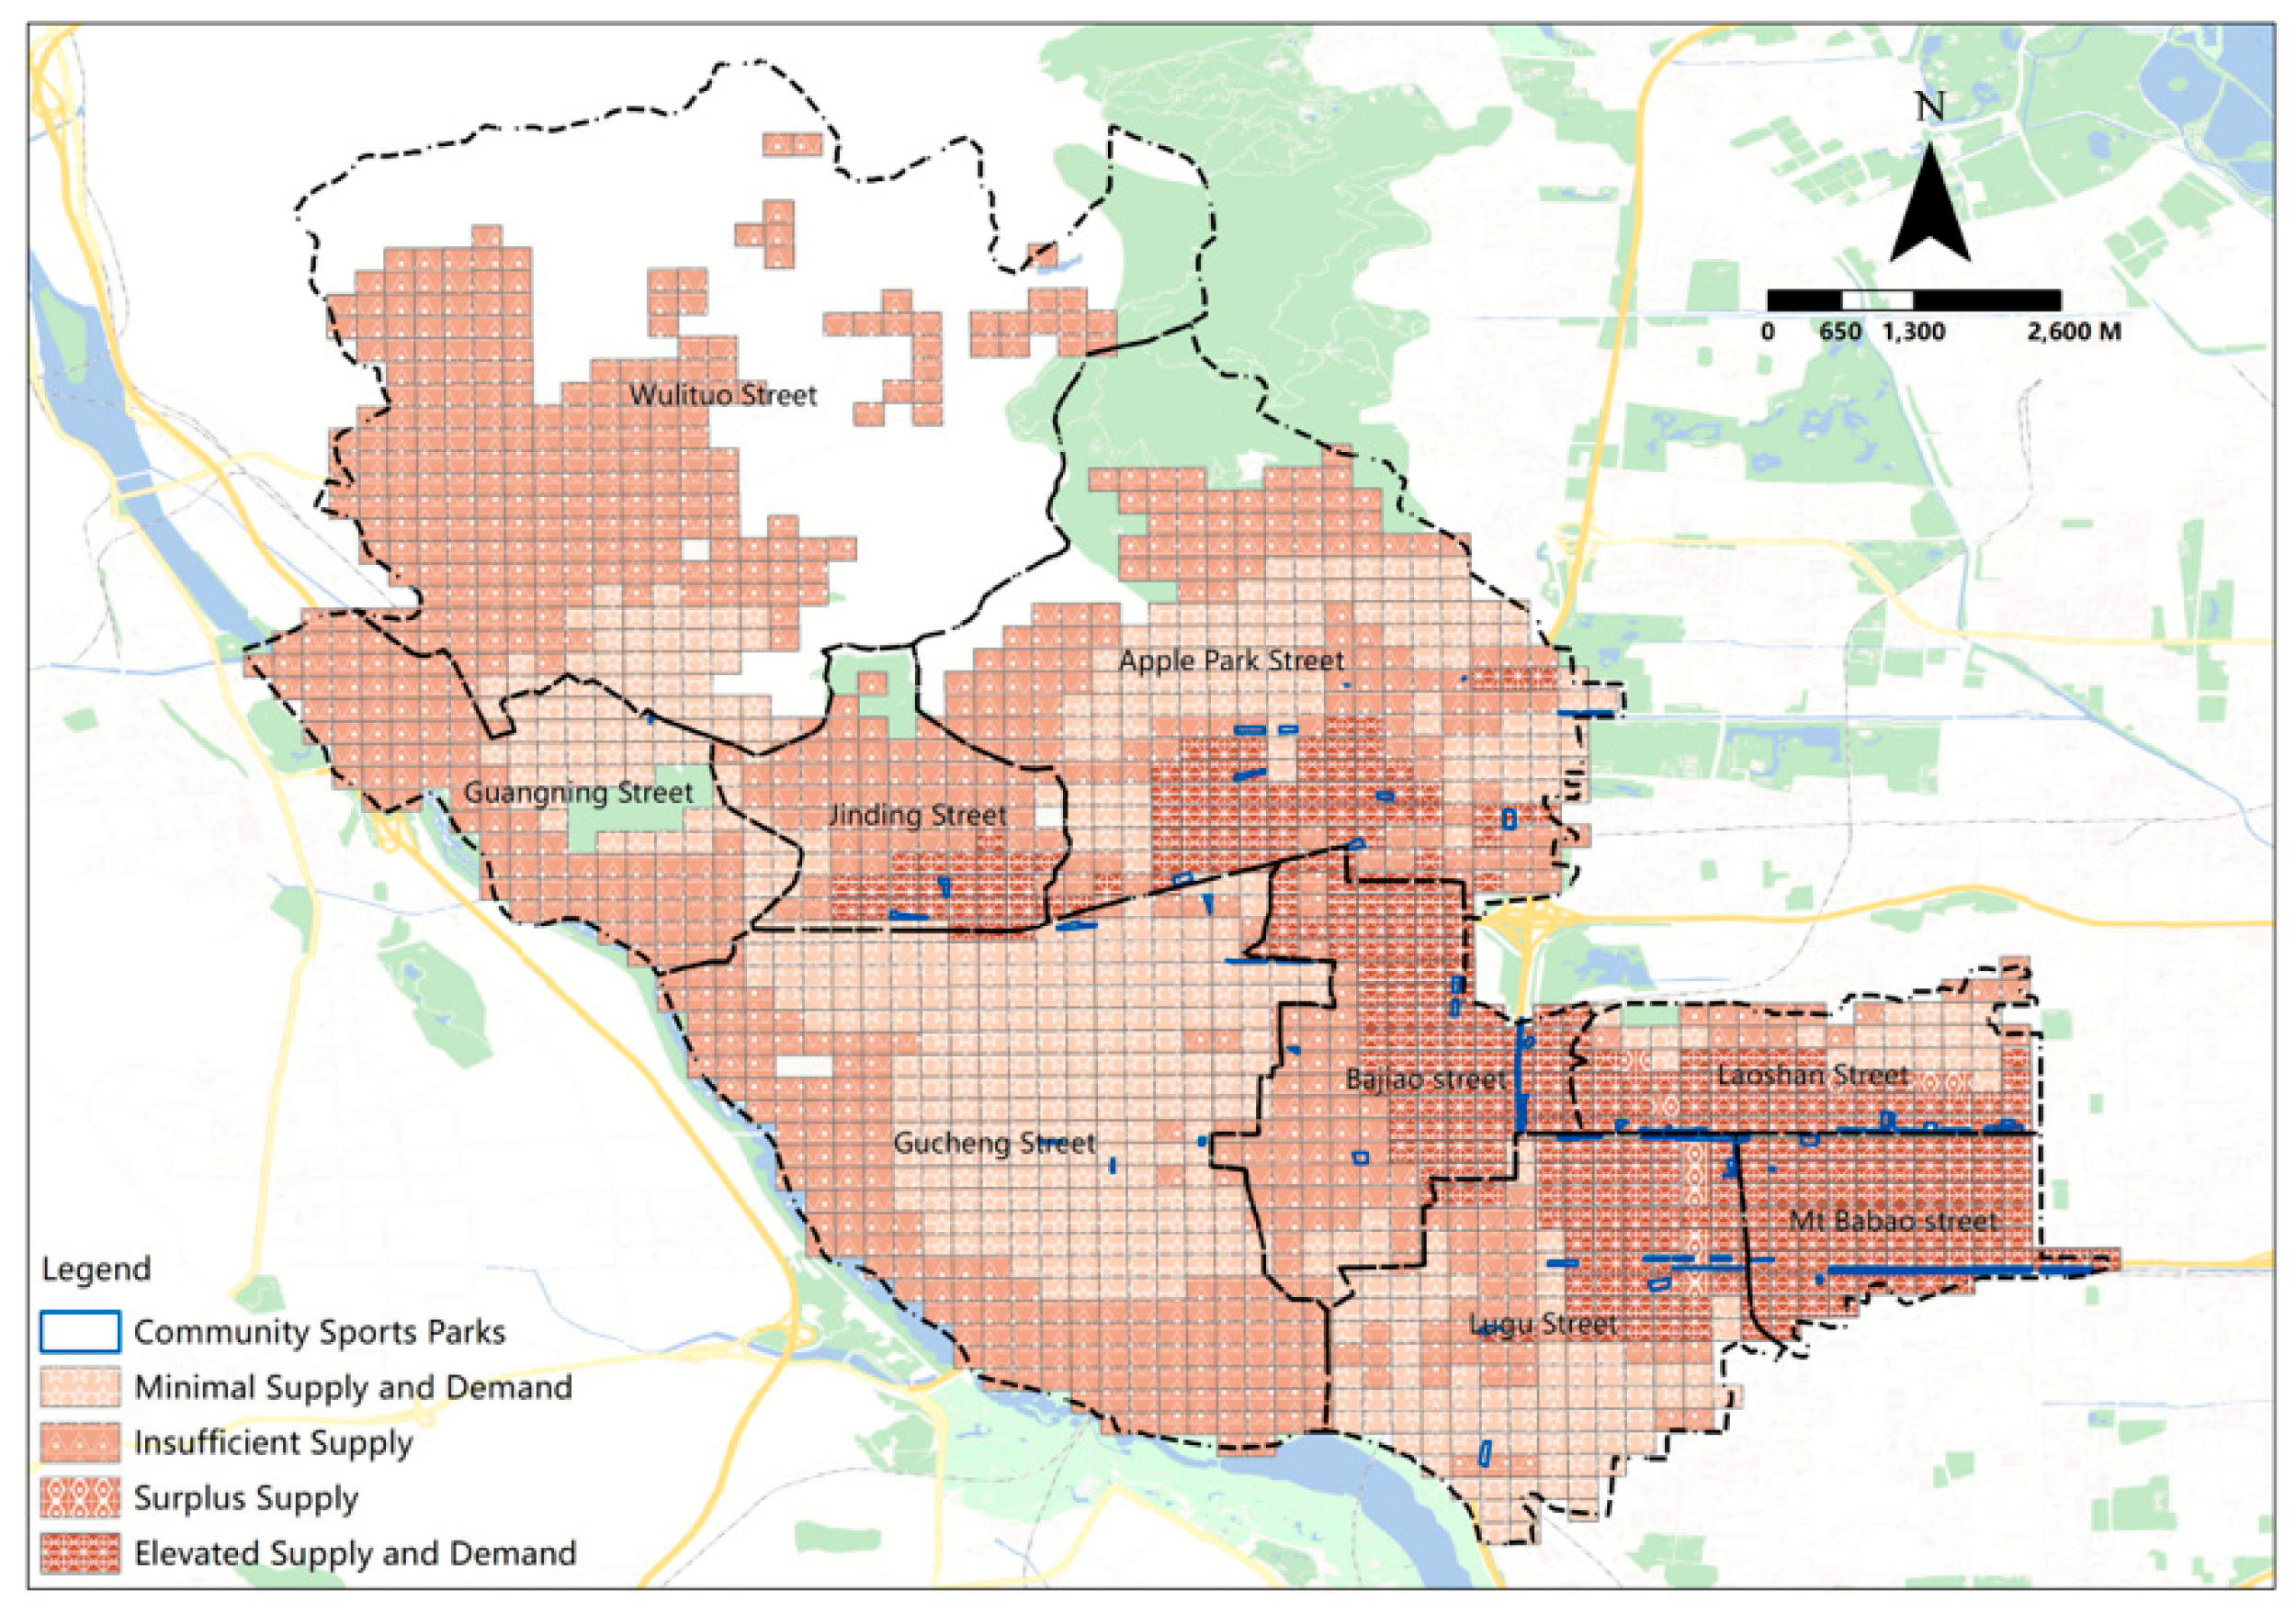
The supply–demand status of community sports parks varies across subdistricts (Figure 9). Approximately 46.59% (Table 7) of the district’s areas are in a state of insufficient supply (Z < 0), which are mainly concentrated in peripheral urban subdistricts such as Wulituo and Guangning; in contrast, subdistricts including Pingguoyuan, Gucheng, and Bajiao have basically achieved supply–demand balance. These subdistricts with insufficient supply were identified in Section 3.2 as areas with relatively low accessibility to community sports parks, which indicates the spatial consistency of their supply–demand contradictions. Meanwhile, subdistricts like Pingguoyuan, Gucheng, Bajiao, and Laoshan are in a state of supply–demand balance, reflecting a relatively high match between facility allocation and population demand in these regions.
In summary, the spatial structural shortage of commercial facilities and the uneven peripheral coverage of public welfare facilities in Shijingshan District jointly constitute the root cause of residents’ difficulty in accessing fitness services. Future optimization efforts should move away from the conventional focus on merely expanding scale and shift toward dual-dimensional, precise allocation, integrating demand and spatial attributes. For instance, supplementing facilities such as swimming pools and tennis courts in areas with dense populations aged 18–50, and enhancing the age-friendly renovation of sports facilities in community parks located in aging subdistricts, will enable a governance transition from a focus on facility availability to demand-adaptive allocation.

4. Discussion

This study finds that the accessibility pattern of sports facilities in Shijingshan District is characterized by core agglomeration and peripheral scarcity, which is consistent with the general spatial pattern observed in megacities such as Shanghai [11,12]. This reflects that in the context of rapid urbanization in China, the allocation of public service resources has long been dominated by the “central agglomeration” development model. However, Xu et al. [9] pointed out that sports facilities in Beijing as a whole exhibit a “dispersed distribution” pattern. In contrast, this study reveals the existence of highly concentrated clusters of commercial facilities within Shijingshan District—this seemingly contradictory phenomenon precisely reflects the policy intervention effect at the intra-administrative division level. As an important host area for the Winter Olympic Games, Shijingshan District has secured substantial public investment and land quotas in the Shougang Park and its surrounding areas, which have driven the agglomeration of popular commercial facilities such as fitness centers. In contrast, high-cost specialized facilities (e.g., tennis courts) are constrained by high operational thresholds and narrow target audiences, thus only being able to form scattered point-like layouts relying on a limited number of high-quality land parcels. This indicates that even within the same city, the “core–periphery” structure is not homogeneous; instead, it is a spatial outcome shaped by the interplay of major event-driven investment, land finance logic, and market demand.
Through Z-score analysis, this study reveals that the supply–demand imbalance is particularly acute for specialized facilities such as badminton and tennis courts, which confirms the critical impact of facility type heterogeneity on supply–demand matching efficiency [16]. More importantly, by distinguishing between commercial and public welfare facilities, we identified two distinctly different mechanisms underlying supply–demand mismatches. The mismatch of commercial facilities stems from the logic of market selection—operators tend to locate their venues in areas with high consumption capacity and population density, leaving peripheral communities trapped in a dilemma of “high demand but zero supply”. In contrast, the mismatch of public welfare facilities is rooted in planning implementation deviations—despite policies emphasizing a balanced layout, actual project delivery is often constrained by factors such as land availability and inter-departmental coordination efficiency, resulting in a situation of “having planning documents but lacking actual coverage”. This finding not only echoes Li and Wang’s [22,23] emphasis on micro-level supply–demand mismatches but also reveals a key insight: without differentiating facility attributes, the generalized approach of “increasing supply volume” may exacerbate inequity. For example, indiscriminate construction of new commercial gyms in peripheral areas would result in resource wastage; whereas supplementing multi-functional public welfare venues in core areas could deliver greater inclusive value. Therefore, classified governance should serve as a pivotal shift for the “15 min fitness circle” initiative to move beyond “quantity compliance” toward “quality-oriented equity”.
By integrating objective accessibility metrics with residents’ subjective perceptions, this study identifies age as a key variable influencing equity experiences, while gender-based differences are found to be insignificant. This result carries profound social implications. Due to limited mobility and low willingness to pay, elderly residents are highly dependent on walking-accessible public welfare facilities, meaning their sense of equity directly reflects the inclusiveness of spatial layout. The achievement of gender equity, on the other hand, may be attributed to the popularization of gender-neutral public spaces such as square dance venues and fitness trails in recent years, which have lowered the participation barriers for women. In comparison, although the supply–demand framework proposed by Shuna Xu et al. [18] is systematic, it fails to incorporate users’ subjective experiences. By introducing subjective perception surveys, this study essentially advances the evaluation of facility equity from merely assessing geographic proximity to evaluating the perceived adequacy of service. This aligns with the concept of recognition justice emphasized by Fainstein [34], which holds that urban planning should not only allocate resources but also recognize and respond to the diverse lifestyles and bodily rights of different social groups. It should be noted that the sample of this study is dominated by permanent residents; future research needs to strengthen perceptual surveys targeting marginalized groups such as migrant populations and people with disabilities to avoid the emergence of an “equity illusion”.
In summary, through a three-dimensional analytical framework of classification–quantification–perception, this study demonstrates that the equity of community sports facilities is not a one-dimensional “distance issue” but a complex system shaped by the interplay of spatial structure, facility attributes, and group-specific demands. Future construction of the “15 min fitness circle” urgently needs to move beyond crude indicators such as “per capita facility quantity” and “walking coverage rate”, and shift toward establishing a refined governance system characterized by type adaptation, group responsiveness, and dynamic calibration. This will more effectively support the goal of health equity, featuring universal accessibility, age-friendliness, and all-time availability in high-density cities.

5. Conclusions and Recommendations

5.1. Research Conclusions

Taking the Shijingshan District of Beijing as a case study, this research evaluated the equity of community-level commercial sports and fitness facilities and community sports parks using GIS technology, the 2SFCA model, Z-score standard deviation analysis, and questionnaire survey methods. The research conclusions are as follows:
Accessibility exhibits significant spatial heterogeneity. Among commercial facilities, high-accessibility areas for popular facilities such as fitness centers and yoga studios are concentrated in densely populated subdistricts, including Pingguoyuan, Bajiao, and Lugu, while high-accessibility areas for specialized facilities like swimming pools, tennis courts, and taekwondo studios are distributed in discrete points. The accessibility of community sports parks presents a pattern of “higher in the south than in the north and higher in the east than in the west,” with high coverage in the core area and insufficient coverage in peripheral subdistricts such as Wulituo and Guangning.
Supply–demand matching is generally characterized by supply shortages. Overall, it shows the feature of “coordinated supply and demand in the core area and imbalanced supply and demand in the peripheral areas.” Among commercial facilities, more than 70% of the eight types of specialized facilities (e.g., swimming pools, badminton courts, and tennis courts) are in short supply, while three types of popular facilities (e.g., fitness centers, yoga studios) achieve a relative supply–demand balance. Insufficient supply affects 46.59% of the area, primarily in peripheral subdistricts, whereas balanced supply–demand areas constitute only 21.18%. This pattern closely aligns with population distribution.
Group equity shows differentiated performance. Age groups present a state of relative fairness: residents aged over 50 report the highest overall satisfaction, whereas those under 18 experience the greatest shortfall in facility diversity. Gender groups achieve a high level of fairness, with only a potential trend of difference in the dimension of facility type richness, and the supply–demand structure has a high degree of matching with gender preferences.
The innovations of this study are reflected in two aspects: on the one hand, it lies in the refinement of research objects—focusing on community-level facilities and dividing them into two major categories (commercial and public welfare) and 11 subcategories, so as to analyze the impact of type-specific differences on equity; on the other hand, it is embodied in the focused evaluation perspective—taking “spatial heterogeneity” as the core to reveal the regional disparities in accessibility and supply–demand characteristics, thereby providing data support for precise optimization.

5.2. Optimization Recommendations

Based on a comprehensive assessment of the general characteristics of accessibility and supply–demand coupling of urban community sports and fitness facilities, the following optimization paths and strategies are proposed to improve facility service efficiency, optimize resource allocation efficiency, and consolidate the foundation for constructing the national fitness service system.
First, increase the overall supply of commercial sports and fitness facilities in densely populated areas. To address the common issue of robust fitness demand yet significant gaps in commercial facility coverage in densely populated areas, efforts should be made to scientifically expand the supply scale of highly adaptive commercial sports and fitness facilities in accordance with residents’ demand preferences. On the premise of adhering to market-oriented layout logic and ensuring operational sustainability, the service coverage radius of facilities should be extended. Meanwhile, it is recommended to revitalize urban stock space resources, conduct comprehensive planning and functional reconstruction relying on idle buildings and underused land, integrate diversified fitness functions, and enhance space utilization efficiency and spatial accessibility of facilities.
Second, it is recommended to optimize the spatial layout structure of commercial sports and fitness facilities based on supply–demand differentiation. Combined with the spatial differentiation characteristics of supply–demand matching of urban community sports and fitness facilities, efforts should focus on the core goals of expanding service coverage dimensions and broadening the scope of group benefits, and prioritize resolving problems in areas with acute supply–demand imbalance. It is recommended to adhere to the governing principle of “addressing priorities by urgency”, focus on core commercial fitness formats such as fitness centers, proactively resolve the structural imbalance between insufficient supply and oversupply in some regions, and then gradually promote service quality upgrading in areas with booming supply and demand, as well as resource revitalization and reconstruction in areas with weak supply and demand, so as to achieve the dynamic balanced allocation of commercial fitness resources.
Third, it is recommended to establish a coordinated layout system for public welfare and commercial sports and fitness facilities. Based on the urban spatial differentiation characteristics that “public welfare fitness facilities have high adaptability in densely populated areas but insufficient supply in peripheral areas, while commercial sports and fitness facilities cluster in core areas and are sparsely distributed in peripheral areas”, resource integration and coordinated planning management of the two types of facilities should be strengthened. Pilot construction of composite fitness service complexes can be launched in urban peripheral areas, integrating the public welfare service attributes of community sports parks with the market-oriented operational advantages of commercial fitness facilities. Through functional complementarity and efficiency superimposition, the shortage of facility supply in peripheral areas can be alleviated, and the accessibility level and supply–demand coupling balance of fitness facilities across the region can be improved.
In summary, the above optimization paths and strategies are based on the core characteristics of accessibility and supply–demand coupling of urban community sports and fitness facilities, and make precise efforts from three dimensions: expanding total supply, optimizing spatial layout, and coordinating public welfare and commercial facilities. They not only target and resolve practical problems such as supply gaps in densely populated areas, structural imbalances in some regions, and format shortages in peripheral areas, but also realize the efficient integration of fitness resources across the region through innovative means such as revitalizing stock space, dynamic resource allocation, and functional composite pilots, providing theoretical support and a practical model for the high-quality construction of the “15 min fitness circle”.

5.3. Research Prospects

Future research can be expanded in three aspects: First, optimize data and sample design; incorporate more socioeconomic variables into the questionnaires, such as household income, educational attainment, and policy implementation intensity, to capture the multi-dimensional influencing factors of facility equity; and adopt a longitudinal tracking data framework with a 5-year cycle to realize dynamic monitoring of facility equity. Meanwhile, official authoritative data can be integrated to enhance the accuracy and representativeness of the research.
Second, improve evaluation methods and dimensions by constructing a four-dimensional evaluation system of “quantity–quality–accessibility–group perception” to fully cover the core connotation of facility equity. Moreover, spatial econometric models can be introduced to quantify the impact mechanisms of spatial factors on facility equity, forming a complementary verification framework.
Third, the research scope and perspectives can be expanded by conducting cross-regional comparative studies, selecting cities with different economic development levels and population scales to explore the universal laws and regional characteristics of community sports facility equity. Furthermore, efforts should focus on the needs of special groups, such as the elderly with limited mobility, adolescents with specialized training needs, and low-income groups with budget constraints, and targeted facility optimization strategies can be proposed. Moreover, integrated facility layout models should be explored, such as the integrated layout of “sports parks + commercial facilities + community service centers,” and the effectiveness of the integrated model in improving facility equity can be verified through empirical research. These expansions will provide more comprehensive theoretical support and practical references for enhancing community sports facility equity.

Author Contributions

Conceptualization, Methodology, Writing—Review and Editing, Funding Acquisition: Lei Wang; Investigation, Software, Data Curation, Writing—Original Draft, Visualization: Shan Wu; Data Collection, Data Analysis: Wenqi He; Supervision, Validation: Yutao Han; Supervision, Data Collection, Funding Acquisition: Bo Zhang. All authors reviewed the manuscript. All authors have read and agreed to the published version of the manuscript.

Funding

This research was funded by the National Natural Science Foundation of China, grant number 52578052.

Data Availability Statement

The datasets generated and analyzed during the current study are not publicly available due to their necessity for future research but are available from the corresponding author upon reasonable request.

Acknowledgments

The authors thank the Yuxiu Innovation Project of NCUT (Project No. 2024 NCUTYXCX115).

Conflicts of Interest

Author Shan Wu was presently employed by Beijing Hyrea Solidale Technology Co., Ltd. The remaining authors declare that the research was conducted in the absence of any commercial or financial relationships that could be construed as a potential conflict of interest.

Abbreviations

The following abbreviations are used in this manuscript:
2SFCAThe two-step floating catchment area

References

  1. Anderson, E.; Shivakumar, G. Effects of Exercise and Physical Activity on Anxiety. Front. Psychiatry 2013, 4, 27. [Google Scholar] [CrossRef] [Scilit] [PubMed]
  2. Global Status Report on Physical Activity 2022, 1st ed.; World Health Organization: Geneva, Switzerland, 2022; ISBN 978-92-4-005915-3.
  3. Zhang, L.; Dou, W.; Qin, B. Study on Spatial Allocation of Public Sports Facilities in Beijing at Residential Communities Scale. J. Geo-Inf. Sci. 2024, 26, 381–392. [Google Scholar] [CrossRef]
  4. Chen, Y.; Zhou, Q.; Qu, J.; Liu, X.; Hong, Y. Research on the Allocation Level of Urban Public Sports Facilities and its Relationship with Social Economy: A Case Study of Zhejiang Province. Mod. Urban Res. 2023, 2023, 24–32. [Google Scholar]
  5. Saraei, M.H.; Ghafarian, H.R.; Dasta, F. Analysis of Justice in Distribution of Sport Services in Spatial (Case Study: Isfahan City). J. Urban Soc. Geogr. 2021, 8, 129–151. [Google Scholar]
  6. Chen, Y.; Lin, N.; Wu, Y.; Ding, L. Spatial Equity in the Layout of Urban Public Sports Facilities in Hangzhou. PloS ONE 2021, 16, e0256174. [Google Scholar] [CrossRef] [Scilit]
  7. Hu, Y.; Ma, X. Accessibility and Sharing: An Empirical Study of the Impact of Opening School Sports Facilities on Public Sports Services in the Community—A Case Study of Suzhou Downtown. Shanghai Urban Plan. Rev. 2022, 2022, 32–39. [Google Scholar]
  8. Huang, W.; Deng, J.; Fei, W. Creating a ‘Full-Age Sharing’ Community: Analysing the Results of the Supply–Demand Matching of Sports Spaces for All Residents. Sustainability 2025, 17, 1370. [Google Scholar] [CrossRef] [Scilit]
  9. Xu, H.; Jiang, Y.; Fang, Y.; Huang, X. Spatial Distribution Haracteristics and Accessibility of Public Sports Facilities in Beijing. J. Arid. Land Resour. Environ. 2024, 38, 190–198. [Google Scholar] [CrossRef]
  10. Zhang, D.; Su, Y.; Li, M. Study on Evaluation Index Systems of Allocation Fairness of Mass Public Sport Resources in Urban and Rural Areas in China. China Sport Sci. 2014, 34, 18–33. [Google Scholar] [CrossRef]
  11. Wang, L.; Zhou, K. Performance Assessment of the Distribution of Community Sports Facility from the Perspective of Healthy Equity—A Case Study of the Central City of Shanghai. J. Hum. Settl. West China 2019, 34, 1–7. [Google Scholar] [CrossRef]
  12. Xu, Q.; Cao, K.; Gao, W.; Feng, W.; Wang, X. Spatial Balance of Urban Public Sports Facilities and Population Distribution: An Empirical Study Based on “15-Minute Community Fitness Circle” in Shanghai. J. Wuhan Sports Univ. 2023, 57, 22–29. [Google Scholar] [CrossRef]
  13. Higgs, G.; Langford, M.; Norman, P. Accessibility to Sport Facilities in Wales: A GIS-Based Analysis of Socio-Economic Variations in Provision. Geoforum 2015, 62, 105–120. [Google Scholar] [CrossRef] [Scilit]
  14. Jin, Y.; Yao, S.; Liu, D. GIS—Based Spatial Accessibility and Equity Evaluation of Urban Public Sports Facilities in Shanghai. J. Shanghai Univ. Sport 2017, 41, 42–47. [Google Scholar] [CrossRef]
  15. Iamtrakul, P.; Chayphong, S.; Gao, W. Assessing Spatial Disparities and Urban Facility Accessibility in Promoting Health and Well-Being. Transp. Res. Interdiscip. Perspect. 2024, 25, 101126. [Google Scholar] [CrossRef] [Scilit]
  16. Song, L.; Kong, X.; Cheng, P. Supply-Demand Matching Assessment of the Public Service Facilities in 15-Minute Community Life Circle Based on Residents’ Behaviors. Cities 2024, 144, 104637. [Google Scholar] [CrossRef] [Scilit]
  17. Zhou, C.; Wu, C. Optimizing the Supply-Demand Relationship and Governance Strategies of Urban Community Sports Facilities and Permanent Population: A Perspective Based on Supply-Demand Equilibrium Theory. Urban Dev. Stud. 2023, 30, 19–23. [Google Scholar]
  18. Xu, S.; Li, J.; Gao, X.; Zhao, H.; Hu, J.; Yuan, S. Framework for Analyzing the Relationship between Supply, Demand, and Flow of Recreational Services in Urban Park Green Spaces. Ecol. Indic. 2024, 166, 112403. [Google Scholar] [CrossRef] [Scilit]
  19. Chen, J.; You, W.; He, D.; Hu, X. Supply and Demand Relationship and Its Spatial Heterogeneity of Urban Parks in Downtown Area of Fuzhou. J. Zhejiang A&F Univ. 2023, 40, 1300–1310. [Google Scholar] [CrossRef]
  20. Zhu, X.; Lei, T.; Zhu, J.; He, W.; Huang, M. Community Sports Governance and Physical Activity Participation: Evidence on Mediation by Facilities and Moderation by Awareness. BMC Public Health 2025, 25, 3137. [Google Scholar] [CrossRef] [Scilit]
  21. Tian, F.; Zhou, J.; Liu, F. Construction of the National Fitness Public Service Satisfaction Model in China Based on American Customer Satisfaction Index. PLoS ONE 2025, 20, e0317551. [Google Scholar] [CrossRef] [Scilit]
  22. Li, Y. Research on Fairness Evaluation of Urban Park Layout Based on Supply and Demand Balance—A Case Study of Banan District of Chongqing. Master’s Thesis, Southwest University, Chongqing, China, 2018. [Google Scholar]
  23. Wang, M.; Zhu, A.; Wang, J.; Lu, T. Supply and Demand Analysis of Urban Park Distribution Based on Social Equity and Justice: A Case Study of Xuhui District, Shanghai. Acta Ecol. Sin. 2019, 39, 7035–7046. [Google Scholar] [CrossRef] [Scilit]
  24. Li, Z.; Xie, S.; Chen, W. The Influence of Environment on Adolescents’ Physical Exercise Behavior Based on Family Community and School Micro-Systems. Sci. Rep. 2025, 15, 12024. [Google Scholar] [CrossRef] [Scilit] [PubMed]
  25. Beijing Municipal Shijingshan District People’s Government Overview of Shijingshan District. Available online: https://www.bjsjs.gov.cn/sjsfc/qqgk/ (accessed on 1 December 2025).
  26. Beijing Municipal Bureau of Sports; Beijing Municipal Commission of Planning and Natural Resources. Beijing Specialized Plan for Sports Facilities (2018–2035); Beijing Municipal People’s Government: Beijing, China, 2020.
  27. Oh, K.; Jeong, S. Assessing the Spatial Distribution of Urban Parks Using GIS. Landsc. Urban Plan. 2007, 82, 25–32. [Google Scholar] [CrossRef] [Scilit]
  28. Wei, F.; Wang, X. Measuring Spatial Accessibility to Physical Activity Spaces in HangZhou Using 2SFCA Method. City Plan. Rev. 2019, 43, 112–119. [Google Scholar]
  29. Kataoka, Y. Analysis on Accessibility to Urban Facilities Using the Flexible Distance Attenuation Function. Jpn. Archit. Rev. 2020, 3, 375–383. [Google Scholar] [CrossRef] [Scilit]
  30. Zhang, J.; Cheng, Y.; Zhao, B. How to Accurately Identify the Underserved Areas of Peri-Urban Parks? An Integrated Accessibility Indicator. Ecol. Indic. 2021, 122, 107263. [Google Scholar] [CrossRef] [Scilit]
  31. Wang, S.; Wang, M.; Liu, Y. Access to Urban Parks: Comparing Spatial Accessibility Measures Using Three GIS-Based Approaches. Comput. Environ. Urban Syst. 2021, 90, 101713. [Google Scholar] [CrossRef] [Scilit]
  32. Zhang, R.; Peng, S.; Sun, F.; Deng, L.; Che, Y. Assessing the Social Equity of Urban Parks: An Improved Index Integrating Multiple Quality Dimensions and Service Accessibility. Cities 2022, 129, 103839. [Google Scholar] [CrossRef] [Scilit]
  33. Ouyang, L.; Wang, D.; Yin, Z.; Zhang, F.; Yang, A. Study on the Spatial-Temporal Features of Citizens’ Exercise Behavior in Shanghai and Urban Planning Responses. Mod. Urban Res. 2023, 10, 1–8, 26. [Google Scholar] [CrossRef]
  34. Fainstein, S.S. The Just City; Cornell University Press: Ithaca, NY, USA, 2010; ISBN 978-0-8014-7631-4. [Google Scholar]
Figure 1. Study area.
Ijgi 15 00094 g001
Figure 2. Spatial population distribution by subdistrict in Shijingshan District, Beijing.
Ijgi 15 00094 g002
Figure 3. Statistical chart of facility selection preferences. (a) Gender and facility selection preferences. (b) Age and facility selection preferences.
Ijgi 15 00094 g003
Figure 4. Comprehensive distribution map of accessibility of commercial sports and fitness facilities (concentrated distribution type) in Shijingshan District. (a) Spatial accessibility analysis of fitness centers. (b) Spatial accessibility analysis of yoga studios. (c) Spatial accessibility analysis of martial arts and combat facilities. (d) Spatial accessibility analysis of swimming facilities. (e) Spatial accessibility analysis of billiard facilities.
Ijgi 15 00094 g004
Figure 5. Comprehensive distribution map of accessibility of commercial sports and fitness facilities (dispersed distribution type) in Shijingshan District. (a) Spatial accessibility analysis of basketball facilities. (b) Spatial accessibility analysis of winter sports facilities. (c) Spatial accessibility analysis of Taekwondo facilities. (d) Spatial accessibility analysis of table tennis facilities. (e) Spatial accessibility analysis of tennis facilities. (f) Spatial accessibility analysis of badminton facilities.
Ijgi 15 00094 g005
Figure 6. Spatial accessibility analysis of community sports parks.
Ijgi 15 00094 g006
Figure 7. Comprehensive distribution map of the supply–demand relationship of commercial sports and fitness facilities (supply–demand balanced type) in Shijingshan District. (a) Supply–demand distribution analysis of swimming facilities. (b) Supply–demand distribution analysis of basketball facilities. (c) Supply–demand distribution analysis of billiard facilities. (d) Supply–demand distribution analysis of winter sports facilities. (e) Supply–demand distribution analysis of taekwondo facilities. (f) Supply–demand distribution analysis of table tennis facilities. (g) Supply–demand distribution analysis of tennis facilities. (h) Supply–demand distribution analysis of badminton facilities.
Ijgi 15 00094 g007
Figure 8. Comprehensive distribution map of the supply–demand relationship of commercial sports and fitness facilities (supply–demand balanced type) in Shijingshan District. (a) Supply–demand distribution analysis of fitness centers. (b) Supply–demand distribution analysis of yoga studios. (c) Supply–demand distribution analysis of martial arts and combat facilities.
Ijgi 15 00094 g008
Figure 9. Supply–demand distribution analysis of community sports parks.
Ijgi 15 00094 g009
Table 1. Data source.
Type of DataSourceUnitYear
PopulationWorldPop (https://www.worldpop.org/, accessed on 1 February 2024)Persons per grid cell (400 m2 per grid cell)2020
Administrative
boundaries
Resource and Environment Science and Data Center (http://www.resdc.cn/, accessed on 1 February 2024)/2023
Community sports and fitness facilitiesBeijing National Fitness Platform(http://js365.gjyc.org.cn/gymFacility/eventVenue, accessed on 1 February 2024)
map (https://www.amap.com/, accessed on 1 February 2024)
Meituan (https://www.meituan.com, accessed on 1 February 2024)
Dianping (https://www.dianping.com, accessed on 1 February 2024)
Units2022
Geospatial maps of theGoogle Earth images (https://earth.google.com, accessed on 1 February 2024)/2023
demand for fitness facilitiesSurvey questionnairesCopies2023
Table 2. Questionnaire structure and core item design.
ModuleItemsItem Type
Demographic CharacteristicsGender, ageSingle Choice
Facility Usage BehaviorsFrequency of physical exercise, commonly used fitness facility types, travel mode, and time to reach facilitiesSingle Choice/Multiple Choice
Satisfaction EvaluationSatisfaction with venue area, satisfaction with accessibility, and satisfaction with the richness of facility types5-point Likert Scale
Demand PreferencesImprovement directions for fitness facilities, acceptable fitness consumption range, and venue selection requirementsSingle Choice/Multiple Choice
Open-Ended SuggestionsOther opinions and suggestions on urban sports and fitness facilitiesOpen-Ended Questions
Table 3. Satisfaction with community sports and fitness facilities among different groups in Shijingshan District.
GroupingCategory Sample Size (n)Venue Area (S1)Accessibility (S2)Type Richness (S3)Comprehensive SatisfactionSD
Age GroupUnder 18423.423.513.283.400.58
18–501563.583.653.413.550.46
Over 501234.014.133.763.970.39
Gender GroupMale1683.583.633.403.543.54
Female1533.713.763.683.723.72
Overall Average3213.653.703.503.620.49
Table 4. One-way ANOVA results table.
Satisfaction DimensionSum of Squares (SS)dfMean Square (MS)F-Valuep-ValueSignificance
Satisfaction with Venue Area (S1)8.63224.3166.9150.0015Highly Significant Difference (0.001 ≤ p < 0.01)
Satisfaction with Accessibility (S2)9.21524.6077.2580.0011Highly Significant Difference (0.001 ≤ p < 0.01)
Satisfaction with the Richness of Facility Types (S3)6.84323.4215.3820.006Highly Significant Difference (0.001 ≤ p < 0.01)
Comprehensive Satisfaction11.25825.6298.7230.0003Extremely Significant Difference (p < 0.001)
Note: p < 0.001 indicates an extremely significant difference; 0.001 ≤ p < 0.01 indicates a highly significant difference; 0.01 ≤ p < 0.05 indicates a significant difference; and p ≥ 0.05 indicates no significant difference.
Table 5. Post hoc multiple comparisons results table.
Satisfaction DimensionComparison Groups Mean Diff. (A-B)Std. Errorp-ValueDifference Judgment
Satisfaction with Venue AreaUnder 18 vs. 18–50−0.160.1020.482Not Significant
Under 18 vs. Over 50−0.590.1150.005Significant
18–50 vs. Over 50−0.430.0860.003Significant
Satisfaction with AccessibilityUnder 18 vs. 18–50−0.140.0980.513Not Significant
Under 18 vs. Over 50−0.620.1120.004Significant
18–50 vs. Over 50−0.480.0830.002Significant
Satisfaction with the Richness of Facility TypesUnder 18 vs. 18–50−0.130.1050.576Not Significant
Under 18 vs. Over 50−0.480.1180.012Significant
18–50 vs. Over 50−0.350.0890.052Not Significant
Comprehensive SatisfactionUnder 18 vs. 18–50−0.150.1010.486Not Significant
Under 18 vs. Over 50−0.570.1140.002Significant
18–50 vs. Over 50−0.420.0850.001Significant
Note: 1. p < 0.001 indicates an extremely significant difference; 0.001 ≤ p < 0.01 indicates a highly significant difference; 0.01 ≤ p < 0.05 indicates a significant difference; and p ≥ 0.05 indicates no significant difference. 2. For comparison groups (A-B), Group A refers to the former group and Group B refers to the latter group. A negative value of mean difference (A-B) indicates that the mean satisfaction score of Group A is lower than that of Group B, while a positive value indicates that Group A is higher than Group B. Combined with cross-validation using supply–demand data, the current supply of community sports facilities is more compatible with the usage needs of the over-50 group, while the needs of the under-18 and 18–50 groups are not fully satisfied. Nevertheless, no severe imbalance in resource allocation occurred overall; thus, the age-based equity of community sports facility satisfaction in Shijingshan District is determined to be relatively equitable.
Table 6. Statistical test results of satisfaction dimensions across gender groups.
Satisfaction Dimensiont-Valuedfp-ValueMean Diff. (Female-Male)95% CISignificance
Satisfaction with Venue Area (S1)0.9823190.3290.13[−0.08, 0.34]Not Significant
Satisfaction with Accessibility (S2)1.0533190.2950.13[−0.07, 0.33]Not Significant
Satisfaction with the Richness of Facility Types (S3)1.9873190.0510.28[−0.01, 0.57]Not Significant
Comprehensive Satisfaction1.4253190.1580.18[−0.06, 0.42]Not Significant
Note: The test level was set at α = 0.05; p < 0.05 indicates a significant difference, and p ≥ 0.05 indicates no significant difference; the term “marginally significant difference” refers to a p-value slightly higher than the critical value of 0.05, which does not meet the statistical significance criterion but suggests an underlying differential trend.
Table 7. Community sports facilities supply–demand summary table.
Classification LevelMajor CategorySubcategoryElevated Supply–DemandSurplus SupplyInsufficient SupplyMinimal Supply–Demand
Community sports and fitness facilitiesCommercial sports and fitness facilitiesFitness centers,19.25%1.81%43.93%35.00%
yoga studios,17.02%2.66%57.69%22.63%
martial arts and combat venues,17.68%1.27%60.05%21.00%
swimming pools,11.71%1.63%75.14%11.53%
basketball courts,8.99%4.35%76.16%10.50%
billiard halls,11.83%4.41%70.01%13.76%
ice and snow sports venues,6.40%4.10%77.73%11.77%
taekwondo venues,9.29%0.18%84.55%5.97%
table tennis venues,8.21%1.63%81.23%8.93%
tennis courts,4.83%1.81%81.71%11.65%
badminton courts, and6.10%2.66%85.46%5.79%
community sports parks21.18%0.66%46.59%31.56%
Disclaimer/Publisher’s Note: The statements, opinions and data contained in all publications are solely those of the individual author(s) and contributor(s) and not of MDPI and/or the editor(s). MDPI and/or the editor(s) disclaim responsibility for any injury to people or property resulting from any ideas, methods, instructions or products referred to in the content.