Abstract
Risk zone delineation and mobility behavior control constitute critical measures in pandemic containment. Numerous studies utilize static demographic data or dynamic mobility data to calculate the high–risk zones present in cities; however, these studies fail to concurrently consider activity and mobility patterns of populations in both space and time, which results in many studies only being able to employ static geostatistical analytical methods, neglecting the transmission risks associated with human mobility. This study utilized the mobile phone signaling data of Shenzhen residents from 2019 to 2020 and developed a CP tensor decomposition algorithm to decompose the long-sequence spatiotemporal trajectory data to detect high risk zones in terms of detecting overlapped community structures. Tensor decomposition algorithms revealed community structures in 2020 and the overlapping regions among these communities. Based on the overlap in spatial distribution and the similarity in temporal rhythms of these communities, we identified regions with spatiotemporal co-location as high–risk zones. Furthermore, we calculated the degree of population mixing in these areas to indicate the level of risk. These areas could potentially lead to rapid virus spread across communities. The research findings address the shortcomings of currently used static geographic statistical methods in delineating risk zones, and emphasize the critical importance of integrating spatial and temporal dimensions within behavioral big data analytics. Future research should consider utilizing non-aggregated individual trajectories to construct tensors, enabling the inclusion of individual and environmental attributes.
1. Introduction
The transmission of epidemics is intrinsically linked to the patterns of human movement and social contact [1,2,3,4]. During large-scale pandemic outbreaks, establishing risk zones with mobility restrictions is a common and essential measure for controlling viral transmission [5]. The delineation of risk zones is a critical task that directly shapes the efficacy of public policy and its ultimate societal cost. An ideal delineation would precisely interrupt key transmission pathways with minimal disruption to economic and social life. Conversely, overly broad delineations inflict severe socioeconomic harm—stifling economic activity, disrupting supply chains, and causing business failures—while the resulting social isolation erodes public well-being [6]. In contrast, overly conservative delineations risk fostering a false sense of security, allowing covert transmission to spread, which may necessitate even stricter and more extensive lockdowns. Such failures often stem from a fundamental mismatch: viral transmission follows dynamic human mobility networks, not static administrative boundaries. Therefore, a pressing challenge in modern urban epidemic management is to move beyond these traditional borders and identify true risk zones with greater scientific precision and dynamism [7,8].
Despite the urgency of risk delineation, existing methods have notable shortcomings. Traditional geostatistical approaches, which factor in spatial attributes [9,10,11], are limited by assumptions of spatial homogeneity and perform poorly with sparse case data, as they neglect the dynamic human interactions driving transmission [12]. Methods using individual trajectories, while theoretically superior, struggle in practice; high population aggregation in dense urban areas can obscure true risk zones [13,14], and a focus on confirmed cases is merely reactive, not preventive [15].
Fundamentally, most current methods fail by analyzing geographic units in isolation and ignoring their connectivity. Viral transmission is governed by network effects [16,17], spreading along human mobility patterns that cross community lines [18]. Conventional statistical models cannot capture these complex network structures or identify the critical “bridge” regions essential for controlling widespread transmission.
To tackle the identified challenges, we developed an innovative risk zone assessment method that employs the network-based CP (CANDECOMP/PARAFAC) tensor decomposition algorithm. This technique capitalizes on spatiotemporal co-location clustering of individual trajectory data to map out individuals’ activity spaces and their face-to-face encounters with precision. It surpasses the constraints of traditional spatial boundaries, offering a dynamic view of risk zones. Central to our approach is the identification of high–risk zones as areas of spatiotemporal convergence, where the potential for virus transmission is heightened due to the co-location of different individuals [12]. This study involves analyzing trajectory data from 1.2 million individuals over ten months from 2019 to 2020 in the city of Shenzhen, China. The use of extensive long-term data is essential for minimizing the impact of short-term mobility fluctuations on spatiotemporal clustering accuracy [19]. This methodological rigor ensures that our risk zone assessments are both accurate and reliable, providing a robust foundation for public health interventions.
This article contributes threefold to the field of disease risk assessment. First, it employs an integrated approach to analyze multidimensional data, including spatial and temporal dimensions, revealing community structures that account for both spatial positions and temporal activity variations. This method identifies risk zones based on spatiotemporal interactions among residents, aligning with epidemiological principles that stress the importance of concurrent spatial and temporal contacts. Second, the study’s method allows for the detection of overlapping activity spaces across communities, defining a hierarchical community network structure. Intersections of these networks are recognized as high–risk zones for intergroup transmission, guiding the development of targeted public health policies, such as differentiated travel restrictions. Third, we emphasize the importance of long-term trajectory data over short-term, random snapshots. Long-term data provides a systematic view of individuals’ activity spaces, crucial for understanding their regular interactions and potential disease transmission, enhancing the accuracy of risk zone identification.
2. Literature Review
2.1. Spatiotemporal Pattern Mining of Mobility Trajectory Data for Risk Zone Detection
Researchers have developed various spatiotemporal pattern mining techniques to identify high–risk areas for viral transmission using individual mobility trajectory data. One primary approach employs space–time prisms from time geography for spatiotemporal statistical analysis and visualization of individual movement paths [20,21]. This technique reveals the spatial and temporal dynamics of infected individuals, facilitating the identification of their activity spaces as potential risk zones. GIS-enhanced visualization of confirmed cases’ trajectories has played a crucial role in assessing urban disease exposure risks, serving both individual risk alerts [15] and broader urban-scale risk zoning [22]. Loo analyzed individual mobility trajectory data, delineating personal daily activity spaces using standard deviational ellipses [23]. By examining the overlap frequency between these spaces and various public venues and facilities in Hong Kong, researchers identified high–risk facilities such as cinemas and bars, which were prone to COVID-19 superspreading events. Their focus on identifying direct interpersonal contact locations is particularly commendable.
However, this GIS spatial statistical analysis approach faces significant challenges in effectiveness due to the massive volume and frequent overlap of individual trajectory datasets, often resulting in readability issues. Moreover, methods purely based on statistics and visualization oversimplify the understanding of risk zones, lacking the capability for quantitative analysis of complex interactions between individual trajectories. This limitation underscores the need for more sophisticated analytical frameworks to dissect the complex structure of human mobility for deriving actionable risk mitigation insights.
In urban risk delineation research, community detection has emerged as a pivotal methodological approach. Its fundamental principle involves analyzing large-scale individual spatiotemporal trajectory data to identify dense clusters of individuals exhibiting highly similar behavioral patterns and frequent spatial interactions, which are subsequently defined as “communities.” Given the robust internal connectivity among members, these communities naturally constitute potential high–risk cohorts during epidemic outbreaks, and can therefore serve as effective proxies for risk zone identification.
The primary methodology employs network-based clustering techniques. Established research demonstrates that when individuals are co-located within identical spatiotemporal nodes, they likely share social connections [24,25]. Researchers initially represent individual trajectories or geographic units as network nodes and quantify their mobility or co-occurrence relationships as weighted edges, thereby constructing complex urban mobility networks. Subsequently, network clustering algorithms—including K-means, DBSCAN, or the Louvain method—are applied to identify densely connected community structures within these networks [26]. This process reveals underlying clustering patterns within trajectory datasets, such as mobile phone signaling or location-based check-in data [27,28]. The identified communities can represent specific functional areas, including urban attraction zones [29]. Since this approach is specifically designed to identify cohorts formed by closely connected individuals, it proves particularly suitable for detecting high–risk zones populated by individuals with similar behavioral profiles [30].
Moreover, analyzing inter-nodal connections reveals hierarchical structures within risk zones. For instance, Gan constructed a mobility network from residents’ mobile signaling data in Shanghai during the pandemic [31]. Employing k-means clustering, he identified community structures and designated high-degree nodes as high–risk zones. He further classified these critical nodes into intra-group and inter-group transmission hubs based on closeness centrality metrics, thereby identifying pivotal nodes capable of facilitating widespread transmission.
However, the temporal dynamics constitute a critical aspect of risk assessment. Consequently, numerous studies have examined the evolution of community structures over time [32,33,34]. Research reveals that urban community structures remain relatively stable over extended periods, primarily influenced by macroscopic factors such as transportation infrastructure. Conversely, community structures undergo dramatic changes in the short term, particularly when confronted with external shocks such as epidemics. Cheng found that pandemic control measures induced significant fragmentation and localization of urban communities—whereby large existing communities split into numerous smaller, localized clusters [35]. This finding underscores the necessity of employing longitudinal trajectory data capable of capturing dynamic changes in risk zone delineation.
Despite providing valuable insights, the aforementioned network-based approaches encounter two fundamental limitations when processing large-scale, high-dimensional urban mobility data. First, the effectiveness of traditional clustering algorithms is highly dependent on predefined parameters (such as the cluster number K in K-means), introducing subjectivity while undermining the method’s generalizability across different scenarios. Second, and more fundamentally, spatiotemporal data possess inherent high-dimensionality (e.g., origin, destination, time) [36]. To simplify analysis, traditional network methods often require “flattening” high-dimensional data into two-dimensional graph structures, or only concentrated on short-term dynamics, using brief intervals like days or weeks, inevitably resulting in information loss [37,38,39]. Attempting to forcibly preserve multidimensional information leads to excessive model and computational complexity, rendering large-scale, long-term time series data processing intractable.
2.2. Spatiotemporal Locale Detection by Tensor Decomposition Approach
Tensor decomposition represents a crucial pattern mining technique, particularly prevalent in urban studies due to its practicality in handling complex geospatial data [40]. This methodology enables simultaneous pattern mining across multiple dimensions while accounting for inter-dimensional data correlations, decomposing high-dimensional tensor data into lower-dimensional matrices or vectors [41]. The method’s strength lies in its minimal reliance on parameter settings, as the algorithm independently accomplishes the decomposition task, maximizing the revelation of inherent data patterns.
In practice, studies employing tensor decomposition typically construct individual mobility data by creating separate tensors for origin and destination coordinates and timestamps. These tensors are then decomposed to analyze spatial and temporal distribution patterns of trajectory origins (O) and destinations (D) [42,43,44]. Its capability to simultaneously explore temporal and spatial distribution patterns is crucial for maintaining interpretability across dimensions in urban analysis [45]. Treating longitude and latitude as a single dimension would compromise the comprehensiveness of spatiotemporal analysis, underscoring the importance of preserving the multi-dimensional integrity of urban mobility data. In the context of urban data research, the CP decomposition’s sub-tensors can encapsulate distinct activity pattern components such as commuting, work, and entertainment [46]. By transforming high-order tensor data into a multi-dimensional network, this method enables precise detection of groups and complex spatiotemporal network structures, effectively converting pattern mining into a tensor decomposition task. Each decomposed component represents a cluster of individuals exhibiting unique spatiotemporal behavior patterns with high fidelity [47].
Notably, the CP decomposition is adept at uncovering overlapping community structures within spatiotemporal networks, a capability that is central to this study’s objective [48]. In this framework, since the factor values for each network node can vary, nodes may simultaneously belong to multiple communities. This is critically important because the overlapping community structure itself is a well-documented feature of complex networks that acts as a conduit for interactions between otherwise distinct groups [49,50]. Research has shown that these overlapping segments are often more densely connected and cohesive, making them pivotal in transferring information or substances between communities [51]. In the context of epidemiology, this structural property has profound implications: network science studies have established that overlapping nodes can significantly expedite the spread of viruses by creating efficient transmission paths between communities [52,53]. Therefore, by leveraging the unique strength of CP decomposition to identify these high-interaction, overlapping areas, our study treats them as the primary spatial nodes instrumental in the inter-community spread of diseases.
Despite its potential, the application of tensor decomposition in examining spatiotemporal clustering during pandemics is still nascent. Balasubramaniam used the stochastic epidemiological model (SEM) to track COVID-19 trends, applying non-negative tensor decomposition to cluster countries based on pandemic parameters, thereby enhancing SEM’s interpretability [54]. Similarly, Balasubramaniam analyzed early COVID-19 Twitter data in Australia, using tensor decomposition to trace public awareness’s temporal and spatial spread through a tensor of time, geography, and content themes [55]. While these studies did not directly analyze individual mobility data with tensor decomposition during the pandemic, they illustrated the method’s ability to synthesize multi-dimensional data, highlighting its promise for pandemic research. Building on these examples, this study will apply tensor decomposition to a comprehensive dataset of individual mobility trajectories. The goal is to discern spatiotemporal patterns that could signify high–risk zones, leveraging tensor decomposition’s strength in integrating and revealing interactions across different data dimensions.
3. Research Area and Data
This study zeroes in on Shenzhen, a pivotal metropolis in Guangdong Province, China, distinguished by its dense population and complex urban layout. With 17 million permanent residents packed into a compact 2050 km2 area, as per the seventh national census [56]. Figure 1 illustrates the administrative boundaries of Shenzhen (districts and sub-districts “Jiedao”) alongside the kernel density distribution of our study’s sample residences. Shenzhen’s topography, marked by natural mountain barriers, further segments the city into discrete clusters. Economic disparities are pronounced, with the southern districts showing heightened economic activity and employment concentration [15]. The city’s dynamic commuting flows, with substantial daily population shifts across districts and clusters, exacerbate its vulnerability to pandemic spread, especially via inter-community transmission. Shenzhen’s intricate urban spatial structure, coupled with its high population density and economic variance, renders it an exemplary case for high–risk zone analysis.

Figure 1.
Spatial kernel density of research participants’ residential distribution.
This study examines the delineation of risk zones in Shenzhen during distinct phases of the COVID-19 pandemic. Figure 2 illustrates the temporal variations in confirmed cases, travel distances of Shenzhen residents, and government mobility restriction policies. The initial phase, from 23 January to 17 February 2020, coincided with the peak outbreak period. The Shenzhen government responded with a first-level response (FLR), imposing city-wide travel restrictions, halting mass gatherings, and shuttering indoor entertainment venues. Concurrently, closed-off management of residential communities (COM) was enforced to curb transmission in densely populated areas. The second phase, post-17 February 2020, saw the easing of FLR measures with the introduction of a return-to-work policy (RTW). This period marked a shift towards a risk zoning approach based on neighborhood-level administrative districts or Jiedao, with varying degrees of mobility restrictions. High–risk zones, identified by consistent case reports, enforced travel limitations and home isolation. Medium-risk zones, containing high–risk Jiedao, restricted public facility access and intercity travel. The third phase, starting in May 2021, faced a resurgence with increased virus infectivity. The city refined its risk zone policy, narrowing the focus to residential communities with confirmed cases as high–risk zones, mandating home isolation. The associated Jiedao were classified as medium-risk, limiting public facility access and public transport use, while other regions remained unrestricted. Throughout these phases, the risk zone delineation in Shenzhen evolved from broad city-wide measures to more targeted, community-specific strategies, reflecting the city’s adaptive approach to managing pandemic risks while balancing public health with economic considerations.
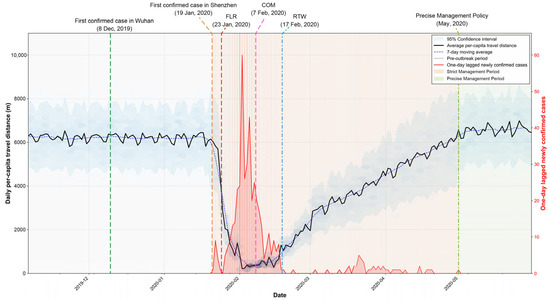
Figure 2.
Changes in average daily travel distance and number of confirmed cases over time. Differently colored timelines represent periods under different mobility restriction policies: FLR (first-level response), COM (closed-off management), and RTW (return-to-work).
In this research, we utilized anonymized mobile phone signaling data sourced from China Unicom. Table 1 presents the raw mobility data, where the ID is the user ID, Stime is the start moment of one time of travel. In contrast, Etime is the end moment of the time of travel. One travel is defined as the movement between two residencies by China Unicom. For definition of residency, it is formed by staying of users in the same location for more than 30 min. The data we utilized has undergone preliminary processing by China Unicom. User locations are recorded when mobile devices exchange data with base stations. Additionally, base stations actively send location requests to devices every 20 min, ensuring high-frequency positioning information acquisition under good communication conditions to guarantee data accuracy.

Table 1.
Monthly travel records of residents obtained through China Unicom.
Although the mobility data has been processed, erroneous records still exist. We used the Hive SQL module on the DaaS platform provided by China Unicom to remove error data. First, we excluded ping-pong errors involving rapid movement across large areas within short time periods. Second, according to the probability distribution curve of moving speed, we used 60 km/h as the threshold to exclude records with excessive moving speed. Third, we excluded movements with zero distance or speed. Finally, we checked the origin and destination of each record, merging and adjusting those with disconnected OD pairs. These processing methods have also been applied in other studies [57,58].
Following the meticulous elimination of erroneous records attributable, we successfully compiled a pristine dataset encompassing over 500 million travel records, spanning from 1 January to 31 May in both 2019 and 2020, and representing the movements of 180 thousand individuals. This dataset provides a granular, daily account of individual movements, enabling a direct comparison of mobility patterns before and after the onset of the COVID-19 pandemic. The longitudinal nature of this data offers unprecedented insights into community structures and behavioral shifts during a crisis, highlighting the novel utility of individual-level big data in pandemic research.
The signaling data’s extensive volume, dimensionality, and temporal span significantly enhance the precision of risk zone detection, eclipsing the limitations of traditional survey methods. The data’s multi-dimensional nature ensures a more stable and accurate identification of at-risk communities, while its long-time series capability allows for flexible, responsive analysis tailored to the fluctuating realities of the pandemic. This adaptability is essential for dynamically redefining risk zones, aligning urban management strategies with the pandemic’s progression and offering a robust analytical framework for urban health and safety measures.
Although these data are typically anonymized for research purposes through removal of direct identifiers such as phone numbers, privacy risks are not entirely eliminated. Individual mobility trajectories possess high uniqueness, and through combinations of spatiotemporal points, theoretical possibilities for ‘re-identification’ remain--whereb specific individuals could be traced through correlation with other public or third-party data sources (such as social media check-ins or publicly available home/work addresses). This possibility poses significant potential threats to personal privacy.
To address these challenges, this study implemented stringent privacy protection measures. The analysis focused on highly aggregated population flow data rather than individual-level detailed trajectories. This aggregation occurs across both spatial dimensions (e.g., by community or traffic analysis zones) and temporal dimensions (e.g., by hour), fundamentally eliminating the possibility of individual re-identification and focusing analysis on collective patterns rather than personal behavior. All data processing and analysis are conducted within secure environments agreed upon with data providers, strictly adhering to relevant legal regulations and ethical guidelines to ensure a balance between scientific value and personal privacy protection.
4. CP Tensor Decomposition-Based Community Detection Algorithm
4.1. CP Tensor Decomposition
Identifying risk zones through trajectory big data in this study is a three-step process (Figure 3). The first step involves aggregating daily activity trajectories of individuals into a grid-based origin–destination (OD) matrix, which encapsulates the daily mobility patterns of Shenzhen’s residents. Specifically, the original trajectory data includes the travel number, start time, end time, longitude, and latitude of the start point and the end point of each segment. By aggregating the coordinate points of the start or end point into the corresponding geospatial analysis unit, the relationship between the two geographic units can be obtained. The total number of OD point pairs existing between any two grids is used as the contact strength value between the two grids in the OD matrix, and the final non-directional OD matrix is generated after counting all the space–time trajectories within one day (Figure 3a).
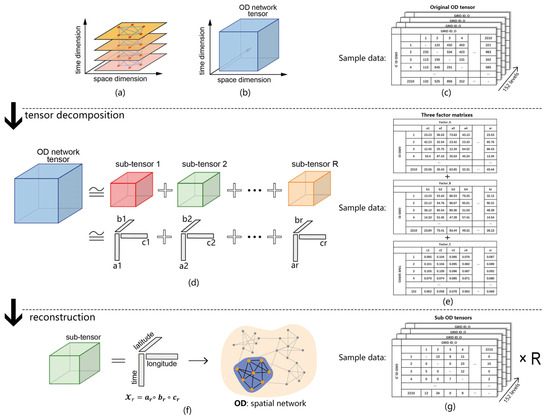
Figure 3.
Conceptual diagram of CP decomposition. (a) A multilevel OD network transformed from individual spatiotemporal trajectory. (b) OD tensor converted from multilevel OD network. (c) Sample data of OD network tensor. (d) Sub-tensors and corresponding vector combination decomposed from original OD tensor. (e) Sample data of factor matrixes. (f) A detailed description of vector combinations and rebuilt spatial OD network representing estimated community of a certain group. (g) Sample data of sub-OD tensors. Note: R in (g) denotes the total number of sub-OD tensors.
By stacking these matrices over the 152-day study period (from 1 January to 31 May in both 2019 and 2020), we constructed an OD network tensor—a three-dimensional tensor . Here, N and M represent longitude and latitude coordinates of population aggregation areas, while K represents temporal dynamics, reflecting individual travel patterns over time (Figure 3b). This study employs a 1 km square grid resolution, given that the average area of Shenzhen’s communities is approximately 1.4 square kilometers [59]. Although 1 km grids in high-density cities like Shenzhen may encompass mixed land use functions, they typically represent meaningful urban areas with dominant functions (such as large residential districts, commercial centers, or industrial parks). Furthermore, considering the spatial sparsity of OD data and computational feasibility, the 1 km2 scale is effective and appropriate for revealing connections between different functional zones within the city while maintaining computational feasibility. Additionally, this spatial scale is commonly utilized in community structure analysis [60].
Consequently, Shenzhen was partitioned into 2210 one-square-kilometer grids as geographic units. Thus, both N and M equal 2210, representing the number of geographic units, while K equals 152. As illustrated in Figure 3c, the original tensor data assumes the form of a 2210 × 2210 × 152 tensor. This approach enables the simultaneous incorporation of both spatial and temporal dimensions within the OD network tensor, ensuring that our extracted communities account for both temporal and spatial aspects.
Secondly, to uncover the latent community structures within the mobility data, we employed Canonical Polyadic (CP) tensor decomposition. This method deconstructs the high-dimensional origin–destination (OD) network tensor into a sum of rank-one sub-tensors, each representing a distinct community with a unique spatiotemporal activity pattern (Figure 3d). Specifically, we first constructed a three-dimensional tensor X of size 2210 × 2210 × 152, where the dimensions correspond to the origin grid, the destination grid, and the 152 days of the study period, respectively. Each element X (i, j, k) within this tensor quantified the total number of trips from origin grid i to destination grid j on day k. The objective of the CP decomposition is to approximate this tensor X as a sum of R components, as expressed in Equation (1), where are column vectors from three factor matrices A, B, and C that represent the origin, destination, and time dimensions, , , .
To find these factor matrices, this research utilized the Alternating Least Squares (ALS) algorithm. This iterative algorithm begins by initializing the factor matrices with random values. It then alternately optimizes one factor matrix at a time by solving a standard linear least squares problem, while keeping the other two matrices fixed. This cycle of updates continues until the model’s reconstruction error converges below a predefined threshold or a maximum number of iterations is reached. The detailed ALS algorithm process is discussed more comprehensively in Supplementary S1.
A critical step in this process, which directly addresses how the number of sub-tensors is determined, is the selection of the optimal number of components, R. Unlike a parameter that is automatically outputted, R is a hyperparameter that must be carefully chosen through an empirical evaluation to ensure the validity and interpretability of the results. Our approach involved running the CP-ALS decomposition for a range of candidate R values (e.g., from 10 to 100 in increments of 10). For each value, we assessed the model’s performance-based reconstruction error, where we looked for an “elbow point” beyond which increasing R provided diminishing returns in model fit, an excessively high R tended to produce fragmented and uninterpretable components. Through this rigorous evaluation, we identified an optimal R value of 12, which provided the best balance between model accuracy and the practical interpretability of the discovered communities. The detailed error calculation methodology is provided in Supplementary S2.
Upon completing the decomposition with the chosen R, we obtained the finalized factor matrices A (2210 × R), B (2210 × R), and C (152 × R), as exemplified in Figure 3e. Each set of corresponding column vectors from these matrices provides a rich, multi-faceted signature of a specific community’s activity patterns across space and time. Given the widespread application and maturity of tensor decomposition algorithms, we implemented the above processes using the N-WAY toolbox in MATLAB 2022a [61]. For more detailed computational procedures, readers are referred to the works of Kolda and Bader [40].
Subsequently, to elucidate the distinct spatiotemporal characteristics of each community, we performed a reconstruction of their corresponding sub-tensors. For each community r, this was achieved by computing the outer product of its unique factor vectors: the origin vector , the destination vector , and the temporal vector . This operation synthesizes a rank-one sub-tensor = , which represents the complete activity pattern of that single community (as illustrated in Figure 3f).
While these reconstructed sub-tensors () share the original 2210 × 2210 × 152 dimensions, they are inherently sparse and contain much smaller values compared to the original tensor, as each one isolates the specific OD activities of just one community (Figure 3g).
The spatial and temporal features of each community are then analyzed separately. To extract the fundamental spatial OD network, the reconstructed sub-tensor is aggregated along its temporal axis by summing the values across all 152 days for each origin–destination pair. This process yields a single 2D matrix, , which represents the cumulative spatial footprint of the community and is suitable for direct visualization. Repeating this procedure for all R communities reveals their distinct spatial distributions. Concurrently, the temporal dynamics are analyzed through direct examination of the temporal factor vector . This vector functions as a time series of daily intensity scores for community r’s activity, quantifying the day-to-day variation in its overall engagement, as described by Gauvin [47].
In this methodology, the reconstructed spatial networks () reveal the stable spatial structure of each community, while their corresponding temporal vectors () reflect the dynamic changes in their activity throughout the COVID-19 pandemic period.
4.2. Entropy Calculation
While the network perspective identifies where communities overlap, it does not inherently quantify the intensity of this interaction. To move from identifying potential contact zones to assessing their actual transmission risk, the final step is the identification of spatial overlaps where communities with similar temporal rhythms intersect. These intersections are critical as they are potential hotbeds for inter-community transmission due to the spatial and temporal convergence of population movements.
Our central hypothesis is that the risk of inter-community transmission in a specific location is directly proportional to the diversity of the communities that actively use that location. A space frequented by a balanced mix of many different communities (a “melting pot”) presents a far higher risk of the virus jumping between social groups than a space dominated by a single community.
To formalize this concept, we employ information entropy as a precise measure of this community mixing degree [62]. The aim of using entropy is twofold: First, it provides a robust mathematical framework to quantify the “disorder” or “uncertainty” of community composition in a given geographic unit. Higher entropy directly corresponds to a more heterogeneous and balanced mix of different communities, which is our proxy for heightened cross-infection risk. Second, it allows for a nuanced risk assessment. Instead of a binary “risky/not risky” classification, entropy provides a continuous risk score, enabling a more granular understanding of the urban risk landscape.
The calculation is performed for each geographic unit (e.g., a destination grid j). For any given grid j, the random variable is the community identity of an incoming trip. The entropy measures the uncertainty of this variable, based on the probability distribution of trips arriving from the R different communities.
The calculation proceeds as follows. First, the total incoming activity flow to grid j from a specific community r is determined. This value, denoted as , is calculated by summing the flows from all origins to destination j within that community’s reconstructed OD matrix, :
Next, the probability that a trip arriving in grid j belongs to community r is the proportion of that community’s flow relative to the total flow into the grid:
Finally, the mixing entropy for the geographic grid j is calculated using the standard Shannon entropy formula:
The entropy value provides a direct measure of the community mix within the area. By calculating this entropy for all geospatial units in Shenzhen, a city-wide map of community mixing is generated. This map identifies areas with the highest degree of community interaction, which are crucial for understanding and managing potential transmission pathways within the urban environment.
5. Results
5.1. Identifying High–Risk Zones Through Spatiotemporal Community Pattern Analysis
Utilizing daily mobility trajectory data of Shenzhen residents over a five-month period in 2020 (1 January 2020 to 31 May 2020), along with comparative data from the corresponding period in 2019, we implemented CP tensor decomposition to identify 12 and 6 distinct communities, respectively. Figure 4 illustrates the spatial distribution of these communities; the data intervals in the map legend were defined using the Natural Breaks (Jenks) classification method to best represent the underlying data structure. These communities represent groups of residents exhibiting similar spatiotemporal patterns in their mobility trajectories. Each identified community corresponds to a unique origin–destination (OD) network tensor, capturing distinctive spatiotemporal behavioral signatures, encompassing both spatial distribution and temporal dynamics. Each grid cell represents a node of OD network and the chromatic intensity of each node indicates its degree, serving as a quantitative measure of both the node’s activity level and its significance as a congregation point within the network. Our analysis reveals a significant transformation in the city’s community structure between the pre-pandemic year of 2019 and the pandemic year of 2020. The number of detected communities doubled from six to twelve. The underlying mechanism for this change is the shift from large-scale, city-wide mobility to hyper-localized activity patterns. In 2019, residents’ daily movements (e.g., long-distance commuting, cross-district social activities) created strong spatiotemporal linkages across vast areas of the city. These robust, long-range connections led our algorithm to identify fewer, but geographically larger, communities. However, the stringent mobility restrictions implemented in 2020 shattered these large-scale patterns. Residents’ activities were largely confined to their immediate neighborhoods, causing the previously strong long-distance ties to weaken or disappear, while short-distance, local ties became overwhelmingly dominant.
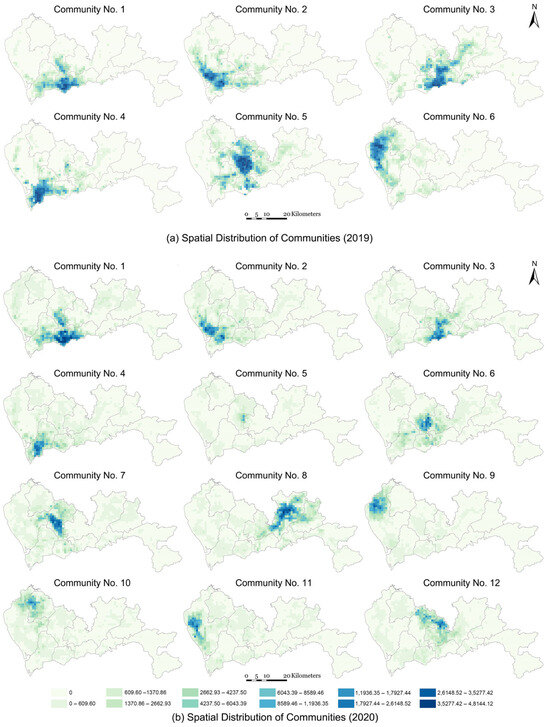
Figure 4.
Spatial distribution of communities identified by CP tensor decomposition algorithm. (a) Six communities of 2019. (b) Twelve communities of 2020.
This structural shift is visually evident in our results. While Communities 1–4 from 2019 maintain substantially similar spatial distributions, the fragmentation of the larger 2019 communities is stark. For instance, the expansive Community 6 in 2019, which covered a large portion of northern Shenzhen, appears to have fractured into several smaller, more concentrated communities in 2020 (specifically, Communities 9, 10, 11). Similarly, Community 5 from 2019 evolved into the more localized Communities 5 and 7 in 2020. From a network perspective, the algorithm no longer saw these areas as one single, cohesive entity, but as multiple, distinct subgroups. In essence, the rise in the number of communities serves as a powerful indicator of increased urban fragmentation and the success of policies aimed at localizing population movement.
Consequently, the spatial overlap between communities assumes heightened significance, as these intersecting regions comprise nodes with high network degrees from different communities. These overlapping areas demonstrate dual importance: firstly, they maintain robust connectivity and substantial mobility with other nodes within their respective communities, functioning as central hubs for daily movement patterns; secondly, they serve as critical zones for inter-community interaction and contact. The simultaneous presence of residents from different communities in these overlapping areas creates potential pathways for cross-community contact and viral transmission. The identification of areas where two or more communities intersect becomes particularly crucial in determining regions susceptible to inter-community disease propagation. The presence of a confirmed COVID-19 case within any such community poses a significant risk of widespread infection across its spatial extent, with nodes of higher degree indicating elevated risk levels. In 2020, the intersecting regions between Communities 1–4 and Communities 5–7 warrant particular attention. These areas exhibit spatial overlap, characterized by the intersection of darker-colored grids (representing higher activity intensity and interaction). This overlapping pattern indicates significant interaction levels between nodes that are active across different communities. The increased spatial intersection enhances the probability of contact between residents from different communities through their daily activities, thereby elevating the risk of cross-community disease transmission.
These findings also underscore the limitations of relying on administrative divisions, such as district, Jiedao, or neighborhoods, to delineate risk zones. The spatial distribution of communities in Shenzhen, as revealed by our analysis, significantly deviates from the boundaries of administrative districts. We observed that many communities extended across multiple administrative regions, and this is consistent with previous research utilizing mobility data, which shows that community boundaries often correspond to natural features like rivers and mountains, especially in geographically diverse cities like Shenzhen [35,63].
However, spatial proximity alone does not guarantee that individuals within these communities share identical temporal activity patterns or concurrent presence at specific locations. Even with similar spatial activity zones, temporal disparities can significantly reduce contact probability and consequently minimize viral transmission potential. This phenomenon becomes more evident when comparing the data with 2019 patterns. The six communities in 2019 exhibited distinct cyclical fluctuations (Figure 5a), with nearly synchronized mobility decline and recovery patterns during the Chinese New Year period. In contrast, the 2020 communities demonstrated diverse temporal patterns. A notable observation is the temporal divergence among Communities 5–7 in 2020 (Figure 5b), despite their significant spatial overlap. Community 5 is particularly distinctive, exhibiting post-pandemic activity intensities that not only recovered but exceeded pre-pandemic levels. Its spatial distribution characteristics, marked by compact scale and limited range, indicate the concentrated presence of specific behavioral groups. Community 6 maintains commuting trends similar to earlier communities, while Community 7 shows no distinct commuting patterns, suggesting more diversified or dispersed temporal activity scheduling. Furthermore, Communities 1–6 display pronounced periodicity, characterized by weekend declines and weekday surges in activity, indicative of typical workday-weekend commuting patterns. This rhythm likely stems from their location within Shenzhen’s employment centers, which are dominated by corporate and office-based economies.
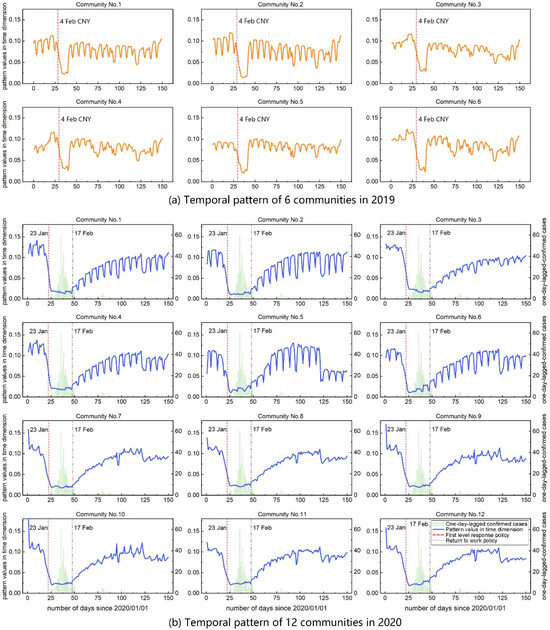
Figure 5.
Temporal variation patterns of overall activity intensity across communities. (a) Temporal pattern of six communities in 2019. (b) Temporal pattern of twelve communities in 2020.
Conversely, the weaker weekday–weekend variation observed in Communities 7–12 warrants discussion. These communities are predominantly located in Shenzhen’s peripheral urban areas. We hypothesize that the lack of a strong periodic signal can be attributed to several potential factors. First, these areas may have a different economic base, with a higher concentration of manufacturing, logistics, or industrial zones, which often operate on shift-based schedules or have fewer regular hours compared to traditional 9-to-5 office work. Second, the land use in these peripheral regions is often more mixed or primarily residential, leading to less synchronized, large-scale daily commuting flows. Consequently, the population’s activity schedules are likely more heterogeneous and less tied to a standard Monday-to-Friday work week, resulting in a flatter temporal signature.
Figure 6 further presents a heatmap that delineates shifts in activity intensity across all communities within the temporal dimension. The heatmap reveals that different communities exhibit distinct temporal behaviors. In the detailed view (Figure 6b), it is apparent that Communities 1 to 4 showed a more gradual decline in mobility post-outbreak, with a lag of 3 to 4 days before a noticeable reduction in activity, in contrast to other communities that experienced an immediate drop. Conversely, during the recovery phase, these same communities began to rebound in tandem but were among the last to reach full recovery, lagging by about one week. In contrast, Communities 5 to 12 exhibited a swifter recovery, quickly resuming activities following the implementation of the return-to-work (RTW) policy.
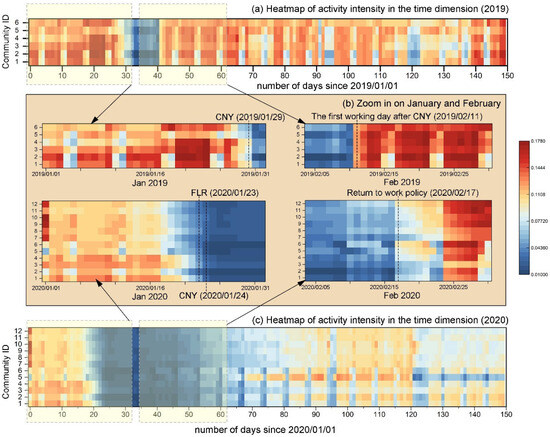
Figure 6.
Heatmap of activity intensity time distribution for 12 risk zones in 2019 and 2020. (a) Heatmap of activity intensity from 1 January 2019 to 31 May 2019. (b) Zoom in on January and February of 2019 and 2020. (c) Heatmap of activity intensity from 1 January 2020 to 31 May 2020. Note: CNY represents Chinese New Year; FLR represents first-level response policy; color represents activity intensity level.
This divergence is even more pronounced when juxtaposed with the patterns observed in 2019, where a uniform decline in mobility across all communities was followed by a synchronized recovery (the decline and recovery is caused by Chinese New Year public holiday). The variance in the recovery pace of communities in 2020 underscores the pandemic’s uneven impact on mobility patterns and the resilience of different community structures in adapting to and recovering from the crisis. These temporal dynamics are crucial for understanding the complexities of disease transmission risks and informing public health strategies that consider the unique characteristics of each community.
In summary, by integrating spatial distribution with temporal pattern insights, we conclude that Communities 1 to 4 represent the most critical population groups whose behaviors are likely to generate high–risk transmission dynamics. This conclusion is based on two key observations. Firstly, these communities display stable spatial distributions and resilient temporal activity patterns, with minimal disruption from the pandemic. Their maintenance of regular commuting activities and significant spatial overlaps creates the necessary conditions for sustained, inter-community transmission. In contrast, other communities experienced varying degrees of disruption. Secondly, the synchronized periodic rhythm and tandem recovery of Communities 1 to 4 further distinguish them as a cohesive, high-activity cohort.
Therefore, our analytical framework proceeds in two logical stages. The first stage, tensor decomposition, has successfully identified the key population groups (Communities 1–4) of concern. The essential second stage is to identify the specific geographic locations where these high–risk populations converge and mix most intensely. Accordingly, in the subsequent sections, we will focus on Communities 1 to 4 as potential high–risk zones. We will analyze the locations where residents from these communities frequently interact to pinpoint specific high–risk zones. This targeted analysis will help delineate zones that require enhanced surveillance and public health interventions, thereby facilitating more effective pandemic management strategies.
5.2. Precise Identification of High–Risk Zones Through Spatiotemporally-Concurrent Analysis
The second stage of our risk assessment is a community concurrence analysis. The objective is to pinpoint the specific geographic locations where these distinct communities physically mix, as these points of convergence represent the highest-risk zones for inter-community transmission.
To quantify the degree of this community mixing at each location, we employ an entropy-based measurement, as delineated in our Methods section (Equation (4)). In this context, entropy serves as a metric for co-presence; a value approaching unity signifies a high degree of mixing, indicating that individuals from multiple distinct communities are frequently present at that location. This spatiotemporal co-presence implies an elevated risk of contagion.
The results of this analysis are visualized in Figure 7. Regions demarcated in red signify areas identified as being at risk. In accordance with the entropy definition, a number approaching unity corresponds to a heightened degree of mixture at a particular location. This denotes a propensity for individuals from diverse communities to engage in spatiotemporal co-presence interactions, thereby underscoring an elevated risk of contagion. The spatial overlaps in Figure 7a among Communities 1–4, which are significant and expansive, span across the southern districts, indicating a high degree of mixing. Another highly overlapped area is from Communities 9–11, located in an industrial area of Shenzhen. To enhance clarity and facilitate analysis, these overlapping areas are further segmented into five distinct regions based on their spatial proximity and continuity, each labeled numerically in the corresponding figure.
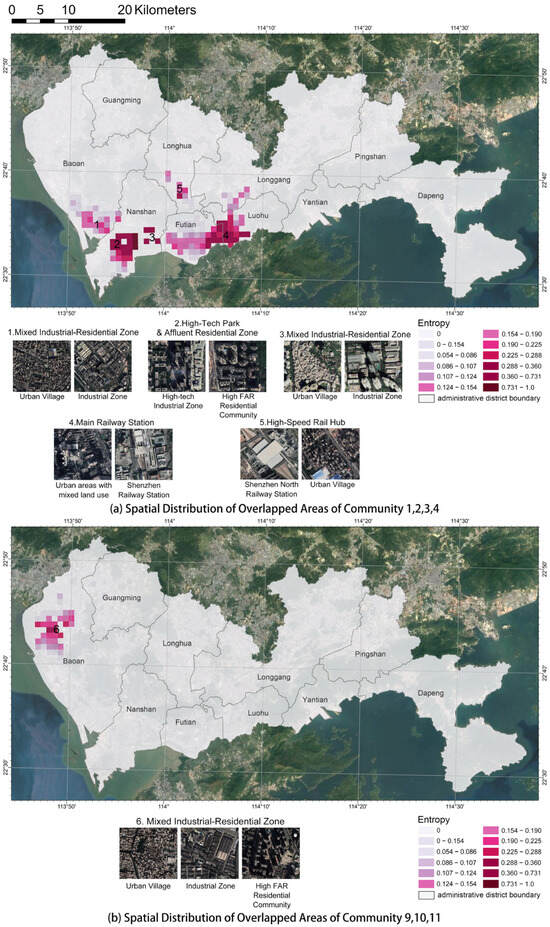
Figure 7.
Spatial distribution of high–risk zones identified by entropy of overlapped communities. Shade of color represents entropy value, with areas closer to 1 indicating a higher degree of mixture in that region. Numbers represent ID of these areas. Below is a satellite image of land use corresponding to the areas with the highest entropy among the six areas. (a) The high–risk zones formed by communities 1 to 4. (b) The high–risk zones formed by communities 9 to 11.
Using Area 3 of Figure 7a as a case study, it is a distinct region located on the eastern periphery of Nanshan District, consisting of three spatial units and possessing the second-highest entropy level. This area includes a large urban village, Baishizhou, and an industrial park, Huaqiaocheng. The red-highlighted zones within this area show a high degree of mixing among residents from Communities 1–4, suggesting frequent spatial interactions.
As illustrated in Figure 4b, the designated high–risk zone corresponds to the spatial distribution of Communities 1 and 4, which exhibit analogous spatiotemporal patterns. Their travel activity underwent a significant downturn during the pandemic’s impact phase, commencing on 20 January 2020, albeit with a slight lag relative to other communities. Their resurgence in travel activity was equally swift, initiating on 17 February 2020, yet with a one-week delay, manifesting a pronounced weekday–weekend rhythm. This pattern suggests that individuals from these communities not only share spatially overlapping regions but are also likely to coincide temporally, augmenting the potential for inter-community viral transmission.
Situated centrally among the four communities, Area 3 offers high spatial accessibility and an abundance of affordable housing, making it a likely residence for many individuals working in Shenzhen’s economically prosperous southern region, thus fostering significant population mixing. This hypothesis is corroborated by real-world data from the Shenzhen Health Commission, which reported three significant outbreaks in Baishizhou during March, July, and October 2022 [64], leading to its classification as a high–risk zone frequently. Residents were subjected to home isolation, and Baishizhou became the urban village with the most frequent lockdowns in Shenzhen. This serves as compelling evidence that areas with high levels of mixture are more likely to become hubs of multiple types of mobility, leading to spatiotemporal overlaps among individuals from different communities, thereby constituting high–risk areas for the rapid spread of diseases.
Furthermore, we conducted an analysis of land-use patterns across four additional zones to identify the spatial and socioeconomic factors contributing to the distribution of areas where residents exhibit a higher incidence of spatiotemporal co-location. This analysis provides insights into the economic activities and demographic composition of these regions.
- Area 1 (Mixed Industrial-Residential Zone), in the southern Bao’an District adjacent to Nanshan District, shows a lower mixing degree, with entropy values below 0.225, and a dispersed layout. Satellite imagery reveals a mix of urban villages and an industrial park, suggesting a blend of residential and industrial land uses.
- Area 2 (High-Tech Park and Affluent Residential Zone), in the heart of Nanshan District, has a higher entropy, ranging from 0.288 to 1.0, indicating a more concentrated pattern of mixed spatiotemporal activity rhythms. Notably, the band-shaped area on the eastern side records the highest entropy values, from 0.731 to 1.0, coinciding with the location of the Shenzhen high-tech industrial park, a hub for technology companies, and high-density residential areas.
- Area 4 (Main Railway Station) is the most extensive overlapping region, stretching across Luohu and Futian districts. The entropy value peaks at the intersection of these districts, with values from 0.36 to 0.731. As early developed areas with high economic activity and population density, these districts feature complex land-use patterns, including commercial, residential, and industrial zones. The mixed geographic units here include urban villages, residential zones, and commercial centers.
- Area 5 (High-Speed Rail Hub) is in the northern Longhua District, home to a highly mixed geographic unit and the critical Shenzhen North Railway Station. This station is a major transportation node, linking Shenzhen with other cities across the country. The area also includes urban villages with higher entropy values, indicating a diverse population and frequent interactions among residents.
- Area 6 (Mixed Industrial-Residential Zone) results from the overlay of Communities 9, 10, and 11 (Figure 7b). Area 6 was also reported to frequently have confirmed high–risk cases during pandemic control measures [65]. This area is a typical industrial manufacturing zone where populations from Communities 9, 10, and 11 are concentrated in factory work and reside in nearby high-density urban villages, which can easily lead to disease transmission within the communities.
Our research demonstrates that work, residential, and transportation hubs, which draw inhabitants from diverse urban sectors, are prone to becoming epicenters for viral dissemination. Prior research has probed the nexus between land-use patterns and the propagation of diseases [66,67]. However, our study’s insights disclose that every such spatial configuration exhibit significant spatiotemporal interaction. Apart from the red areas indicated in Figure 7, the southern areas of Shenzhen are densely populated with work and residential spaces, yet most regions maintain a low entropy level. Only those prominent work and residential communities that attract populations from different urban areas become high–risk zones. This phenomenon arises due to the fact that these zones are characterized by a pronounced amalgamation of various urban communities and serve as focal points for a spectrum of spatiotemporal behaviors. Our findings underscore that the pivotal determinant in the spread of diseases is the spatiotemporal interface among disparate groups, transcending the mere physical attributes of geographical expanse. The application of the risk-zone demarcation protocol delineated in our research facilitates a more targeted identification of high–risk zones emanating from the intersecting domains of human spatiotemporal dynamics.
6. Conclusions and Discussion
This article presents a novel approach to delineating risk zones in response to epidemic outbreaks by conducting network clustering analysis on extensive long-term sequential trajectory data of urban residents using tensor decomposition methods. Using this approach, we have discovered community structures that exhibit spatiotemporal co-location. These structures represent the activity ranges of groups that may come into contact within the same spatial and temporal boundaries. This is the primary innovation of our study compared to the currently prevalent partitioning methods. Additionally, based on the overlapping structures among communities, we have defined different risk levels for risk zone delineation, making the research findings more actionable.
The results of tensor decomposition on spatial dimensions revealed 12 communities as high–risk zones during the COVID-19 impact phase. These communities displayed similar spatiotemporal activity patterns, leading to their grouping by the tensor decomposition algorithm. This indicates a significant level of internal connectivity within each community, making them high–risk zones for intra-group transmission. Notably, these communities exhibited spatial overlap, indicating contact between residents from different communities at these intersecting nodes. These high-degree overlaps serve as true hotspots for potential virus transmission between groups, contributing to a pandemic. Real event reports further support a higher incidence of outbreak incidents in these overlapped regions.
These places encompass high-density residential areas (i.e., urban villages and high FAR communities), working spaces (i.e., industrial areas and business centers), and transportation hubs. The presence of highly mixed populations exhibiting similar temporal patterns in these areas significantly amplifies the risk of virus transmission. Consequently, it is crucial to prioritize these areas in the early stages of infectious disease outbreaks. Therefore, we recommend that the government allocate increased attention to these high–risk zones during the initial phases of a pandemic. This approach facilitates the prompt identification of high–risk regions and can be supplemented by implementing travel restrictions policies to hinder virus transmission across different communities.
This study also provides compelling evidence to challenge the rationality of the government’s current approach to delineating risk zones. Shenzhen City has categorized its areas into three risk levels: high, medium, and low. High–risk zones include locations where patients have been active, as well as their residences. Medium-risk zones are typically divided by Jiedao (in China’s administrative division system, Jiedao are administrative units that are subordinate to districts. In Shenzhen, typically, a district comprises 3–5 streets, which can be understood as subdistricts.), while low-risk zones are delineated by administrative districts. Different levels of mobility restriction policies were implemented for these three risk zones [68]. The spatial distribution map clearly reveals that the core scope of each community in Shenzhen does not necessarily align with fixed administrative areas. Furthermore, the high–risk zones identified in this study are noticeably smaller than the administrative areas. However, the government continues to employ Jiedao and district boundaries for delineating risk zones, leading to two significant consequences. Firstly, an overly large control area hampers the mobility of numerous low-risk groups since diagnosed patients and other healthy individuals may not belong to the same community despite being part of the same administrative area. Secondly, using administrative boundaries as risk zones risks disregarding actual high–risk zones. As cross-regional communities are prevalent post-epidemic, the movement within the city is not restricted by administrative borders. Thus, individuals within the same community may spread the disease across districts, rendering the current policy ineffective in preventing potential disease pandemics. In this regard, the tensor decomposition method can accurately identify the distinct activity spaces and characteristics of different communities. Leveraging this method can aid in precisely detecting the specific activity spaces of various groups, facilitating the delineation of effective epidemic prevention and control areas.
This article presents evidence that integrated spatiotemporal analysis unveils trajectory patterns extending beyond single dimensions of space or time. Analyzing the spatial dimension reveals the static distribution pattern of spatial interactions and high–risk regions for disease transmission. Exploring the time dimension reveals the relationship between time series changes in risk zones, dynamic activity intensity, and the occurrence of interactions at specific times and locations [69,70]. Integrating both spatial and temporal dimensions enables the identification of spatially overlapping communities with consistent temporal patterns, surpassing the limitations of examining either dimension alone. This approach aligns with time–geography research, emphasizing the significance of time-space analysis [71]. The article utilizes this combined approach to offer a comprehensive method for delineating risk zones and proposes a valuable geospatial analysis technique for managing similar pandemics in the future.
The tensor decomposition method has several unique advantages in this research. Firstly, it allows for the simultaneous analysis of different dimensions, preserving multi-dimensional data information and revealing interactions between them. In this study, we successfully identified risk zones with distinct spatial distributions and temporal patterns sing this method. Moreover, the overall spatiotemporal dimension analysis helped identify risk zones with higher population mix. Secondly, the tensor decomposition algorithm is highly flexible and applicable to various scenarios. Unlike previous studies that required a unified similarity measurement index [72], the tensor decomposition method does not rely heavily on assumptions, but rather on the proximity of connections between different spatiotemporal trajectories to extract inherent pattern features. Furthermore, our study integrates tensor decomposition with spatiotemporal mobility networks, reconstructing the results of tensor decomposition into spatial community clustering outcomes, thereby enhancing the interpretability of this algorithm.
This study has several noteworthy limitations. First, while tensor decomposition methods effectively identify community structures, they cannot elucidate the causal mechanisms underlying various spatiotemporal patterns. The aggregation of individual movement trajectory data into geographic units prevents us from establishing models that explain the relationships between attribute variables (such as individual and environmental factors) and spatiotemporal patterns. This limitation is evident in the case of Communities 7–12 (2020), which lack the distinct weekday–weekend patterns observed in their urban-core counterparts. While we hypothesize that this difference stems from varying local economies and land-use characteristics, our current model does not incorporate the socioeconomic variables necessary to formally test this hypothesis. Future research could incorporate additional data sources to construct multi-dimensional tensors and analyze the interaction mechanisms between trajectory patterns and multiple contributing factors.
Second, although our research demonstrates significant advantages of trajectory data analysis over static geographical statistical approaches, we cannot directly illustrate the comparative advantages of our methodology against studies utilizing precise individual trajectory data. This limitation arises from both the inherent errors in mobile phone signaling data and the difficulties in acquiring accurate individual trajectory data. Future studies should consider constructing tensors using non-aggregated individual trajectories to facilitate such methodological comparisons.
Third, this study faces the inability to perform direct quantitative validation of the identified high–risk zones against official, geolocated epidemiological data. This limitation resulted from the unavailability of historical confirmed case data at fine-grained spatial resolution, a consequence of data privacy policies and public health reporting standards. Therefore, conducting such quantitative assessment represents a crucial direction for future research. Should this type of data become accessible, future work could rigorously evaluate the model’s predictive accuracy by calculating correlations between entropy-based risk scores and actual infection rates.
Finally, the data is sourced from a single mobile network operator, China Unicom, encompassing approximately 4 million anonymous users, representing nearly 24% of Shenzhen’s estimated 17 million residents. This single-source approach may introduce sampling bias, as the demographic, socioeconomic, and geographic distribution of one carrier’s user base may not perfectly align with that of the city as a whole. Nevertheless, it is widely established in the literature that while single-carrier data may exhibit compositional biases, macro-level patterns of urban movement (such as commuting corridors and activity hotspots) are robustly captured when the sample size is sufficiently large, as is the case here [73]. Future research could enhance the validity of these findings by integrating data from multiple carriers or fusing mobility data with other sources to construct a more comprehensive and representative model of the urban population.
Supplementary Materials
The following supporting information can be downloaded at: https://www.mdpi.com/article/10.3390/ijgi14080285/s1, The Supplementary Material describes how to decompose the tensor using Alternating Least Squares (ALS) and optimization methods.
Author Contributions
Conceptualization, Wenjia Zhang and Tianhua Lu; methodology, Wenjia Zhang and Tianhua Lu; software, Tianhua Lu; validation, Tianhua Lu; formal analysis, Tianhua Lu; investigation, Tianhua Lu; resources, Wenjia Zhang; data curation, Tianhua Lu; writing—original draft preparation, Tianhua Lu; writing—review and editing, Wenjia Zhang; visualization, Tianhua Lu; supervision, Wenjia Zhang; project administration, Wenjia Zhang; funding acquisition, Wenjia Zhang. All authors have read and agreed to the published version of the manuscript.
Funding
This work was supported by the National Natural Science Foundation of China (42171201) and the Fundamental Research Funds for the Central Universities.
Institutional Review Board Statement
Not applicable.
Data Availability Statement
The datasets used and/or analyzed during the current study are available from the corresponding author upon reasonable request.
Conflicts of Interest
The authors declare no conflict of interest.
References
- Cartenì, A.; Di Francesco, L.; Martino, M. How Mobility Habits Influenced the Spread of the COVID-19 Pandemic: Results from the Italian Case Study. Sci. Total Environ. 2020, 741, 140489. [Google Scholar] [CrossRef]
- Choo, M.; Yoon, H.; Yoon, D. Investigating Consistent Effects of the Urban Built Environment and Human Mobility on COVID-19 Outbreaks: A Comprehensive Meta-Analysis. Sustain. Cities Soc. 2024, 102, 105226. [Google Scholar] [CrossRef]
- Lee, K.-S.; Eom, J.K. Systematic Literature Review on Impacts of COVID-19 Pandemic and Corresponding Measures on Mobility. Transportation 2024, 51, 1907–1961. [Google Scholar] [CrossRef] [PubMed]
- Merler, S.; Ajelli, M. The Role of Population Heterogeneity and Human Mobility in the Spread of Pandemic Influenza. Proc. R. Soc. B Biol. Sci. 2010, 277, 557–565. [Google Scholar] [CrossRef]
- Dlamini, W.M.; Dlamini, S.N.; Mabaso, S.D.; Simelane, S.P. Spatial Risk Assessment of an Emerging Pandemic under Data Scarcity: A Case of COVID-19 in Eswatini. Appl. Geogr. 2020, 125, 102358. [Google Scholar] [CrossRef]
- Nanath, K.; Balasubramanian, S.; Shukla, V.; Islam, N.; Kaitheri, S. Developing a Mental Health Index Using a Machine Learning Approach: Assessing the Impact of Mobility and Lockdown during the COVID-19 Pandemic. Technol. Forecast. Soc. Change 2022, 178, 121560. [Google Scholar] [CrossRef]
- Badr, H.S.; Du, H.; Marshall, M.; Dong, E.; Squire, M.M.; Gardner, L.M. Association between Mobility Patterns and COVID-19 Transmission in the USA: A Mathematical Modelling Study. Lancet Infect. Dis. 2020, 20, 1247–1254. [Google Scholar] [CrossRef]
- Trasberg, T.; Cheshire, J. Spatial and Social Disparities in the Decline of Activities during the COVID-19 Lockdown in Greater London. Urban. Stud. 2023, 60, 1427–1447. [Google Scholar] [CrossRef]
- Kan, Z.; Kwan, M.-P.; Wong, M.S.; Huang, J.; Liu, D. Identifying the Space-Time Patterns of COVID-19 Risk and Their Associations with Different Built Environment Features in Hong Kong. Sci. Total Environ. 2021, 772, 145379. [Google Scholar] [CrossRef]
- Kanga, S.; Meraj, G.; Sudhanshu; Farooq, M.; Nathawat, M.; Singh, S.K. Analyzing the Risk to COVID-19 Infection Using Remote Sensing and GIS. Risk Anal. 2021, 41, 801–813. [Google Scholar] [CrossRef]
- Mansour, S.; Al Kindi, A.; Al-Said, A.; Al-Said, A.; Atkinson, P. Sociodemographic Determinants of COVID-19 Incidence Rates in Oman: Geospatial Modelling Using Multiscale Geographically Weighted Regression (MGWR). Sustain. Cities Soc. 2021, 65, 102627. [Google Scholar] [CrossRef]
- Danon, L.; House, T.A.; Read, J.M.; Keeling, M.J. Social Encounter Networks: Collective Properties and Disease Transmission. J. R. Soc. Interface 2012, 9, 2826–2833. [Google Scholar] [CrossRef] [PubMed]
- He, X.; Zhou, C.; Wang, Y.; Yuan, X. Risk Assessment and Prediction of COVID-19 Based on Epidemiological Data from Spatiotemporal Geography. Front. Environ. Sci. 2021, 9, 634156. [Google Scholar] [CrossRef]
- Jiang, P.; Fu, X.; Van Fan, Y.; Klemeš, J.J.; Chen, P.; Ma, S.; Zhang, W. Spatial-Temporal Potential Exposure Risk Analytics and Urban Sustainability Impacts Related to COVID-19 Mitigation: A Perspective from Car Mobility Behaviour. J. Clean. Prod. 2021, 279, 123673. [Google Scholar] [CrossRef]
- Li, J.; Wang, X.; He, Z.; Zhang, T. A Personalized Activity-Based Spatiotemporal Risk Mapping Approach to the COVID-19 Pandemic. Cartogr. Geogr. Inf. Sci. 2021, 48, 275–291. [Google Scholar] [CrossRef]
- Keeling, M. The Implications of Network Structure for Epidemic Dynamics. Theor. Popul. Biol. 2005, 67, 1–8. [Google Scholar] [CrossRef]
- So, M.K.; Tiwari, A.; Chu, A.M.; Tsang, J.T.; Chan, J.N. Visualizing COVID-19 Pandemic Risk through Network Connectedness. Int. J. Infect. Dis. 2020, 96, 558–561. [Google Scholar] [CrossRef]
- Stegehuis, C.; Van Der Hofstad, R.; Van Leeuwaarden, J.S. Epidemic Spreading on Complex Networks with Community Structures. Sci. Rep. 2016, 6, 29748. [Google Scholar] [CrossRef]
- Zhong, C.; Arisona, S.M.; Huang, X.; Batty, M.; Schmitt, G. Detecting the Dynamics of Urban Structure through Spatial Network Analysis. Int. J. Geogr. Inf. Sci. 2014, 28, 2178–2199. [Google Scholar] [CrossRef]
- Kwan, M.-P. Interactive Geovisualization of Activity-Travel Patterns Using Three-Dimensional Geographical Information Systems: A Methodological Exploration with a Large Data Set. Transp. Res. Part C Emerg. Technol. 2000, 8, 185–203. [Google Scholar] [CrossRef]
- Shaw, S.-L.; Yu, H.; Bombom, L.S. A Space-Time GIS Approach to Exploring Large Individual-Based Spatiotemporal Datasets. Trans. GIS 2008, 12, 425–441. [Google Scholar] [CrossRef]
- Zhou, C.; Yuan, W.; Wang, J.; Xu, H.; Jiang, Y.; Wang, X.; Wen, Q.H.; Zhang, P. Detecting Suspected Epidemic Cases Using Trajectory Big Data. arXiv 2020, arXiv:200400908. [Google Scholar]
- Loo, B.P.; Tsoi, K.H.; Wong, P.P.; Lai, P.C. Identification of Superspreading Environment under COVID-19 through Human Mobility Data. Sci. Rep. 2021, 11, 4699. [Google Scholar] [CrossRef]
- Crandall, D.J.; Backstrom, L.; Cosley, D.; Suri, S.; Huttenlocher, D.; Kleinberg, J. Inferring Social Ties from Geographic Coincidences. Proc. Natl. Acad. Sci. USA 2010, 107, 22436–22441. [Google Scholar] [CrossRef]
- Xiao, X.; Zheng, Y.; Luo, Q.; Xie, X. Inferring Social Ties between Users with Human Location History. J. Ambient Intell. Humaniz. Comput. 2014, 5, 3–19. [Google Scholar] [CrossRef]
- Zhang, W.; Thill, J.-C. Mesoscale Structures in World City Networks. Ann. Am. Assoc. Geogr. 2019, 109, 887–908. [Google Scholar] [CrossRef]
- Zhang, W.; Fang, C.; Zhou, L.; Zhu, J. Measuring Megaregional Structure in the Pearl River Delta by Mobile Phone Signaling Data: A Complex Network Approach. Cities 2020, 104, 102809. [Google Scholar] [CrossRef]
- Sun, H.; Chen, Y.; Lai, J.; Wang, Y.; Liu, X. Identifying Tourists and Locals by K-Means Clustering Method from Mobile Phone Signaling Data. J. Transp. Eng. Part A Syst. 2021, 147, 04021070. [Google Scholar] [CrossRef]
- Park, S.; Xu, Y.; Jiang, L.; Chen, Z.; Huang, S. Spatial Structures of Tourism Destinations: A Trajectory Data Mining Approach Leveraging Mobile Big Data. Ann. Tour. Res. 2020, 84, 102973. [Google Scholar] [CrossRef]
- Heiler, G.; Reisch, T.; Hurt, J.; Forghani, M.; Omani, A.; Hanbury, A.; Karimipour, F. Country-Wide Mobility Changes Observed Using Mobile Phone Data during COVID-19 Pandemic. In Proceedings of the 2020 IEEE International Conference on Big Data (Big Data), Atlanta, GA, USA, 10–13 December 2020; IEEE: New York, NY, USA, 2020; pp. 3123–3132. [Google Scholar]
- Gan, T.; Li, W.; He, L.; Li, J. Intracity Pandemic Risk Evaluation Using Mobile Phone Data: The Case of Shanghai during COVID-19. ISPRS Int. J. Geo-Inf. 2020, 9, 715. [Google Scholar] [CrossRef]
- Bermingham, L.; Lee, I. Spatio-Temporal Sequential Pattern Mining for Tourism Sciences. Procedia Comput. Sci. 2014, 29, 379–389. [Google Scholar] [CrossRef]
- Yildirimoglu, M.; Kim, J. Identification of Communities in Urban Mobility Networks Using Multi-Layer Graphs of Network Traffic. Transp. Res. Part C Emerg. Technol. 2018, 89, 254–267. [Google Scholar] [CrossRef]
- Zheng, L.; Xia, D.; Zhao, X.; Tan, L.; Li, H.; Chen, L.; Liu, W. Spatial–Temporal Travel Pattern Mining Using Massive Taxi Trajectory Data. Phys. Stat. Mech. Appl. 2018, 501, 24–41. [Google Scholar] [CrossRef]
- Cheng, Y.; Li, C.; Zhang, Y.; He, S.; Chen, J. Spatial–Temporal Urban Mobility Pattern Analysis during Covid-19 Pandemic. IEEE Trans. Comput. Soc. Syst. 2022, 11, 38–50. [Google Scholar] [CrossRef]
- Giannotti, F.; Nanni, M.; Pinelli, F.; Pedreschi, D. Trajectory Pattern Mining. In Proceedings of the 13th ACM SIGKDD International Conference on Knowledge Discovery and Data Mining, San Jose, CA, USA, 12–15 August 2007; pp. 330–339. [Google Scholar]
- Jia, T.; Cai, C.; Li, X.; Luo, X.; Zhang, Y.; Yu, X. Dynamical Community Detection and Spatiotemporal Analysis in Multilayer Spatial Interaction Networks Using Trajectory Data. Int. J. Geogr. Inf. Sci. 2022, 36, 1719–1740. [Google Scholar] [CrossRef]
- Lamosa, J.D.; Tomas, L.R.; Quiles, M.G.; Londe, L.R.; Santos, L.B.; Macau, E.E. Topological Indexes and Community Structure for Urban Mobility Networks: Variations in a Business Day. PLoS ONE 2021, 16, e0248126. [Google Scholar] [CrossRef]
- Yang, S.; Wu, J.; Xu, Y.; Yang, T. Revealing Heterogeneous Spatiotemporal Traffic Flow Patterns of Urban Road Network via Tensor Decomposition-Based Clustering Approach. Phys. Stat. Mech. Appl. 2019, 526, 120688. [Google Scholar] [CrossRef]
- Kolda, T.G.; Bader, B.W. Tensor Decompositions and Applications. SIAM Rev. 2009, 51, 455–500. [Google Scholar] [CrossRef]
- Tucker, L.R. Some Mathematical Notes on Three-Mode Factor Analysis. Psychometrika 1966, 31, 279–311. [Google Scholar] [CrossRef]
- Cao, M.; Huang, M.; Ma, S.; Lü, G.; Chen, M. Analysis of the Spatiotemporal Riding Modes of Dockless Shared Bicycles Based on Tensor Decomposition. Int. J. Geogr. Inf. Sci. 2020, 34, 2225–2242. [Google Scholar] [CrossRef]
- Sun, L.; Axhausen, K.W. Understanding Urban Mobility Patterns with a Probabilistic Tensor Factorization Framework. Transp. Res. Part B Methodol. 2016, 91, 511–524. [Google Scholar] [CrossRef]
- Wang, J.; Gao, F.; Cui, P.; Li, C.; Xiong, Z. Discovering Urban Spatio-Temporal Structure from Time-Evolving Traffic Networks. In Proceedings of the Web Technologies and Applications: 16th Asia-Pacific Web Conference (APWeb 2014), Changsha, China, 5–7 September 2014; Springer: Berlin, Germany, 2014; pp. 93–104. [Google Scholar]
- Xu, J.; Liu, J.; Xu, Y.; Lv, Y.; Pei, T.; Du, Y.; Zhou, C. Identification of Spatial and Functional Interactions in Beijing Based on Trajectory Data. Appl. Geogr. 2022, 145, 102744. [Google Scholar] [CrossRef]
- Fan, Z.; Song, X.; Shibasaki, R. CitySpectrum: A Non-Negative Tensor Factorization Approach. In Proceedings of the 2014 ACM International Joint Conference on Pervasive and Ubiquitous Computing, Seattle WA, USA, 13–17 September 2014; pp. 213–223. [Google Scholar]
- Gauvin, L.; Panisson, A.; Cattuto, C. Detecting the Community Structure and Activity Patterns of Temporal Networks: A Non-Negative Tensor Factorization Approach. PLoS ONE 2014, 9, e86028. [Google Scholar] [CrossRef] [PubMed]
- Sheikholeslami, F.; Baingana, B.; Giannakis, G.B.; Sidiropoulos, N.D. Egonet Tensor Decomposition for Community Identification. In Proceedings of the 2016 IEEE Global Conference on Signal and Information Processing (GlobalSIP), Washington, DC, USA, 7–9 December 2016; IEEE: Piscataway, NJ, USA, 2016; pp. 341–345. [Google Scholar]
- Palla, G.; Derényi, I.; Farkas, I.; Vicsek, T. Uncovering the Overlapping Community Structure of Complex Networks in Nature and Society. Nature 2005, 435, 814–818. [Google Scholar] [CrossRef] [PubMed]
- Chen, N.; Liu, Y.; Chao, H.-C. Overlapping Community Detection Using Non-Negative Matrix Factorization with Orthogonal and Sparseness Constraints. IEEE Access Pract. Innov. Open Solut. 2017, 6, 21266–21274. [Google Scholar] [CrossRef]
- Yang, J.; Leskovec, J. Overlapping Community Detection at Scale: A Nonnegative Matrix Factorization Approach. In Proceedings of the Sixth ACM International Conference on Web Search and Data Mining, Rome, Italy, 4–8 February 2013; pp. 587–596. [Google Scholar]
- Reid, F.; Hurley, N. Diffusion in Networks with Overlapping Community Structure. In Proceedings of the 2011 IEEE 11th International Conference on Data Mining Workshops, Vancouver, BC, Canada, 11 December 2011; IEEE: New York, NY, USA, 2011; pp. 969–978. [Google Scholar]
- Shang, J.; Liu, L.; Li, X.; Xie, F.; Wu, C. Epidemic Spreading on Complex Networks with Overlapping and Non-Overlapping Community Structure. Phys. Stat. Mech. Appl. 2015, 419, 171–182. [Google Scholar] [CrossRef]
- Balasubramaniam, T.; Warne, D.J.; Nayak, R.; Mengersen, K. Explainability of the COVID-19 Epidemiological Model with Nonnegative Tensor Factorization. Int. J. Data Sci. Anal. 2023, 15, 267–280. [Google Scholar] [CrossRef]
- Balasubramaniam, T.; Nayak, R.; Bashar, M.A. Understanding the Spatio-Temporal Topic Dynamics of Covid-19 Using Nonnegative Tensor Factorization: A Case Study. In Proceedings of the 2020 IEEE Symposium Series on Computational Intelligence (SSCI), Canberra, Australia, 1–4 December 2020; IEEE: New York, NY, USA, 2002; pp. 1218–1225. [Google Scholar]
- SMBS Shenzhen Statistical Yearbook 2024. Available online: http://tjj.sz.gov.cn/zwgk/zfxxgkml/tjsj/tjnj/content/post_9491388.html (accessed on 28 June 2024).
- Zhang, W.; Ning, K. Spatiotemporal Heterogeneities in the Causal Effects of Mobility Intervention Policies during the COVID-19 Outbreak: A Spatially Interrupted Time-Series (SITS) Analysis. Ann. Am. Assoc. Geogr. 2023, 113, 1112–1134. [Google Scholar] [CrossRef]
- Zhang, W.; Li, C. Varying Mobility Adaptation to COVID-19 of Residents in Urban Villages and Commodity Housing Communities: A Quasi-Experimental Analysis in Shenzhen, China. Cities 2024, 145, 104711. [Google Scholar] [CrossRef]
- Shenzhen Government Overview of Administrative Division Information. Available online: https://mzj.sz.gov.cn/szmz/pc/bmxx/mzfwzy/xzqh/bmxx/content/post_2925240.html (accessed on 3 October 2024).
- Long, Y.; Shen, Y.; Jin, X. Mapping Block-Level Urban Areas for All Chinese Cities. Ann. Am. Assoc. Geogr. 2016, 106, 96–113. [Google Scholar] [CrossRef]
- Andersson, C.A.; Bro, R. The N-Way Toolbox for MATLAB. Chemom. Intell. Lab. Syst. 2000, 52, 1–4. [Google Scholar] [CrossRef]
- Im, H.N.; Choi, C.G. The Hidden Side of the Entropy-Based Land-Use Mix Index: Clarifying the Relationship between Pedestrian Volume and Land-Use Mix. Urban Stud. 2019, 56, 1865–1881. [Google Scholar] [CrossRef]
- Jin, M.; Gong, L.; Cao, Y.; Zhang, P.; Gong, Y.; Liu, Y. Identifying Borders of Activity Spaces and Quantifying Border Effects on Intra-Urban Travel through Spatial Interaction Network. Comput. Environ. Urban Syst. 2021, 87, 101625. [Google Scholar] [CrossRef]
- HCSM Announcement from the Office of the Epidemic Prevention and Control Command Center Regarding the COVID-19 Situation in Futian District, Shenzhen City. Available online: https://wjw.sz.gov.cn/xxgk/yjgl/content/post_9899361.html (accessed on 6 May 2023).
- HCSM Announcement from the Office of the Epidemic Prevention and Control Command Center Regarding the COVID-19 Situation in Baoan District, Shenzhen City. Available online: https://wjw.sz.gov.cn/xxgk/yjgl/content/post_9899324.html (accessed on 6 May 2023).
- Gargiulo, C.; Gaglione, F.; Guida, C.; Papa, R.; Zucaro, F.; Carpentieri, G. The Role of the Urban Settlement System in the Spread of Covid-19 Pandemic. The Italian Case. TeMA-J. Land. Use Mobil. Environ. 2020, 189–212. [Google Scholar] [CrossRef]
- Jiang, Y.; Huang, X.; Li, Z. Spatiotemporal Patterns of Human Mobility and Its Association with Land Use Types during COVID-19 in New York City. ISPRS Int. J. Geo-Inf. 2021, 10, 344. [Google Scholar] [CrossRef]
- HCSM Explanation of Mobility Restriction Policies. Available online: http://wjw.sz.gov.cn/yqxx/content/post_10236575.html (accessed on 12 July 2023).
- Fan, C.; Lee, S.; Yang, Y.; Oztekin, B.; Li, Q.; Mostafavi, A. Effects of Population Co-Location Reduction on Cross-County Transmission Risk of COVID-19 in the United States. Appl. Netw. Sci. 2021, 6, 14. [Google Scholar] [CrossRef]
- Zhi, G.; Meng, B.; Lin, H.; Zhang, X.; Xu, M.; Chen, S.; Wang, J. Spatial Co-Location Patterns between Early COVID-19 Risk and Urban Facilities: A Case Study of Wuhan, China. Front. Public Health 2024, 11, 1293888. [Google Scholar] [CrossRef]
- Kwan, M.-P. Beyond Space (as We Knew It): Toward Temporally Integrated Geographies of Segregation, Health, and Accessibility: Space–Time Integration in Geography and GIScience. Ann. Assoc. Am. Geogr. 2013, 103, 1078–1086. [Google Scholar] [CrossRef]
- Choong, M.Y.; Chin, R.K.Y.; Yeo, K.B.; Teo, K.T.K. Trajectory Pattern Mining via Clustering Based on Similarity Function for Transportation Surveillance. Int. J. Simul.-Syst. Sci. Technol. 2016, 17, 19.1–19.7. [Google Scholar] [CrossRef]
- Cicek, D.; Kantarci, B. Use of Mobile Crowdsensing in Disaster Management: A Systematic Review, Challenges, and Open Issues. Sensors 2023, 23, 1699. [Google Scholar] [CrossRef]
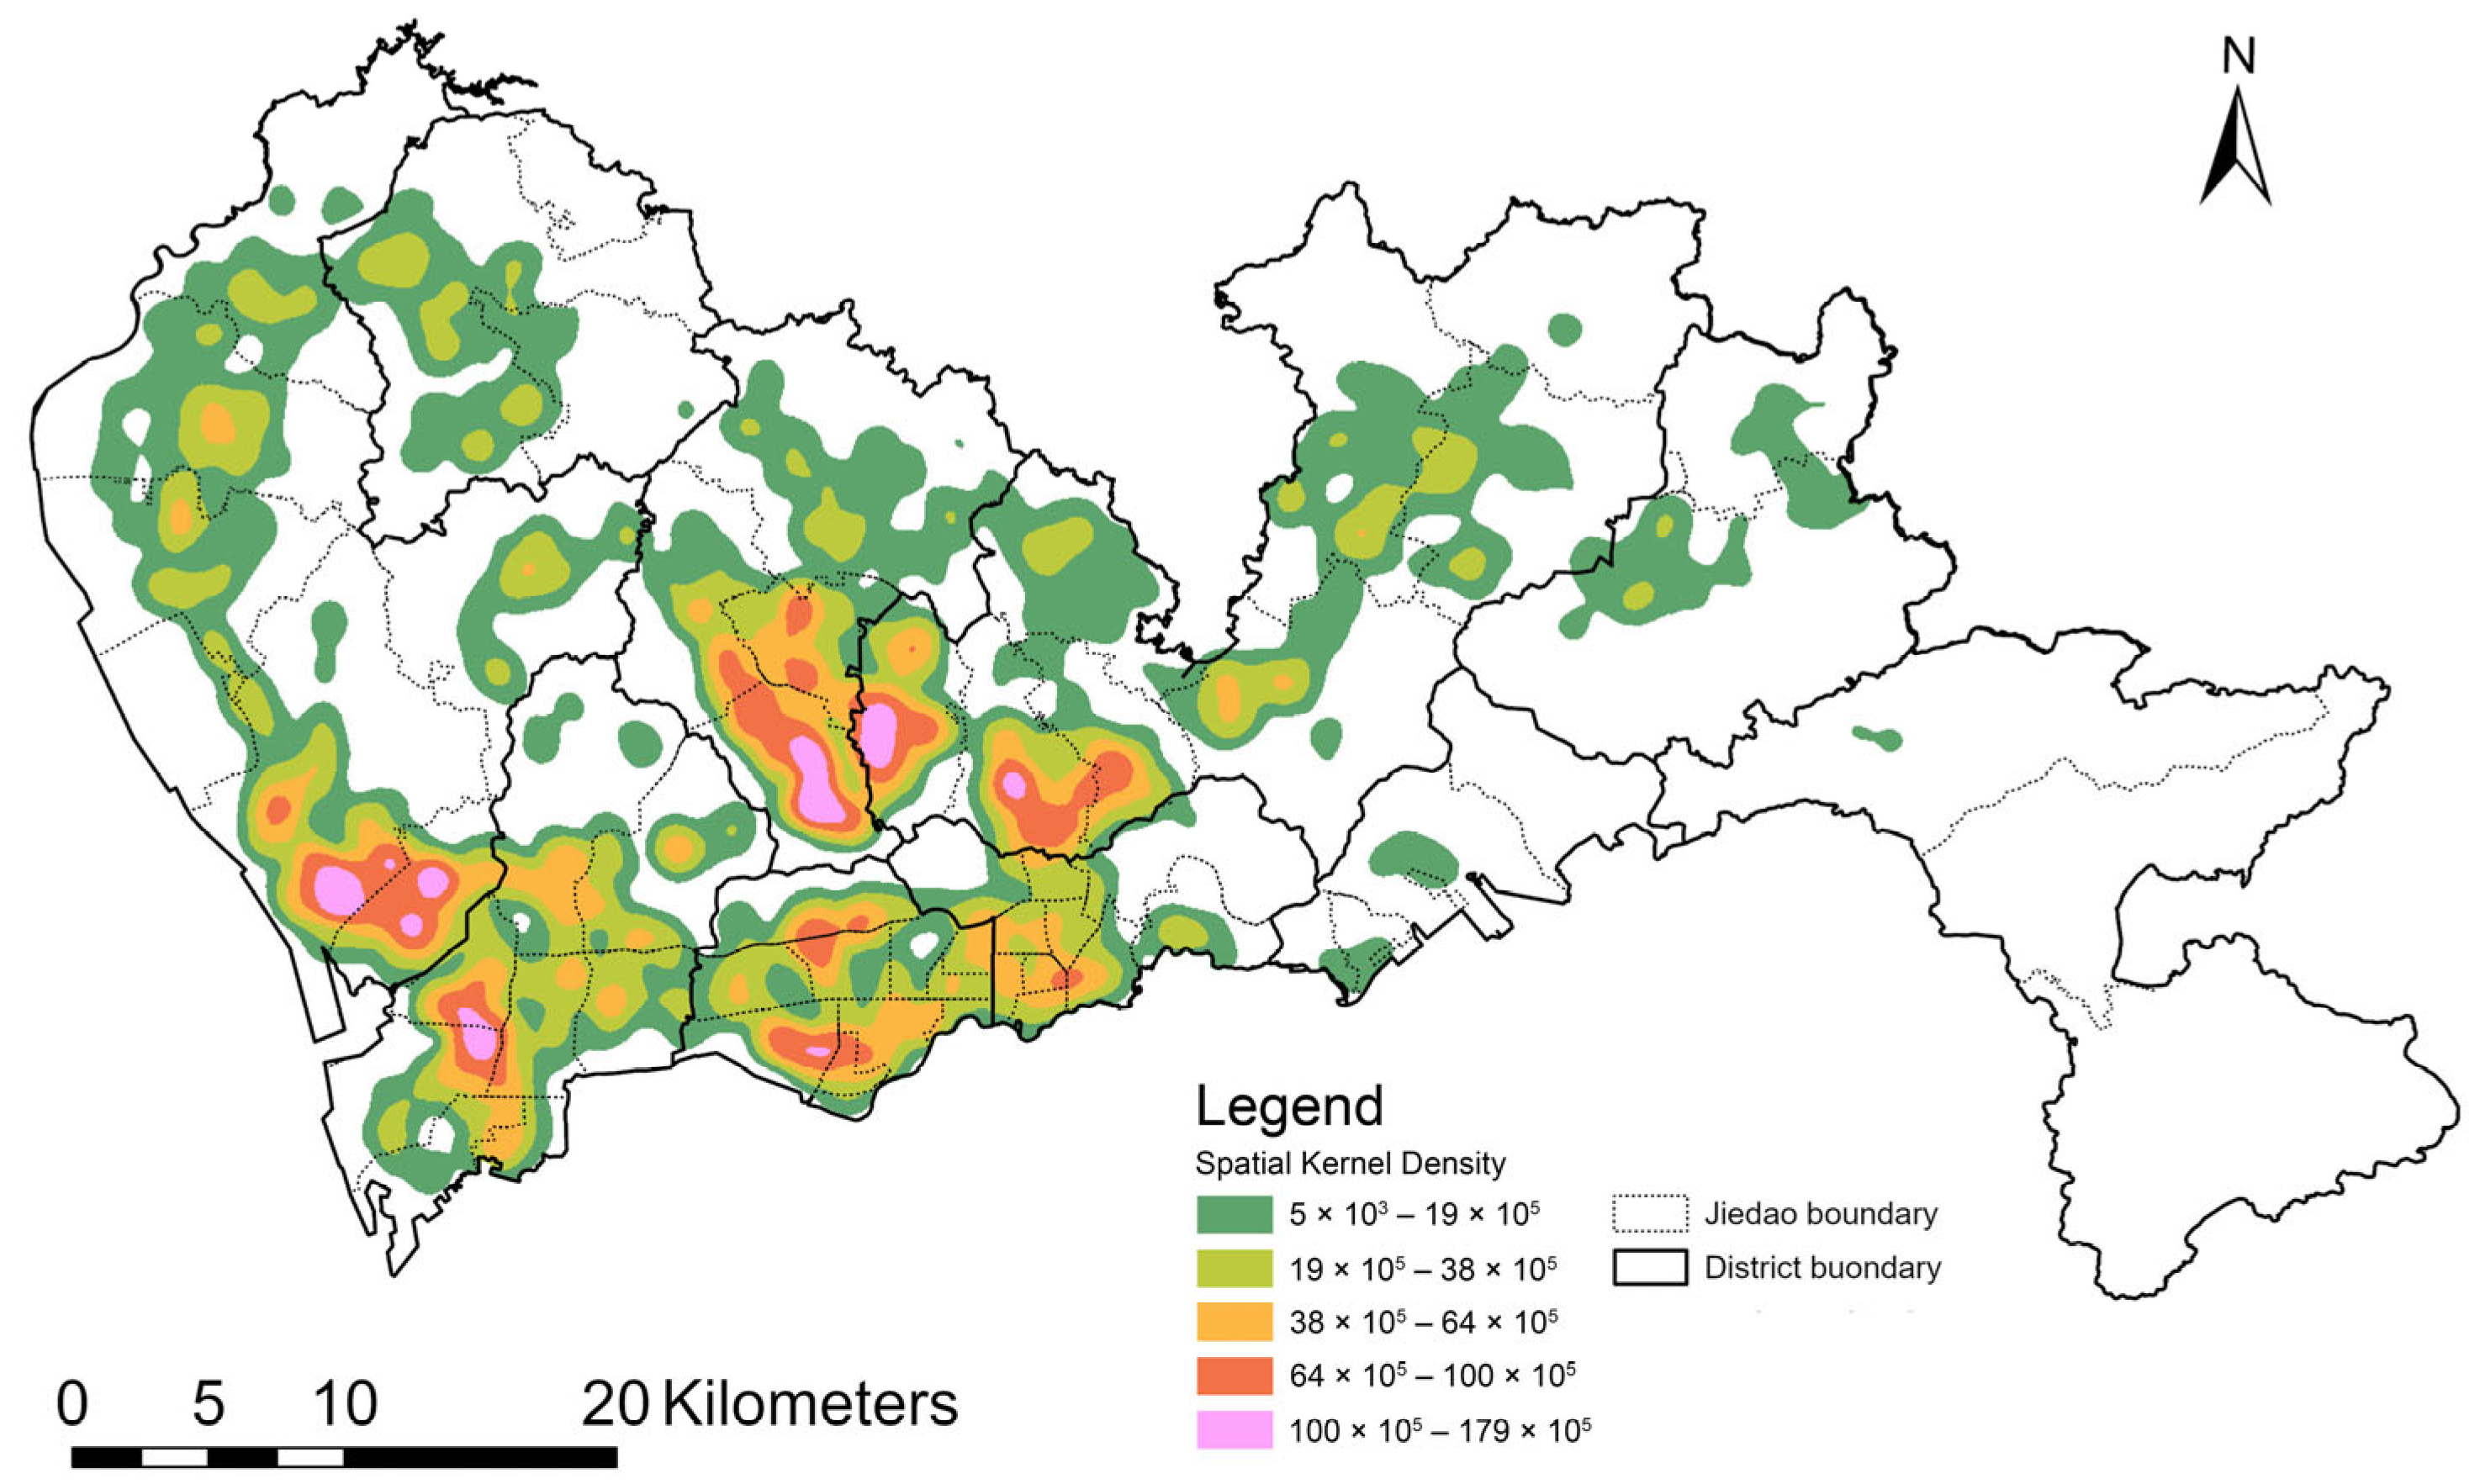
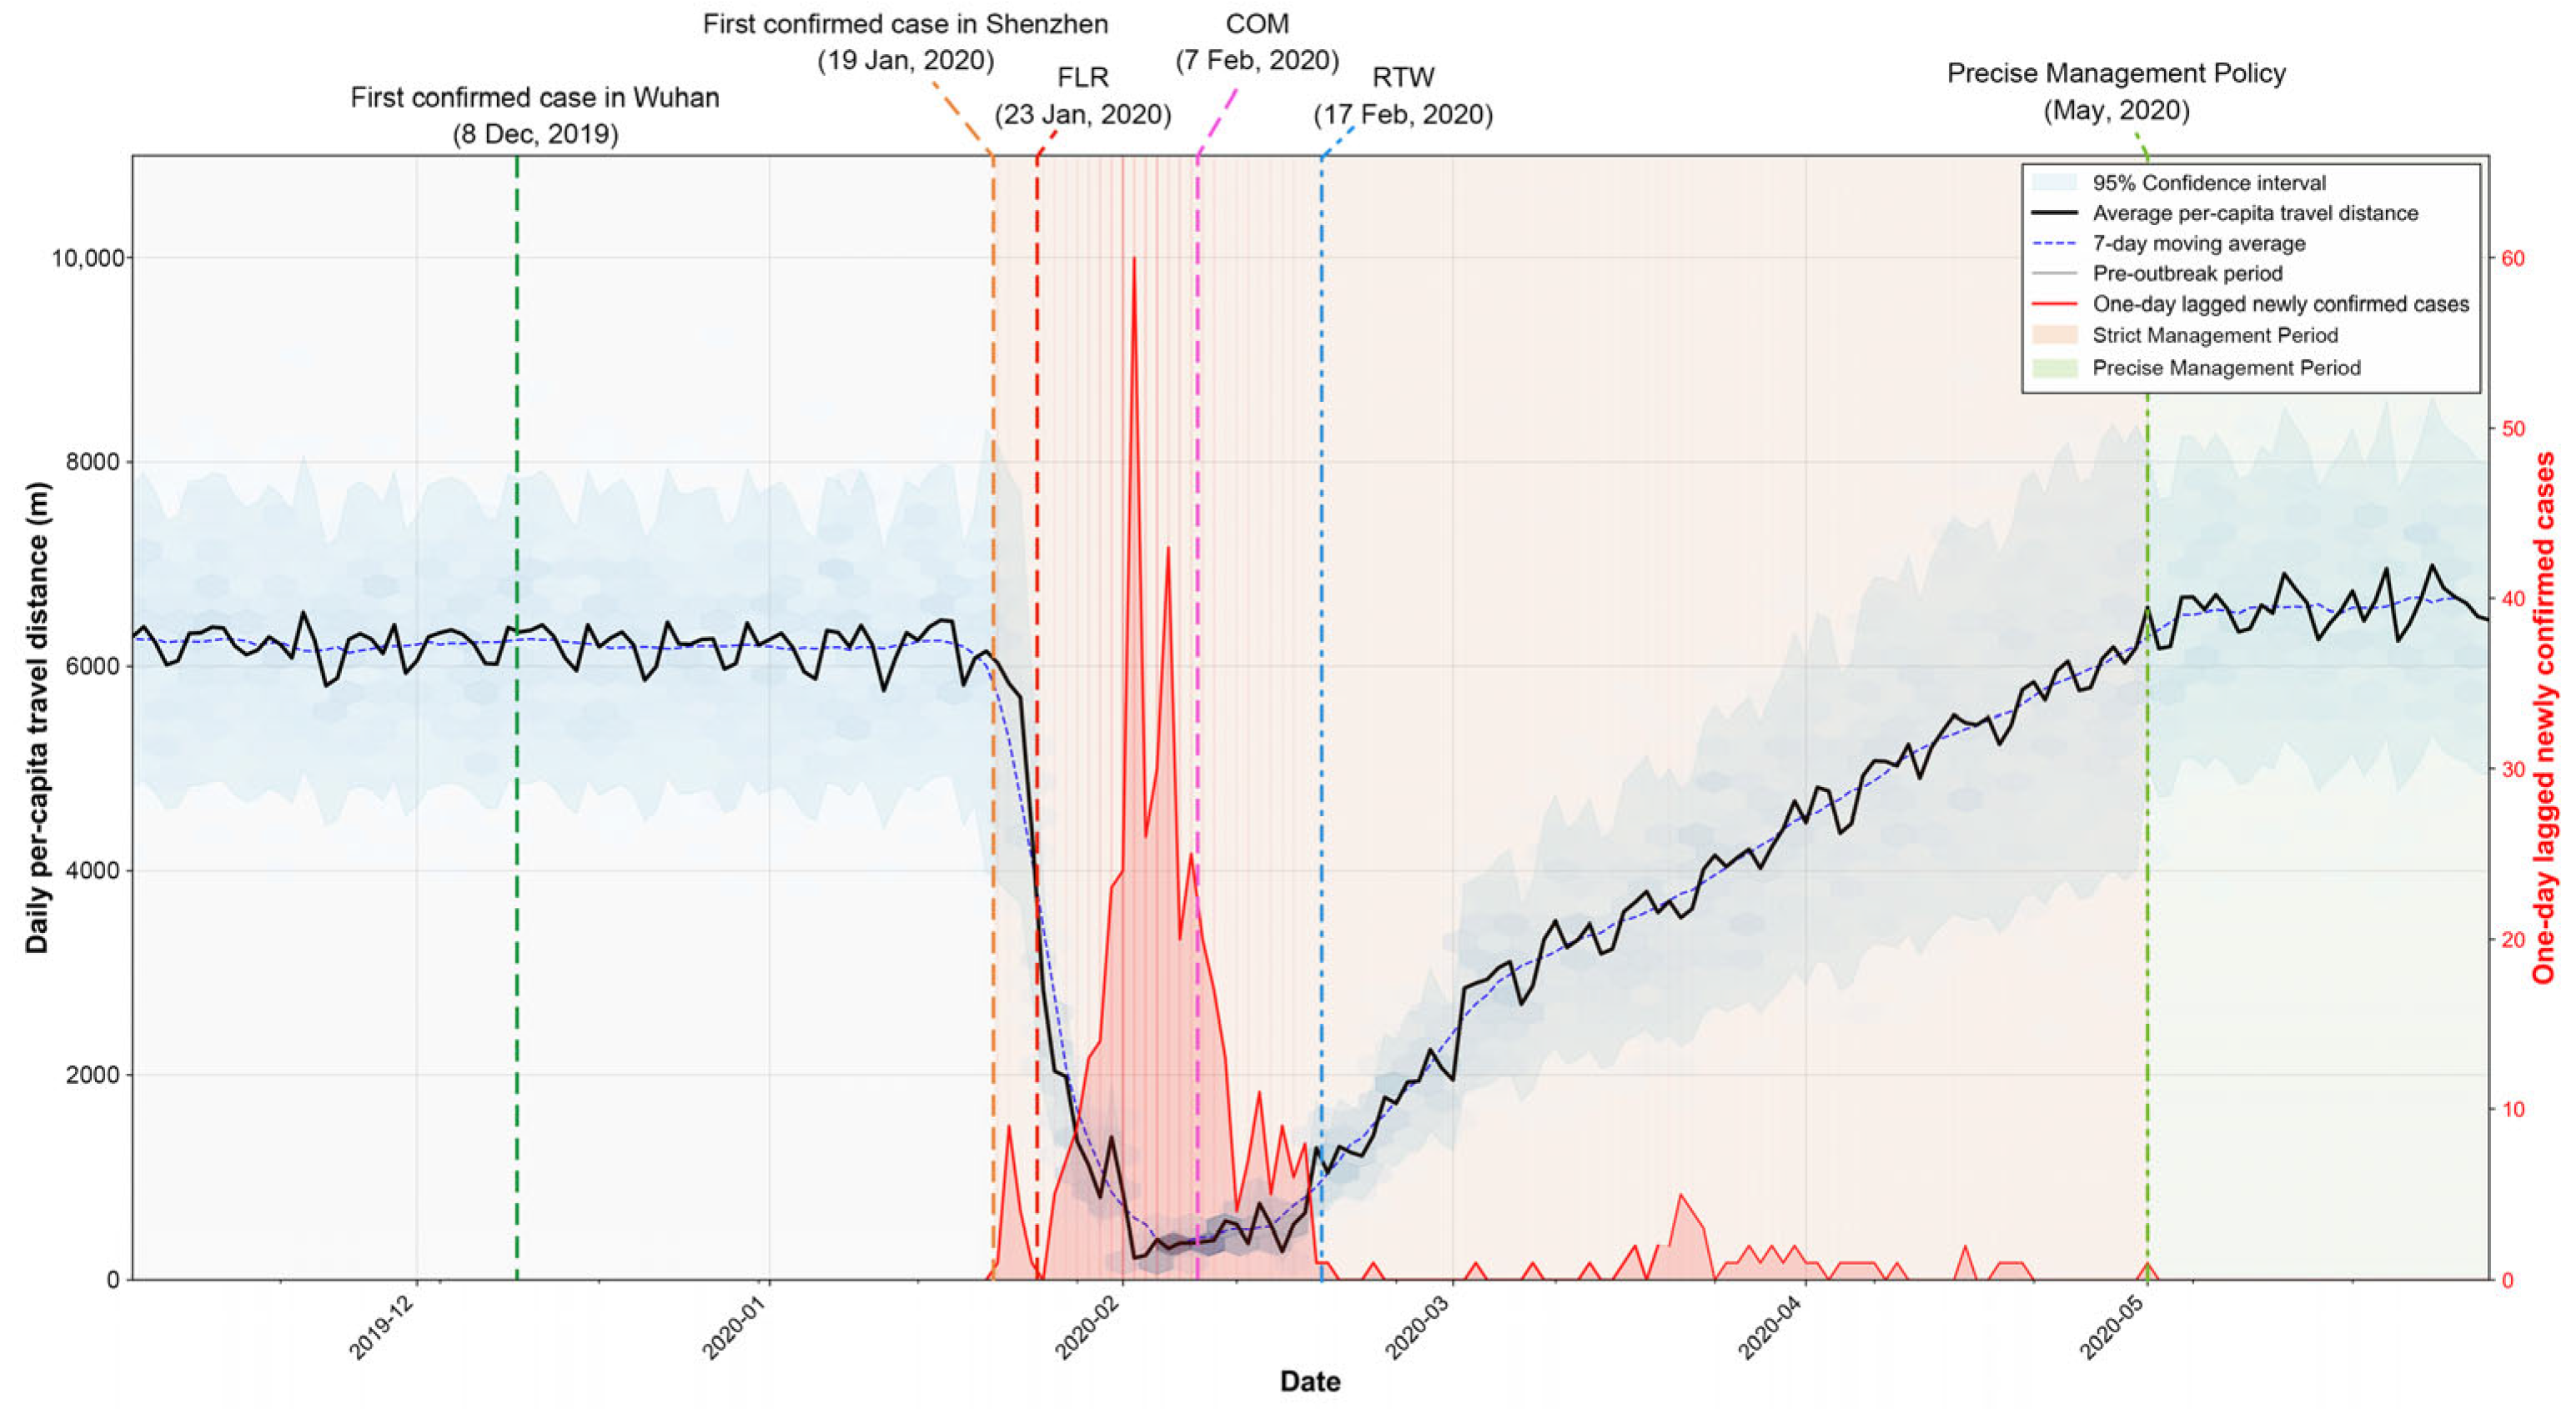
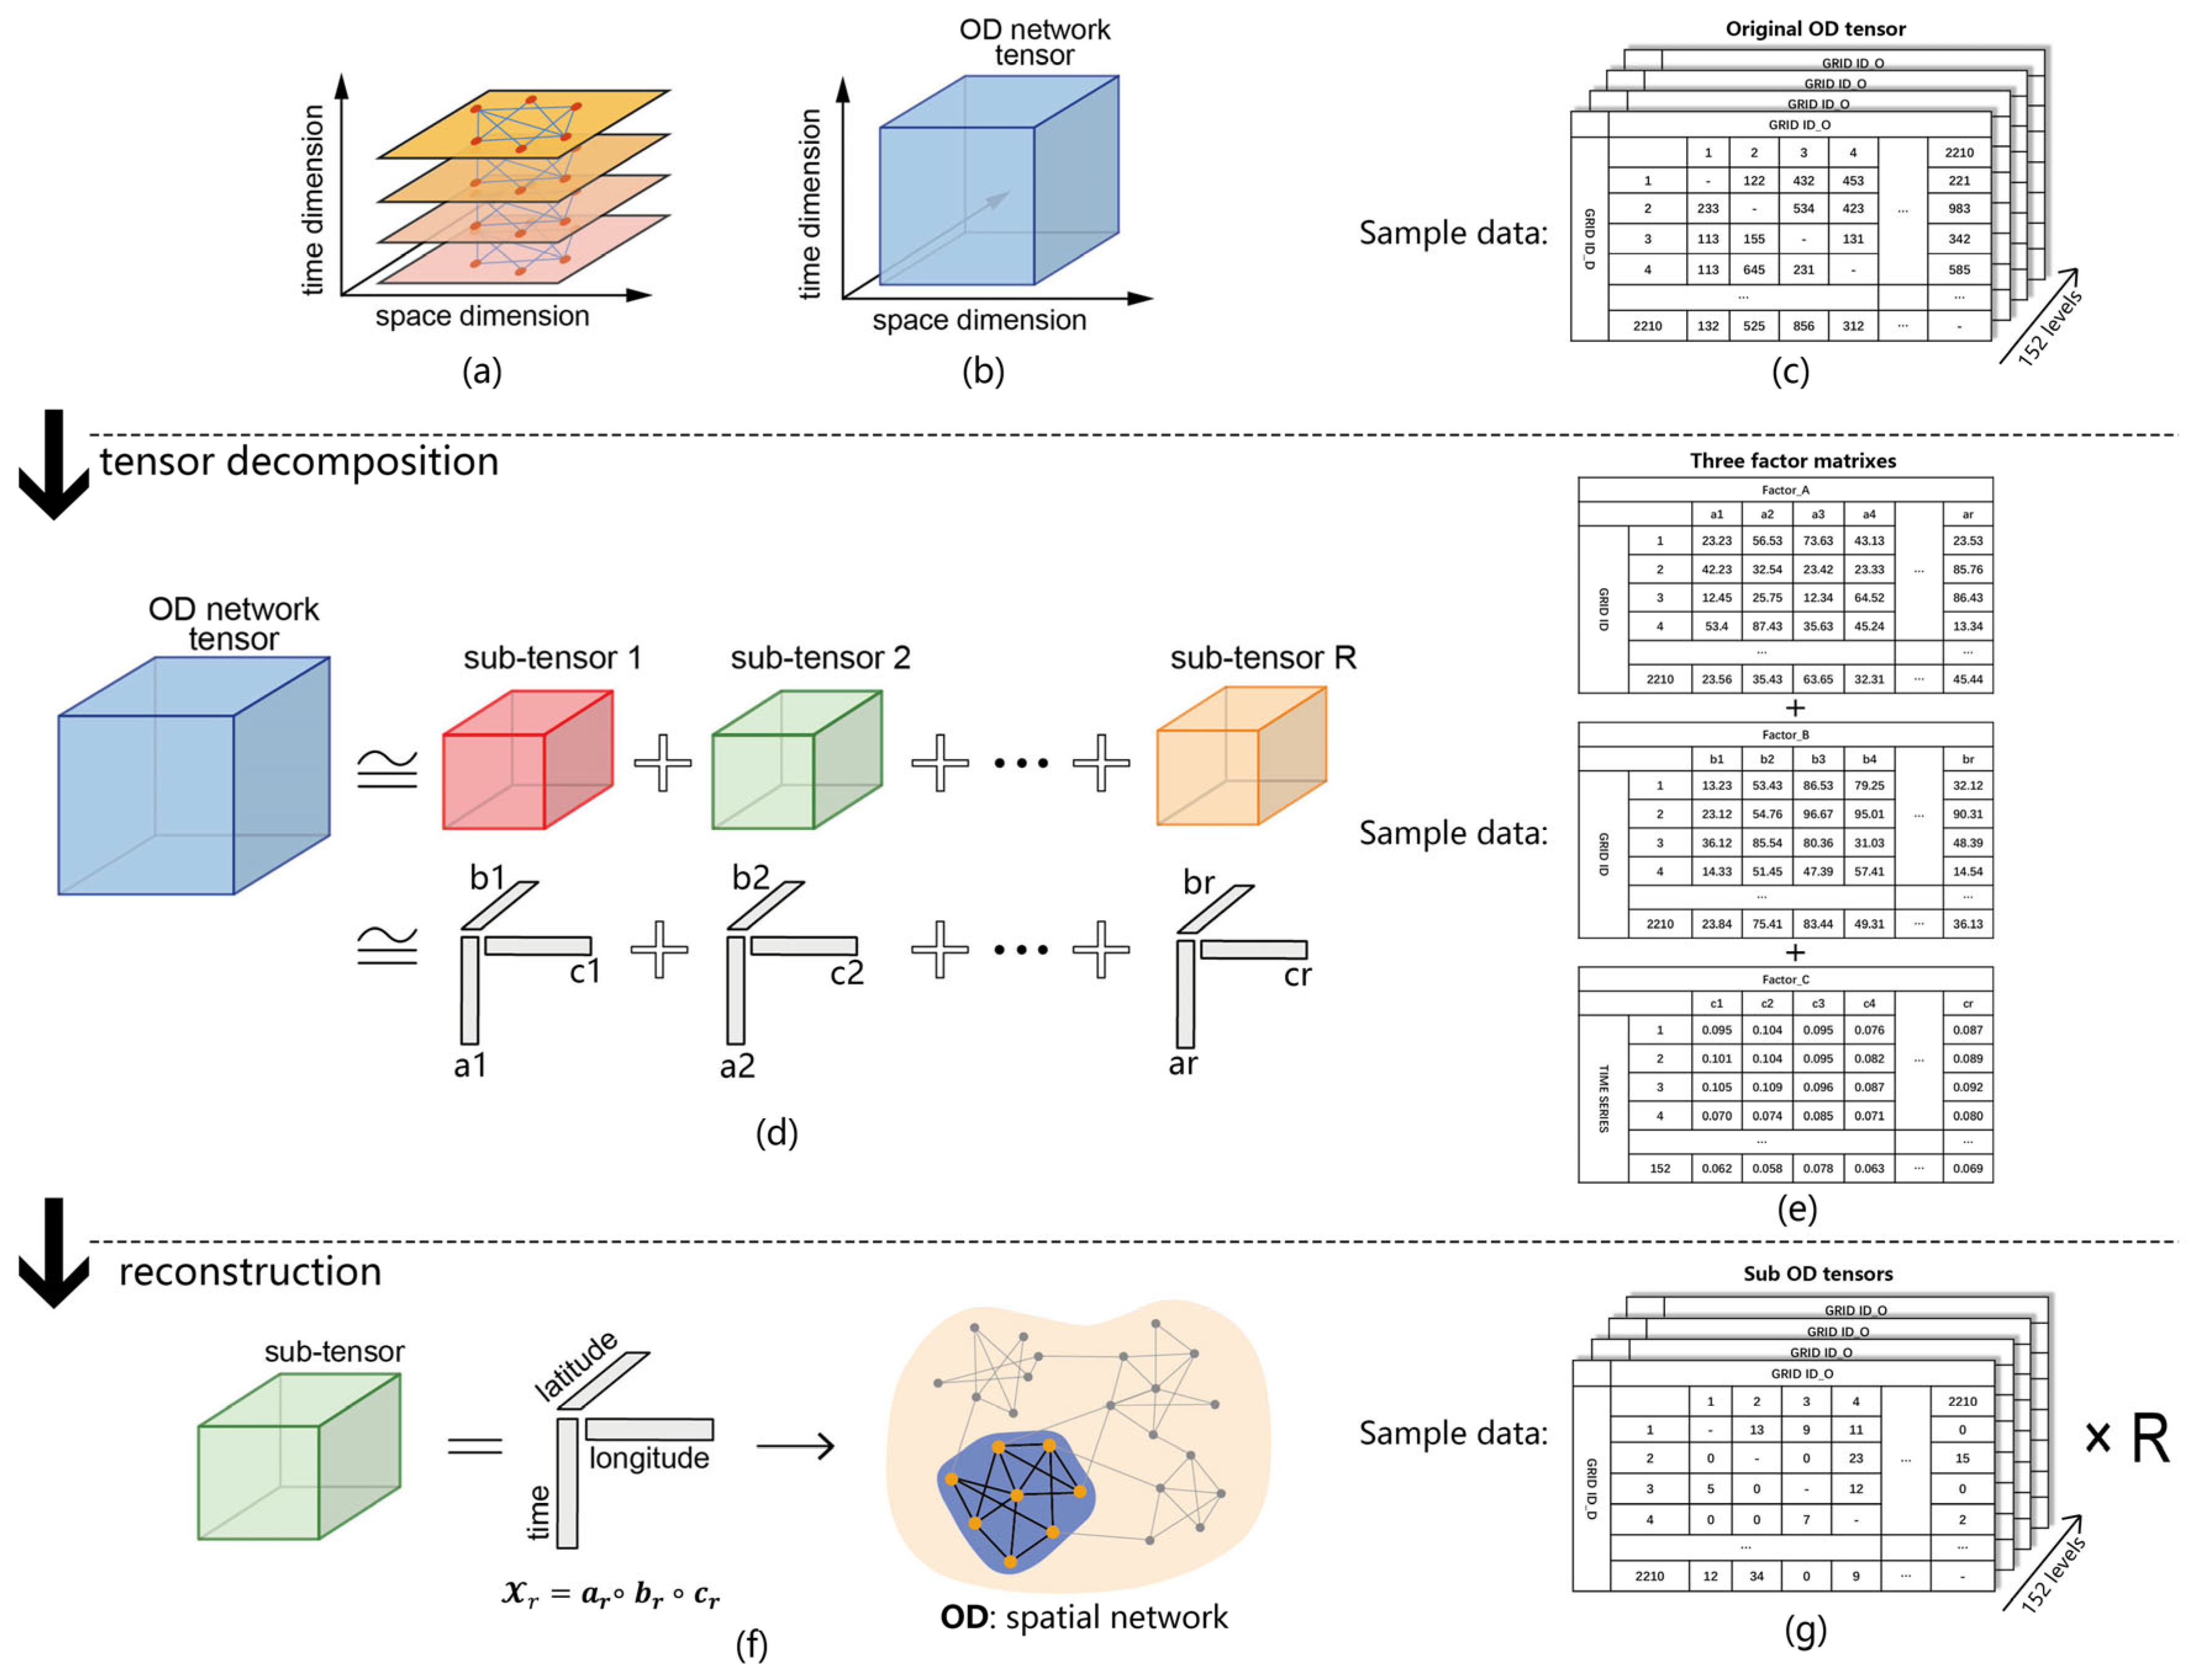
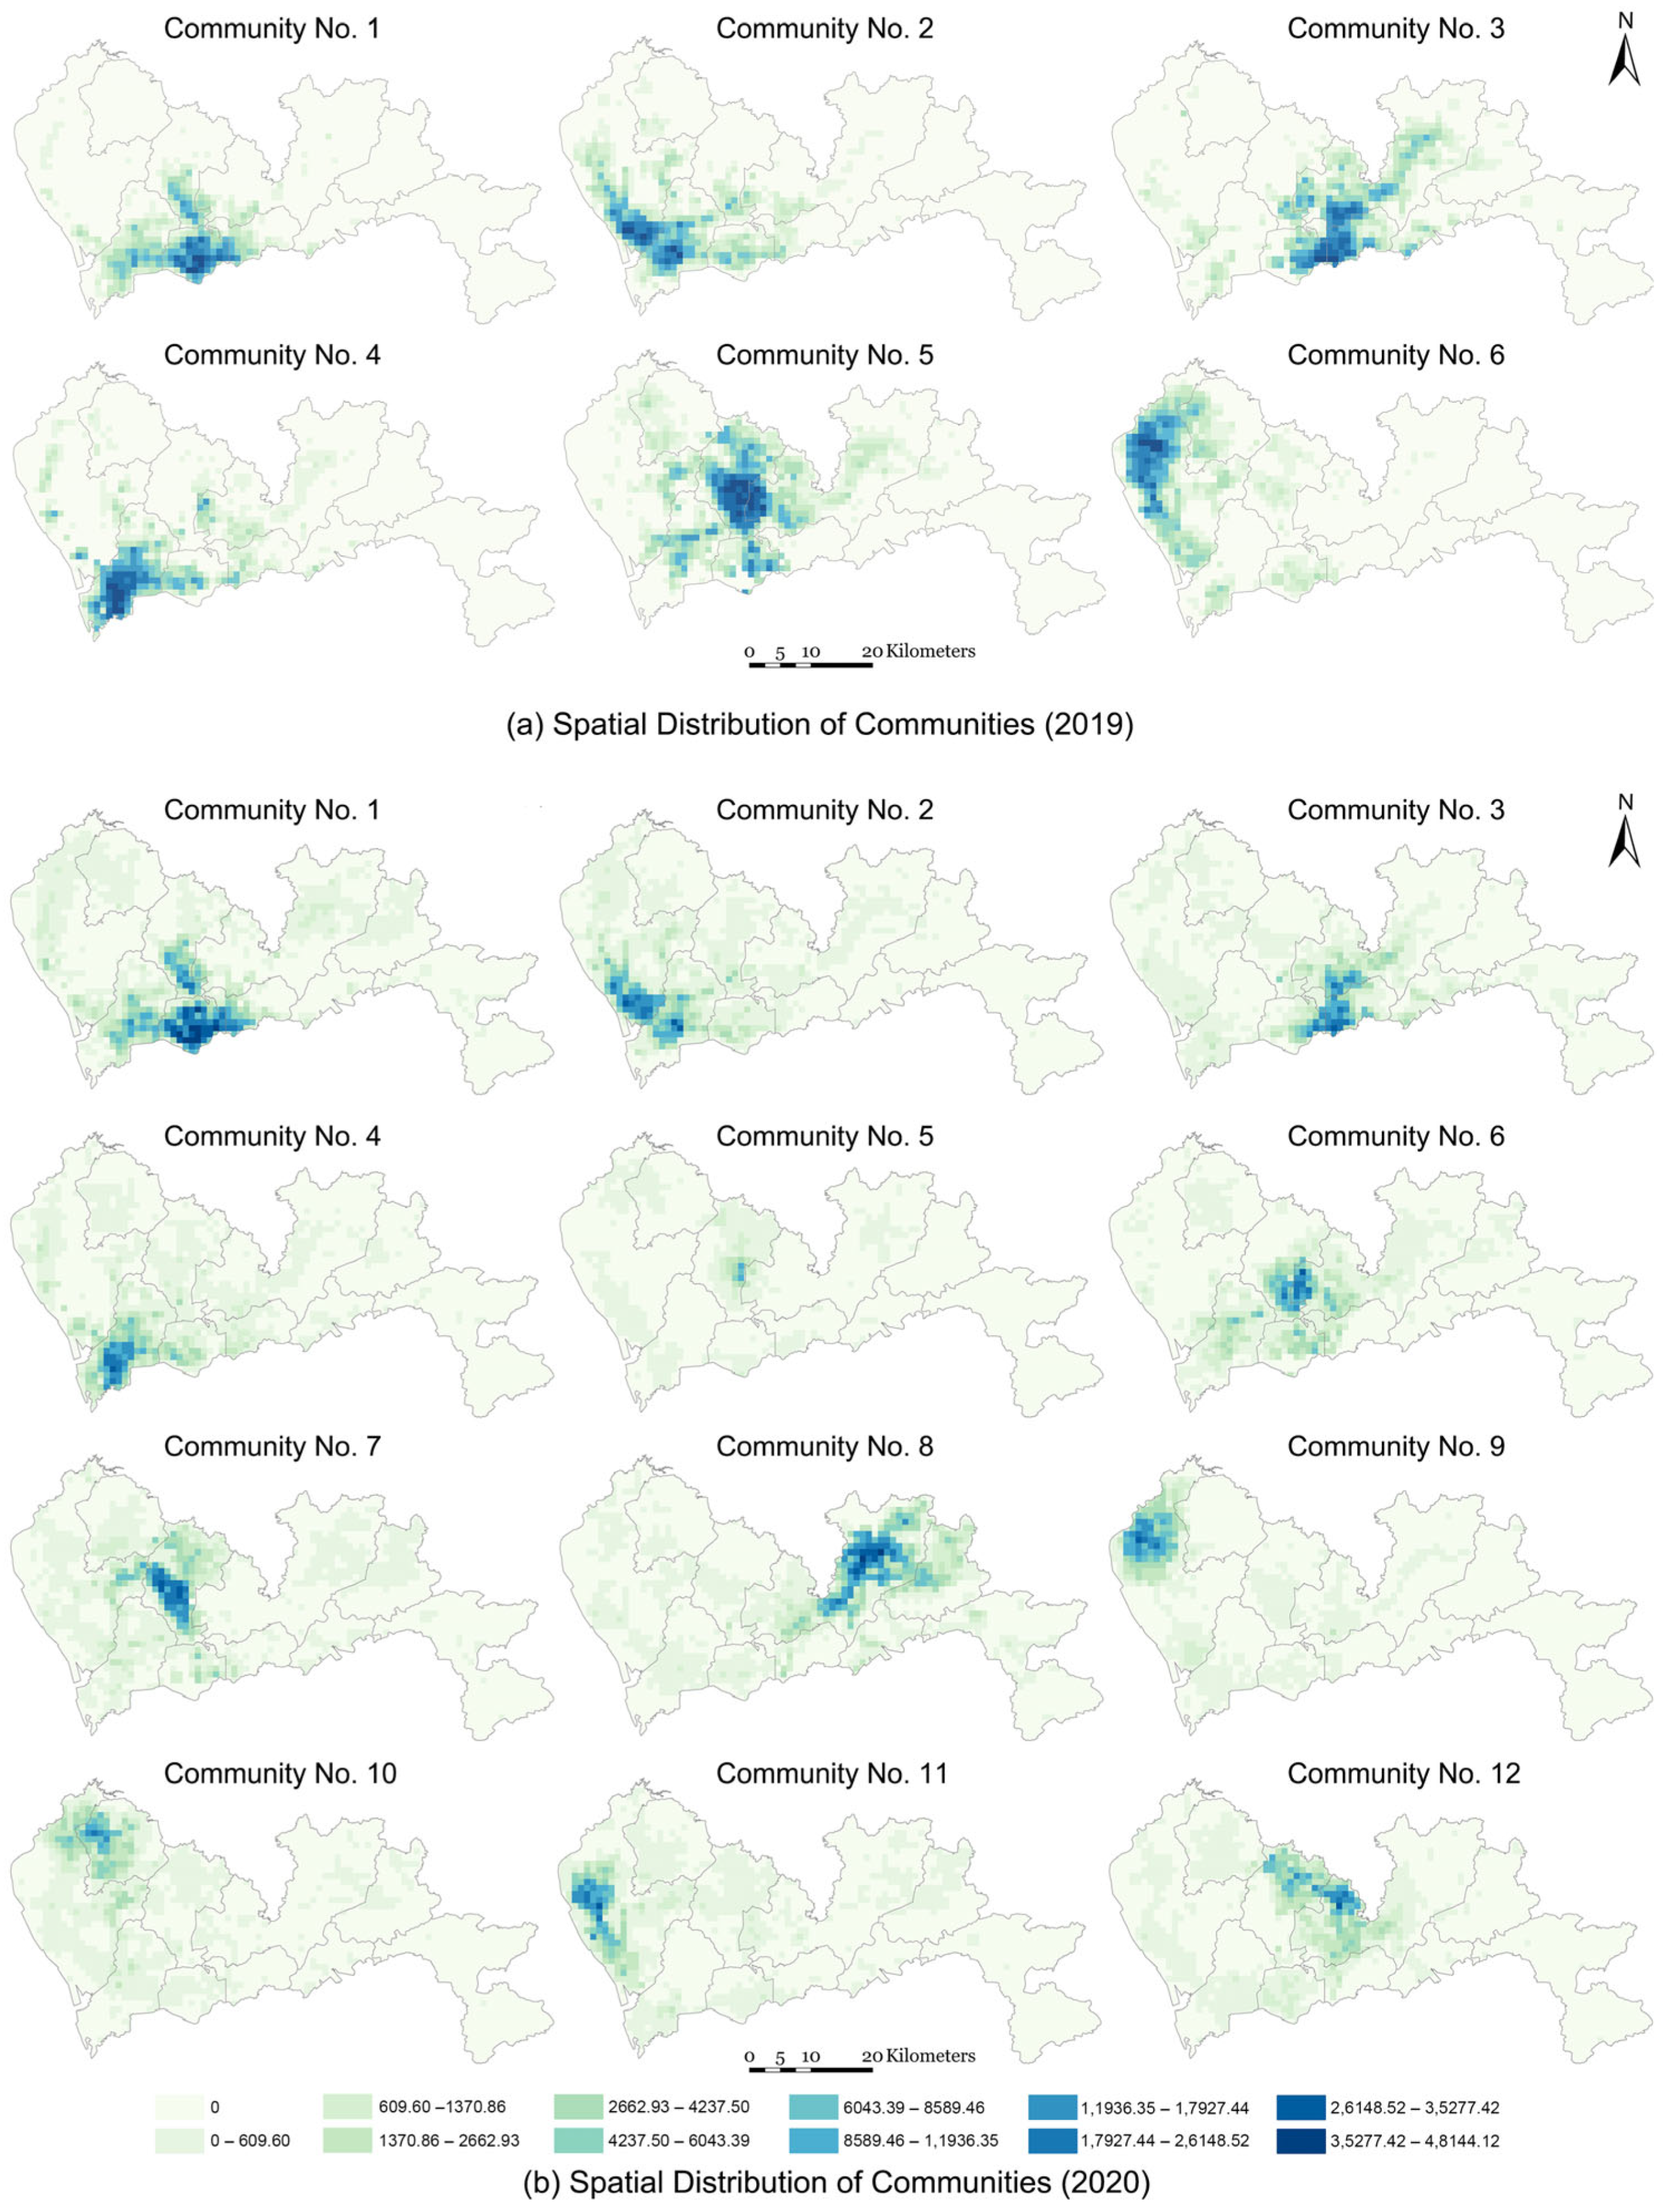
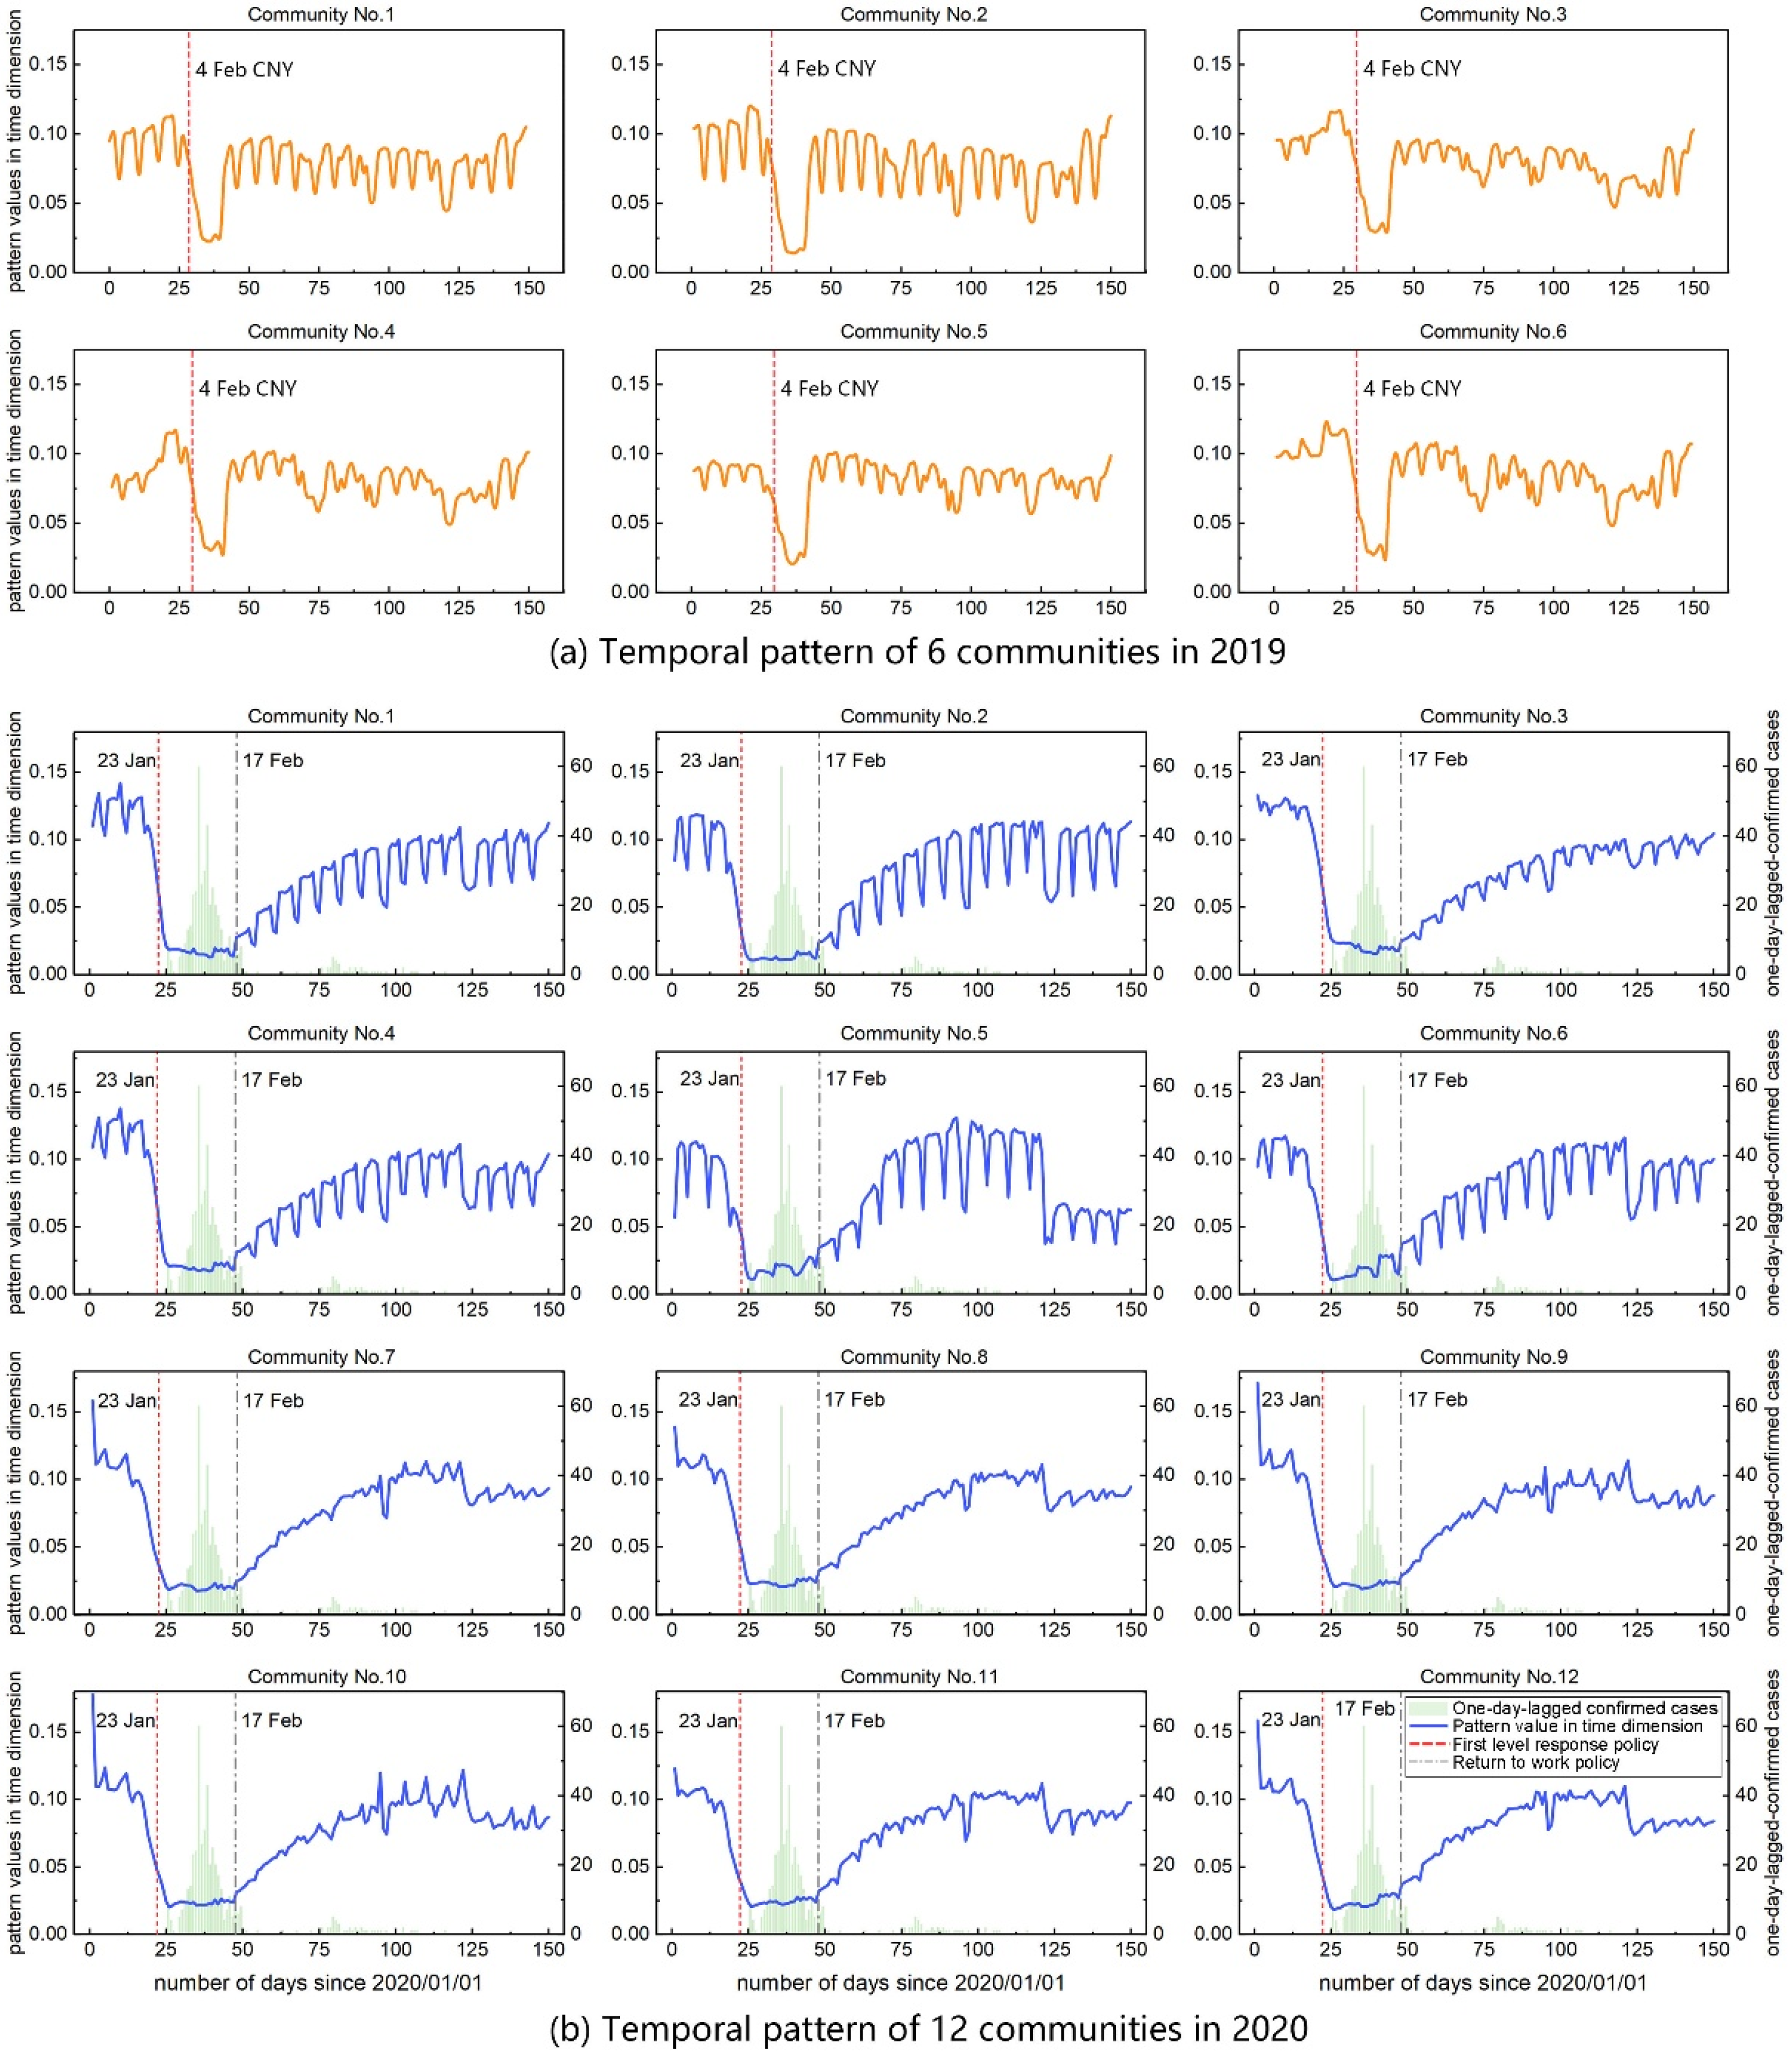
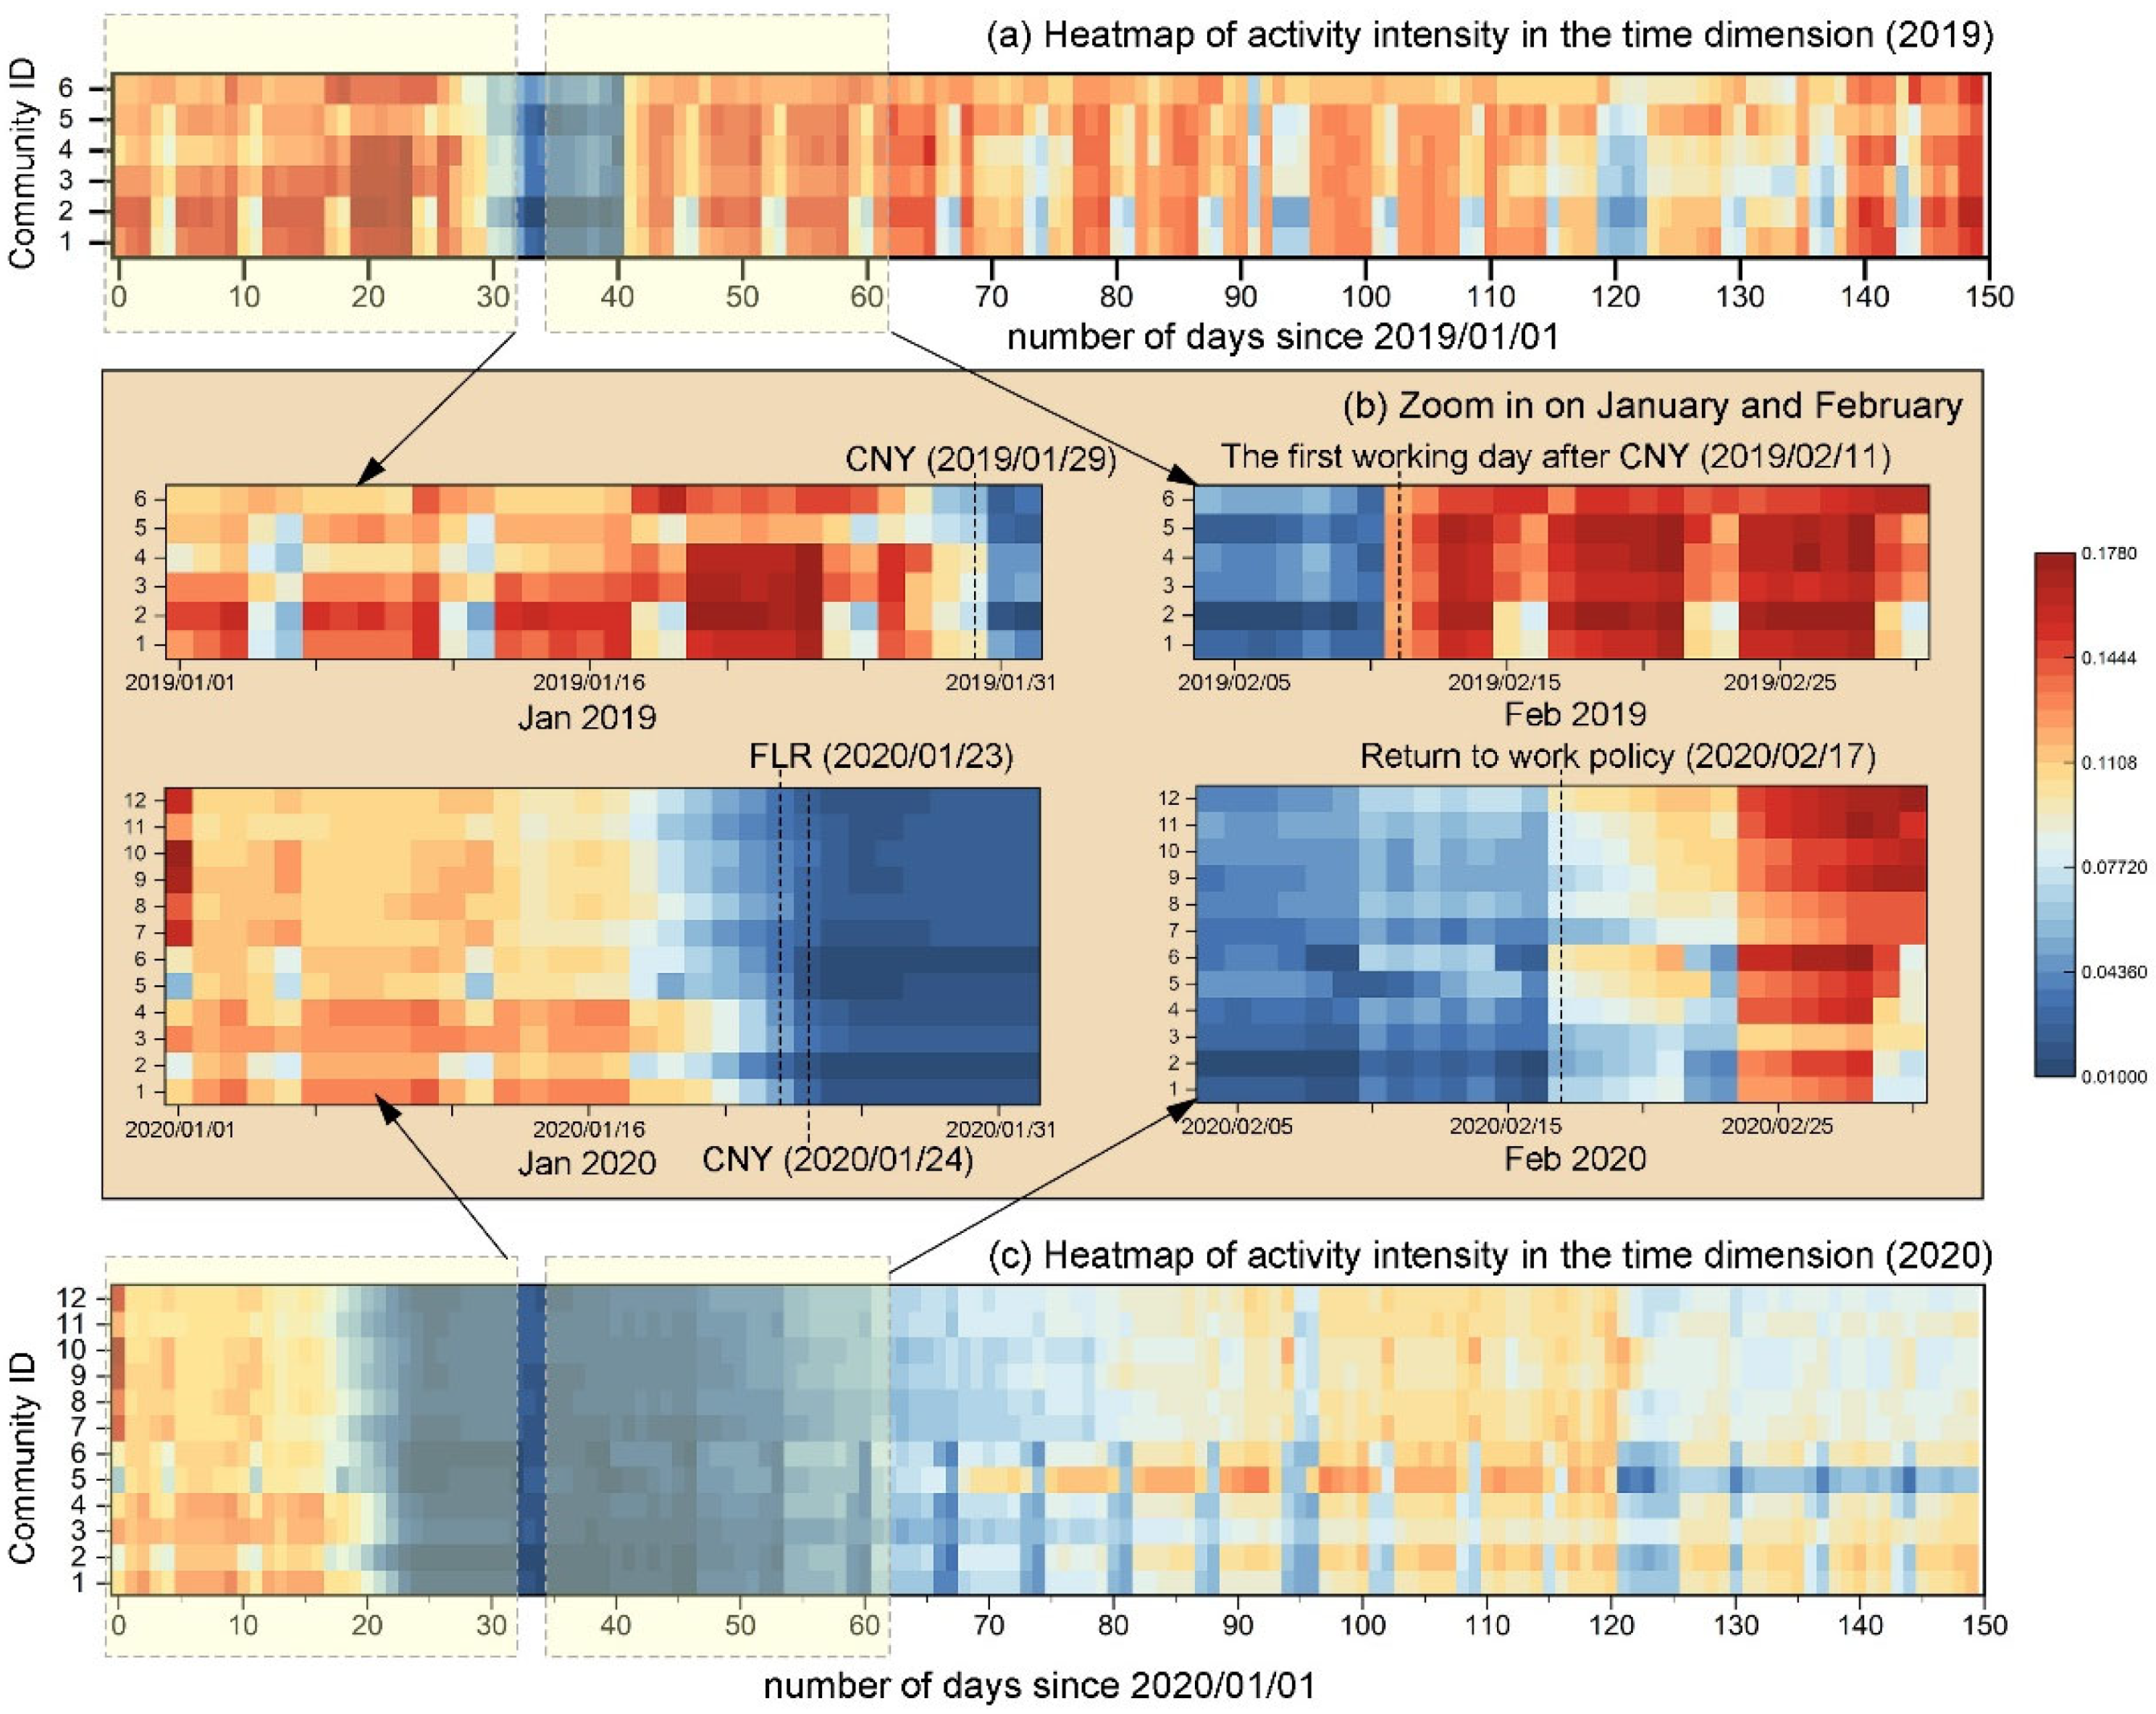
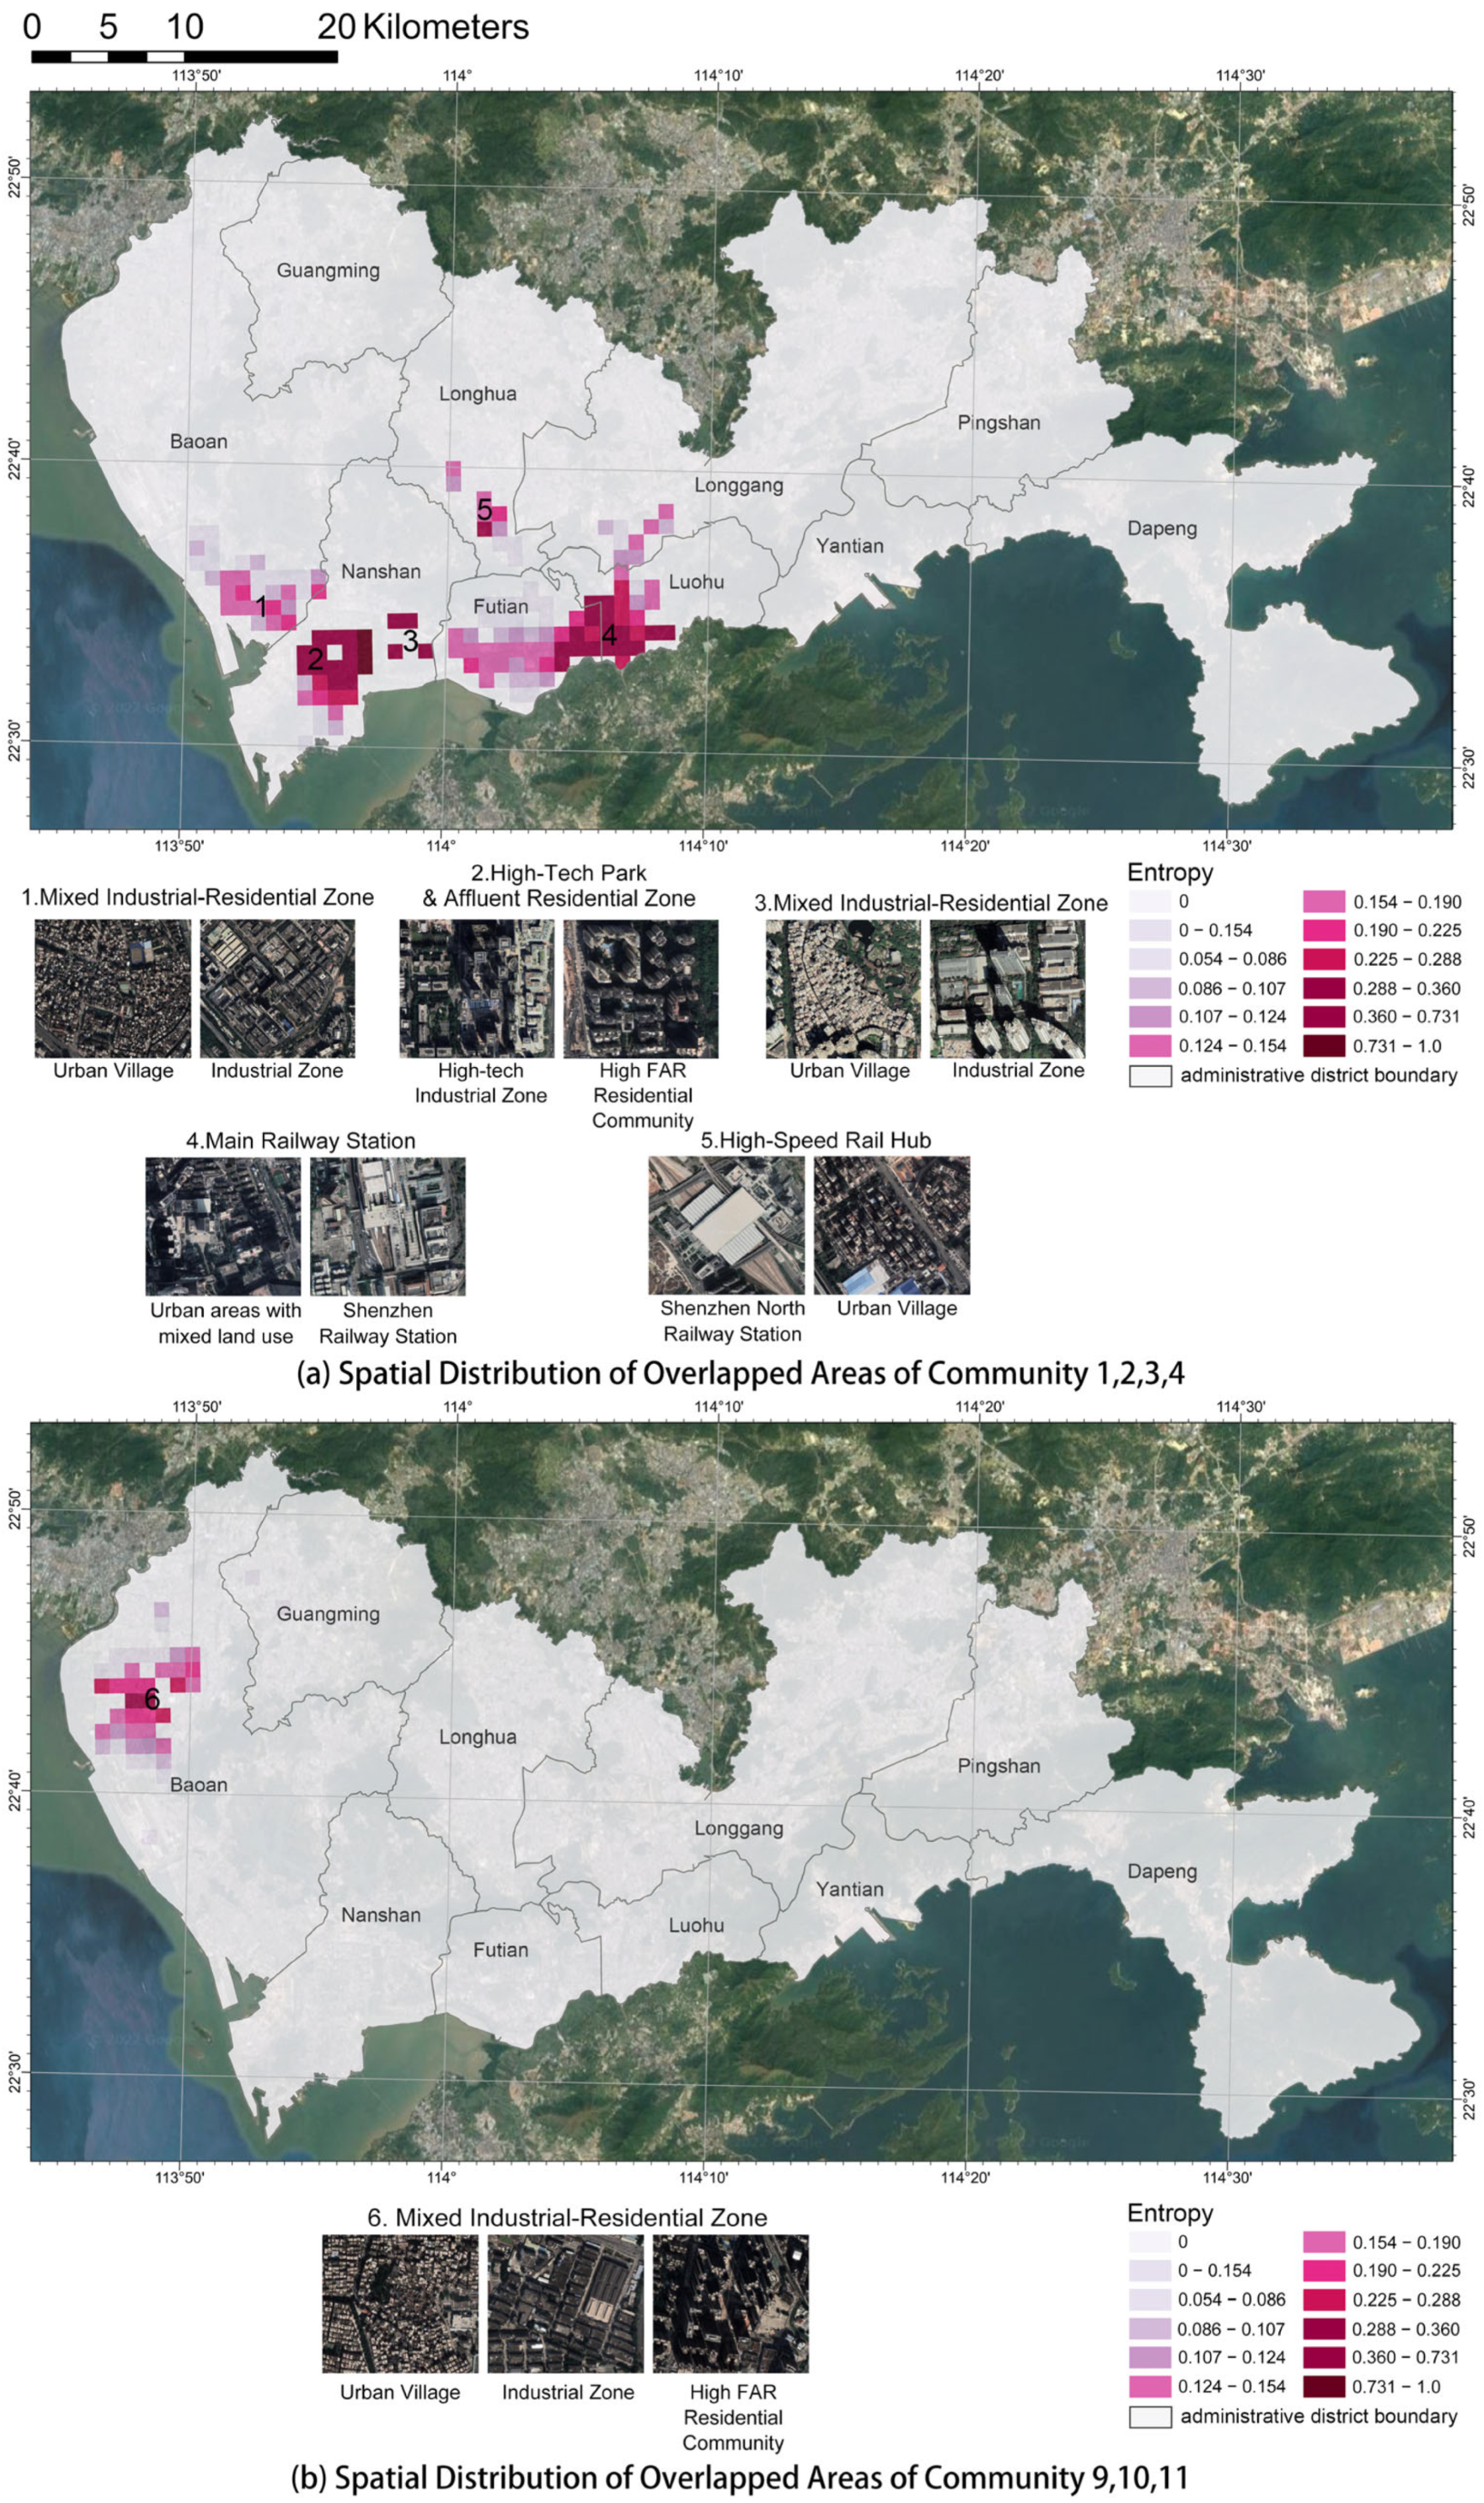
Disclaimer/Publisher’s Note: The statements, opinions and data contained in all publications are solely those of the individual author(s) and contributor(s) and not of MDPI and/or the editor(s). MDPI and/or the editor(s) disclaim responsibility for any injury to people or property resulting from any ideas, methods, instructions or products referred to in the content. |
© 2025 by the authors. Published by MDPI on behalf of the International Society for Photogrammetry and Remote Sensing. Licensee MDPI, Basel, Switzerland. This article is an open access article distributed under the terms and conditions of the Creative Commons Attribution (CC BY) license (https://creativecommons.org/licenses/by/4.0/).