Abstract
Heart disease remains the leading cause of death in both the United States and globally. Urban heat is increasingly recognized as a significant public health challenge, particularly in its connection to cardiovascular conditions. This study, conducted in Jefferson County, Kentucky, examines the distribution of coronary heart disease rates and develops an urban heat risk index to examine underlying socioeconomic and environmental factors. We applied bivariate spatial association (Lee’s L), Global Moran’s I, and multiple linear regression methods to examine the relationships between key variables and assess model significance. Global Moran’s I revealed clustered distributions of both coronary heart disease rates and land surface temperature across census tracts. Bivariate spatial analysis identified clusters of high heart disease rates and temperatures within the West End, while clusters of contiguous suburban tracts exhibited lower heart disease rates and temperatures. Regression analyses yielded significant results for both the ordinary least squares (OLS) model and the spatial regression model; however, the spatial error model explained a greater proportion of the variation in coronary heart disease rates across tracts compared to the OLS model. This study offers new insights into spatial disparities in coronary heart disease rates and their associations with environmental risk factors including urban heat, underscoring the challenges faced by many urban communities.
1. Introduction
Heart disease remains the leading cause of death in the United States, accounting for about 20.1% of all deaths in 2022 [1]. Heart disease is a broad term describing individuals with disorders regarding the heart and its related blood vessels [2]. The most prominent form is coronary heart disease, which is caused by the buildup of plaque within arteries, narrowing the space through which blood flows [3]. When this condition becomes aggravated, symptoms such as shortness of breath, fatigue, and chest pain are common; however, in more severe cases, it can lead to life-threatening events such as strokes, heart attacks, and heart failures [4].
The urban heat island (UHI) effect refers to a phenomenon in which urban areas experience significantly higher temperatures than their surrounding suburban and rural communities due to the high concentration of impervious surface [5]. Urban heat is increasingly recognized as a significant public health challenge, particularly in relation to heart disease. Elevated ambient temperatures place additional stress on the body as it works harder to regulate internal temperature [6]. For individuals with coronary heart disease or other cardiovascular conditions, this added strain can exacerbate symptoms, raise blood pressure, and increase the risk of heart attacks and strokes [7]. As a result, populations living in hotter, urbanized areas face a greater risk of cardiovascular-related hospitalizations and mortality, especially during heat waves [8]. Research indicates that communities of color and low-income neighborhoods are disproportionately exposed to urban heat, as they are often concentrated in the urban core [9,10], where tree coverage is limited and poverty rates are high. Existing studies suggest that global warming and climate change may further exacerbate urban heat island effects [11,12,13] and their associated health impacts. The threats posed by the urban heat island effect represent a significant public health concern. Therefore, the capacity of communities to adapt to and mitigate extreme heat should be considered a critical factor in safeguarding residents’ health.
When combined with other environmental factors, health conditions such as heart disease can become aggravated [7,14,15,16]. Studies have linked elevated rates of heart disease with traffic noise [17], air pollution [18], light pollution [19], and high temperatures [20]. These environmental risk factors can amplify the adverse health effects associated with exposure to urban heat [21]. Moreover, they contribute to hazardous living conditions for vulnerable populations, particularly individuals with pre-existing health conditions [22,23].
Louisville was selected as the study area because a national study previously ranked it among the top cities affected by urban heat [24]. The Louisville Metro, which encompasses Jefferson County, Kentucky, faces not only significant urban heat challenges but also stark spatial socioeconomic disparities. The West End and downtown areas remain highly segregated from the rest of the county [25], and these neighborhoods experience compounded environmental stressors, including intense urban heat [24] and elevated pollution levels [26]. The convergence of extreme poverty, segregation, and environmental burdens creates a heightened risk of life-threatening health outcomes for residents living in socially and physically vulnerable communities [27,28].
This study builds upon the existing literature to examine the spatial patterns of heart disease and its relationship with environmental risk factors, with a particular emphasis on urban heat island effects. Centered on the city of Louisville and the broader context of Jefferson County, Kentucky, the research investigates disparities in heart disease rates and identifies the high-risk tracts for vulnerable populations. It is hypothesized that heart disease rates within Jefferson County are unevenly distributed. Furthermore, the study posits a strong positive correlation between heart disease rates and environmental risk factors.
2. Materials and Methods
2.1. Study Area
This study was conducted in Jefferson County, Kentucky, which had an estimated population of 793,881 as of 1 July 2024 [29]. Louisville, the largest urban center within Jefferson County, serves as the primary focus for examining variations in urban heat island temperatures. Census tract boundaries, obtained from the TIGER Line database, were used as the geographic unit of analysis; Jefferson County consists of 216 tracts of which 213 were used for analysis allowing for detailed comparisons of variables across all tracts as well as displaying the disparities within the county effectively. Tracts 35.01, 115.18, and 9801 were excluded from the statistical analyses due to the unavailability of the data for these tracts.
2.2. Cardiovascular Data
Data on coronary heart disease (CHD) rates were collected from the 2024 release of the U.S. Centers for Disease Control and Prevention (CDC) PLACES (Population Level Analysis and Community Estimates) database, which uses the 2022 national Behavioral Risk Factor Surveillance System, (BRFSS) data to generate tract-level estimates. CDC applied a multilevel regression with post-stratification (MRP) technique to assess the probability that adults had ever been diagnosed with a variety of health outcomes including coronary heart disease. We were able to download data on coronary heart disease prevalence rates for 215 census tracts in Jefferson County [30]. To evaluate the quality and reliability of the CDC PLACES released data, we calculated the coefficients of variation (CV) for CHD values (Formula 1) for each census tract, following the method used by the American Community Survey. MOE in the equation represents the margin of error associated with CHD data, 1.96 represents the associated z score for the 95% confidence interval. ESTIMATE represents the CHD value for each tract. This is then converted to a percentage by multiplying by 100. (Appendix A.1). The CVs for all 213 census tracts were below 12%, indicating high reliability of the CDC PLACES estimated data on CHD at the tract level.
2.3. Underlying Conditions and Socioeconomic Data
Data on cholesterol and obesity prevalence were also obtained from the PLACES database. Both obesity and high cholesterol are well-established risk factors for the development of heart disease and often are comorbid with heart disease, presenting compound health risks for patients with heart disease and one of these factors. Socioeconomic factors including percentage of the population below the federal poverty line and the percentage of the population aged 65 and older were obtained from the American Community Survey (ACS) 2018–2022 estimates [31]. CVs for cholesterol and obesity rates were calculated using Formula (1) (Appendix A.2 and Appendix A.3) to evaluate their reliability of these estimates. To evaluate the quality of ACS sample data, CVs for poverty rates and population aged 65 and older were calculated using Formula (2) as ACS data employs 90% confidence intervals (Table 1).

Table 1.
Categorization of coefficients of variation for ACS data.
2.4. Land Surface Temperature Data
Land surface temperatures were calculated from Landsat 9 Band 10 imagery. This imagery has a spatial resolution of 30 m as well as a wavelength between 10.6 and 11.19 μm. The imagery is from the week of 15 June 2023 to 20 June 2023 consisting of two images the first containing data for the western portion of Jefferson County and the second containing data for the eastern portion of Jefferson County. This period was chosen as it had minimal cloud coverage allowing for optimal temperature readings while also being within the summer providing measure for the hottest portion of the year. Temperatures (in Celsius degrees) were calculated using the following formula provided by NASA ARSET [32]:
LST = V × 0.00341802 + 149 − 273.15
V is the value of a pixel in our raster image; this value is then multiplied by a scale factor of 0.00341802. A constant value of 149 was then added to convert the result to temperature in Kelvin. We then subtracted 273.15 to convert the temperatures to Celsius. Average temperatures for the week of June 15–20 were then calculated for each census tract throughout the county. Using zonal statistics in ArcGIS, we computed the mean temperature for each tract based on the temperatures from Landsat Band 10. This approach allowed for spatially detailed temperature analysis aligned with demographic and health data.
2.5. Tree Canopy Data
Tree canopy data were collected from the 2021 National Land Cover Database, which provides the percentage of tree coverage in a raster format. This dataset enables identification of both cooler areas and built areas with low canopy. To use these data for our model, the percentage of lack of tree canopy was calculated using the following formula [32]:
LTC = 100 − C
LTC stands for lack of tree canopy, where 100 is the maximum canopy coverage and C is the percentage of canopy coverage. The percentage measure of no canopy, rather than tree canopy, was used to align with other health risk factors in generating a composite heat vulnerability index (HVI), where higher values indicate more vulnerable areas and lower values represent less vulnerable places.
2.6. Composite Heat Vulnerability Index for Heart Disease
A composite HVI was developed using the methods provided by NASA ARSET’s Heat Indices for urban heat island (UHI) training [32]. This composite index takes in social, environmental, and health factors to create a composite index to determine UHI risk levels at varying geographic levels.
The HVI index grouped variables according to categories used in NASA ARSET’s model: exposure, sensitivity, and adaptive capacity (Table 2). In this study, we used two exposure variables that represent built-up environmental factors, including lack of tree coverage and land surface temperature. Sensitivity variables are underlying health conditions, encompassing high cholesterol, and obesity, which make individuals more vulnerable to heat waves. Adaptive capacity variables represent the abilities for populations to adapt to their surrounding conditions [33]; this study particularly uses socioeconomic variables, including the proportion of population aged 65 and older and those living below the poverty line, in order to represent adaptive capacity, which can further exacerbate the effects of exposure and sensitivity factors (Figure 1).

Table 2.
Urban heat vulnerability index categories and associated variables.
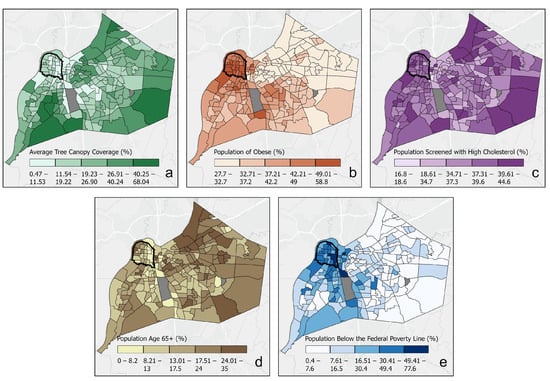
Figure 1.
Maps for urban heat vulnerability variables. (a) Tree canopy coverage %, (b) population suffering from obesity, (c) population screened with high cholesterol, (d) population aged 65+, (e) population below the federal poverty line. Tracts in gray were excluded due to unavailability of data. The black line represents the West End.
Z scores for each of the HVI variables were calculated for each individual tract. Tracts were then assigned scores based on the method outlined in Table 3. In general, larger Z scores for explanatory variables correspond to higher the composite HVI scores, and vice versa.

Table 3.
Heat vulnerability index scoring.
With each tract having its corresponding score for each variable, the composite HVI was developed. A simple formula was used to calculate the weighted composite index of all variables for each tract, allowing us to see the tracts at the highest risk. The equation below is adopted from the NASA ARSET’s Heat Indices for UHI training [32]:
AC represents adaptive capacity index scores, E represents the exposure index scores, and S represents the sensitivity index scores. Each of these are then summarized and divided by the number of variables used for each category, represented by the count of AC, E, and S. Once each individual piece was completed, all equally weighted scores were added together to come up with the composite HVI score for each census tract.
2.7. Estimating Associations Between Urban Heat and Heart Disease
To examine the spatial relationship between coronary heart disease rates and urban heat three steps of spatial analyses were conducted. First, we created choropleth maps and ran Global Moran’s I (using Queen or contiguity edges corners) to diagnose the spatial patterns of heart disease rates and land surface temperature across census tracts. Global Moran’s I is a statistical measure used to assess whether similar values (e.g., high temperatures, disease rates) are clustered, dispersed, or randomly distributed across space [43].
Second, we performed a bivariate spatial association (Lee’s L) analysis with Queen contiguity using ArcGIS Pro. Lee’s L is a novel tool that enables the examination of the spatially varying relationships between coronary heart disease incidence and land surface temperatures across a study area. Different than the commonly used global Pearson’s correlation coefficient, Lee’s L is a local spatial association statistic. It helps identify areas where high or low values of one variable (e.g., heart disease rate) are spatially associated with high or low values of another variable (e.g., urban heat). The Lee’s L statistic is calculated by combining neighborhood averages of both temperature and coronary heart disease rates and then applying spatial smoothing scalars for each variable. Lee’s L provides a measure indicating how correlated both variables are while also incorporating the spatial element indicating the similarities of clustering between both variables. This adds to the Pearson correlation as it incorporates spatial autocorrelation within the correlation calculation [44,45].
Lastly, we performed ordinary least square (OLS) and spatial regression models to explore the associations between the urban heat risk factors and coronary heart disease rates across the census tracts in Jefferson County. The spatial regression model was used to address the issue of clustering patterns among OLS residuals, which violates the basic assumption of linear regression if identified.
3. Results
3.1. Geographic Distribution of Coronary Heart Disease and Land Surface Temperature
Coronary heart disease prevalence varied widely across Jefferson County census tracts, ranging from 1.8% to 15.9% with a mean of 7.6%. A Global Moran’s I of 0.325 (p < 0.001) indicated the prevalence rates were spatially clustered. High concentrations were identified in the West End of Louisville extending towards the southwestern portion of the county (Figure 2a). In contrast, prevalence in the eastern portion of the county was comparatively low and more evenly distributed. It is notable that the urban core appeared to have significantly higher prevalence rates than that of suburban and rural counterparts.
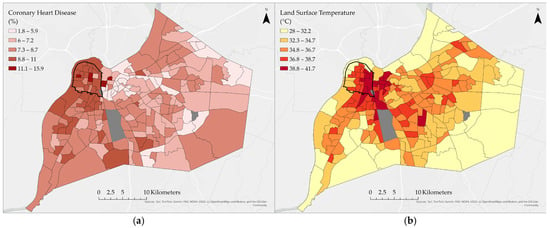
Figure 2.
(a) Distribution of coronary heart disease rates across Jefferson County census tracts, (b) distribution of land surface temperature across Jefferson County census tracts with West End circled in black line. Gray tracts represent excluded tracts due to a lack of data.
Average land surface temperatures (LSTs) across census tracts ranged from 28.0 °C to 41.7 °C, with a mean of 35.4 °C. LSTs had stronger clusters than CHD rates; this is indicated by a Global Moran’s I of 0.455 (p < 0.001). Highest temperatures were found in the urban core and its surrounding neighborhoods as well as tracts near the airport (Figure 2b). Elevated temperatures also extended across central residential and commercial areas, particularly where tree canopy was limited. Lower LSTs were found in suburban and rural tracts located farther away from the urban core.
When comparing the two distributions, both CHD prevalence and LST were elevated in the West End (circled area on map in dark line), downtown, and near the airport, indicating the overlapping geographic patterns.
3.2. Spatial Association Between Coronary Heart Disease and Land Surface Temperature
Results from Lee’s L local bivariate spatial association (Figure 3) revealed distinct geographic patterns linking CHD prevalence and LSTs. In the West End, significant high–high clusters were identified, indicating that census tracts with elevated temperatures also experienced higher CHD rates and were spatially clustered. Conversely, the East End exhibited large low–low clusters, where suburban and rural tracts were characterized by both lower temperatures and lower CHD prevalence. More complex relationships emerged in other parts of the county: in portions of the East End, high temperatures were spatially associated with comparatively low CHD rates (high–low associations), while in southwestern tracts, low temperatures coincided with elevated CHD prevalence (low–high associations). These results demonstrate that while CHD and LST often overlap spatially, the relationship is not uniform across Jefferson County and varies depending on local social and environmental context.
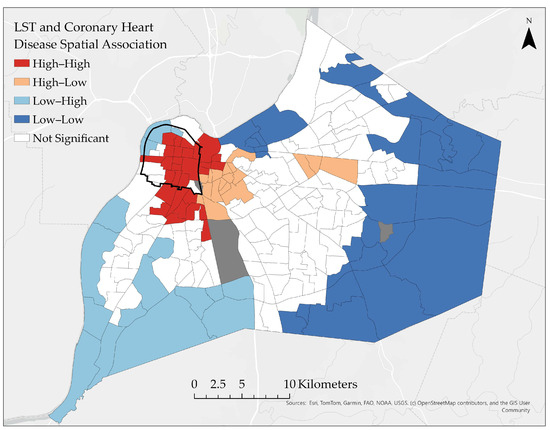
Figure 3.
Bivariate spatial association (Lee’s L) between land surface temperature and coronary heart disease. Gray tracts represent excluded tracts due to a lack of data.
3.3. Determining the Relationship Between Heart Disease and the Heat Vulnerability Index
The geographic distribution of the heat vulnerability index followed a similar pattern to CHD and LST (Figure 4). Index values ranged from 8 to 17, with the highest-risk tracts being concentrated in the downtown area, the West End, and around the airport. Lowest-risk areas were concentrated in the suburban and rural tracts in the eastern portion of the county.
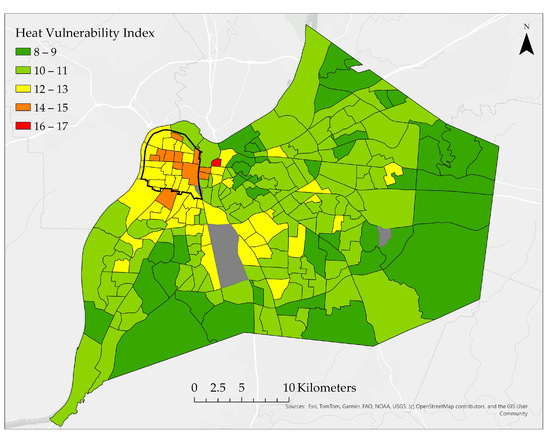
Figure 4.
Heat vulnerability index for census tracts within Jefferson County, KY. Gray tracts represent excluded tracts due to a lack of data.
3.4. Comparison of Ordinary Least Squares and Spatial Error Regression Models
Descriptive statistics show the range of values for each variable included in the regression modeling (Table 4). Ordinary least squares regression resulted with an adjusted R2 of 0.886 indicating the model represented approximately 88.6% of the total variance in CHD prevalence rates (Table 4). The significant Moran’s I across the OLS residuals (0.120, p < 0.001) indicates spatial clustering, suggesting that the residuals are not randomly distributed. The spatial autocorrelation violates the assumptions of OLS regression and can be addressed by applying a spatial regression model—specifically, a spatial error model. The spatial error model accounts for spatial autocorrelation by modeling the error term as a function of spatially lagged errors, which was reflected by its significant coefficient (0.323, p <0.001) (Table 5). The spatial error model yielded an adjusted R2 of 0.896, indicating improved model performance compared to the OLS regression. For both models, significant associations were identified between CHD and obesity, high cholesterol, poverty, and age 65 and above. However, land surface temperature and lack of tree canopy were found to be insignificant, given the fact that both were found to be positively associated with CHD prevalence in the OLS and spatial error model.

Table 4.
Descriptive statistics for dependent and independent variables in regression analysis (n = 213).

Table 5.
Ordinary least squares and spatial error regression results.
4. Discussion and Conclusions
4.1. Study Findings and General Considerations
This case study examined geographic disparities in coronary heart disease (CHD) rates across census tracts in Jefferson County, Kentucky, and their associations with exposure to extreme environmental conditions—particularly urban heat. Spatial analysis techniques, including choropleth mapping, Moran’s I, local bivariate spatial association, and spatial regression models, were employed to explore these relationships. The results revealed significant clustering of elevated CHD rates and higher land surface temperatures (LSTs) in urban tracts, most notably within the downtown and West End neighborhoods.
To better capture these dynamics, a heat vulnerability index (HVI) was developed to identify the highest-risk regions within Jefferson County. Regression analysis indicated that the strongest predictors of increased CHD prevalence were high cholesterol and obesity rates. In contrast, environmental variables such as tree canopy coverage and LSTs showed weaker and statistically insignificant associations. However, the spatial error model suggested that other variables may be missing from the analysis, as the results exhibited spatial clustering—pointing to underlying factors influencing the distribution of CHD prevalence.
The geographic patterns of CHD and LSTs reinforce concerns that residents of the downtown and West End neighborhoods face a compounded burden of elevated CHD prevalence, socioeconomic disadvantage, and disproportionate exposure to environmental stressors. For individuals already living with CHD, extreme heat can pose life-threatening risks, including increased likelihood of heart attacks and strokes. These findings underscore the urgent need for further investigation into whether the observed environmental and social conditions contribute to higher rates of heart-related hospitalizations in these vulnerable areas.
4.2. Methodological and Data Considerations
While the results of this study contribute meaningfully to the existing literature on urban heat and public health, several limitations must be acknowledged. First, the use of proxy variables—specifically tree canopy coverage and land surface temperatures (LSTs)—poses challenges. Both are derived from satellite data and may not accurately reflect the actual conditions experienced by individuals on the ground. These measures were aggregated at the census tract level, representing average values across all pixels within each tract. In larger tracts, this aggregation could obscure localized variations and misrepresent the environmental exposure of residents.
Moreover, these methods do not account for where populations primarily reside within a tract or the specific areas where individuals spend most of their time. Incorporating land-use classifications—such as residential, industrial, or commercial zones—could improve the accuracy of exposure assessments. Another limitation is the temporal scope of the LST data, which was based on a single week in July. A more comprehensive measure, such as an annual average, would better capture the typical heat exposure experienced by populations.
Finally, several variables used in the regression models and the heat vulnerability index do not follow a normal distribution, violating assumptions of normality and potentially affecting the robustness of statistical analyses. These limitations highlight the need for more granular, temporally diverse, and population-sensitive data in future research.
Another major data limitation involves the American Community Survey (ACS), particularly regarding poverty rates and the population aged 65 and older. Based on calculated coefficients of variation (CVs), the majority of census tracts fell within the medium-risk category. Of the 213 tracts analyzed, only 1.4% of poverty estimates were deemed reliable, while 71.3% were classified as medium risk and 27.2% as high risk. For aged population estimates, 11.7% were reliable, 81.7% medium risk, and 1.87% high risk. These findings raise concerns about data integrity, as ACS methods include margins of error that could significantly distort the true values—especially in high-risk tracts—potentially affecting the accuracy of the model.
Similarly, CDC PLACES data present limitations, as the data provide modeled estimates rather than actual rates for variables such as cholesterol, obesity, and CHD. This introduces uncertainty, as the estimated values may differ from true population measures, echoing the reliability concerns associated with ACS data.
The heat vulnerability index (HVI) serves as a valuable tool for visualizing areas at highest risk for CHD-related hospitalizations. However, the model itself has statistical limitations. All variables were equally weighted in the HVI calculation, which may dilute the influence of more impactful predictors—such as obesity and cholesterol—while amplifying the effects of less significant variables like LSTs and tree canopy coverage, as indicated by the regression results. Despite these limitations, the HVI remains an important conceptual visualization tool for policymakers. It enables the identification of high-risk areas within Jefferson County and can guide the development of targeted policies and climate resilience initiatives aimed at protecting vulnerable populations.
4.3. Result Interpretations and Contributions
The significant positive relationships between CHD and poverty, age 65+, obesity, and high cholesterol aligns with much of the literature previously conducted for coronary heart disease indicating them as risk factors for the development of coronary heart disease [46]. This aligns with our results having significant and positive associations with CHD. Socioeconomic variables such as poverty rates and age displayed significant and positive associations with coronary heart disease. For poverty our findings are congruent with the study from the American Heart Association in which socioeconomic status was studied and how this affects cardiovascular outcomes. Poverty results in disadvantaged communities not being able to purchase healthy foods or have the ability to easily reach a grocery store, preventing populations from being able to obtain healthy foods, thus contributing to increased heart disease rates [47]. Incorporation of the poverty variable helped to model the economic condition in which populations may not be able to afford or access healthy foods as a result which resulted in a significant positive association with CHD. Regarding age, this factor was incorporated to help incorporate aging communities, specifically in understanding how human lifespans can contribute to the development of CHD due to long-term exposure to various physical, dietary, and environmental conditions. The significant and positive association aligns with findings presented in the Journal of Cardiovascular Development and Disease which found that age can make it significantly easier for CHD to develop due to individual weakening bodies, thus increasing the risk for CHD in elderly populations [48].
The results for our environmental variables within this study are not congruent with the current literature, specifically in that LSTs and tree canopy proved to be insignificant and have almost little to no association with CHD prevalence rates. These results differ from many studies specifically stating that coronary heart disease rates are typically agitated or increased when populations are exposed to high temperatures [49,50]. Regarding tree canopy, this variable is often associated with lower temperatures as shade helps to lower ambient temperatures that populations would experience. However, the lack of tree canopy variable proved to have an insignificant relationship with coronary heart disease. An article from the American Heart Association indicates that green space decreased the risk of developing coronary heart disease as it provided cooler and healthier environments for individuals to live in, increasing the likelihood for other factors such as exercise, healthier air, and decreased temperatures, all of which helped to contribute to lower CHD prevalence [51]. Our results do not align with the current literature on the topics. It is important to note the limitations; specifically for LSTs, a more optimal measure would be an annual average of temperature at a high spatial resolution for Jefferson County allowing for a better estimate of the temperatures populations experience on a daily basis. Regarding tree canopy, a better green space measure could be used to help model the true green space rather than just trees and how all green space contributes to CHD prevalence rather than just tree coverage. The aggregation of these variables to census tracts may also influence the overall model incorrectly as populations may not truly be exposed to these conditions presented in the maps and models. Improvements in data would significantly improve the quality of results while also allowing for more specific areas to be highlighted and to study their resident populations.
In comparing our regression models to contemporary research, it is important to highlight key differences in approach. This study integrates both environmental and socioeconomic variables as risk factors, whereas much of the traditional literature has focused primarily on underlying health conditions and socioeconomic status—often emphasizing the significant and positive associations between poverty and chronic health outcomes [52,53]. A recent study by Tutar et al. (2024) examined environmental risk factors for coronary heart disease (CHD), identifying variables such as median humidity, minimum temperature, and sunlight as contributors to elevated CHD mortality rates [54]. These findings underscore the complexity of environmental influences on health outcomes, particularly CHD, and illustrate the challenges in determining precise correlations between environmental variables and CHD prevalence.
4.4. Broader Context and Future Research
The overall findings of this study underscore the compounded risks faced by vulnerable populations, particularly in urban neighborhoods such as the West End of Jefferson County. Residents in this area experience elevated poverty, high rates of coronary heart disease (CHD), and increased exposure to extreme temperatures. Although variables such as land surface temperatures (LSTs) and tree canopy coverage did not emerge as statistically significant in regression models, it remains critical to emphasize the health risks associated with living with CHD under extreme heat conditions, which can lead to severe complications.
A study by Meenar et al. (2023) [55], conducted in Camden, New Jersey, highlights the historical injustices experienced by marginalized communities and illustrates how disadvantaged populations disproportionately bear the impacts of climate change, particularly urban heat. The study also points to the lack of political and sociological cooperation in mitigating these exposures [55]. This evidence reinforces the importance of incorporating visual tools, such as the heat vulnerability index (HVI), to help policymakers and advocates identify and prioritize the most vulnerable census tracts. Such tools can guide the implementation of targeted policy and climate resilience programs. Initiatives that expand green space, improve access to cooling resources, and address socioeconomic inequities are essential to mitigating the health and environmental burdens faced by marginalized communities in the West End.
Author Contributions
Conceptualization, Kyle Lucas, Ben Dewitt, and Charlie H. Zhang; methodology, Kyle Lucas and Charlie H. Zhang; software, Kyle Lucas; validation, Kyle Lucas and Charlie H. Zhang; formal analysis, Kyle Lucas; investigation, Kyle Lucas and Charlie H. Zhang; resources, Kyle Lucas; data curation, Kyle Lucas; writing—original draft preparation, Kyle Lucas; writing—review and editing, Kyle Lucas, Donald J. Biddle, and Charlie H. Zhang; visualization, Kyle Lucas; supervision, Kyle Lucas and Charlie H. Zhang; project administration, Kyle Lucas and Charlie H. Zhang; funding acquisition, Kyle Lucas, Ben Dewitt, Donald J. Biddle, and Charlie H. Zhang. All authors have read and agreed to the published version of the manuscript.
Funding
This research was funded by the University of Louisville Summer Research Opportunity Program for undergraduate students, and the University of Louisville’s Center for GIS.
Data Availability Statement
The datasets generated and/or analyzed during the current study are available in the One Drive—University of Louisville repository. HD_x_UHI_Jefferson_KY.xls.
Conflicts of Interest
The authors declare no conflicts of interest.
Appendix A
Appendix A.1
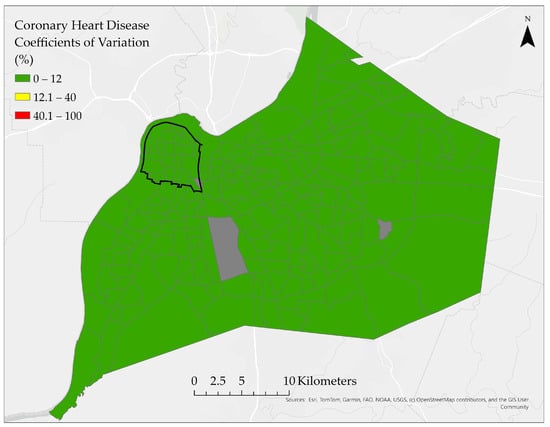
Figure A1.
Reliability assessment of coronary heart disease rates across census tracts. Gray tracts represent excluded tracts due to a lack of data.
Appendix A.2
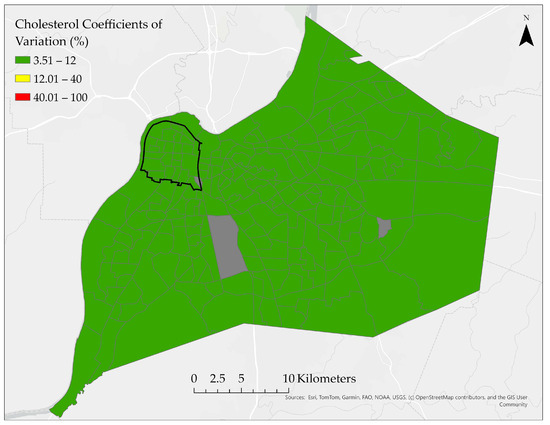
Figure A2.
Reliability assessment of cholesterol rates across census tracts. Gray tracts represent excluded tracts due to a lack of data.
Appendix A.3
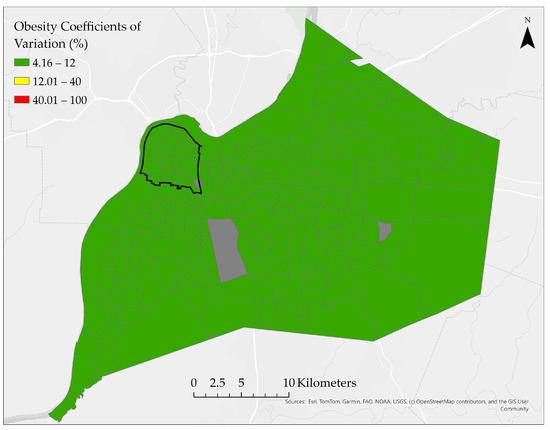
Figure A3.
Reliability assessment of obesity rates across census tracts. Gray tracts represent excluded tracts due to a lack of data.
Appendix A.4
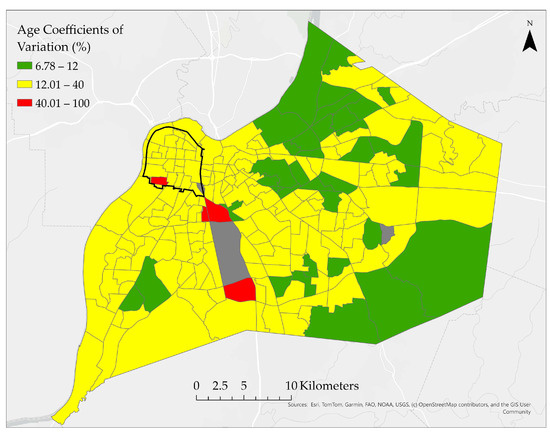
Figure A4.
Reliability assessment of percentage of population aged 65 and older. Gray tracts represent excluded tracts due to a lack of data.
Appendix A.5
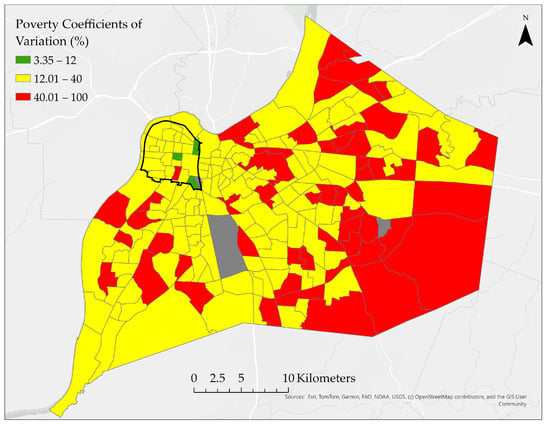
Figure A5.
Reliability assessment of poverty rates across census tracts. Gray tracts represent excluded tracts due to a lack of data.
References
- U.S. Centers for Disease Control and Prevention. Heart Disease Fast Facts. Available online: https://www.cdc.gov/heart-disease/data-research/facts-stats/index.html (accessed on 7 July 2025).
- U.S. Centers for Disease Control and Prevention. About Heart Disease. Available online: https://www.cdc.gov/heart-disease/about/index.html (accessed on 7 July 2025).
- National Institues of Health: National Heart, Lung, and Blood Institute. What Is Coronary Heart Disease? Available online: https://www.nhlbi.nih.gov/health/coronary-heart-disease (accessed on 7 July 2025).
- National Institues of Health: National Heart, Lung, and Blood Institute. Coronary Heart Disease Symptoms. Available online: https://www.nhlbi.nih.gov/health/coronary-heart-disease/symptoms (accessed on 7 July 2025).
- Huang, C.; Liu, K.; Ma, T.; Xue, H.; Wang, P.; Li, L. Analysis of the impact mechanisms and driving factors of urban spatial morphology on urban heat islands. Sci. Rep. 2025, 15, 18589. [Google Scholar] [CrossRef]
- Arifwidodo, S.D.; Chandrasiri, O. Urban heat stress and human health in Bangkok, Thailand. Environ. Res. 2020, 185, 109398. [Google Scholar] [CrossRef]
- Cleland, S.E.; Steinhardt, W.; Neas, L.M.; Jason West, J.; Rappold, A.G. Urban heat island impacts on heat-related cardiovascular morbidity: A time series analysis of older adults in US metropolitan areas. Environ. Int. 2023, 178, 108005. [Google Scholar] [CrossRef] [PubMed]
- Liu, J.; Varghese, B.M.; Hansen, A.; Zhang, Y.; Driscoll, T.; Morgan, G.; Dear, K.; Gourley, M.; Capon, A.; Bi, P. Heat exposure and cardiovascular health outcomes: A systematic review and meta-analysis. Lancet Planet. Health 2022, 6, e484–e495. [Google Scholar] [CrossRef] [PubMed]
- Bianconi, A.; Longo, G.; Coa, A.A.; Fiore, M.; Gori, D. Impacts of Urban Green on Cardiovascular and Cerebrovascular Diseases—A Systematic Review and Meta-Analysis. Int. J. Environ. Res. Public Health 2023, 20, 5966. [Google Scholar] [CrossRef]
- Deng, S.; Liang, J.; Peng, Y.; Liu, W.; Su, J.; Zhu, S. Spatial analysis of the impact of urban built environment on cardiovascular diseases: A case study in Xixiangtang, China. BMC Public Health 2024, 24, 2368. [Google Scholar] [CrossRef]
- Friel, S.; Hancock, T.; Kjellstrom, T.; Mcgranahan, G.; Monge, P.; Roy, J. Urban Health Inequities and the Added Pressure of Climate Change: An Action-Oriented Research Agenda. J. Urban Health 2011, 88, 886–895. [Google Scholar] [CrossRef] [PubMed]
- Short, J.R.; Farmer, A. Cities and Climate Change. Earth 2021, 2, 1038–1045. [Google Scholar] [CrossRef]
- Hsu, A.; Sheriff, G.; Chakraborty, T.; Manya, D. Disproportionate exposure to urban heat island intensity across major US cities. Nat. Commun. 2021, 12, 2721. [Google Scholar] [CrossRef]
- Tong, S.; Prior, J.; Mcgregor, G.; Shi, X.; Kinney, P. Urban heat: An increasing threat to global health. BMJ 2021, 375, n2467. [Google Scholar] [CrossRef]
- Blaustein, J.R.; Quisel, M.J.; Hamburg, N.M.; Wittkopp, S. Environmental Impacts on Cardiovascular Health and Biology: An Overview. Circ. Res. 2024, 134, 1048–1060. [Google Scholar] [CrossRef] [PubMed]
- Münzel, T.; Hahad, O.; Sørensen, M.; Lelieveld, J.; Duerr, G.D.; Nieuwenhuijsen, M.; Daiber, A. Environmental risk factors and cardiovascular diseases: A comprehensive expert review. Cardiovasc. Res. 2022, 118, 2880–2902. [Google Scholar] [CrossRef]
- Münzel, T.; Daiber, A.; Engelmann, N.; Röösli, M.; Kuntic, M.; Banks, J.L. Noise causes cardiovascular disease: It’s time to act. J. Expo. Sci. Environ. Epidemiol. 2025, 35, 24–33. [Google Scholar] [CrossRef]
- Lee, B.-J.; Kim, B.; Lee, K. Air Pollution Exposure and Cardiovascular Disease. Toxicol. Res. 2014, 30, 71–75. [Google Scholar] [CrossRef]
- Münzel, T.; Hahad, O.; Daiber, A. The dark side of nocturnal light pollution. Outdoor light at night increases risk of coronary heart disease. Eur. Heart J. 2021, 42, 831–834. [Google Scholar] [CrossRef]
- Jin, J.; Meng, X.; Wang, D.; Han, B.; Wu, T.; Xie, J.; Zhang, Q.; Xie, D.; Zhang, Z. Association between ambient temperature and cardiovascular diseases related hospital admissions in Lanzhou, China. Heliyon 2023, 9, e12997. [Google Scholar] [CrossRef]
- Vujovic, S.; Haddad, B.; Karaky, H.; Sebaibi, N.; Boutouil, M. Urban Heat Island: Causes, Consequences, and Mitigation Measures with Emphasis on Reflective and Permeable Pavements. CivilEng 2021, 2, 459–484. [Google Scholar] [CrossRef]
- Piracha, A.; Chaudhary, M.T. Urban Air Pollution, Urban Heat Island and Human Health: A Review of the Literature. Sustainability 2022, 14, 9234. [Google Scholar] [CrossRef]
- Jabbar, H.K.; Hamoodi, M.N.; Al-Hameedawi, A.N. Urban heat islands: A review of contributing factors, effects and data. IOP Conf. Ser. Earth Environ. Sci. 2023, 1129, 012038. [Google Scholar] [CrossRef]
- Stone, B.; Lanza, K.; Mallen, E.; Vargo, J.; Russell, A. Urban Heat Management in Louisville, Kentucky: A Framework for Climate Adaptation Planning. J. Plan. Educ. Res. 2023, 43, 346–358. [Google Scholar] [CrossRef]
- Maginnis, M.H. The Spatial Geograpy of Deprivation: A Case Study of the West End Neighborhoods of Louisville, Kentucky. Master’s Thesis, University of Louisville, Louisville, KY, USA, 2001. [Google Scholar]
- Zhang, C.H.; Sears, C.G.; Guinn, B.; Zierold, K.M. Exploring Environmental Injustice in Exposure to Airborne Lead Released from Industrial Facilities in Kentucky, United States. Geogr. Rev. 2024, 114, 446–463. [Google Scholar] [CrossRef]
- Desai, Y.; Khraishah, H.; Alahmad, B. Heat and the Heart. Yale J. Biol. Med. 2023, 96, 197–203. [Google Scholar] [CrossRef]
- Hamanaka, R.B.; Mutlu, G.M. Particulate Matter Air Pollution: Effects on the Cardiovascular System. Front. Endocrinol. 2018, 9, 680. [Google Scholar] [CrossRef]
- United States Census Bureau. QuickFacts Jefferson County, Kentucky. Available online: https://www.census.gov/quickfacts/fact/table/jeffersoncountykentucky/PST045221 (accessed on 7 July 2025).
- Centers for Disease Control and Prevention. Health Outcomes. Available online: https://www.cdc.gov/places/measure-definitions/health-outcomes.html (accessed on 5 September 2025).
- Bureau, U.S.C. American Community Survey and Puerto Rico Community Survey Design and Methodology; United States Census Bureau: Suitland, MD, USA, 2024. [Google Scholar]
- ARSET. Satellite Remote Sensing for Measuring Urban Heat Islands and Constructing Heat Vulnerability Indices. Available online: https://appliedsciences.nasa.gov/get-involved/training/english/arset-satellite-remote-sensing-measuring-urban-heat-islands-and (accessed on 7 May 2024).
- Engle, N.L. Adaptive capacity and its assessment. Glob. Environ. Change 2011, 21, 647–656. [Google Scholar] [CrossRef]
- Chapagain, P.S.; Banskota, T.R.; Shrestha, S.; Khanal, N.R.; Yili, Z.; Yan, J.; Linshan, L.; Paudel, B.; Rai, S.C.; Islam, M.N.; et al. Studies on adaptive capacity to climate change: A synthesis of changing concepts, dimensions, and indicators. Humanit. Soc. Sci. Commun. 2025, 12, 331. [Google Scholar] [CrossRef]
- Sung, C.-H.; Liaw, S.-C. Using Spatial Pattern Analysis to Explore the Relationship between Vulnerability and Resilience to Natural Hazards. Int. J. Environ. Res. Public Health 2021, 18, 5634. [Google Scholar] [CrossRef] [PubMed]
- Azzouz, M.; Hasan, Z.; Rahman, M.M.; Gauderman, W.J.; Lorenzo, M.; Lurmann, F.W.; Eckel, S.P.; Palinkas, L.; Johnston, J.; Hurlburt, M.; et al. Does socioeconomic and environmental burden affect vulnerability to extreme air pollution and heat? A case-crossover study of mortality in California. J. Expo. Sci. Environ. Epidemiol. 2025, 35, 294–302. [Google Scholar] [CrossRef]
- Viegas, S. Exposure Science in a Climate Change Scenario. Port. J. Public Health 2022, 40, 1–2. [Google Scholar] [CrossRef]
- Byers, E.; Gidden, M.; Leclère, D.; Balkovic, J.; Burek, P.; Ebi, K.; Greve, P.; Grey, D.; Havlik, P.; Hillers, A.; et al. Global exposure and vulnerability to multi-sector development and climate change hotspots. Environ. Res. Lett. 2018, 13, 055012. [Google Scholar] [CrossRef]
- Choi, H.M.; Bell, M.L. Heat-mortality relationship in North Carolina: Comparison using different exposure methods. J. Expo. Sci. Environ. Epidemiol. 2023, 33, 637–645. [Google Scholar] [CrossRef]
- Abdul-Nabi, S.S.; Al Karaki, V.; Khalil, A.; El Zahran, T. Climate change and its environmental and health effects from 2015 to 2022: A scoping review. Heliyon 2025, 11, e42315. [Google Scholar] [CrossRef] [PubMed]
- Rocque, R.J.; Beaudoin, C.; Ndjaboue, R.; Cameron, L.; Poirier-Bergeron, L.; Poulin-Rheault, R.A.; Fallon, C.; Tricco, A.C.; Witteman, H.O. Health effects of climate change: An overview of systematic reviews. BMJ Open 2021, 11, e046333. [Google Scholar] [CrossRef] [PubMed]
- Reid, C.E.; O’Neill, M.S.; Gronlund, C.J.; Brines, S.J.; Brown, D.G.; Diez-Roux, A.V.; Schwartz, J. Mapping community determinants of heat vulnerability. Environ. Health Perspect 2009, 117, 1730–1736. [Google Scholar] [CrossRef]
- Getis, A.; Ord, J.K. The Analysis of Spatial Association by Use of Distance Statistics. Geogr. Anal. 1992, 24, 189–206. [Google Scholar] [CrossRef]
- Lee, S.-I. Developing a bivariate spatial association measure: An integration of Pearson’s r and Moran’s I. J. Geogr. Syst. 2001, 3, 369–385. [Google Scholar] [CrossRef]
- Lee, S.-I. A Generalized Randomization Approach to Local Measures of Spatial Association. Geogr. Anal. 2009, 41, 221–248. [Google Scholar] [CrossRef]
- Brown, J.C.; Gerhardt, T.E.; Kwon, E. Risk Factors for Coronary Artery Disease. In StatPearls; StatPearls Publishing LLC.: Treasure Island, FL, USA, 2025. [Google Scholar]
- Schultz, W.M.; Kelli, H.M.; Lisko, J.C.; Varghese, T.; Shen, J.; Sandesara, P.; Quyyumi, A.A.; Taylor, H.A.; Gulati, M.; Harold, J.G.; et al. Socioeconomic Status and Cardiovascular Outcomes. Circulation 2018, 137, 2166–2178. [Google Scholar] [CrossRef]
- Rodgers, J.L.; Jones, J.; Bolleddu, S.I.; Vanthenapalli, S.; Rodgers, L.E.; Shah, K.; Karia, K.; Panguluri, S.K. Cardiovascular Risks Associated with Gender and Aging. J. Cardiovasc. Dev. Dis. 2019, 6, 19. [Google Scholar] [CrossRef]
- Abrignani, M.G.; Lombardo, A.; Braschi, A.; Renda, N.; Abrignani, V. Climatic influences on cardiovascular diseases. World J. Cardiol. 2022, 14, 152–169. [Google Scholar] [CrossRef]
- Huang, J.; Wang, L.; Wang, S.; Lu, Y.; Zhang, W.; Wang, J. Spatial and temporal characteristics of temperature effects on cardiovascular disease in Southern China using the Empirical Mode Decomposition method. Sci. Rep. 2018, 8, 14775. [Google Scholar] [CrossRef] [PubMed]
- Keith, R.J.; Hart, J.L.; Bhatnagar, A. Greenspaces And Cardiovascular Health. Circ. Res. 2024, 134, 1179–1196. [Google Scholar] [CrossRef]
- Khan, S.U.; Nguyen, R.T.; Javed, Z.; Singh, M.; Valero-Elizondo, J.; Cainzos-Achirica, M.; Nasir, K. Socioeconomic status, cardiovascular risk profile, and premature coronary heart disease. Am. J. Prev. Cardiol. 2022, 11, 100368. [Google Scholar] [CrossRef] [PubMed]
- Correia, L.C.L.; Cerqueira, M.; Carvalhal, M.; Ferreira, F.; Garcia, G.; Silva, A.B.D.; Sá, N.; Lopes, F.; Barcelos, A.C.; Noya-Rabelo, M. A Multivariate Model for Prediction of Obstructive Coronary Disease in Patients with Acute Chest Pain: Development and Validation. Arq. Bras. Cardiol. 2017, 108, 304–314. [Google Scholar] [CrossRef] [PubMed]
- Tutar, M.; Kocak, H.G.; Kocak, M. Geographical variations and predictors of coronary artery disease mortality in Turkiye: An environmental and behavioral analysis. BMC Cardiovasc. Disord. 2024, 24, 554. [Google Scholar] [CrossRef] [PubMed]
- Meenar, M.; Rahman, M.S.; Russack, J.; Bauer, S.; Kapri, K. “The Urban Poor and Vulnerable Are Hit Hardest by the Heat”: A Heat Equity Lens to Understand Community Perceptions of Climate Change, Urban Heat Islands, and Green Infrastructure. Land 2023, 12, 2174. [Google Scholar] [CrossRef]
Disclaimer/Publisher’s Note: The statements, opinions and data contained in all publications are solely those of the individual author(s) and contributor(s) and not of MDPI and/or the editor(s). MDPI and/or the editor(s) disclaim responsibility for any injury to people or property resulting from any ideas, methods, instructions or products referred to in the content. |
© 2025 by the authors. Published by MDPI on behalf of the International Society for Photogrammetry and Remote Sensing. Licensee MDPI, Basel, Switzerland. This article is an open access article distributed under the terms and conditions of the Creative Commons Attribution (CC BY) license (https://creativecommons.org/licenses/by/4.0/).