Article

Spatiotemporal Typhoon Damage Assessment: A Multi-Task Learning Method for Location Extraction and Damage Identification from Social Media Texts

1
Southern Marine Science and Engineering Guangdong Laboratory (Zhuhai), School of Geography and Planning, Sun Yat-sen University, Guangzhou 510275, China
2
School of Geography and Planning, Sun Yat-sen University, Guangzhou 510275, China
3
China Regional Coordinated Development and Rural Construction Institute, Sun Yat-sen University, Guangzhou 510275, China
4
Institute of Area Studies, Sun Yat-sen University, Zhuhai 519082, China
*
Author to whom correspondence should be addressed.
ISPRS Int. J. Geo-Inf. 2025, 14(5), 189; https://doi.org/10.3390/ijgi14050189
Submission received: 27 February 2025 / Revised: 25 April 2025 / Accepted: 29 April 2025 / Published: 30 April 2025

Abstract

:
Typhoons are among the most destructive natural phenomena, posing significant threats to human society. Therefore, accurate damage assessment is crucial for effective disaster management and sustainable development. While social media texts have been widely used for disaster analysis, most current studies tend to neglect the geographic references and primarily focus on single-label classification, which limits the real-world utility. In this paper, we propose a multi-task learning method that synergizes the tasks of location extraction and damage identification. Using Bidirectional Encoder Representations from Transformers (BERT) with auxiliary classifiers as the backbone, the framework integrates a toponym entity recognition model and a multi-label classification model. Novel toponym-enhanced weights are designed as a bridge to generate augmented text representations for both tasks. Experimental results show high performance, with F1-scores of 0.891 for location extraction and 0.898 for damage identification, representing improvements of 4.3% and 2.5%, respectively, over single-task and deep learning baselines. A case study of three recent typhoons (In-fa, Chaba, and Doksuri) that hit China’s coastal regions reveals the spatial distribution and temporal pattern of typhoon damage, providing actionable insights for disaster management and resource allocation. This framework is also adaptable to other disaster scenarios, supporting urban resilience and sustainable development.

1. Introduction

Typhoons, as intense and prolonged disasters, significantly impact both the natural environment and societal functions [1,2]. They cause extensive damage to resources such as trees, water, and energy infrastructure, posing challenges for disaster management. Therefore, a rapid and comprehensive assessment of typhoon damage is crucial for effective emergency response and resource allocation efforts [3,4]. In addition, typhoons disrupt the normal functioning of society by causing transportation restrictions and work suspension. Therefore, analyzing damage changes during typhoons is key to understanding the adaptive capacity of cities [5,6]. Given the natural and societal challenges posed by typhoons, damage assessment plays an increasingly important role in fostering disaster management and urban resilience.
Traditional typhoon damage assessment methods rely on field surveys and remote sensing [7,8,9]. While field surveys can provide detailed information, they are time consuming and labor intensive. Remote sensing, on the other hand, provides a large number of images but lacks the detailed information to understand societal impacts. Neither method fully meets the needs of improved disaster management and urban resilience. Recently, the popularity of social media platforms such as Twitter and SinaWeibo has revolutionized the way information is shared [10,11]. During disasters, people actively disseminate information online in real time, which greatly increases the situation awareness of disasters [12,13]. The broad public participation, rapid data updates, and cost effectiveness of social media address the limitations of traditional methods, making it an important tool for typhoon damage assessment.
Social media texts have been applied in various disaster situation awareness tasks. For example, Lu et al. [14] explored the potential impact of flooding on road transportation using news media data to assess urban vulnerability. Du et al. [15] proposed an integrated physical and social sensing method to estimate flood inundation probability by combining remote sensing data and social media during the 2021 Henan rainstorm. Huang et al. [16] analyzed human activities in response to Typhoon Hato by integrating geotagged microblogs and Tencent’s location data. Text representations are essential for transforming raw text into vectors that encapsulate semantic meaning, serving as the cornerstone for text tasks such as those mentioned above. Scholars have extensively researched text representations and developed relatively mature techniques, which include bag-of-words-based models such as Word2Vec [17] and Global Vector for Word Representation (GloVe) [18], as well as Transformer-based models such as the Generative Pre-Trained Transformer (GPT) [19] and Bidirectional Encoder Representations from Transformers (BERT) [20]. In particular, BERT is pre-trained on large datasets to capture the bidirectional context of texts and has been widely used for its excellent performance achieved in a variety of downstream tasks through fine-tuning [21,22]. The outputs from different hidden layers of BERT capture distinct linguistic nuances and exhibit varying performance across tasks [23,24]. However, most studies rely only on the output from the last layer of BERT and ignore the semantic information of hidden layers. Therefore, integrating the outputs from the hidden layers of BERT to enhance text representations in typhoon damage assessment can help to improve the accuracy of location extraction and damage identification.
Location information is vital for effective typhoon damage assessment. Typical geographic references in social media texts include user-registered locations and geotagged locations [25]. The user-registered locations are established when the users register on the social media platform, while geotagged texts represent only a small proportion of social media texts. However, both locations fall short in accurately and comprehensively reflecting the actual location context of social media texts. To address this limitation, gazetteer-based approaches extract locations from texts by matching characters to entries in a gazetteer [26,27]. Although straightforward to use, this method requires considerable time to manually create a matching rule template and gazetteer. Deep-learning-based methods for toponym entity recognition have significantly outperformed gazetteer-based approaches in location extraction. Popular methods include Convolutional Neural Network (CNN)-based [28,29] and Recurrent Neural Network (RNN)-based models [30,31]. As text representation models advance, a popular approach combines the bidirectional context comprehension of BERT with the sequential understanding of Bidirectional Long Short-Term Memory (BiLSTM). This integration enhances the model’s ability to capture nuanced semantic relationships within the text. In addition, the Conditional Random Field (CRF) module further improves performance by enforcing constrained decoding, which translates the probability distribution into toponym entity labels [32,33]. Therefore, leveraging a deep-learning-based toponym entity recognition model for location extraction can improve the spatial accuracy of typhoon damage assessment.
In terms of damage identification, classical methods include rule-based methods and machine-learning-based methods. Rule-based methods rely on predefined rules to categorize texts but require domain knowledge, while machine-learning-based methods learn connections between texts and labels through hand-crafted features [34]. These methods typically employ single-label classification, which limits their ability to capture the full semantic information in texts [35]. For example, “during the typhoon, roads were heavily flooded and many tunnels were impassable” describes the impacts of waterlogging and the impact on transportation, but single-label classification methods can only identify one of these types of typhoon damage. Deep learning has driven the development of text classification models, making multi-label classification more accessible. For instance, CNN-based models [36,37], RNN-based models [38,39], and those utilizing attention mechanisms [40,41] have greatly improved text classification accuracy and are widely applied in disaster situation awareness.
Despite these advances, current methods often treat location extraction and damage identification as separate tasks, which requires additional effort and lacks integration with broader disaster management strategies. Multi-task learning (MTL), which enables models to learn multiple related tasks simultaneously, has shown promising results in fields such as natural language processing and computer vision [42]. In the disaster domain, multi-task learning has been widely applied across various tasks and has demonstrated improved generalization and robustness compared to single-task models. For example, Zhao et al. [43] demonstrated the effectiveness of a parallel MTL-based CNN model for tropical cyclone classification and intensity estimation using multi-spectral remote sensing imagery. Myint et al. [44] employed a Transformer-based MTL framework to simultaneously perform sentiment and emotion classification, providing critical insights to support crisis response efforts. Xie et al. [45] proposed a multi-task identification network capable of concurrently detecting tornado occurrences and estimating tornado counts, highlighting the suitability of MTL for small-scale disaster events. Additionally, Shi et al. [46] introduced a Transformer-based MTL model that simultaneously predicts flooding and outage risks within substations, offering reliable decision-making support for disaster mitigation and infrastructure resilience. However, there has been limited research exploring multi-task learning for integrating location extraction and damage identification from unstructured social media data. Therefore, efficiently synergizing these two tasks through multi-task learning will enable accurate and comprehensive damage analysis and streamline the end-to-end workflow of spatiotemporal typhoon damage assessment.
In summary, existing disaster reduction research exhibits notable limitations in several key areas, including enhancing text representation, extracting location information from text, and jointly identifying disaster-related information and corresponding geospatial references. To overcome the above-mentioned disadvantages, this paper proposes a multi-task learning method that synergizes location extraction and damage identification. BERT with auxiliary classifiers is designed to generate augmented text representations. For the location extraction task, we adopt a toponym entity recognition model to effectively capture the geographic references in texts. For the damage identification task, we construct a multi-label classification model to identify six damage categories (i.e., damage, transportation, public, electricity, forestry, and waterlogging). In the multi-task learning framework, toponym-enhanced weights are designed to further enhance text representations by building a connection between location extraction and damage identification.
The remainder of this paper is structured as follows: Section 1 reviews related work on using social media for disaster assessment. Section 2 details the datasets and the proposed method for synergizing location extraction and damage identification. Section 3 displays the model performance and our findings on spatiotemporal typhoon damage assessment. Section 4 discusses some key issues and limitations of the study. Finally, Section 5 concludes this work.

2. Materials and Methods

2.1. Experimental Data

2.1.1. Data Collection and Pre-Processing

As one of the most typhoon-prone countries in the world, China experiences significant typhoon impacts throughout the year. We use SinaWeibo , China’s largest public social media platform with extensive user engagement, as an experimental data source to assess the damage caused by three recent strong typhoons (In-fa, Chaba, and Doksuri). Web crawler technology facilitates automated data collection by simulating browser behavior, and the typhoon name as well as damage-related terms are set as search keywords to collect Weibo texts within seven days before and after typhoon landfall. The data fields obtained include user name, content, posting time, user-registered location, and geotagged location. Table 1 shows the number of texts for the selected typhoons after deleting duplicate entries.
The texts are pre-processed before being fed into BERT, a process which includes tokenization, padding, and truncation. First, the texts are segmented into words by a tokenizer and converted into token embeddings via vocabulary mappings. Special tokens are then added, shorter texts are zero-padded, and longer texts are truncated to ensure consistent input lengths. Subsequently, position and segment embeddings are generated, which, along with the token embeddings, form the inputs to BERT.

2.1.2. Experimental Datasets
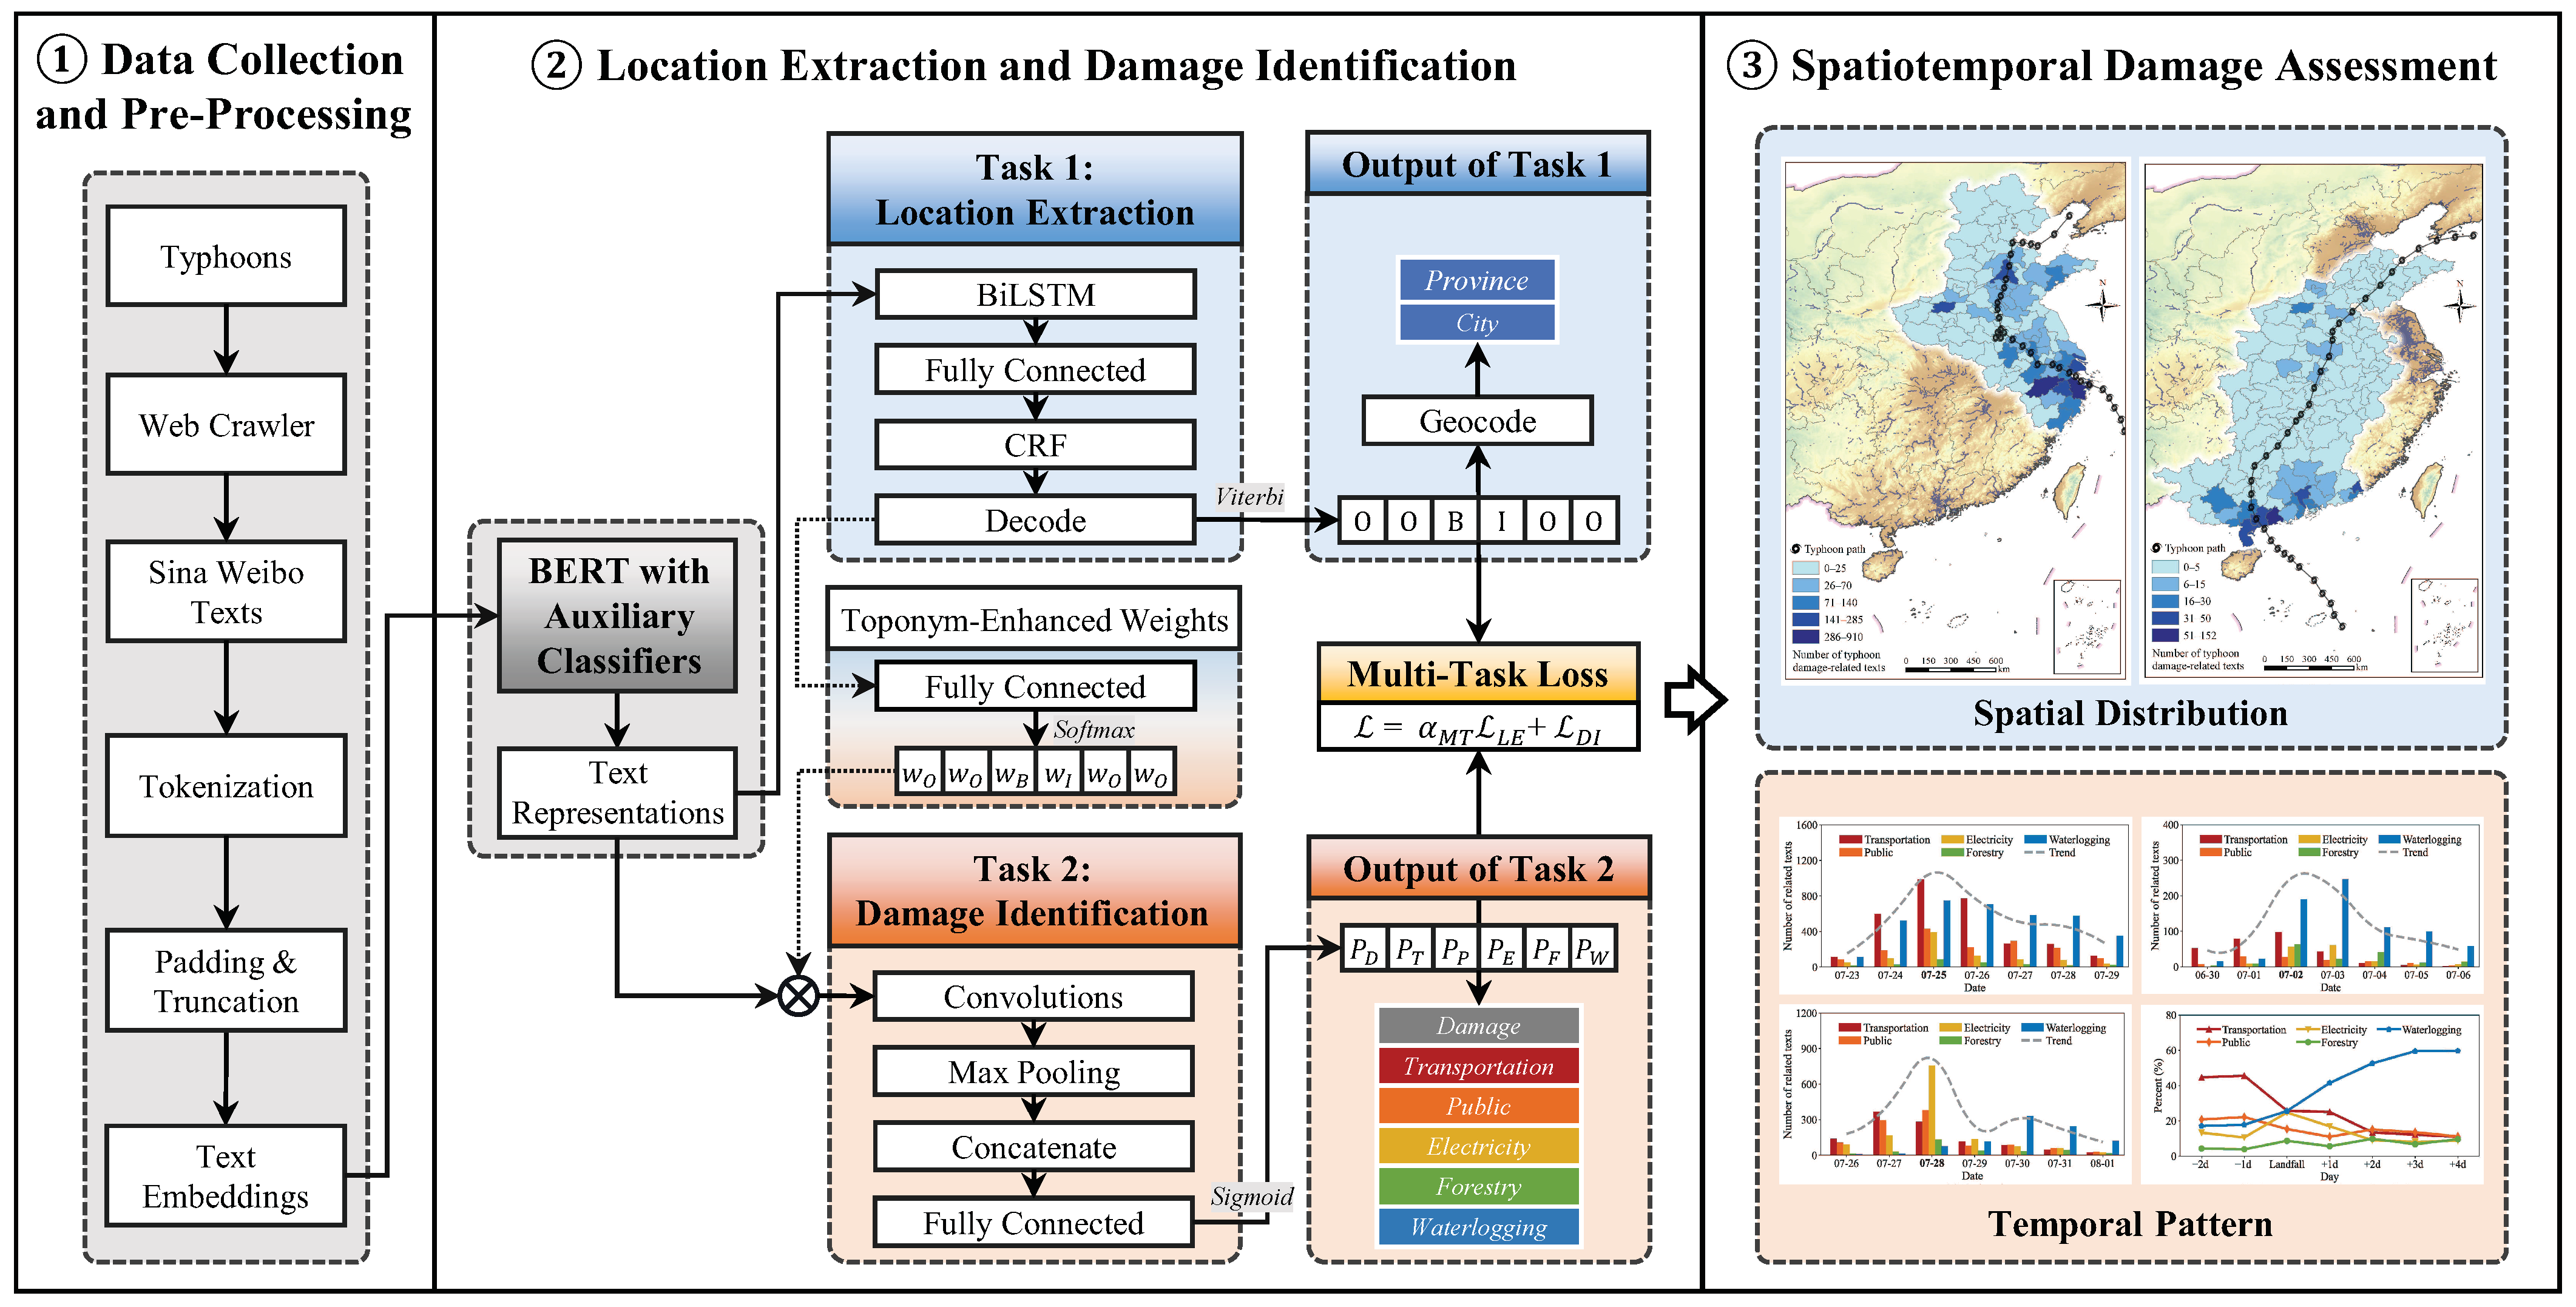
For the location extraction task, we adopt the Microsoft Research Asia (MSRA) dataset, which contains more than 50,000 labeled texts for the recognition of Chinese entities. Entities in the MSRA dataset are categorized into people, location, and institution using the BIO scheme, a common sequence-labeling approach in named entity recognition. In the experiment, only the location entity labels are retained, where B-LOC represents the beginning of a toponym entity, I-LOC represents the middle or end, and O represents non-toponym entities. We select 6000 texts containing more toponym entities as the experimental dataset for location extraction.
For the damage identification task, we establish a typhoon damage classification scheme (i.e., damage, transportation, public, electricity, forestry, and waterlogging) according to the Chinese Standard for Technical Specifications for Meteorological Disaster Surveys. The first category identifies whether the texts are related to typhoon damage, and the other five categories cover the impact of the typhoons on both the natural environment and societal function. A detailed description and examples of each category are shown in Table 2.
In the dataset of 31,379 texts presented in Table 1, we manually label 2000 texts for each typhoon, resulting in a total of 6000 labeled texts as the experimental dataset for damage identification. Among these, 3000 (50.0%) are categorized as damage, 944 (15.7%) as transportation, 805 (13.4%) as public, 823 (13.7%) as electricity, 371 (6.2%) as forestry, and 1095 (18.3%) as waterlogging. Examples of multi-label texts are shown in Table 3. The first example, which contains warning information, is labeled 0 to indicate that it is not related to typhoon damage, and the other text examples are multi-labeled to reflect the various real-world impacts of the typhoon. In the multi-task learning framework, 70% of the experimental datasets of both tasks are randomly selected for training, 15% for validation, and 15% for testing.

2.2. Methodology

The framework for spatiotemporal typhoon damage assessment from social media texts via multi-task learning is shown in Figure 1. The first part involves data collection and pre-processing, where texts from SinaWeibo are collected and converted into embeddings. In the second part, we propose a multi-task learning method that synergizes location extraction and damage identification. We leverage BERT with auxiliary classifiers to generate augmented text representations. In the multi-task learning framework, we develop a toponym entity recognition model for the location extraction task and a multi-label classification model for the damage identification task. Additionally, toponym-enhanced weights are designed to facilitate the connection between these two tasks, thereby further enhancing the text representations. Finally, we apply our method to three recent strong typhoons that made landfall in China’s coastal area, which serve as cases for spatiotemporal typhoon damage assessment.

2.2.1. BERT with Auxiliary Classifiers

BERT is a powerful language model that has revolutionized natural language processing tasks. Figure 2 shows the structure of BERT with auxiliary classifiers. BERT employs a Transformer architecture consisting of 12 layers of Transformer encoders, each capable of understanding contextual relationships within texts. A crucial feature is the bidirectional attention mechanism, which allows the model to consider both the left and right contexts for each word in a sentence simultaneously. Multi-head attention further enhances bidirectional comprehension to capture nuanced meanings and dependencies in language. In addition, BERT uses feed-forward neural networks, residual connections, and layer normalization techniques to build deep representations of texts, leading to exceptional performance in a wide range of language understanding tasks, including toponym entity recognition and multi-label classification.
Furthermore, since the outputs of different hidden layers of BERT capture various semantic information, we incorporate not only the output from the last hidden layer but also those from other layers to integrate supplementary information. The text representations from these hidden layers are fed into auxiliary classifiers, which produce outputs for location extraction and damage identification, contributing to parameter updates during model training:
O = C ( H ( x ) )
where O represents the outputs for location extraction and damage identification, C denotes the auxiliary classifiers, and H ( x ) are text representations from hidden layers.
By learning from these intermediate layers, the auxiliary classifiers enhance the text representations and expedite model training by providing additional supervision signals. This multi-level feedback facilitates faster convergence, allowing the model to benefit from gradients at multiple levels of the network.

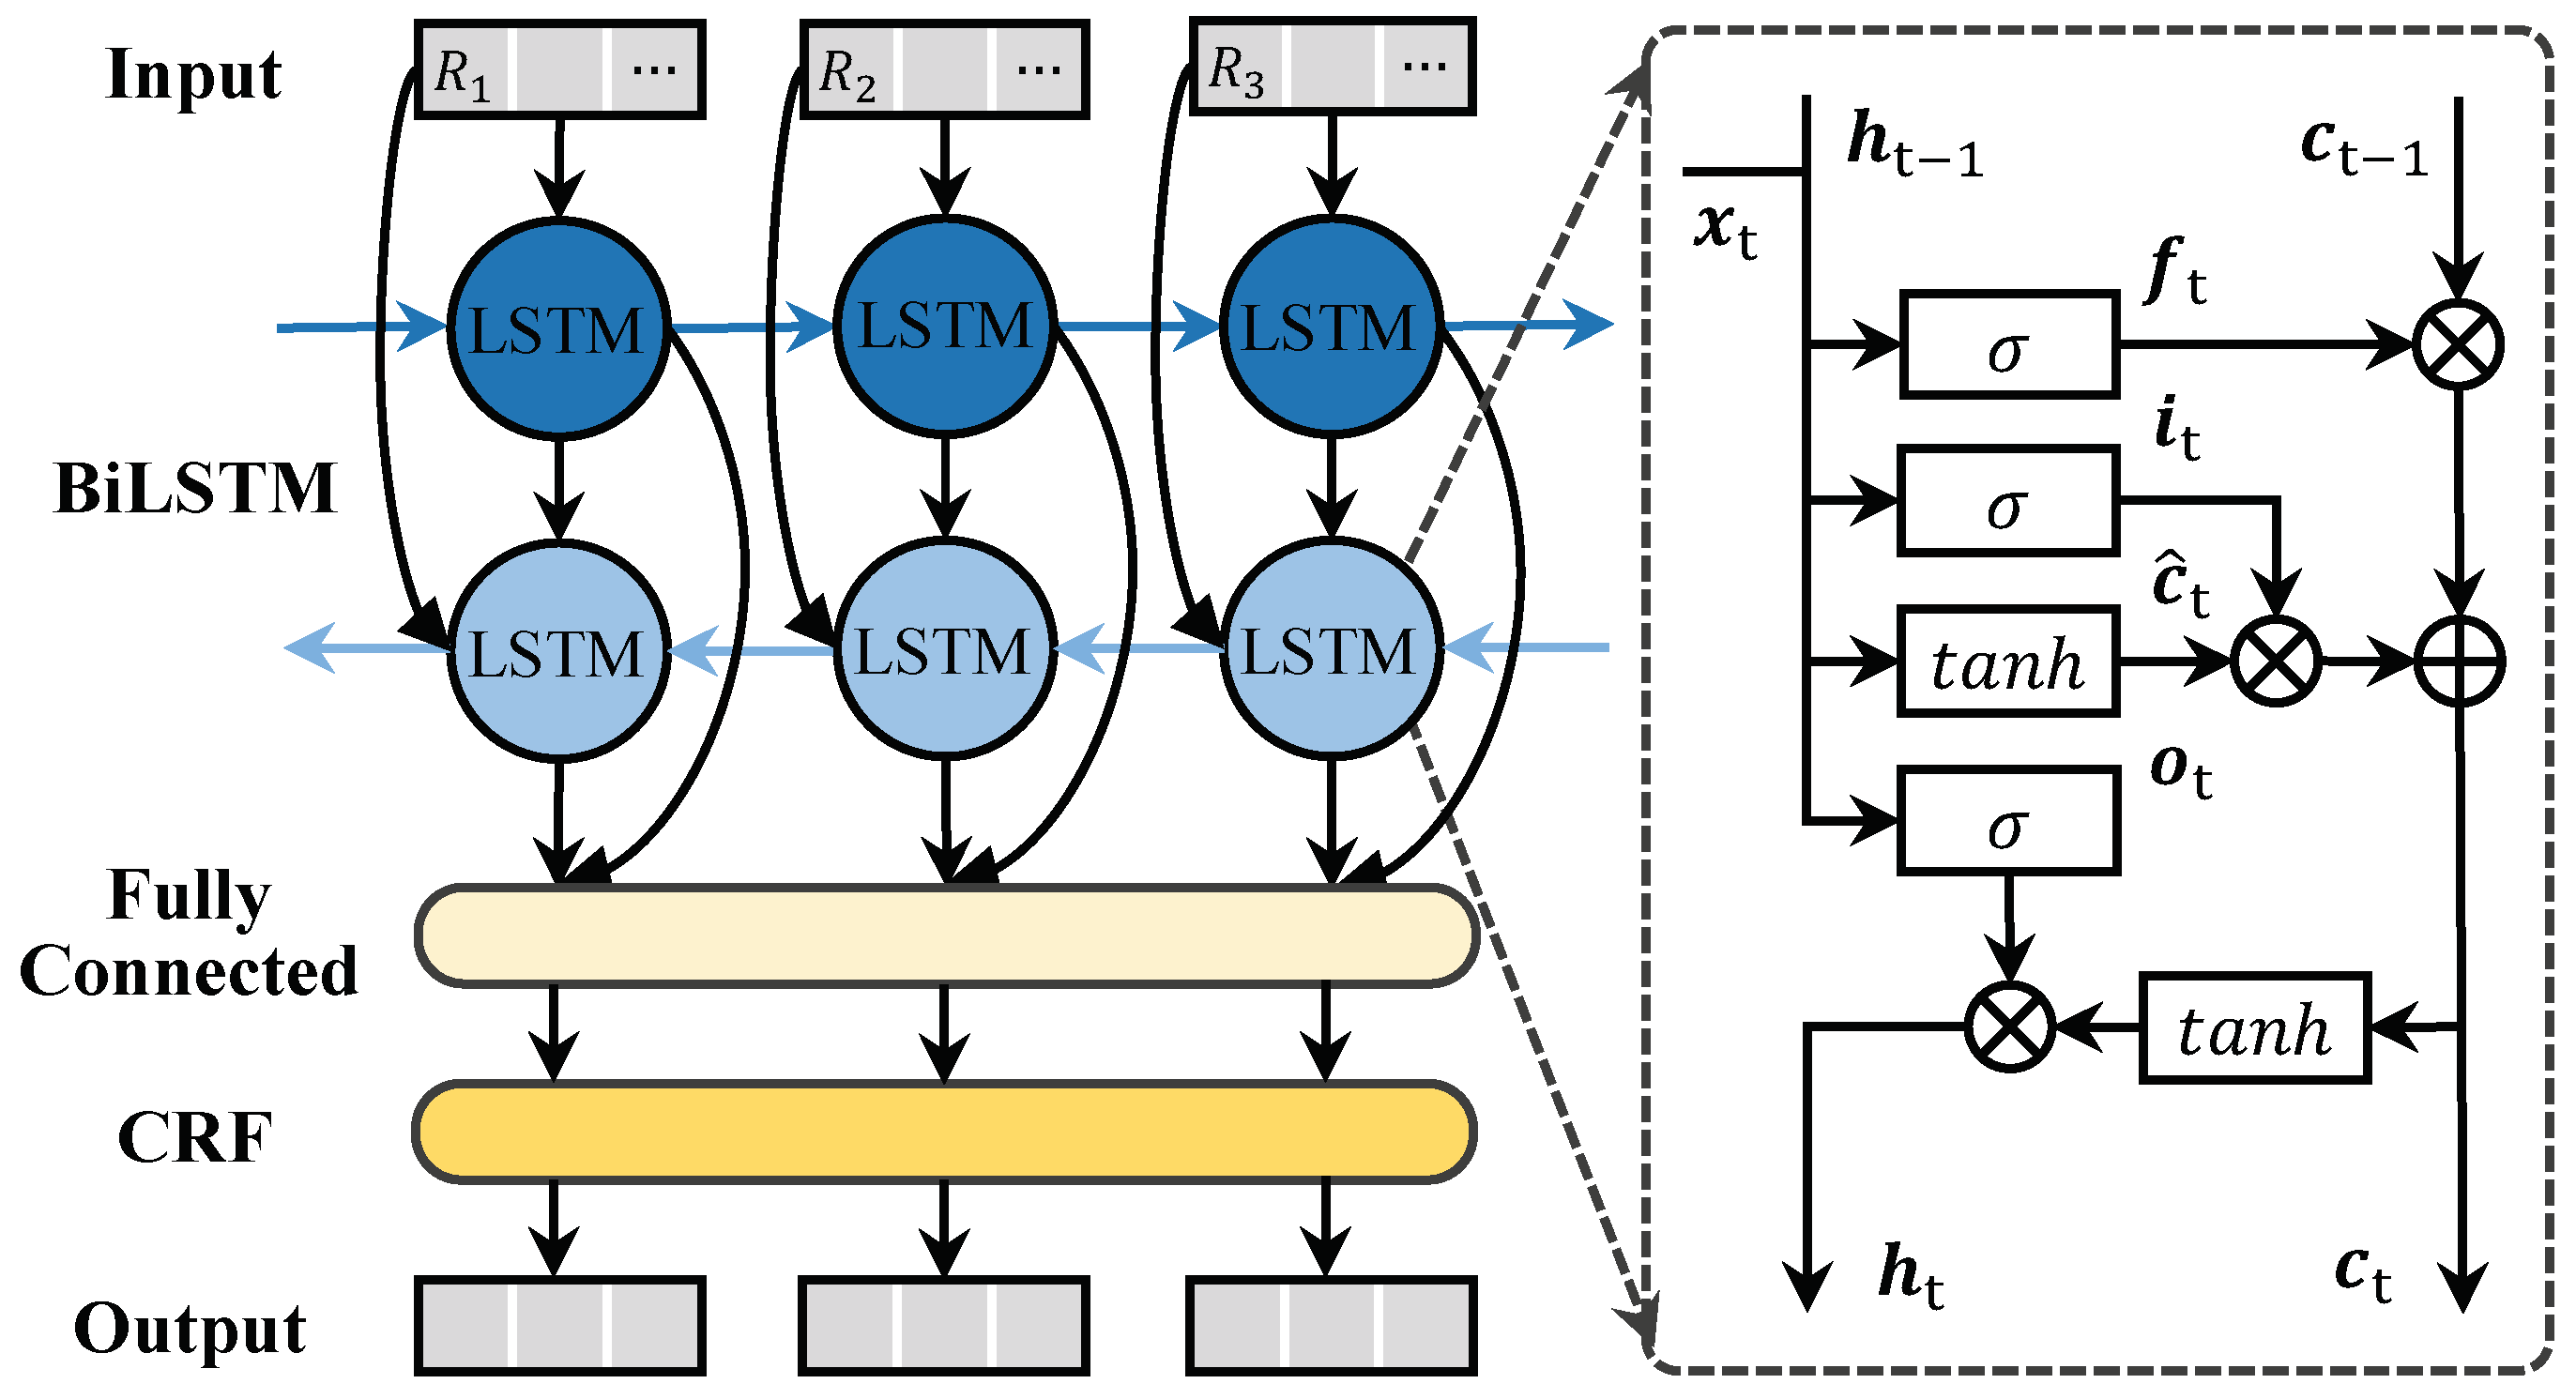
2.2.2. Location Extraction

The toponym entity recognition model for location extraction is illustrated in Figure 3. The text representations obtained from Section 2.2.1 are input to the BiLSTM, which is structured into two layers; the forward LSTM processes the input from left to right, while the backward LSTM processes in the opposite direction. Each layer includes memory cells responsible for maintaining cell states and three gates (i.e., the forget gate, the input gate, and the output gate) that regulate the handling of information at each time step. These gates determine whether information should be remembered, forgotten, or output in the model’s processing.
Specifically, the forget gate decides which information from the cell state needs to be forgotten:
f t = σ ( W f · [ h t 1 , x t ] + b f )
where the weight matrix W f is dot-multiplied with the hidden state h t 1 of the previous time step and the input data x t of the current time step, and then the bias vector b f is added. The sigmoid function σ is applied to the forget gate, scaling its value between 0 and 1. A value of 0 signifies the complete forgetting of information, while a value of 1 indicates retention of all information.
Similarly, the input gate and output gate, which determine what new information is added to the cell state and what parts of the cell state are output to the hidden state, can be calculated from
i t = σ ( W i · [ h t 1 , x t ] + b i )
o t = σ ( W o · [ h t 1 , x t ] + b o )
The candidate cell state, which represents new information for potential addition to the cell state, is generated using the hyperbolic tangent function:
c ^ t = tanh ( W c · [ h t 1 , x t ] + b c )
where tanh is the hyperbolic tangent function.
Then, the cell state and the hidden state of the current time step are updated by
c t = f t c t 1 + i t c ^ t
h t = o t tanh ( c t )
where c t 1 is the cell state of the previous time step.
BiLSTM enhances the semantic understanding of text representations by capturing contextual information from both directions in the text. The output of BiLSTM is passed through a fully connected layer to generate an emission score matrix of size n × k , where n is the number of words, and k is the number of toponym labels. This matrix reflects the likelihood of each label for each word. The sequence score is then calculated as the sum of the emission scores and transition scores across all words:
score ( X , Y ) = i = 1 n P i , y i + j = 1 n + 1 A y j 1 , y j
where X is the text representations, and Y is the predicted label sequence. Here, P represents the emission score matrix, with P i , y i indicating the score for label y i corresponding to word i. The transition score matrix A captures the scores for transitioning between labels, with A y j 1 , y j denoting the score for moving from label y j 1 to label y j .
The CRF layer utilizes these emission and transition scores to model the relationships between adjacent labels and to determine the most likely sequence of labels. To derive the optimal label sequence, the Viterbi algorithm is employed:
Y * = arg max Y Y X score ( X , Y )
where Y is the real label sequence, Y X is all possible label sequences, and Y * is the maximum score output sequence.
After assigning labels to each word in the texts, we use the Amap Application Programming Interface (API) to geocode the locations to their corresponding coordinates, and then use reverse geocoding to determine the associated provinces and cities.

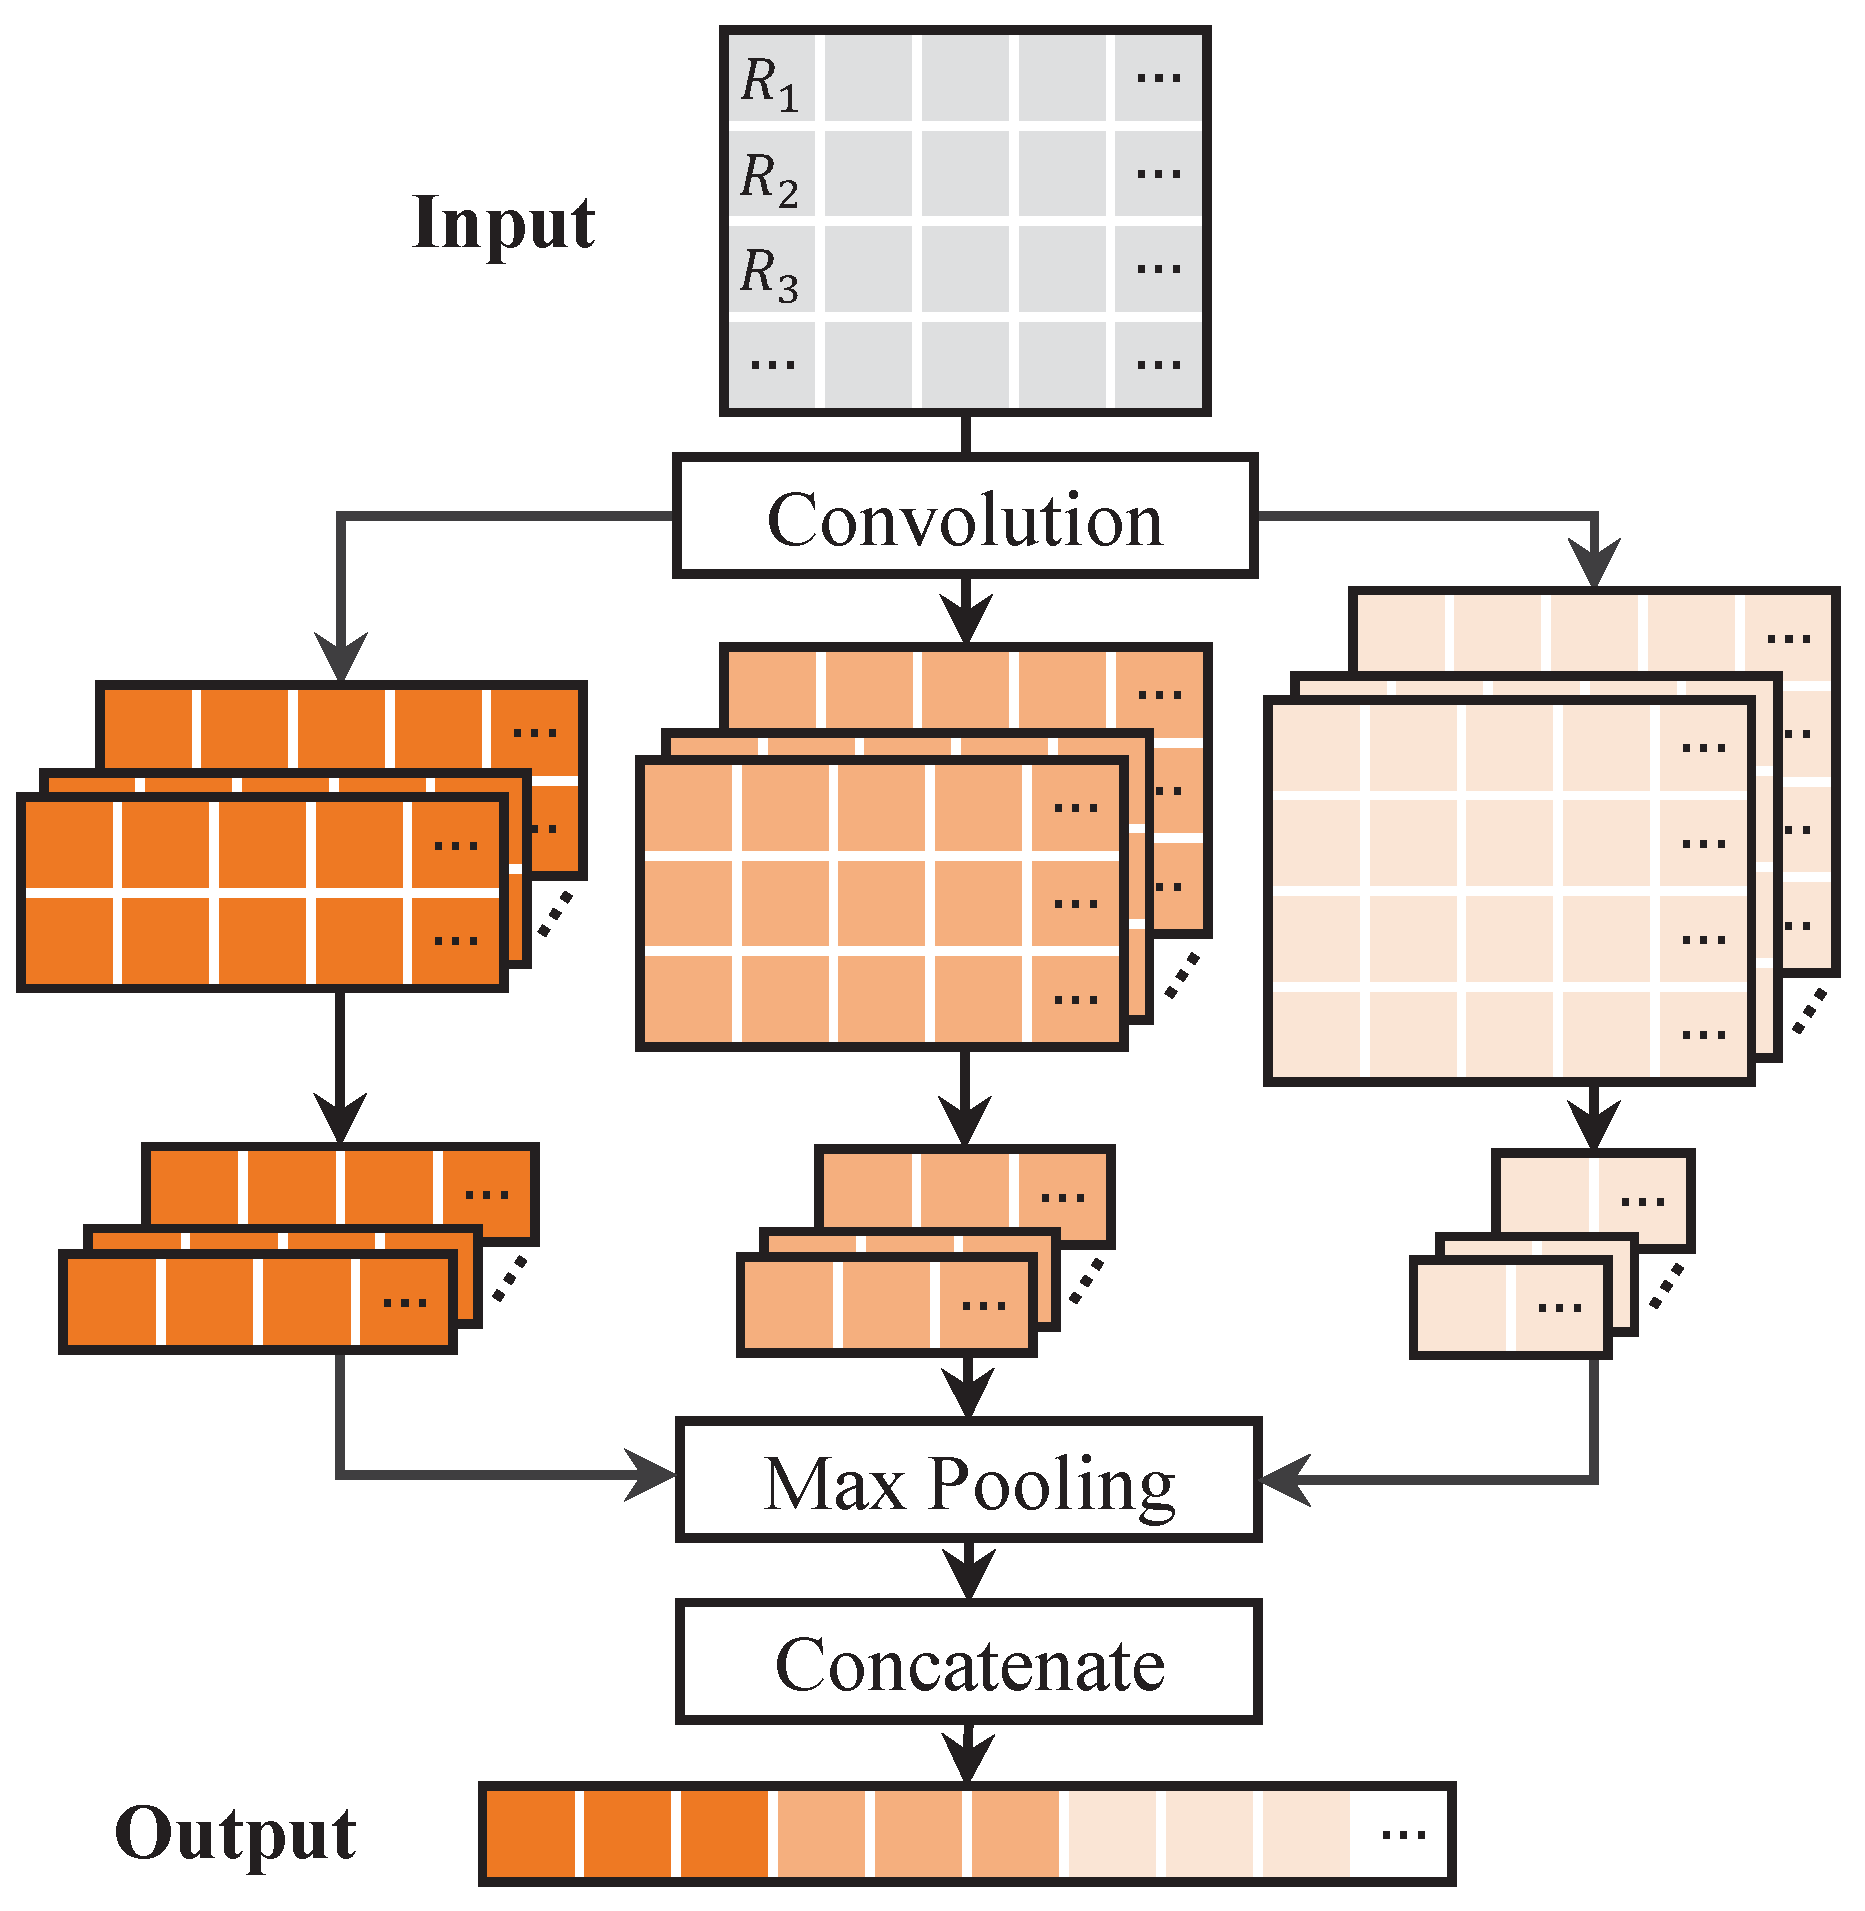
2.2.3. Damage Identification

The multi-label classification model for damage identification is shown in Figure 4. The text representations obtained from Section 2.2.1 are fed into this model, which employs multiple convolutional kernels of varying sizes to capture different feature levels from the texts. Smaller kernels focus on character-level patterns, while larger kernels capture higher-level semantic patterns. After the convolution operation, a max pooling layer is applied to down-sample the feature maps produced by the various kernels, which retains essential information while reducing dimensionality. These pooled features are then concatenated and flattened into a single vector for the multi-label classification model output. This output is subsequently processed by a fully connected layer to learn higher-level representations and followed by the application of a sigmoid function to generate multi-label predictions.

2.2.4. Multi-Task Learning Framework

In this section, we devise toponym-enhanced weights to further strengthen the text representations (Section 2.2.1) by building a connection between location extraction (Section 2.2.2) and damage identification (Section 2.2.3) in the multi-task learning framework. The BIO-labeled sequence from the location extraction is first processed by a fully connected layer to learn the relationships between toponym and non-toponym entities. A softmax function is then applied to generate weights for each word in the texts. These toponym-enhanced weights are multiplied with the text representations before damage identification proceeds, emphasizing toponym-related words and their association with damage information. In the subsequent convolution and max pooling layers, the toponym-enhanced weights are continuously updated, highlighting crucial information for both location extraction and damage identification, thereby effectively balancing these two tasks and improving the overall model performance.
In the multi-task learning framework, the total loss function comprises the losses for both location extraction and damage identification tasks. For the toponym entity recognition model in the location extraction task, the probability of the predicted label sequence is calculated, and the loss of location extraction, denoted as L L E , is determined by the negative likelihood function of this probability:
P ( Y | X ) = e x p ( score ( X , Y ) ) / Y Y X e x p ( score ( X , Y ) )
L L E = ln P ( Y | X ) = ln Y Y X e x p ( score ( X , Y ) ) score ( X , Y )
where X, Y, Y , and Y X have the same definitions as in Equations (8) and (9).
For the multi-label classification model in the damage identification task, we adopt focal loss to mitigate the impact of imbalanced category distributions. Unlike traditional cross-entropy or weighted loss functions, focal loss dynamically down-weights well-classified samples and places greater emphasis on hard or minority-class examples. This property is particularly valuable in our setting, where certain damage categories (e.g., electricity) are significantly underrepresented. By doing so, the model is encouraged to learn more discriminative features for rare damage types without being overwhelmed by dominant classes. In our implementation, focal loss is applied independently to each category c , and the overall loss L D I is calculated as the mean across all categories:
L D I = 1 C c = 1 C ( 1 p c ) γ log ( p c )
where C represents the total number of damage categories, and p c is the probability that a text is associated with a specific damage category c . γ denotes the focusing parameter, which is set to 2 in this case, used to smooth the adjustment of the degradation rate of the easy samples.
Alongside the last hidden layer, we specifically select the outputs of layer 4 and layer 8 of BERT as two auxiliary classifiers to further enhance the text representations and speed up model training. The total loss of the model, denoted as L , is the weighted sum of the losses for location extraction and damage identification, incorporating the losses of two auxiliary classifiers for each task:
L L E = L L E + α A C ( L A C 1 + L A C 2 )
L D I = L D I + α A C ( L A C 1 + L A C 2 )
L = α M T L L E + L D I
where L A C 1 and L A C 2 are the losses of two auxiliary classifiers. α A C and α M T represent the weighting factors of auxiliary classifiers and multi-task leaning, which are set to 0.3 and 0.001, respectively.

2.2.5. Experiment Designs and Model Evaluation

In our proposed method, we initialize BERT with pre-trained weights from “bert-base-chinese” (available at https://huggingface.co/bert-base-chinese, accessed on 15 October 2024) and limit the maximum text length to 100 words. The BiLSTM is configured with an input size of 768 and a hidden size of 384 and consists of two layers. For the CNN component, the sizes of the convolutional kernels are set to (2, 3, 4) × 768, with 100 kernels allocated for each size. The training batch size is set to 32, and the initial learning rate is set to 2 × 10 5 . We employ adaptive moment estimation (Adam) as the optimizer to dynamically adjust the learning rate to accelerate parameters convergence, and parameters are updated using a mini-batch gradient descent approach. Early stopping is applied to avoid overfitting, where training is terminated if the total loss does not decrease within 3 or 5 consecutive epochs, and the model with the lowest validation loss is selected for inference. All models are implemented using the Python 3.7 and the PyTorch deep learning framework.
In the experiment, we adopt precision, recall, and F1-score to evaluate model performance. Precision measures the accuracy of the model’s positive predictions by calculating the ratio of correctly predicted positive observations to the total predicted positives. Recall measures the ability of the model to identify all relevant instances in the dataset, defined as the ratio of correctly predicted positive observations to all actual positives. The F1-score is a harmonic mean of precision and recall, providing a balanced metric that accounts for both false positives and false negatives. For multi-label classification in particular, these metrics are computed for each category and then averaged across all categories. The macro-averaging method treats each category equally, allowing a comprehensive evaluation of the model’s performance across different typhoon damage categories. Using these evaluation metrics, we can thoroughly assess the effectiveness of the model in location extraction and damage identification. To ensure the robustness of our results, each experiment is repeated ten times, and the average scores are reported to reduce the impact of random variations during training.

3. Results

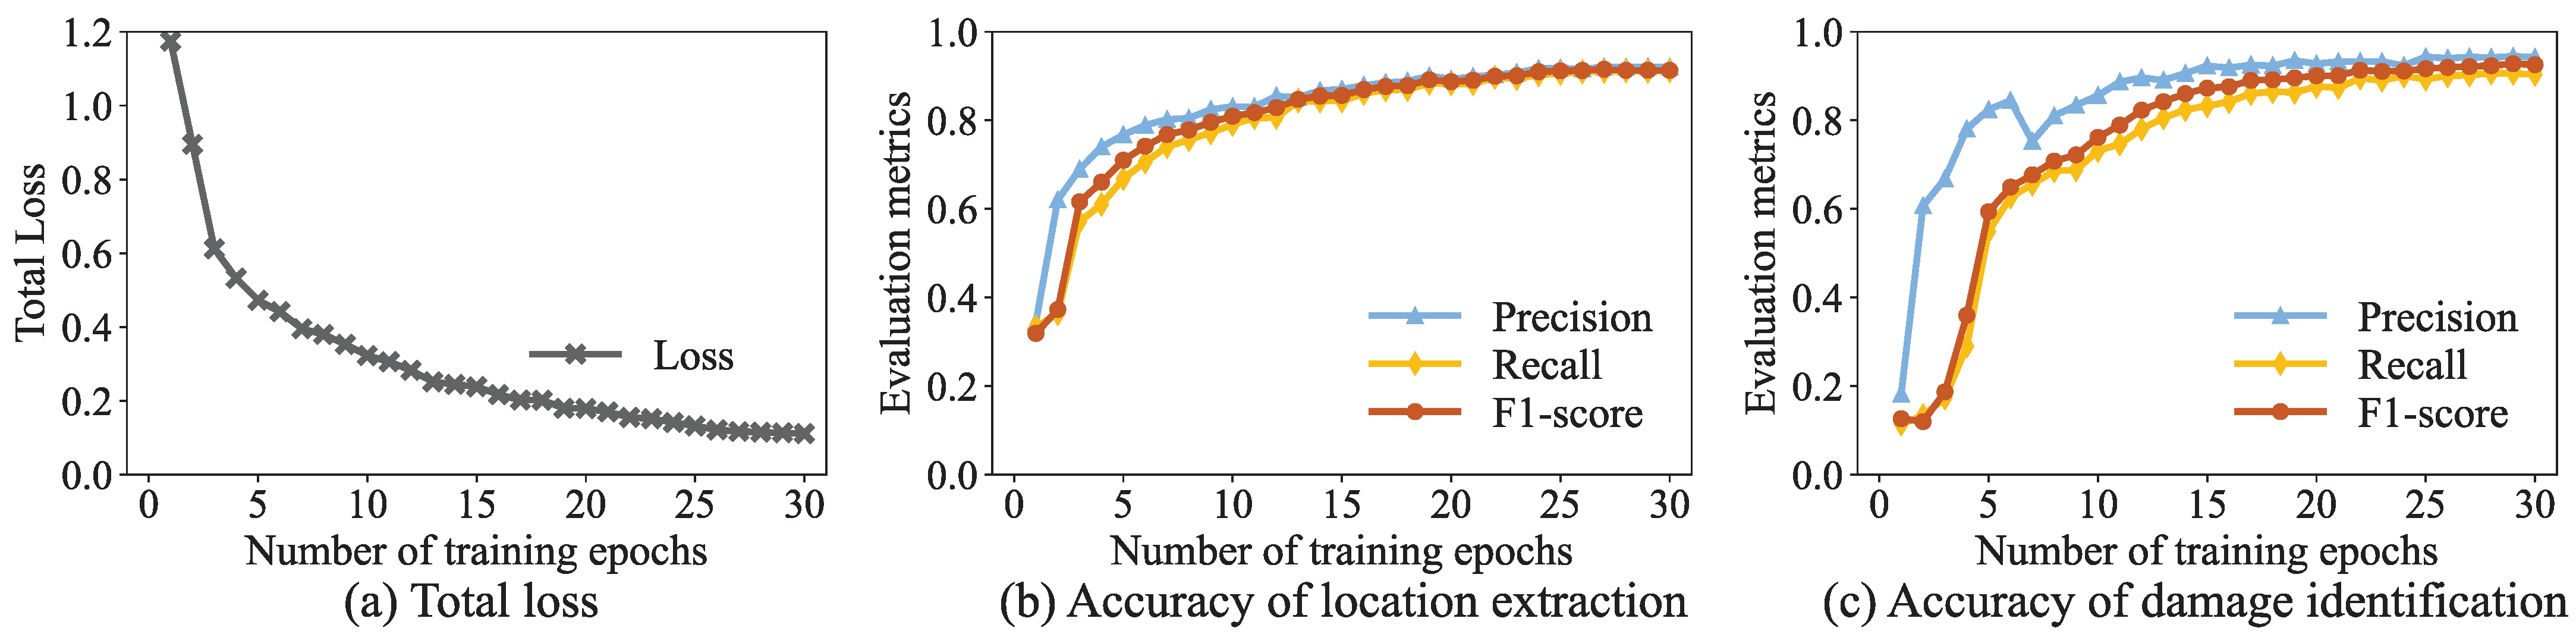
3.1. Model Performance

The effectiveness of multi-task learning, auxiliary classifiers, and toponym-enhanced weights on model performance is demonstrated through ablation experiments. Table 4 presents the model performance for location extraction and damage identification.
Compared to processing the two tasks separately (Model 1), multi-task learning improves most metrics for both location extraction and damage identification (Model 2). To further improve model performance, we integrate auxiliary classifiers and toponym-enhanced weights into the multi-task learning framework. Auxiliary classifiers within each task aggregate semantic information from different hidden layers of BERT, leading to F1-score increases of 0.016 for location extraction and 0.018 for damage identification (Model 3). In addition, toponym-enhanced weights enhance text representations by emphasizing toponym-related words, which are crucial in typhoon damage descriptions and are often associated with damage-related terms. This bridging of these two tasks results in F1-score increases of 0.020 for location extraction and 0.010 for damage identification (Model 4). Overall, our proposed method achieves the best results, with F1-scores of 0.891 and 0.898 for location extraction and damage identification, respectively (Model 5).
Moreover, as shown in Figure 5, the loss and accuracy curves for the training of the proposed method indicate that the loss decreases quickly during the first five epochs, then more gradually, and finally stabilizes after epoch 25. Concurrently, the accuracy of location extraction and damage identification increases rapidly in the initial epochs, then rises slowly and eventually stabilizes. These trends further verify the effectiveness of the method proposed in this paper.
The improved model performance not only demonstrates technical effectiveness but also holds practical significance for real-world disaster management. In the context of rapidly evolving typhoon disasters, higher accuracy in extracting location and damage information from social media texts enables more timely and precise situational awareness. Accurate location extraction helps identify affected areas at finer spatial scales, while reliable multi-label damage identification allows for a better understanding of diverse impact types. These capabilities facilitate the analysis of the spatial distribution and temporal patterns of typhoon damage, which are critical for supporting rapid emergency response, optimizing resource allocation, and informing long-term resilience planning.

3.2. Spatial Distribution of Typhoon Damage

Considering the diverse locations mentioned in texts, we follow a specific guideline to determine their locations and achieve higher accuracy. First, we use the geotagged locations of the texts. Next, we apply our proposed method to extract locations. Finally, we match locations using a gazetteer-based approach. Furthermore, considering that more populous cities may post more typhoon-damage-related texts on social media, we use population data to adjust the number of texts to reduce bias caused by uneven population distribution.
The spatial distribution of typhoon damage, as shown in Figure 6, exhibits a clear pattern of declining damage intensity from coastal regions to inland areas. This general trend reflects the weakening of the typhoon as it progresses further inland, which is a well-established characteristic in the dynamics of typhoons. The typhoon’s path, as illustrated in the figure, traces its geographic trajectory from its initial landfall to its eventual dissipation. The most severe damage typically occurs when the typhoon makes landfall, as the typhoon’s full force is unleashed upon coastal areas. This results in a higher number of damage-related texts in these regions, where the typhoon’s intensity is greatest. As the typhoon moves inland, its wind speed and overall strength diminish, leading to a corresponding decrease in the frequency of damage-related reports. This trend underscores the importance of monitoring the typhoon’s progression and intensity in real time to inform disaster response strategies effectively.
However, while this general trend is observable, it is crucial to recognize the distinctive characteristics of different typhoons. For instance, the spatial distribution of damage caused by Typhoon In-fa (Figure 6a) deviates from the typical coastal-to-inland gradient observed in Typhoons Chaba and Doksuri (Figure 6b,c). In the case of In-fa, there is a notable increase in the volume of damage-related texts in inland areas. This anomaly can be attributed to the significant amount of water vapor transported from the sea to the land by persistent easterly winds, which were influenced by the airflow dynamics of In-fa and the prevailing subtropical high-pressure systems. As these atmospheric conditions lead to prolonged and intense rainfall, the resulting floodwaters and infrastructure damage contributed to a higher incidence of damage reports even in regions that are typically less affected by typhoons. This highlights the role of various environmental factors in shaping the spatial extent and intensity of typhoon damage.
In addition to the observed coastal-to-inland damage gradient, the spatial distribution of typhoon damage provides critical insights for disaster management and resource allocation. Understanding that coastal areas are typically more vulnerable to immediate typhoon impacts, and that inland areas may experience indirect effects such as flooding and prolonged rainfall, can guide decision-making in terms of preparedness and response. Furthermore, it is essential to recognize that the impact of a typhoon extends beyond its direct effects. Factors such as local topography, regional atmospheric conditions, and subsequent environmental factors (e.g., rain-induced landslides) often play significant roles in shaping the overall damage pattern. Therefore, effective disaster management strategies must incorporate not only the immediate damage caused by the typhoon itself but also the secondary consequences arising from the interaction of these various factors.
To strengthen the resilience of cities and regions against such extreme weather events, it is vital to integrate contingency measures that account for both the direct and indirect effects of typhoons. This can include enhancing infrastructure to withstand high winds and floods, improving early warning systems, and implementing land-use planning strategies that mitigate the impact of rainfall and flooding. By adopting a comprehensive approach that addresses the full spectrum of typhoon-related risks, cities can better prepare for future storms and minimize their devastating effects.

3.3. Temporal Pattern of Typhoon Damage

Figure 7 presents the number and average proportion of texts related to five damage categories (i.e., transportation, public, electricity, forestry, and waterlogging) over seven days for each typhoon. The figure reflects the temporal evolution of damage-related texts, with the bold date on the horizontal axis marking the time of the typhoon’s landfall. The patterns observed represent fluctuations in the volume of daily damage-related texts and highlight the changing nature of public discourse as the typhoon progresses.
In general, the temporal pattern of typhoon-related damage provokes a clear increase in the number of damage-related texts as the typhoon approaches land, peaking on the day of landfall. This peak corresponds to a surge in public attention where the typhoon’s imminent arrival prompts heightened concern and reporting. The number of texts gradually decreases in the days following landfall as the typhoon weakens. The distribution of damage-related texts across the five categories also varies over time, reflecting the evolving nature of the disaster. Prior to landfall, transportation-related damage is most prominent, driven largely by preventive measures such as road closures, transport suspensions, and heightened public awareness of the impending storm. This early spike in transportation-related texts indicates the disruption to mobility and daily routines as a result of precautionary actions.
On the day of landfall, the number of damage-related texts reaches its peak, illustrating the immediate impact of the typhoon’s full force. However, the type of damage reported varies significantly between different typhoons. For instance, Typhoon In-fa (Figure 7a) is associated with a higher proportion of texts related to transportation and waterlogging issues, likely due to its combination of high winds and heavy rainfall. In contrast, Typhoon Chaba (Figure 7b) results in a predominance of waterlogging-related damage, reflecting the extended rainfall and subsequent flooding in inland areas. Similarly, Typhoon Doksuri (Figure 7c) generates a significant number of damage-related texts related to electricity outages, likely due to the extensive power disruptions caused by high winds and infrastructure failure. These variations underscore the distinct characteristics of each typhoon and the differential impact of their specific features, such as wind speed, rainfall volume, and path trajectory, on the affected regions.
As the typhoon dissipates and the storm’s intensity decreases, the frequency of damage-related texts generally wanes. However, in some cases, the effects of prolonged rainfall, particularly in the case of waterlogging, persist. This extended impact highlights the importance of considering both immediate and secondary effects in disaster response planning. While the number of damage-related texts decreases post-landfall, waterlogging often remains the predominant issue, particularly for storms that involve heavy or sustained rainfall.
The temporal analysis of typhoon damage provides crucial insights for disaster management and resource allocation, both before and after landfall. The early surge in transportation-related damage indicates the need for preemptive traffic restrictions, which should be implemented based on forecasts of the typhoon’s intensity and projected landfall. By restricting movement in high-risk areas before the storm’s arrival, cities can minimize the impact of disruption on daily life and ensure a more efficient response to the storm. Furthermore, the varying characteristics of damage across different typhoons suggest that response strategies should be tailored to the specific nature of each event. For example, areas experiencing significant waterlogging may require specialized drainage solutions and flood management efforts, while regions affected by widespread power outages will need rapid restoration of electricity infrastructure.
Once the typhoon makes landfall, the nature of the damage becomes more consistent across regions, allowing for the implementation of standardized response strategies. Post-landfall, the focus shifts to recovery, with attention directed to the areas most affected by waterlogging or other persistent forms of damage. Pre-planned contingency measures, such as stockpiling resources for post-storm recovery or deploying specialized teams for specific damage types, can enhance the efficiency of disaster relief efforts.

4. Discussion

In this paper, we propose a novel multi-task learning framework for location extraction and damage identification from social media texts. To the best of our knowledge, such an approach has not been explored in the field of typhoon damage assessment, marking this approach as a significant advancement in leveraging social media data for disaster management.
Our findings underscore the value of social media as a real-time information source for disaster response. While prior research has highlighted the potential of social media data for enhancing disaster management, most existing studies focus on either location information or damage identification [24,47] but rarely both. This gap is particularly significant given the urgency of disaster scenarios, where understanding the spatial distribution and nature of damage is critical for effective response and resource allocation. By mining location and damage information concurrently, our framework addresses this need and provides a more holistic view of disaster impact. Specifically, we standardize location extraction to the provincial and city levels and categorize damage into transportation, public, electricity, forestry, and waterlogging. This categorization allows government agencies and rescue organizations to gain actionable insights into disaster scenarios and implement targeted interventions.
Furthermore, the proposed method exhibits adaptability to a range of natural disasters, including floods and earthquakes. While our current study focuses on typhoon-related disasters, the underlying framework—particularly the joint modeling of location and damage-related information—can be generalized to other disaster types. For instance, in the context of earthquakes, damage-related expressions often involve collapsed buildings or casualties, while location information may include affected districts or seismic zones. Similarly, flood-related posts frequently describe inundated areas, blocked roads, or evacuation needs. These types of information are structurally similar to typhoon-related content and can be captured through location extraction and damage identification tasks. Therefore, by fine-tuning the model on annotated datasets for these events, the framework could effectively generalize across different disaster scenarios.
Despite the contributions of this study, several limitations remain. First, the reliance on SinaWeibo data may introduce biases due to variations in user demographics and activity patterns. For example, individual users often post subjective content, while organizational accounts typically share official updates, which can lead to imbalances in the dataset. In addition, urban users tend to be more active on social media than rural users, potentially skewing the spatial distribution of the data. Future work could address this issue by distinguishing between different types of accounts and integrating data from other social media platforms to enhance the diversity and representativeness of the dataset.
Second, the ambiguity of toponym entities poses challenges for spatial mapping, as identical place names in different regions can lead to errors in location identification. This issue may reduce the accuracy of spatial distribution analyses, especially in densely populated or geographically complex areas. To address this limitation, future work could investigate advanced disambiguation techniques, such as incorporating contextual cues or leveraging external geographic knowledge bases to enhance spatial precision. For instance, analyzing co-occurring place names or event-related keywords within a post could provide additional clues for inferring the correct location. Moreover, linking extracted toponyms to structured geographic databases like GeoNames or OpenStreetMap may help distinguish between places with identical names by considering their spatial hierarchy, population density, or proximity to other referenced entities. Such methods could significantly improve the robustness and accuracy of location extraction in complex geographic contexts.
Third, although this study treats each typhoon as an independent event, the cumulative effects of successive disasters warrant further investigation. When multiple typhoons occur in close succession, disaster-related posts on social media often increase, as the prolonged impact period disrupts public expectations regarding the end of the disaster. While the three typhoons examined in this study made landfall at different times, we observed that users in areas previously affected by severe typhoon damage tended to mention earlier events when discussing a new typhoon. This indicates a psychological or experiential linkage, where users compare incoming typhoons to past disasters. Such cumulative perceptions may influence public awareness and response, and should be considered in future research.
Finally, while our framework effectively extracts location and damage data, there are several avenues for further refinement. For example, incorporating sentiment analysis could provide deeper insights into the emotional tone or severity of damage reports, offering a more nuanced understanding of the disaster’s social impact [48,49]. Additionally, integrating real-time satellite or sensor data could create a more comprehensive disaster management system, enhancing the timeliness and accuracy of disaster response [50,51]. Combining social media data with these additional sources could lead to a more robust model capable of providing real-time, actionable insights for emergency responders and policymakers.

5. Conclusions

This paper proposes a multi-task learning method that synergizes location extraction and damage identification to perform spatiotemporal typhoon damage assessment from social media texts. Different from existing methods, our approach offers three key advantages: First, we enable simultaneous location extraction and damage identification from social media texts in a unified multi-task learning framework. Second, we obtain augmented text representations by introducing auxiliary classifiers to capture underlying information from BERT and by designing toponym-enhanced weights to link these two tasks. Third, our method achieves higher accuracy in spatiotemporal typhoon damage assessment through toponym entity recognition and multi-label classification models. Experimental evaluations demonstrate its effectiveness, achieving F1-scores of 0.891 for location extraction and 0.898 for damage identification. A case study on three recent typhoons (In-fa, Chaba, and Doksuri) that impacted China’s coastal regions highlights the spatial distribution and temporal pattern of typhoon damage, providing valuable insights for disaster management and resource allocation while supporting urban resilience and sustainable development.
Furthermore, the proposed method exhibits adaptability to a range of natural disasters and emergency situations. Future advancements could focus on integrating multi-modal data sources, such as social media, remote sensing imagery, and geospatial information, to enrich the analysis and provide a more comprehensive view of disaster impacts. Moreover, incorporating multilingual content would further broaden the method’s applicability, and future work could explore the generalizability of the proposed framework across different languages and regions—particularly in low-resource settings where disaster information is often underrepresented but critically needed.

Author Contributions

Conceptualization, formal analysis: Liwei Zou and Zhi He; resources, writing—review and editing, supervision, project administration, funding acquisition: Zhi He; methodology, software, validation, data curation, writing—original draft preparation, visualization: Liwei Zou and Zhi He; writing—review and editing: XianweiWang and Yutian Liang. All authors have read and agreed to the published version of the manuscript.

Funding

This work was supported in part by the National Natural Science Foundation of China under grant no. 42271325, the National Key Research and Development Program of China under grant no. 2020YFA0714103, the Fundamental Research Funds for the Central Universities, Sun Yat-sen University, under grant no. 24lgqb002, and the Innovation Group Project of Southern Marine Science and Engineering Guangdong Laboratory (Zhuhai) under grant no. 311021018.

Data Availability Statement

Data will be made available on request.

Acknowledgments

The authors would like to thank the editor and anonymous reviewers for their positive comments on the manuscript.

Conflicts of Interest

The authors declare no conflicts of interest.

References

  1. Cao, T.M.; Lee, S.H.; Lee, J.Y. The Impact of Natural Disasters and Pest Infestations on Technical Efficiency in Rice Production: A Study in Vietnam. Sustainability 2023, 15, 11633. [Google Scholar] [CrossRef]
  2. Bachmann, L.; Lex, R.; Regli, F.; Vögeli, S.; Mühlhofer, E.; McCaughey, J.W.; Hanger-Kopp, S.; Bresch, D.N.; Kropf, C.M. Climate-Resilient Strategy Planning Using the Swot Methodology: A Case Study of the Japanese Wind Energy Sector. Clim. Risk Manag. 2024, 46, 100665. [Google Scholar] [CrossRef]
  3. Jalloul, H.; Choi, J.; Yesiller, N.; Manheim, D.; Derrible, S. A Systematic Approach to Identify, Characterize, And Prioritize the Data Needs for Quantitative Sustainable Disaster Debris Management. Resour. Conserv. Recycl. 2022, 180, 106174. [Google Scholar] [CrossRef]
  4. Sahana, M.; Patel, P.P.; Rehman, S.; Rahaman, M.H.; Masroor, M.; Imdad, K.; Sajjad, H. Assessing the Effectiveness of Existing Early Warning Systems and Emergency Preparedness Towards Reducing Cyclone-Induced Losses in the Sundarban Biosphere Region, India. Int. J. Disaster Risk Reduct. 2023, 90, 103645. [Google Scholar] [CrossRef]
  5. Lam, N.S.; Meyer, M.; Reams, M.; Yang, S.; Lee, K.; Zou, L.; Mihunov, V.; Wang, K.; Kirby, R.; Cai, H. Improving Social Media Use for Disaster Resilience: Challenges and Strategies. Int. J. Digit. Earth 2023, 16, 3023–3044. [Google Scholar] [CrossRef]
  6. Robinson, S.a. Patterns of Hurricane Induced Displacement in the Bahamas: Building Equitable Resilience in Small Island Developing States. Clim. Risk Manag. 2024, 45, 100634. [Google Scholar] [CrossRef]
  7. Rodríguez, O.; Bech, J.; Soriano, J.d.D.; Gutiérrez, D.; Castán, S. A Methodology to Conduct Wind Damage Field Surveys for High-Impact Weather Events of Convective Origin. Nat. Hazards Earth Syst. Sci. 2020, 20, 1513–1531. [Google Scholar] [CrossRef]
  8. Chen, X.; Avtar, R.; Umarhadi, D.A.; Louw, A.S.; Shrivastava, S.; Yunus, A.P.; Khedher, K.M.; Takemi, T.; Shibata, H. Post-Typhoon Forest Damage Estimation Using Multiple Vegetation Indices and Machine Learning Models. Weather Clim. Extrem. 2022, 38, 100494. [Google Scholar] [CrossRef]
  9. Zhou, C.; He, Z.; Lai, G.; Plaza, A. A Selective Semantic Transformer for Spectral Super-Resolution of Multispectral Imagery. IEEE J. Sel. Top. Appl. Earth Obs. Remote Sens. 2025, 18, 7436–7450. [Google Scholar] [CrossRef]
  10. Li, S.; Lin, Y.; Huang, H. Relief Supply-Demand Estimation Based on Social Media in Typhoon Disasters Using Deep Learning and a Spatial Information Diffusion Model. ISPRS Int. J. Geo-Inf. 2024, 13, 29. [Google Scholar] [CrossRef]
  11. Hou, R.; Lian, P.; Han, Z.; Yan, A. Differences in Disaster Warning and Community Engagement Between Families with and Without Members Suffering from Chronic Diseases: The Mediating Role of Satisfaction with Warning Service. Clim. Risk Manag. 2024, 44, 100607. [Google Scholar] [CrossRef]
  12. Shen, S.; Huang, J.; Cheng, C.; Zhang, T.; Murzintcev, N.; Gao, P. Spatiotemporal evolution of the online social network after a natural disaster. ISPRS Int. J. Geo-Inf. 2021, 10, 744. [Google Scholar] [CrossRef]
  13. Karimiziarani, M.; Shao, W.; Mirzaei, M.; Moradkhani, H. Toward Reduction of Detrimental Effects of Hurricanes Using a Social Media Data Analytic Approach: How Climate Change Is Perceived? Clim. Risk Manag. 2023, 39, 100480. [Google Scholar] [CrossRef]
  14. Lu, X.; Chan, F.K.S.; Chan, H.K.; Chen, W.Q. Mitigating Flood Impacts on Road Infrastructure and Transportation by Using Multiple Information Sources. Resour. Conserv. Recycl. 2024, 206, 107607. [Google Scholar] [CrossRef]
  15. Du, W.; Xia, Q.; Cheng, B.; Xu, L.; Chen, Z.; Zhang, X.; Huang, M.; Chen, N. Flood Inundation Probability Estimation by Integrating Physical and Social Sensing Data: Case Study of 2021 Heavy Rainfall in Henan, China. Remote Sens. 2024, 16, 2734. [Google Scholar] [CrossRef]
  16. Huang, S.; Du, Y.; Yi, J.; Liang, F.; Qian, J.; Wang, N.; Tu, W. Understanding human activities in response to typhoon Hato from multi-source geospatial big data: A case study in Guangdong, China. Remote Sens. 2022, 14, 1269. [Google Scholar] [CrossRef]
  17. Mikolov, T.; Chen, K.; Corrado, G.; Dean, J. Efficient Estimation of Word Representations in Vector Space. arXiv 2013, arXiv:1301.3781. [Google Scholar] [CrossRef]
  18. Pennington, J.; Socher, R.; Manning, C.D. GloVe: Global Vectors for Word Representation. In Proceedings of the 2014 Conference on Empirical Methods in Natural Language Processing (EMNLP), Doha, Qatar, 25–29 October 2014; pp. 1532–1543. [Google Scholar]
  19. Radford, A.; Narasimhan, K.; Salimans, T.; Sutskever, I. Improving Language Understanding by Generative Pre-Training. Preprint, 2018; work in progress. [Google Scholar]
  20. Devlin, J.; Chang, M.W.; Lee, K.; Toutanova, K. BERT: Pre-Training of Deep Bidirectional Transformers for Language Understanding. arXiv 2018, arXiv:1810.04805. [Google Scholar] [CrossRef]
  21. Koroteev, M.V. BERT: A Review of Applications in Natural Language Processing and Understanding. arXiv 2021, arXiv:2103.11943. [Google Scholar] [CrossRef]
  22. Zhou, C.; Li, Q.; Li, C.; Yu, J.; Liu, Y.; Wang, G.; Zhang, K.; Ji, C.; Yan, Q.; He, L.; et al. A Comprehensive Survey on Pretrained Foundation Models: A History from BERT to ChatGPT. arXiv 2023, arXiv:2302.09419. [Google Scholar] [CrossRef]
  23. Liu, N.F.; Gardner, M.; Belinkov, Y.; Peters, M.E.; Smith, N.A. Linguistic Knowledge and Transferability of Contextual Representations. arXiv 2019, arXiv:1903.08855. [Google Scholar] [CrossRef]
  24. Zou, L.; He, Z.; Zhou, C.; Zhu, W. Multi-class Multi-label Classification of Social Media Texts for Typhoon Damage Assessment: A Two-Stage Model Fully Integrating the Outputs of the Hidden Layers of BERT. Int. J. Digit. Earth 2024, 17, 2348668. [Google Scholar] [CrossRef]
  25. Hu, X.; Zhou, Z.; Li, H.; Hu, Y.; Gu, F.; Kersten, J.; Fan, H.; Klan, F. Location Reference Recognition from Texts: A Survey and Comparison. ACM Comput. Surv. 2023, 56, 1–37. [Google Scholar] [CrossRef]
  26. Al-Olimat, H.S.; Thirunarayan, K.; Shalin, V.; Sheth, A. Location Name Extraction from Targeted Text Streams Using Gazetteer-Based Statistical Language Models. arXiv 2017, arXiv:1708.03105. [Google Scholar]
  27. Hu, X.; Al-Olimat, H.S.; Kersten, J.; Wiegmann, M.; Klan, F.; Sun, Y.; Fan, H. GazPNE: Annotation-Free Deep Learning for Place Name Extraction from Microblogs Leveraging Gazetteer and Synthetic Data by Rules. Int. J. Geogr. Inf. Sci. 2022, 36, 310–337. [Google Scholar] [CrossRef]
  28. Kumar, A.; Singh, J.P. Location Reference Identification from Tweets During Emergencies: A Deep Learning Approach. Int. J. Disaster Risk Reduct. 2019, 33, 365–375. [Google Scholar] [CrossRef]
  29. Zhou, B.; Zou, L.; Hu, Y.; Qiang, Y.; Goldberg, D. TopoBERT: A Plug and Play Toponym Recognition Module Harnessing Fine-Tuned BERT. Int. J. Digit. Earth 2023, 16, 3045–3064. [Google Scholar] [CrossRef]
  30. Mao, H.; Thakur, G.; Sparks, K.; Sanyal, J.; Bhaduri, B. Mapping Near-Real-Time Power Outages from Social Media. In Social Sensing and Big Data Computing for Disaster Management; Routledge: Abingdon, UK, 2020; pp. 88–102. [Google Scholar]
  31. Qiu, Q.; Zheng, S.; Tian, M.; Li, J.; Ma, K.; Tao, L.; Xie, Z. A Deep Neural Network Model for Chinese Toponym Matching with Geographic Pre-Training Model. Int. J. Digit. Earth 2024, 17, 2353111. [Google Scholar] [CrossRef]
  32. Ma, K.; Tan, Y.; Xie, Z.; Qiu, Q.; Chen, S. Chinese Toponym Recognition with Variant Neural Structures from Social Media Messages Based on BERT Methods. J. Geogr. Syst. 2022, 24, 143–169. [Google Scholar] [CrossRef]
  33. Qiu, Q.; Xie, Z.; Wang, S.; Zhu, Y.; Lv, H.; Sun, K. ChineseTR: A Weakly Supervised Toponym Recognition Architecture Based on Automatic Training Data Generator and Deep Neural Network. Trans. GIS. 2022, 26, 1256–1279. [Google Scholar] [CrossRef]
  34. Minaee, S.; Kalchbrenner, N.; Cambria, E.; Nikzad, N.; Chenaghlu, M.; Gao, J. Deep Learning–Based Text Classification: A Comprehensive Review. ACM Comput. Surv. 2021, 54, 1–40. [Google Scholar] [CrossRef]
  35. Liu, W.; Wang, H.; Shen, X.; Tsang, I.W. The Emerging Trends of Multi-label Learning. IEEE Trans. Pattern Anal. Mach. Intell. 2021, 44, 7955–7974. [Google Scholar] [CrossRef]
  36. Huang, X.; Li, Z.; Wang, C.; Ning, H. Identifying Disaster Related Social Media for Rapid Response: A Visual-Textual Fused CNN Architecture. Int. J. Digit. Earth 2020, 13, 1017–1039. [Google Scholar] [CrossRef]
  37. Magalhães, D.; Lima, R.H.; Pozo, A. Creating Deep Neural Networks for Text Classification Tasks Using Grammar Genetic Programming. Appl. Soft Comput. 2023, 135, 110009. [Google Scholar] [CrossRef]
  38. Du, J.; Vong, C.M.; Chen, C.P. Novel Efficient RNN and LSTM-Like Architectures: Recurrent and Gated Broad Learning Systems and Their Applications for Text Classification. IEEE Trans. Cybern. 2020, 51, 1586–1597. [Google Scholar] [CrossRef]
  39. Wu, M.; Long, R.; Chen, F.; Chen, H.; Bai, Y.; Cheng, K.; Huang, H. Spatio-Temporal Difference Analysis in Climate Change Topics and Sentiment Orientation: Based on LDA and BiLSTM Model. Resour. Conserv. Recycl. 2023, 188, 106697. [Google Scholar] [CrossRef]
  40. Huang, H.; Long, R.; Chen, H.; Sun, K.; Sun, Q.; Li, Q. Examining Public Attitudes and Perceptions of Waste Sorting in China Through an Urban Heterogeneity Lens: A Social Media Analysis. Resour. Conserv. Recycl. 2023, 199, 107233. [Google Scholar] [CrossRef]
  41. Fan, K.; Li, D.; Wu, H.; Wang, Y.; Yu, H.; Zeng, Z. Extracting and Evaluating Typical Characteristics of Rural Revitalization Using Web Text Mining. Int. J. Geogr. Inf. Sci. 2024, 38, 297–321. [Google Scholar] [CrossRef]
  42. Zhang, Y.; Yang, Q. A Survey on Multi-task Learning. IEEE Trans. Knowl. Data Eng. 2021, 34, 5586–5609. [Google Scholar] [CrossRef]
  43. Zhao, Z.; Zhang, Z.; Tang, P.; Wang, X.; Cui, L. MT-GN: Multi-task-Learning-Based Graph Residual Network for Tropical Cyclone Intensity Estimation. Remote Sens. 2024, 16, 215. [Google Scholar] [CrossRef]
  44. Myint, P.Y.W.; Lo, S.L.; Zhang, Y. Unveiling the Dynamics of Crisis Events: Sentiment and Emotion Analysis via Multi-Task Learning with Attention Mechanism and Subject-Based Intent Prediction. Inf. Process. Manag. 2024, 61, 103695. [Google Scholar] [CrossRef]
  45. Xie, J.; Zhou, K.; Chen, H.; Han, L.; Guan, L.; Wang, M.; Zheng, Y.; Chen, H.; Mao, J. Multi-Task Learning for Tornado Identification Using Doppler Radar Data. Geophys. Res. Lett. 2024, 51, e2024GL108809. [Google Scholar] [CrossRef]
  46. Shi, Y.; Shi, Y.; Yao, D.; Lu, M.; Liang, Y. Adaptive Transformer-Based Multi-Task Learning Framework for Synchronous Prediction of Substation Flooding and Outage Risks. Electr. Power Syst. Res. 2025, 242, 111450. [Google Scholar] [CrossRef]
  47. Hu, Y.; Mai, G.; Cundy, C.; Choi, K.; Lao, N.; Liu, W.; Lakhanpal, G.; Zhou, R.Z.; Joseph, K. Geo-Knowledge-Guided GPT Models Improve the Extraction of Location Descriptions from Disaster-Related Social Media Messages. Int. J. Geogr. Inf. Sci. 2023, 37, 2289–2318. [Google Scholar] [CrossRef]
  48. Zhang, T.; Cheng, C. Temporal and Spatial Evolution and Influencing Factors of Public Sentiment in Natural Disasters—A Case Study of Typhoon Haiyan. ISPRS Int. J. Geo-Inf. 2021, 10, 299. [Google Scholar] [CrossRef]
  49. Zhang, X.; Yang, X.; Li, S.; Ding, S.; Tan, C.; Wu, C.; Shen, Y.S.; Xu, L. Do Typhoon Disasters Foster Climate Change Concerns? Evidence from Public Discussions on Social Media in China. Int. J. Disaster Risk Reduct. 2024, 111, 104693. [Google Scholar] [CrossRef]
  50. Li, J.; He, Z.; Plaza, J.; Li, S.; Chen, J.; Wu, H.; Wang, Y.; Liu, Y. Social Media: New Perspectives to Improve Remote Sensing for Emergency Response. Proc. IEEE 2017, 105, 1900–1912. [Google Scholar] [CrossRef]
  51. Wieland, M.; Schmidt, S.; Resch, B.; Abecker, A.; Martinis, S. Fusion of Geospatial Information from Remote Sensing and Social Media to Prioritise Rapid Response Actions in Case of Floods. Nat. Hazard. 2025, 1–28. [Google Scholar] [CrossRef]
Figure 1. Framework for spatiotemporal typhoon damage assessment from social media texts via multi-task learning.
Ijgi 14 00189 g001
Figure 2. Structure of BERT with auxiliary classifiers.
Ijgi 14 00189 g002
Figure 3. Structure of toponym entity recognition model.
Ijgi 14 00189 g003
Figure 4. Structure of multi-label classification model.
Ijgi 14 00189 g004
Figure 5. Loss and accuracy curves for training the proposed method.
Ijgi 14 00189 g005
Figure 6. Spatial distribution of typhoon damage.
Ijgi 14 00189 g006
Figure 7. Temporal pattern of typhoon damage.
Ijgi 14 00189 g007
Table 1. Number of texts collected for selected typhoons.
TyphoonLandfall TimeTime ScopeNumber of Texts
In-fa25 July 202123–29 July 202111,020
Chaba2 July 202230 June–6 July 202213,391
Doksuri28 July 202326 July–1 August 20236968
Table 2. Typhoon damage classification scheme.
CategoryDescriptionExample
DamageImpact on natural environment and societal function 台风好强,树倒路塌,只能在家里避风。
(The typhoon is so strong that the trees fall down and the roads collapse, so we have to take shelter at home.)
TransportationSuspension of public transport, traffic jam 风大雨大,地铁停运了。
(It’s windy and rainy. The underground is out of service.)
PublicSuspension of work, production, or school, event postponed 台风快要来了,我们暑假补习班通知停课。
(The typhoon is coming soon, our tutorial classes are closed.)
ElectricityPower outage 小区两栋楼停电,台风天真倒霉。
(Two buildings in the neighbourhood are without power. It’s bad luck on a typhoon day.)
ForestryDestruction of forest or trees 台风过境,大片路树倒伏。
(A large number of roadside trees fall down as the typhoon passes through.)
WaterloggingFlooded ground 隧道积水,请过往司机绕路通行。
(The tunnel is waterlogged and passing drivers are advised to take a detour.)
Table 3. Examples of multi-label texts.
TextDTPEFW
最近要来台风,出门记得带雨伞,注意防范。
(A typhoon is coming lately, so remember to bring an umbrella when you go out and take precautions.)
000000
台风虽然让我提前结束工作,但回家路上树倒了好多,桥被封了,家里还停电。台风快结束吧!
(The typhoon ended my work early, but there were so many trees down on the way home, bridges were closed, and the power was out at home. Let the typhoon end soon!)
111110
公路积水,无法通行,路边的树一路倒,这台风来势真凶。
(The roads are waterlogged and impassable, trees are falling all the way along the roadside, this typhoon is really fierce.)
110011
好烦哦,为了预防台风已经停课了,但今天只停电没下雨。
(It’s so annoying that classes have been closed in case of a typhoon, but today it’s only power outages and no rain.)
101100
“D”, “T”, “P”, “E”, “F”, and “W” denote the categories of damage, transportation, public, electricity, forestry, and waterlogging. A mark of 1 indicates that the text is relevant to the category, while a mark of 0 does not.
Table 4. Model performance for location extraction and damage identification.
ComponentLocation ExtractionDamage Identification
ModelMulti-Task LearningAuxiliary ClassifiersToponym-Enhanced WeightsPrecisionRecallF1-ScorePrecisionRecallF1-Score
10.8750.8340.8540.8850.8720.876
20.8800.8430.8600.8890.8690.875
30.8850.8690.8760.9050.8840.893
40.8760.8840.8800.8910.8790.885
50.8980.8820.8910.9010.8950.898
The best results in each column are shown in bold italics.
Disclaimer/Publisher’s Note: The statements, opinions and data contained in all publications are solely those of the individual author(s) and contributor(s) and not of MDPI and/or the editor(s). MDPI and/or the editor(s) disclaim responsibility for any injury to people or property resulting from any ideas, methods, instructions or products referred to in the content.

