

Heterogeneity Analysis of Resident Demands and Public Service Facilities in Megacities of China from the Perspective of Urban Health Examination


Abstract
1. Introduction
2. Related Works
2.1. Monitoring Methods for Public Service Facility Coverage
2.2. Analyzing Methods for Supply and Demand of Public Service Facility
3. Materials and Methods
3.1. Study Area
3.2. Data Acquisition and Preprocessing
3.2.1. Road Network
3.2.2. City Boundary and Built-Up Area
3.2.3. Population
3.2.4. POI Data
3.3. Methods
3.3.1. Calculation of Coverage Level of Public Service Facilities
3.3.2. Calculation of Coverage Balance of Public Service Facilities
3.3.3. Calculation of Supply–Demand Matching Efficiency of Public Service Facilities
3.3.4. Coefficient of Variation (CV)
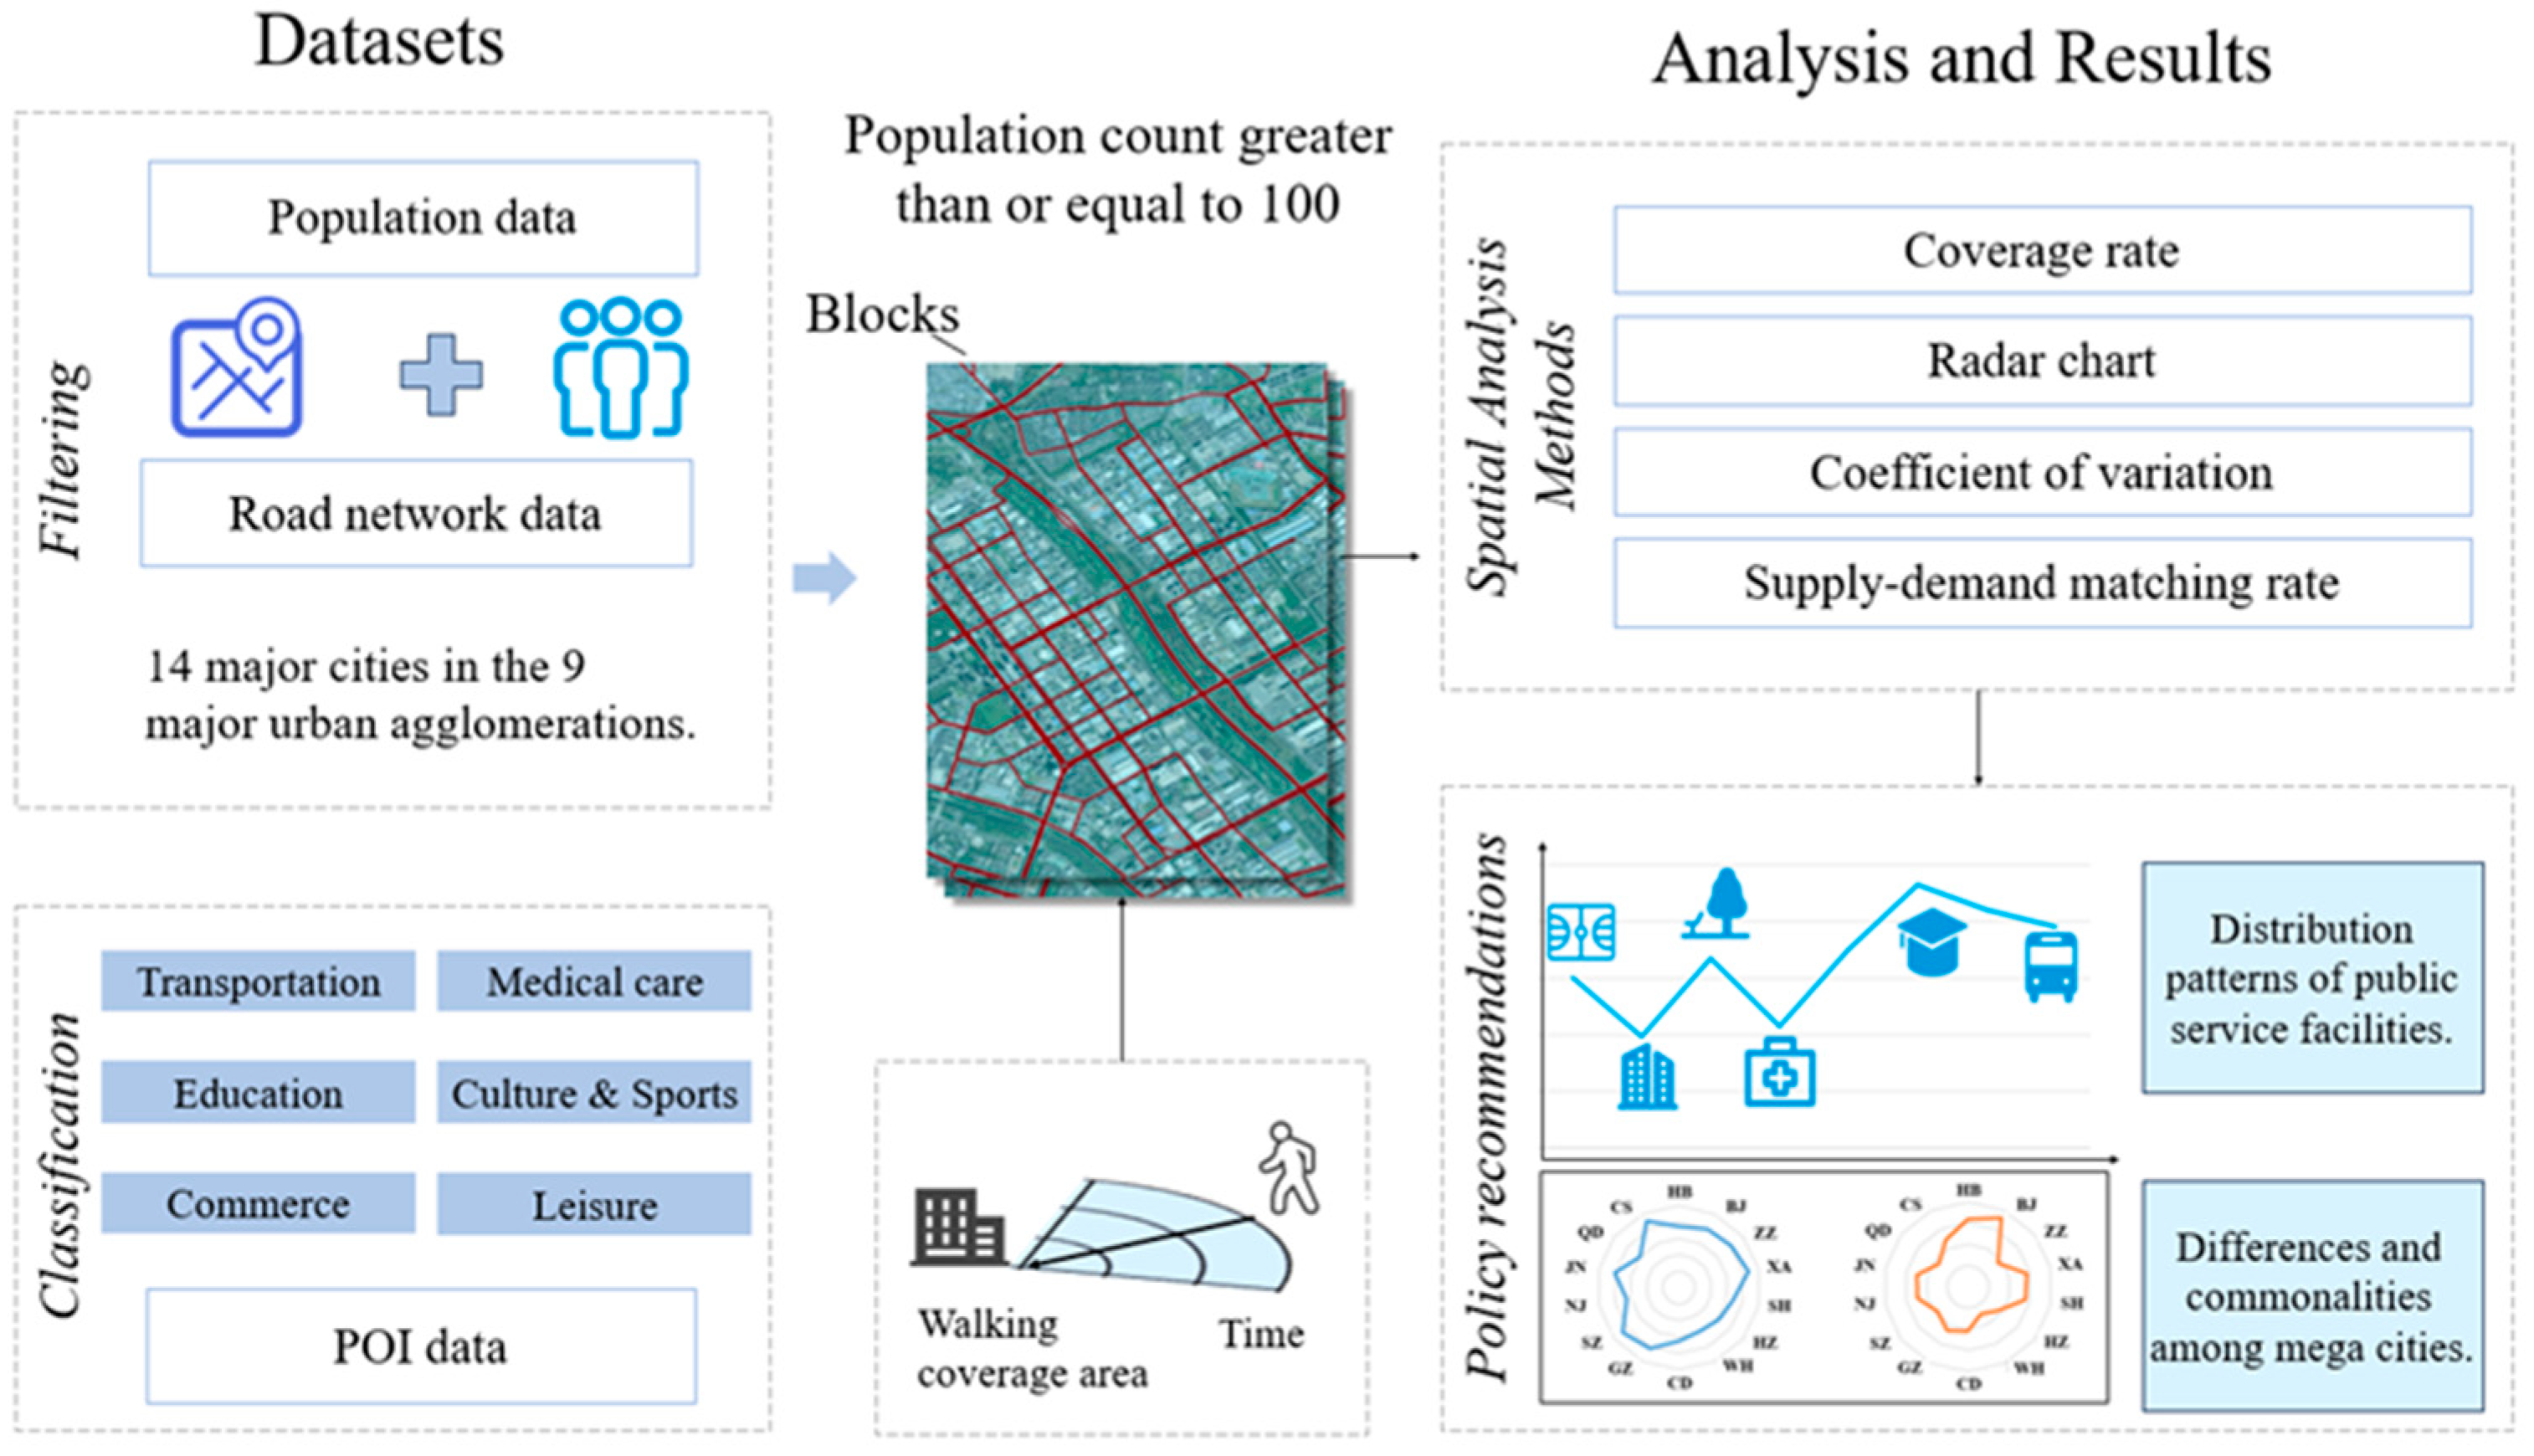
3.4. Research Framework
4. Results
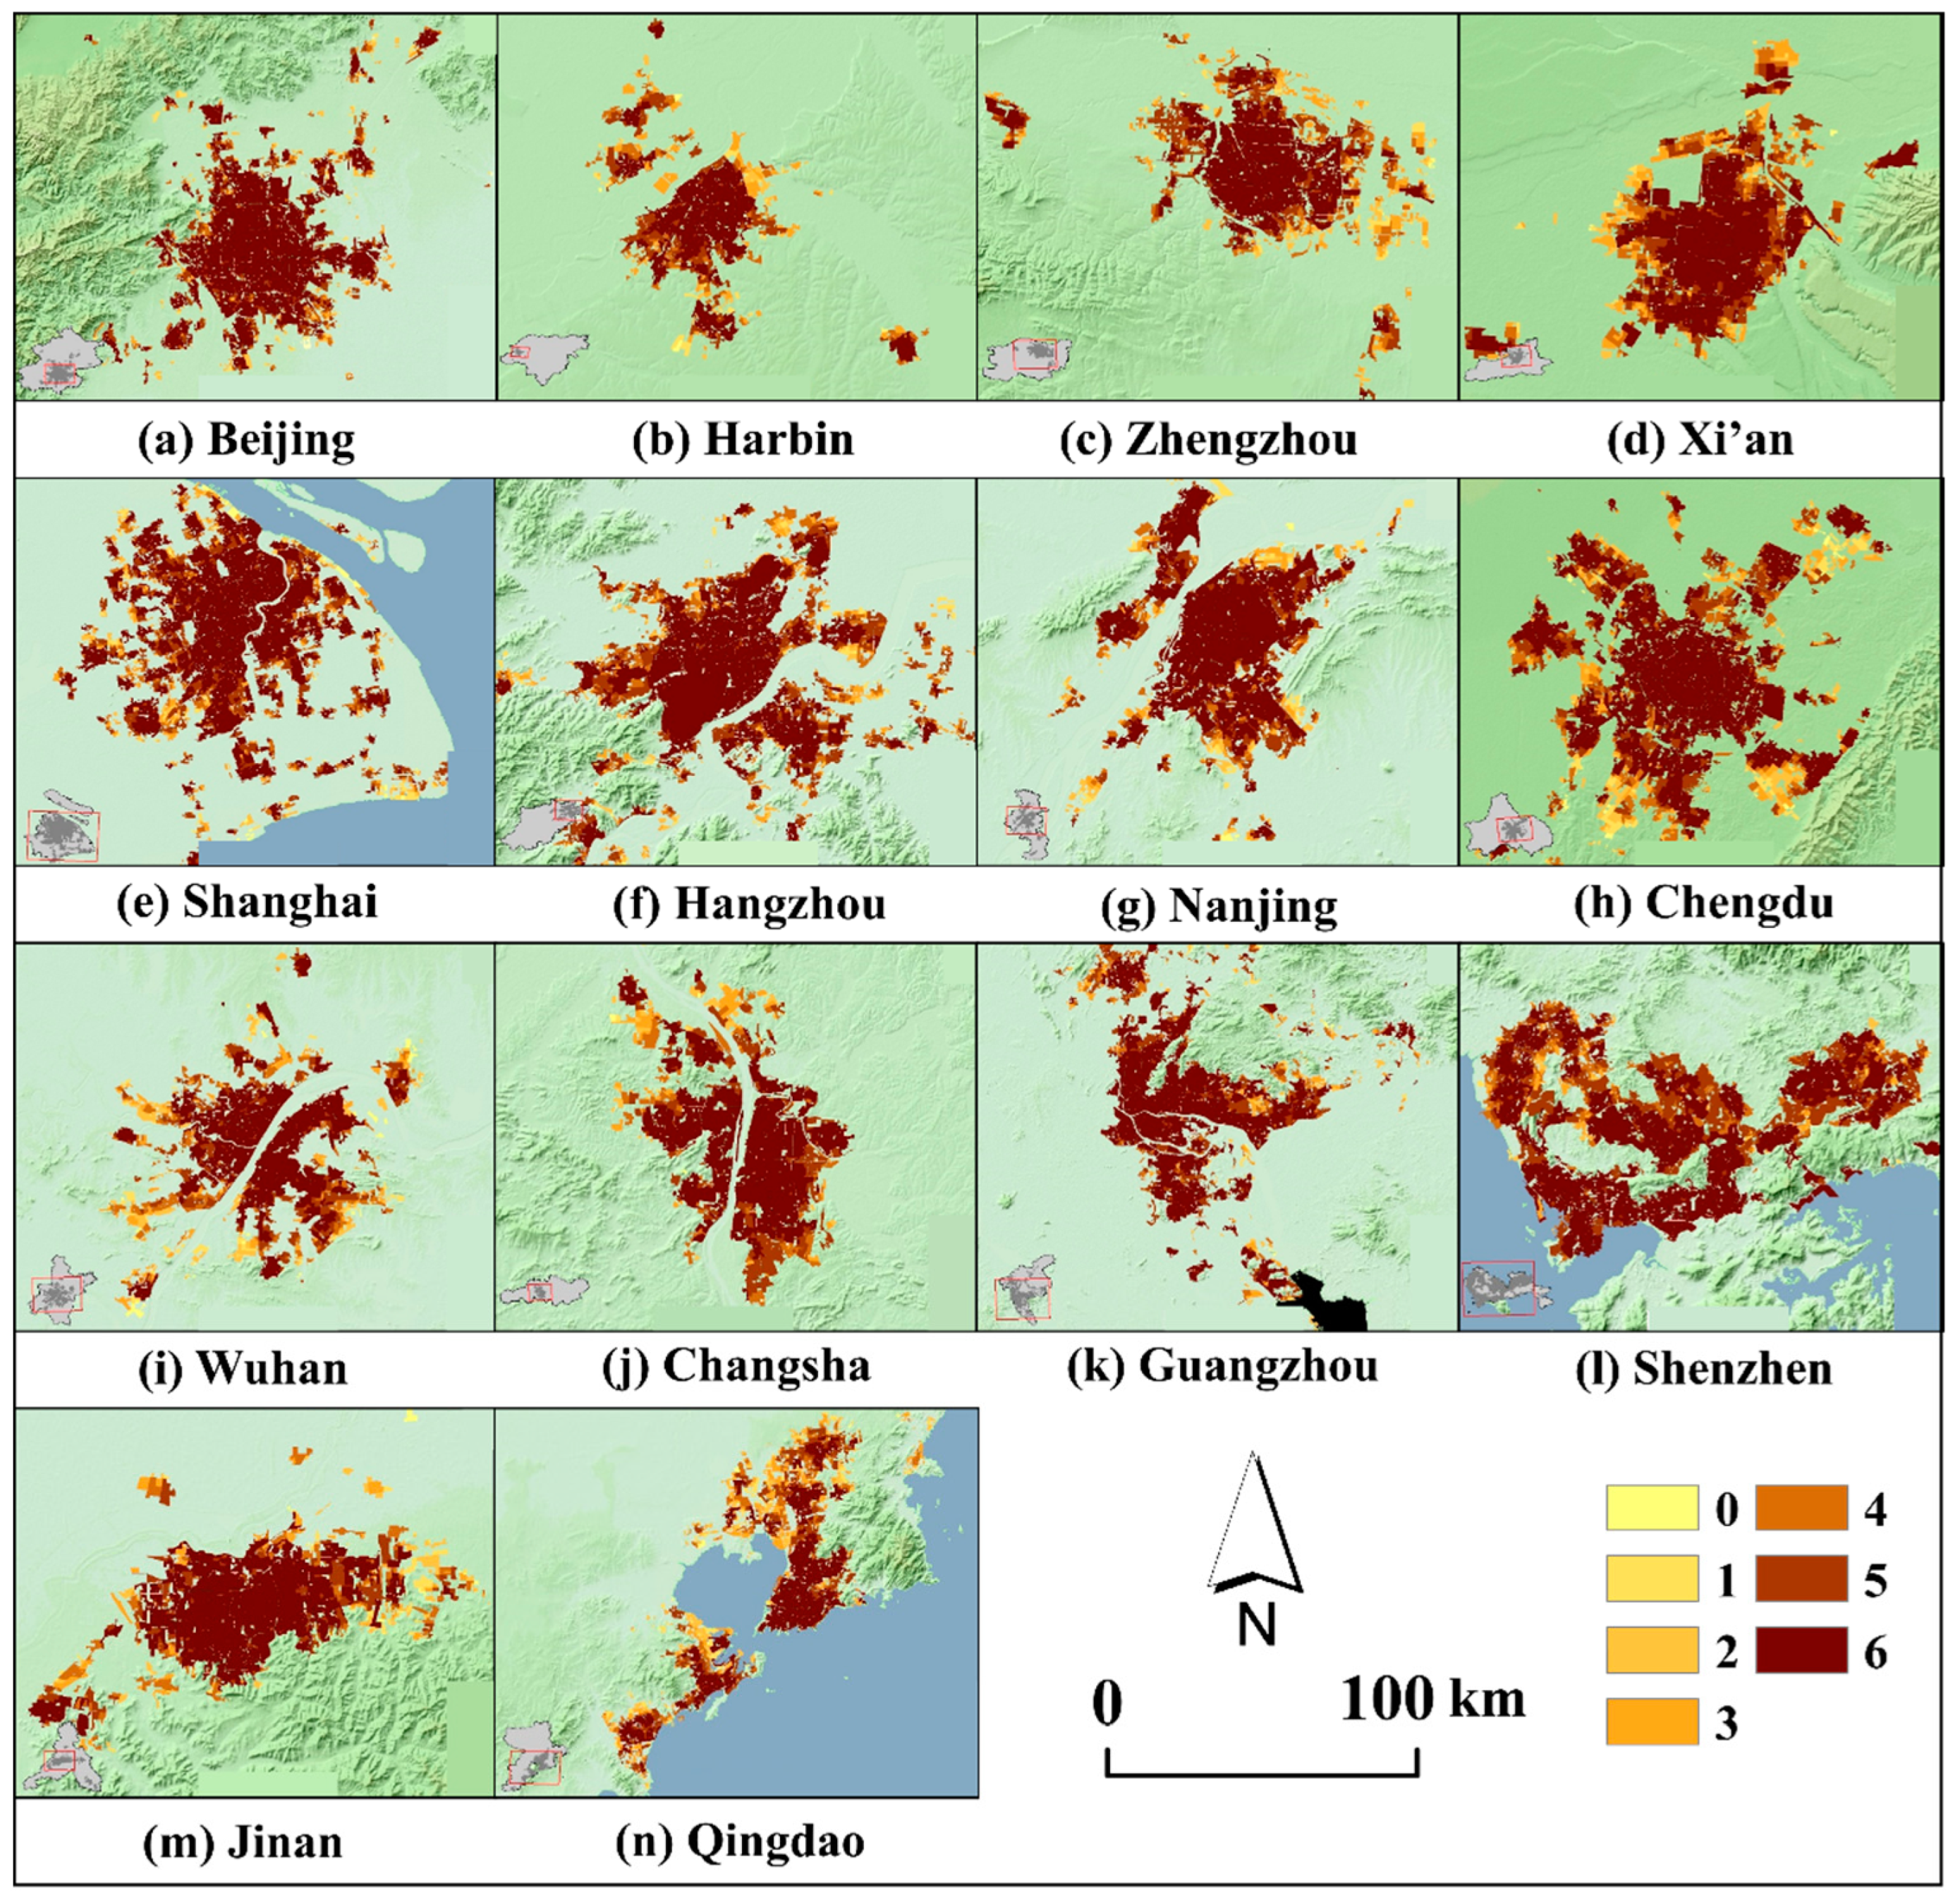
4.1. Spatial Distribution of Facility Coverage in Each Megacity
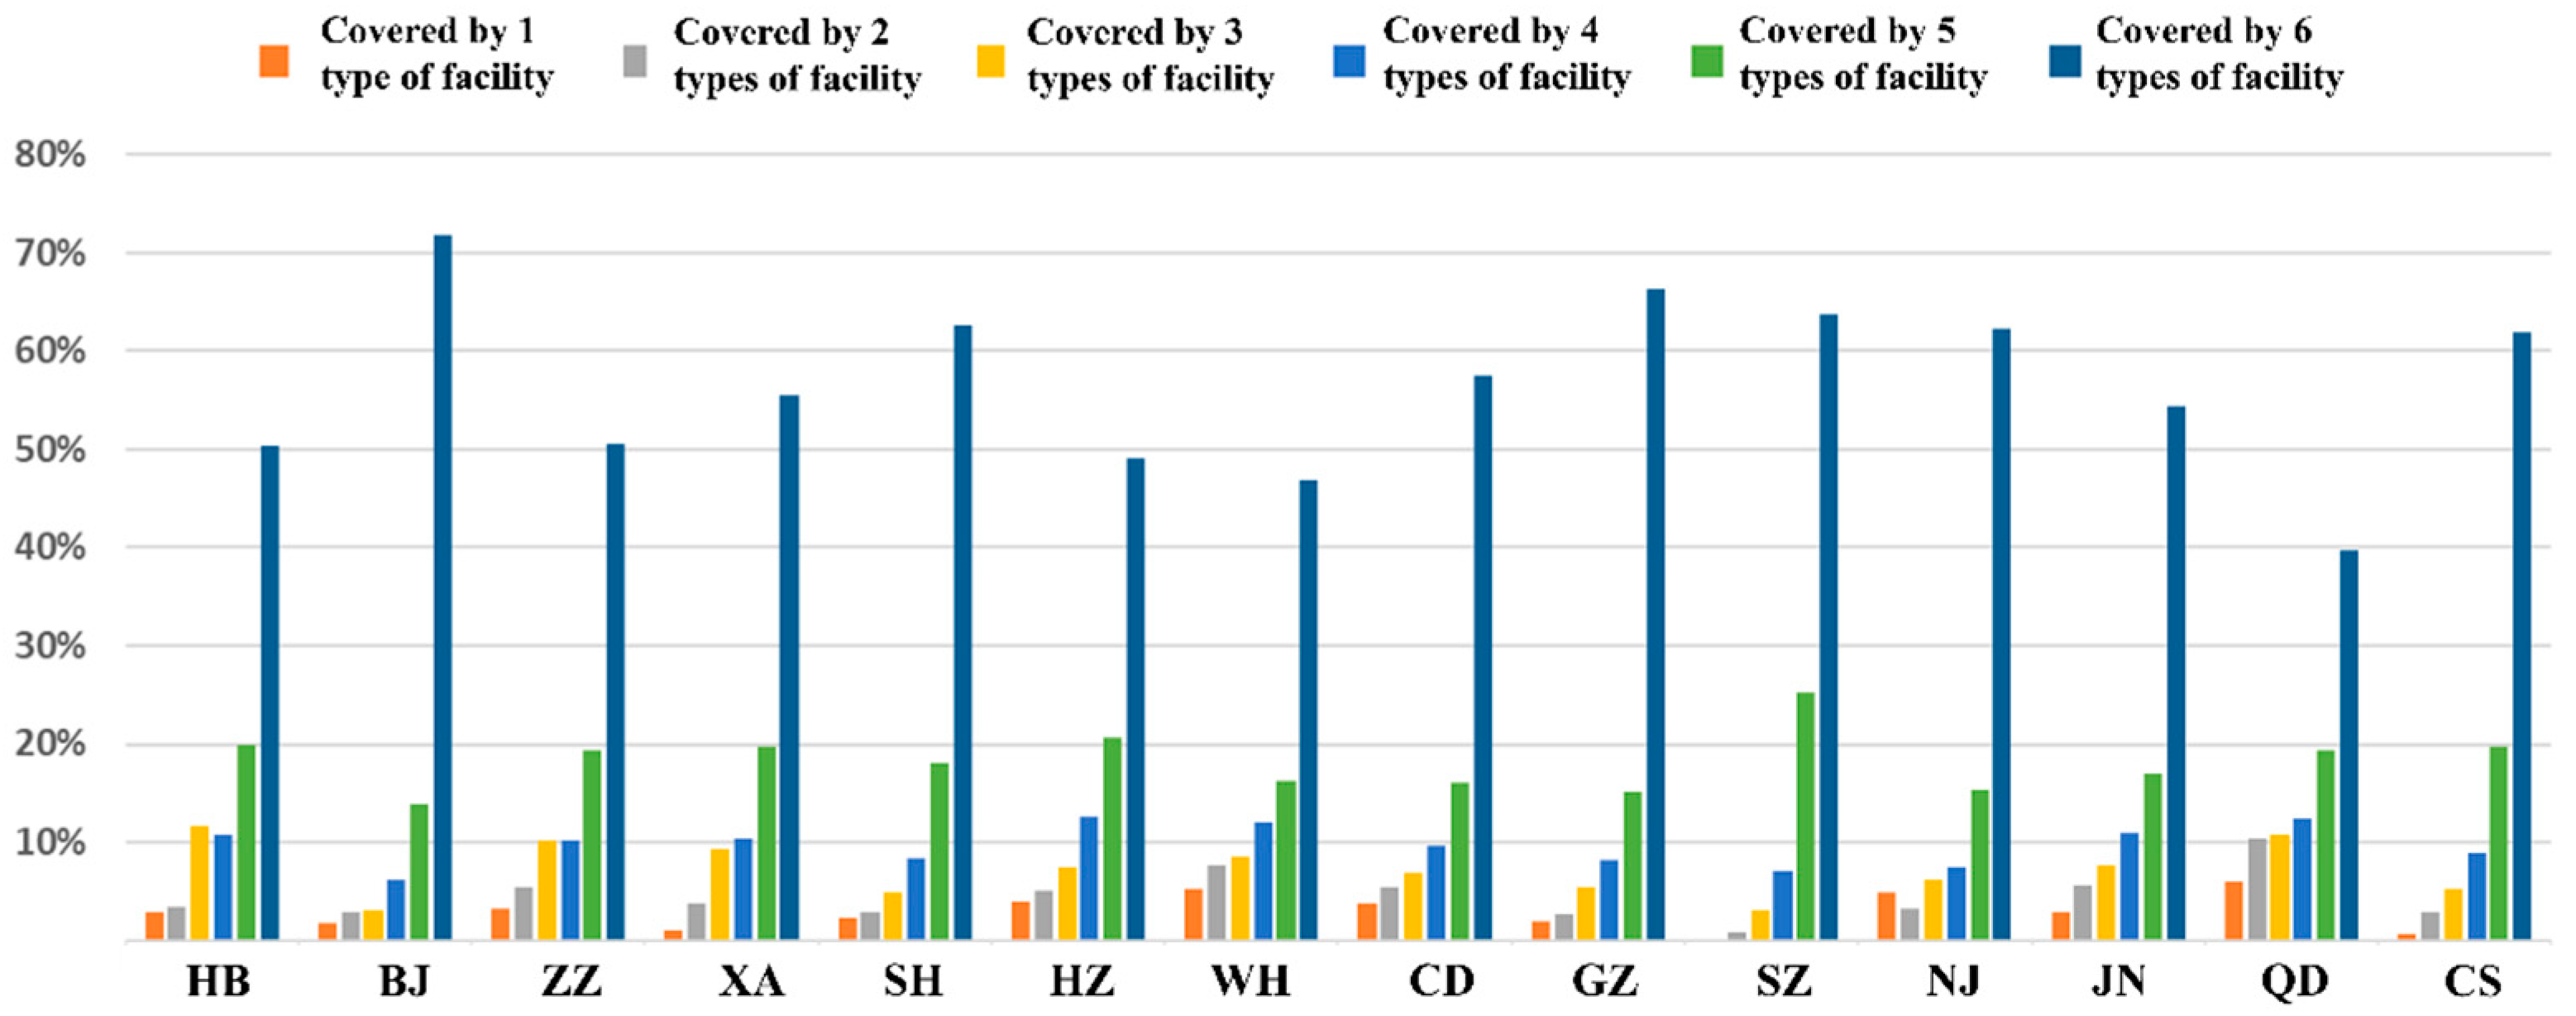
4.2. Facility Coverage Rate of Each Megacity
4.3. Supply–Demand Matching Efficiency Index of Public Service Facilities
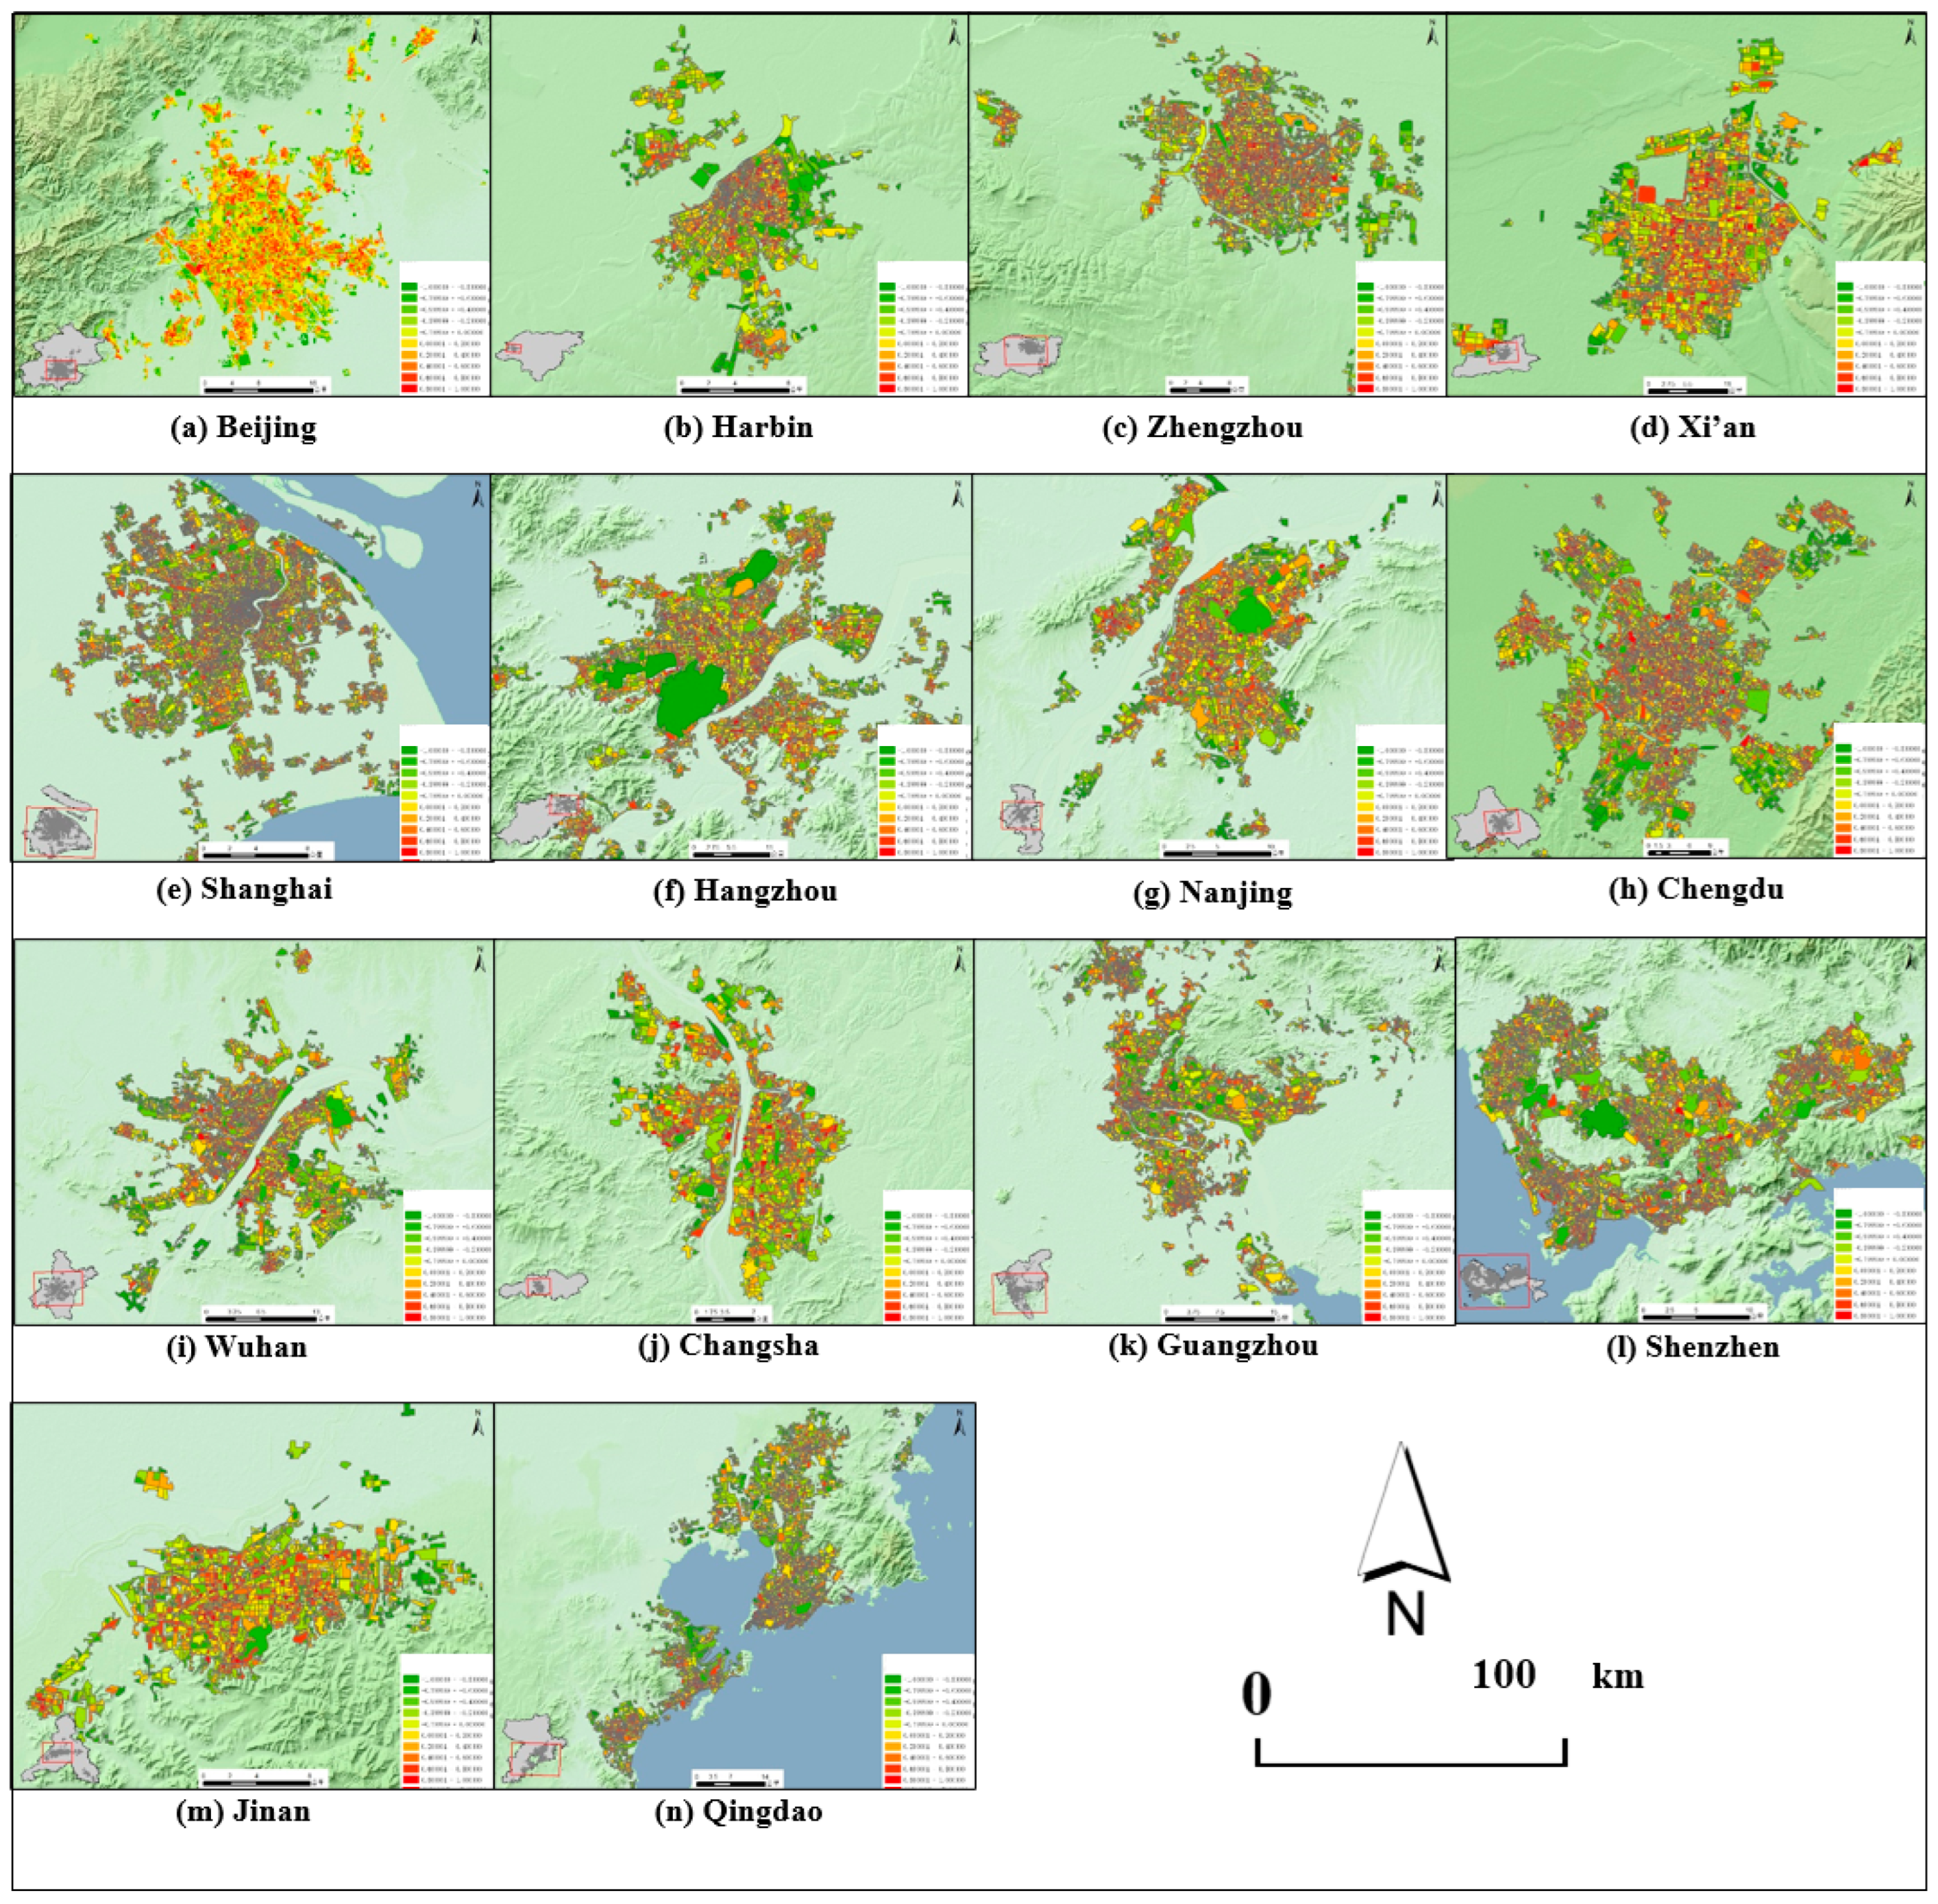
4.4. Spatial Heterogeneity and Stationarity of Supply–Demand Matching Efficiency of Public Service Facilities
5. Discussion
5.1. Coverage Level of Public Service Facilities
5.2. Supply–Demand Matching Patterns of Public Service Facilities
5.3. Policy Suggestions and Future Research
5.4. Innovations and Significance
6. Conclusions
- (1)
- The spatial distribution of facility coverage in mega-cities follows urban structure, with public service facilities concentrated in the core areas of built-up zones. As one moves from the core area to the peripheral area, the coverage range gradually decreases, with relatively fewer facilities covered in the peripheral areas.
- (2)
- The coverage rates of all six types of public service facilities in the 14 mega-cities are generally high, exceeding 50%. There are differences in coverage rates among different types of facilities, with transportation and education facilities having higher coverage rates, medical facilities having generally lower coverage rates, and leisure facilities having lower coverage rates in some cities.
- (3)
- Beijing, Shenzhen, and Guangzhou rank in the top three in terms of the comprehensive evaluation value of facility coverage. These cities have large coverage ranges of public service facilities and relatively balanced coverage of different types of facilities.
- (4)
- There is spatial heterogeneity in the degree of supply–demand matching of various types of public service facilities, with the supply–demand matching index of most mega-cities concentrated within a relatively tight range, indicating that these cities are generally similar in terms of supply–demand matching of public service facilities.
Author Contributions
Funding
Data Availability Statement
Conflicts of Interest
Abbreviations
| POI | Point of Interest |
| SDG | Sustainable Development Goals |
| DEM | Digital Elevation Model |
| NDBI | Normalized Difference Built-up Index |
| NDVI | Normalized Difference Vegetation Index |
| MNDWI | Modified Normalized Difference Water Index |
| SDI | Supply–Demand Matching Efficiency Index |
| SDE | Supply–Demand Matching Efficiency |
| CV | Coefficient of Variation |
References
- Yin, C.; He, Q.; Liu, Y.; Chen, W.; Gao, Y. Inequality of public health and its role in spatial accessibility to medical facilities in China. Appl. Geogr. 2018, 92, 50–62. [Google Scholar] [CrossRef]
- Bennett, J.; Iossa, E. Building and managing facilities for public services. J. Public Econ. 2006, 90, 2143–2160. [Google Scholar] [CrossRef]
- Cui, X.; Ma, L.; Tao, T.; Zhang, W. Do the supply of and demand for rural public service facilities match? Assessment based on the perspective of rural residents. Sustain. Cities Soc. 2022, 82, 103905. [Google Scholar] [CrossRef]
- Cohen, B. Urbanization in developing countries: Current trends, future projections, and key challenges for sustainability. Technol. Soc. 2006, 28, 63–80. [Google Scholar] [CrossRef]
- Michalos, A.C.; Zumbo, B.D. Public services and the quality of life. Soc. Indic. Res. 1999, 48, 125–157. [Google Scholar] [CrossRef]
- Chang, F.; Wang, L.; Ma, Y.; Yan, C.; Liu, H. Do urban public service facilities match population demand? Assessment based on community life circle. Prog. Geogr. 2021, 40, 607–619. [Google Scholar] [CrossRef]
- Shi, Y.; Yang, J.; Shen, P. Revealing the correlation between population density and the spatial distribution of urban public service facilities with mobile phone data. ISPRS Int. J. Geo-Inf. 2020, 9, 38. [Google Scholar] [CrossRef]
- Zhang, Y.; Wang, S.; Liang, H.; Li, X.; Wang, Z.; Lu, H. Dual Hybrid Frameworks Combining Graph Convolutional Network with Decoding for Covering Location Problem. iScience 2024, 27, 109803. [Google Scholar] [CrossRef]
- Wang, S.; Liang, H.; Zhong, Y.; Zhang, X.; Su, C. DeepMCLP: Solving the MCLP with deep reinforcement learning for urban facility location analytics. Spat. Data Sci. Symp. 2023, 10, E2KK5V. [Google Scholar] [CrossRef]
- Dadashpoor, H.; Rostami, F.; Alizadeh, B. Is inequality in the distribution of urban facilities inequitable? Exploring a method for identifying spatial inequity in an Iranian city. Cities 2016, 52, 159–172. [Google Scholar] [CrossRef]
- Liang, H.; Wang, S.; Li, H.; Zhou, L.; Chen, H.; Zhang, X.; Chen, X. Sponet: Solve spatial optimization problem using deep reinforcement learning for urban spatial decision analysis. Int. J. Digit. Earth 2024, 17, 2299211. [Google Scholar] [CrossRef]
- Xiong, X.; Yu, X.; Wang, Y. The impact of basic public services on residents’ consumption in China. Humanit. Soc. Sci. Commun. 2022, 9, 1–8. [Google Scholar] [CrossRef]
- Ai, J.; Sun, X.; Feng, L.; Li, Y.; Zhu, X. Analyzing the spatial patterns and drivers of ecosystem services in rapidly urbanizing Taihu Lake Basin of China. Front. Earth Sci. 2015, 9, 531–545. [Google Scholar] [CrossRef]
- Hou, X.; Wu, S.; Chen, D.; Cheng, M.; Yu, X.; Yan, D.; Dang, Y.; Peng, M. Can urban public services and ecosystem services achieve positive synergies? Ecol. Indic. 2021, 124, 107433. [Google Scholar] [CrossRef]
- Gong, X.; Lin, Y.; Bell, M.L.; Zhan, F. Associations between maternal residential proximity to air emissions from industrial facilities and low birth weight in Texas, USA. Environ. Int. 2018, 120, 181–198. [Google Scholar] [CrossRef]
- Chen, Z.; Chen, D.; Xie, X.; Cai, J.; Zhuang, Y.; Chang, N.; He, B.; Gao, B. Spatial self-aggregation effects and national division of city-level PM2.5 concentrations in China based on spatio-temporal clustering. J. Clean. Prod. 2019, 207, 875–881. [Google Scholar] [CrossRef]
- Wang, C.; Turner, V.K.; Wentz, E.A.; Zhao, Q.; Myint, S.W. Optimization of residential green space for environmental sustainability and property appreciation in metropolitan Phoenix, Arizona. Sci. Total Environ. 2021, 763, 144605. [Google Scholar] [CrossRef]
- O’Kelly, M.E.; Murray, A.T. A lattice covering model for evaluating existing service facilities. Pap. Reg. Sci. 2004, 83, 565–580. [Google Scholar] [CrossRef]
- Vahidnia, M.H.; Vahidi, H.; Hassanabad, M.G.; Shafiei, M. A spatial decision support system based on a hybrid AHP and TOPSIS method for fire station site selection. J. Geovisualization Spat. Anal. 2022, 6, 30. [Google Scholar] [CrossRef]
- Wang, S.; Wang, R.; Su, C.; Zhou, L.; Wang, W.; Liang, H. Optimization of shared bicycle location in Wuhan city based on multi-source geospatial big data. In Proceedings of the 2nd ACM SIGSPATIAL International Workshop on Spatial Big Data and AI for Industrial Applications 2023, Hamburg, Germany, 13 November 2023; pp. 43–46. [Google Scholar]
- Li, C.; Wang, J. A hierarchical two-step floating catchment area analysis for high-tier hospital accessibility in an urban agglomeration region. J. Transp. Geogr. 2022, 102, 103369. [Google Scholar] [CrossRef]
- Wang, W.; Zhou, Z.; Chen, J.; Cheng, W.; Chen, J. Analysis of location selection of public service facilities based on urban land accessibility. Int. J. Environ. Res. Public Health 2021, 18, 516. [Google Scholar] [CrossRef]
- Qiu, Z.; Wang, Y.; Bao, L.; Yun, B.; Lu, J. Sustainability of Chinese village development in a new perspective: Planning principle of rural public service facilities based on “Function-Space” synergistic mechanism. Sustainability 2022, 14, 8544. [Google Scholar] [CrossRef]
- Nicholls, S. Measuring the accessibility and equity of public parks: A case study using GIS. Manag. Leis. 2001, 6, 201–219. [Google Scholar] [CrossRef]
- Yao, J.; Zhang, X.; Murray, A.T. Location optimization of urban fire stations: Access and service coverage. Comput. Environ. Urban Syst. 2019, 73, 184–190. [Google Scholar] [CrossRef]
- Ardalan, A. A comparison of heuristic methods for service facility locations. Int. J. Oper. Prod. Manag. 1988, 8, 52–58. [Google Scholar] [CrossRef]
- Zhong, Y.; Wang, S.; Liang, H.; Wang, Z.; Zhang, X.; Chen, X.; Su, C. ReCovNet: Reinforcement learning with covering information for solving maximal coverage billboards location problem. Int. J. Appl. Earth Obs. Geoinf. 2024, 128, 103710. [Google Scholar] [CrossRef]
- Wei, Y.H.D. Restructuring for growth in urban China: Transitional institutions, urban development, and spatial transformation. Habitat Int. 2012, 36, 396–405. [Google Scholar] [CrossRef]
- Xu, R.; Yue, W.; Wei, F.; Yang, G.; Chen, Y.; Pan, K. Inequality of public facilities between urban and rural areas and its driving factors in ten cities of China. Sci. Rep. 2022, 12, 13244. [Google Scholar] [CrossRef]
- Ouyang, W.; Wang, B.; Tian, L.; Niu, X. Spatial deprivation of urban public services in migrant enclaves under the context of a rapidly urbanizing China: An evaluation based on suburban Shanghai. Cities 2017, 60, 436–445. [Google Scholar] [CrossRef]
- Li, Z.; Zheng, J.; Zhang, Y. Study on the layout of 15-minute community-life circle in third-tier cities based on POI: Baoding City of Hebei Province. Engineering 2019, 11, 592–603. [Google Scholar] [CrossRef]
- Aaberge, R.; Bhuller, M.; Langørgen, A.; Mogstad, M. The distributional impact of public services when needs differ. J. Public Econ. 2010, 94, 549–562. [Google Scholar] [CrossRef]
- Weng, M.; Ding, N.; Li, J.; Jin, X.; Xiao, H.; He, Z.; Su, S. The 15-minute walkable neighborhoods: Measurement, social inequalities and implications for building healthy communities in urban China. J. Transp. Health 2019, 13, 259–273. [Google Scholar] [CrossRef]
- Theerathitichaipa, K.; Wisutwattanasak, P.; Se, C.; Seefong, M.; Jomnonkwao, S.; Champahom, T.; Ratanavaraha, T.; Kasemsri, R. Assessment of disparity in accessing railway stations in Thailand: An application geographic information system network analysis. J. Geovisualization Spat. Anal. 2024, 8, 6. [Google Scholar] [CrossRef]
- Sun, W.; Fu, Y.; Zheng, S. Local public service provision and spatial inequality in Chinese cities: The role of residential income sorting and land-use conditions. J. Reg. Sci. 2017, 57, 547–567. [Google Scholar] [CrossRef]
- Ardeshiri, A.; Willis, K.; Ardeshiri, M. Exploring preference homogeneity and heterogeneity for proximity to urban public services. Cities 2018, 81, 190–202. [Google Scholar] [CrossRef]
- Shen, Y.; Tao, Y. Associations between spatial access to medical facilities and health-seeking behaviors: A mixed geographically weighted regression analysis in Shanghai, China. Appl. Geogr. 2022, 139, 102644. [Google Scholar] [CrossRef]
- Wan, G.; Wang, C.; Zhang, X.; Zuo, C. Income inequality effect of public utility infrastructure: Evidence from rural China. World Dev. 2024, 179, 106594. [Google Scholar] [CrossRef]
- Zhong, E. Deep mapping—A critical engagement of cartography with neuroscience. Geomat. Inf. Sci. Wuhan Univ. 2022, 47, 1988–2002. [Google Scholar] [CrossRef]
- Bengston, D.N.; Fletcher, J.O.; Nelson, K.C. Public policies for managing urban growth and protecting open space: Policy instruments and lessons learned in the United States. Landsc. Urban Plan. 2004, 69, 271–286. [Google Scholar] [CrossRef]
- Qiu, Z.; Wang, Y.; Wang, J.; Wang, Z.; Zhou, Y. Needs hierarchy for public service facilities and guidance-control programming in small Chinese towns influenced by complex urbanization of residents: The evidence from Zhejiang. Land 2023, 12, 1205. [Google Scholar] [CrossRef]
- Zhang, Y.; Li, Q.; Huang, H.; Wu, W.; Du, X.; Wang, H. The combined use of remote sensing and social sensing data in fine-grained urban land use mapping: A case study in Beijing, China. Remote Sens. 2017, 9, 865. [Google Scholar] [CrossRef]
- Chen, W.; Huang, H.; Dong, J.; Zhang, Y.; Tian, Y.; Yang, Z. Social functional mapping of urban green space using remote sensing and social sensing data. ISPRS J. Photogramm. Remote Sens. 2018, 146, 436–452. [Google Scholar] [CrossRef]
- Hu, T.; Yang, J.; Li, X.; Gao, P. Mapping urban land use by using Landsat images and open social data. Remote Sens. 2016, 8, 151. [Google Scholar] [CrossRef]
- Zhang, Q.; Yuan, F.; Jiao, S.; Liu, X.; Zhang, C. The application of radar chart in geoscience and its significance. Chin. Sci. Bull. 2017, 62, 79–89. [Google Scholar] [CrossRef]
- Chen, Y.; Chen, X.; Li, Z.; Lin, Y. Method of radar chart comprehensive evaluation with uniqueness feature. Trans. Beijing Inst. Technol. 2010, 30, 1409–1412. (In Chinese) [Google Scholar]
- Wu, P.; Zhu, X.; Wang, W. Study on matching efficiency of supply and demand of public service function facilities in Shanghai: Analysis based on the heterogeneity characteristics of residents. Urban Probl. 2023, 4, 87–95. [Google Scholar]
- Frias-Martinez, V.; Frias-Martinez, E. Spectral clustering for sensing urban land use using Twitter activity. Eng. Appl. Artif. Intell. 2014, 35, 237–245. [Google Scholar] [CrossRef]
- Abdi, H. Coefficient of variation. Encycl. Res. Des. 2010, 1, 169–171. [Google Scholar]
- Brown, C.E. Coefficient of variation. In Applied Multivariate Statistics in Geohydrology and Related Sciences; Springer: Berlin/Heidelberg, Germany, 1998; pp. 155–157. [Google Scholar]
- Xiao, F.; Du, H.; Zhang, X. Evaluation of spatial allocation of residential quarters and public service facilities based on the perspective of15 minutes life circle: A case study of Urumqi City. Arid Land Geogr. 2021, 44, 574–583. (In Chinese) [Google Scholar]
- Zhao, M.; Zhang, L.; Wang, D. Differential Distribution and Influencing Factors of Urban Public Service Facility Distribution from a Life Circle Perspective: A Comparative Analysis of Cities of Different Sizes in the Beijing-Tianjin-Hebei Region. Urban Stud. 2024, 31, 77–86. (In Chinese) [Google Scholar]
- Zhai, S.; Kong, Y.; Song, G.; Luo, J. A new facility location problem for urban public facility planning toward 15-minute life circle: Model and experiment. Acta Geogr. Sin. 2023, 78, 1484–1497. (In Chinese) [Google Scholar]
- Zhang, S.; Xu, S.; Wan, D.; Liu, H.; Zhao, L.; Guo, L.; Ren, J. Equalization Measurement and Optimization of the Public Cultural Facilities Distribution in Tianjin Central Area. Sustainability 2023, 15, 4856. [Google Scholar] [CrossRef]
- Mendoza-Gomez, R.; Rios-Mercado, R.Z. Maximal covering location with partial coverage for second-level specialized health care services. Comput. Oper. Res. 2024, 169, 106725. [Google Scholar] [CrossRef]
- Wei, W.; Hong, M.; Zhou, J.; Xia, J. Study on Evaluation Method of Spatial Equalization of Basic Public Service Facilities from the Perspective of Homo-Urbanicus: Taking Wuhan as an Example. City Plan. Rev. 2020, 44, 71–80. (In Chinese) [Google Scholar]
- Yan, Z.; Li, H.; Hu, X. Elderly-Oriented Evaluation and Layout Optimization of Public Service Facilities in the Urban Main Areas of Big Cities: A Case Study of Qinhuai District of Nanjing. Geogr. Geo-Inf. Sci. 2024, 40, 98–105. (In Chinese) [Google Scholar]
- Shen, M.; Yin, J.; Qiao, Y. Method Research on the Allocation Evaluation and Optimization of County-level Public Service Facilities based on Spatiotemporal Big Data. Urban Stud. 2024, 31, 86–96. (In Chinese) [Google Scholar]
- Che, B.; Du, Y.; Jian, X. Different Service Levels of Urban Bus Stops in Jiangsu Province. Areal Res. Dev. 2020, 39, 53–57. (In Chinese) [Google Scholar]
- Wei, W.; Ren, X.; Guo, S. Evaluation of Public Service Facilities in 19 Large Cities in China from the Perspective of Supply and Demand. Land 2022, 11, 149. [Google Scholar] [CrossRef]
- Sun, Y.; Luo, S. A Study on the Current Situation of Public Service Facilities’ Layout from the Perspective of 15-Minute Communities-Taking Chengdu of Sichuan Province as an Example. Land 2024, 13, 1110. [Google Scholar] [CrossRef]
- Wang, M.; Liang, Z.; Li, Z. Examining Spatial Disparities in Electric Vehicle Public Charging Infrastructure Distribution Using a Multidimensional Framework in Nanjing, China. ISPRS Int. J. Geo-Inf. 2024, 13, 296. [Google Scholar] [CrossRef]


| Regions | Urban Agglomerations | Selected Megacities as Study Area |
|---|---|---|
| Northeast China | Harbin–Changchun Urban Agglomeration | Harbin |
| North China | Beijing–Tianjin–Hebei Urban Agglomeration | Beijing |
| Central Plains Urban Agglomeration | Zhengzhou | |
| Guanzhong Plain Urban Agglomeration | Xi’an | |
| Shandong Peninsula Urban Agglomeration | Jinan–Qingdao | |
| East China | Yangtze River Delta Urban Agglomeration | Shanghai–Hangzhou–Nanjing |
| Central China | Urban Agglomeration of Middle Reaches of Yangtze River | Wuhan–Changsha |
| South China | Guangdong–Hong Kong–Macao Greater Bay Area | Guangzhou–Shenzhen |
| Southwest China | Chengdu–Chongqing Urban Agglomeration | Chengdu |
| Types | Subtypes | Code | Maximum Traffic Time of Life Circle |
|---|---|---|---|
| Education | Kindergartens | 160101 | 5 min |
| Primary schools | 160102 | 10 min | |
| Secondary schools | 160103 | 15 min | |
| Medical care | General hospitals | 170101 | 15 min |
| Specialized hospitals | 170102 | 15 min | |
| Nursing home and orphanage | 170201 | 15 min | |
| Transportation | Metro stations | 230111 | 15 min |
| Bus stations | 230112 | 10 min | |
| Commerce | Shopping malls | 130102 | 15 min |
| Supermarkets | 130106 | 10 min | |
| Culture and sports | Cultural activity center | 160208 | 15 min |
| Multifunctional sports courts | 180100 | 15 min | |
| Leisure | Parks | 180304 | 15 min |
| Squares | 180306 | 15 min |
| Megacities | |||
|---|---|---|---|
| Harbin | 4.9368 | 1.7285 | 0.8911 |
| Beijing | 5.4314 | 2.1181 | 0.9843 |
| Zhengzhou | 4.9319 | 1.6930 | 0.8852 |
| Xi’an | 5.1391 | 1.8707 | 0.9273 |
| Shanghai | 5.2453 | 1.9625 | 0.9485 |
| Hangzhou | 4.9024 | 1.6864 | 0.8818 |
| Wuhan | 4.6402 | 1.5042 | 0.8335 |
| Chengdu | 5.0298 | 1.7946 | 0.9079 |
| Guangzhou | 5.3392 | 2.0196 | 0.9634 |
| Shenzhen | 5.5459 | 2.1549 | 0.9967 |
| Nanjing | 5.1261 | 1.8706 | 0.9264 |
| Jinan | 4.9658 | 1.7414 | 0.8952 |
| Qingdao | 4.5347 | 1.4179 | 0.8111 |
| Changsha | 5.3248 | 1.9988 | 0.9594 |
| SDI | CV for SDI of All Types of Facility | ||||||
|---|---|---|---|---|---|---|---|
| Education | Medical Care | Transportation | Commerce | Culture and Sports | Leisure | ||
| Harbin | 0.5673 | 0.5511 | 0.5716 | 0.5674 | 0.5613 | 0.5511 | 0.5789 |
| Beijing | 0.6104 | 0.5992 | 0.5949 | 0.6032 | 0.5953 | 0.5868 | 0.5689 |
| Zhengzhou | 0.6207 | 0.5652 | 0.6039 | 0.6087 | 0.5990 | 0.5990 | 0.5649 |
| Xi’an | 0.6345 | 0.5802 | 0.6151 | 0.6294 | 0.5880 | 0.5729 | 0.5680 |
| Shanghai | 0.6090 | 0.5680 | 0.5874 | 0.5979 | 0.5934 | 0.5737 | 0.5685 |
| Hangzhou | 0.5896 | 0.5191 | 0.5766 | 0.5889 | 0.5841 | 0.5280 | 0.5785 |
| Wuhan | 0.5956 | 0.5433 | 0.5794 | 0.5923 | 0.5642 | 0.5400 | 0.5596 |
| Chengdu | 0.6219 | 0.5666 | 0.6013 | 0.6122 | 0.6082 | 0.5882 | 0.5676 |
| Guangzhou | 0.5410 | 0.4865 | 0.5365 | 0.5363 | 0.5294 | 0.5126 | 0.5514 |
| Shenzhen | 0.5914 | 0.5139 | 0.5766 | 0.5813 | 0.5833 | 0.5803 | 0.5764 |
| Nanjing | 0.6084 | 0.5703 | 0.5928 | 0.6123 | 0.6063 | 0.5909 | 0.5543 |
| Jinan | 0.6106 | 0.5626 | 0.5774 | 0.5918 | 0.5703 | 0.5597 | 0.5677 |
| Qingdao | 0.6040 | 0.5609 | 0.5704 | 0.5852 | 0.5448 | 0.5144 | 0.5567 |
| Changsha | 0.5889 | 0.5333 | 0.5722 | 0.5814 | 0.5732 | 0.5718 | 0.5665 |
Disclaimer/Publisher’s Note: The statements, opinions and data contained in all publications are solely those of the individual author(s) and contributor(s) and not of MDPI and/or the editor(s). MDPI and/or the editor(s) disclaim responsibility for any injury to people or property resulting from any ideas, methods, instructions or products referred to in the content. |
© 2025 by the authors. Published by MDPI on behalf of the International Society for Photogrammetry and Remote Sensing. Licensee MDPI, Basel, Switzerland. This article is an open access article distributed under the terms and conditions of the Creative Commons Attribution (CC BY) license (https://creativecommons.org/licenses/by/4.0/).
Share and Cite
Zhang, N.; Wang, S.; Liang, H.; Huang, Z.; Li, X.; Wang, Z. Heterogeneity Analysis of Resident Demands and Public Service Facilities in Megacities of China from the Perspective of Urban Health Examination. ISPRS Int. J. Geo-Inf. 2025, 14, 188. https://doi.org/10.3390/ijgi14050188
Zhang N, Wang S, Liang H, Huang Z, Li X, Wang Z. Heterogeneity Analysis of Resident Demands and Public Service Facilities in Megacities of China from the Perspective of Urban Health Examination. ISPRS International Journal of Geo-Information. 2025; 14(5):188. https://doi.org/10.3390/ijgi14050188
Chicago/Turabian StyleZhang, Ning, Shaohua Wang, Haojian Liang, Zhuonan Huang, Xiao Li, and Zhenbo Wang. 2025. "Heterogeneity Analysis of Resident Demands and Public Service Facilities in Megacities of China from the Perspective of Urban Health Examination" ISPRS International Journal of Geo-Information 14, no. 5: 188. https://doi.org/10.3390/ijgi14050188
APA StyleZhang, N., Wang, S., Liang, H., Huang, Z., Li, X., & Wang, Z. (2025). Heterogeneity Analysis of Resident Demands and Public Service Facilities in Megacities of China from the Perspective of Urban Health Examination. ISPRS International Journal of Geo-Information, 14(5), 188. https://doi.org/10.3390/ijgi14050188