Article

Geospatial Approach to Assess Flash Flood Vulnerability in a Coastal District of Bangladesh: Integrating the Multifaceted Dimension of Vulnerabilities

1
Department of Urban and Regional Planning, Chittagong University of Engineering and Technology, Chattogram 4349, Bangladesh
2
Department of Geomatics Engineering, University of Calgary, Calgary, AB T2N 1N4, Canada
*
Author to whom correspondence should be addressed.
ISPRS Int. J. Geo-Inf. 2025, 14(5), 194; https://doi.org/10.3390/ijgi14050194
Submission received: 26 January 2025 / Revised: 24 April 2025 / Accepted: 3 May 2025 / Published: 6 May 2025

Abstract

:
Flash floods pose a significant threat to Bangladesh; in particular, on 20 August 2024, the Feni district experienced a major flash flood, affecting more than 550,000 people and causing widespread damage. To effectively mitigate the impacts of flash floods, it is essential to conduct a comprehensive flash flood vulnerability assessment, incorporating multiple triggering factors. This study aims to assess flash flood vulnerability in the Feni District through a unique approach, integrating various dimensions of vulnerability. The study utilizes a geospatial methodology, employing the formula of vulnerability developed by UNESCO-IHE. Four dimensions of vulnerability were analyzed: social, physical, economic, and environmental. For each dimension, specific variables were selected to assess exposure, susceptibility, and resilience. Principal Component Analysis (PCA) was used to assign weights to these variables. The geospatial layers of influencing vulnerability factors were integrated together to create flash flood vulnerability maps of four dimensions. These were then overlaid to generate a composite flash flood vulnerability map. The analysis revealed a distinct spatial distribution of vulnerability across Feni District. In terms of environmental vulnerability due to flash flood, about 14% of the total area falls into the very highly vulnerable zone, whereas 13%, 8% and 5% of the study area were found to be very highly vulnerable regarding social, economic and physical aspects, respectively. The composite flash flood vulnerability map identified key vulnerability hotspots, with the most vulnerable unions (the smallest administrative unit in Bangladesh) being Feni Pourashava (68% very high), Sonagazi Paurashava (40% very high), and Nawabpur (32% very high), while the least vulnerable areas were Jailashkara (58% very low), Anandapur (81% very low), and Darbarpur (82% very low). The results show that the Feni District’s flash flood susceptibility varies significantly throughout the region, which provide crucial insights for policymakers and local authorities in order to identify vulnerability hotspots, prioritize interventions in vulnerable areas, enhance flash flood resilience, and implement adaptive strategies.

1. Introduction

Flash floods are one of the most devastating natural hazards affecting Bangladesh, a country known for its high susceptibility to climate-induced disasters due to its low-lying topography and high population density [1]. Flash floods present a special challenge among the various forms of flooding, because of their sudden onset, rapid advancement, and short response time [2]. In contrast to riverine or coastal floods, flash floods are usually caused by intense, short-duration rainfall events, which are frequently made worse by upstream rainfall from nearby areas [3]. Because of their suddenness, these events are especially damaging, with an immense impact on lives, livelihoods, infrastructure, and environmental resources [3].
The Feni district, located in the southeastern part of Bangladesh, is especially vulnerable to flash floods due to its geographical and geomorphological characteristics and the presence of transboundary rivers [4,5]. On 20 August 2024, a major flash flood hit the Feni district, affecting over 550,000 people and causing widespread destruction [5,6]. The severity of this event underscored the urgent need for an effective and comprehensive assessment of flash flood vulnerability in this region. Due to the increased frequency and extent of these events, reactive disaster management is no longer sufficient; rather, proactive measures in terms of vulnerability assessment and mitigation need to be undertaken [7,8]. By locating the spatial patterns of vulnerability in various dimensions, policymakers, planners, and local authorities can act in more efficient ways to create a resilient system for people at risk due to future flash floods, minimizing loss of life, and safeguarding livelihoods [9,10].
The degree to which a community, system, or asset is exposed to, prone to, and able to recover from the negative effects of a hazard is reflected in its vulnerability [11]. Flash flood vulnerability is a multi-dimensional phenomenon shaped by the interaction of social, physical, economic, and environmental factors [12]. For example, households living in low-lying flood-prone areas with weak infrastructure systems are at greater risk than those living in elevated and structurally sound areas [13]. At the same time, economically marginal groups, living under the pressures of resource inadequacies, poor health facilities, and limited access to early warning, experience high levels of vulnerability [14]. Therefore, a comprehensive assessment of flash flood vulnerability is needed, considering these diverse dimensions, in order to provide a holistic understanding of the problem [11,13].
This study aims to evaluate flash flood vulnerability in the Feni district by using a geospatial approach that incorporates four dimensions of vulnerability: social, physical, economic, and environmental. The methodological framework for this study has been drawn from the formula on vulnerability developed by UNESCO-IHE [15]. This study seeks to develop a framework for detailed spatial mapping of flash flood vulnerability considering these different dimensions, as well as a composite vulnerability map, integrating spatial analysis with statistical techniques. This will allow for the visualization of the spatial distribution of vulnerable areas, which can be crucial for disaster preparedness and response planning [16,17].
The methodology employed in this study involves the integration of multiple influencing factors considered as variables for the vulnerability assessment. For each of the four dimensions of vulnerability, specific variables were selected to assess three core indicators: exposure, susceptibility, and resilience. By incorporating these indicators, this study expects to identify which areas of the Feni district are most vulnerable to flash floods.
This study significant because it advances the traditional methods of vulnerability assessment in many ways. Its unique contribution lies in the dynamic integration of geospatial technology, the development of multi-dimensional vulnerability maps, and the clear focus on flash flood-specific vulnerability [18]. A comprehensive, multi-dimensional approach is used to evaluate social, physical, economic, and environmental vulnerabilities in both a singular and an integrated way, in contrast to earlier research that frequently treats vulnerability dimensions in isolation [1,3,19]. Moreover, the study introduces a novel methodological framework for producing composite vulnerability maps, which not only visualizes the spatial distribution of overall composite vulnerability but also identifies areas at compounded risk of flash flood, where multiple dimensions of vulnerability intersect. This intersectional approach enables a more precise identification of highly-vulnerable zones, which is crucial for targeted disaster mitigation and response [19].
Additionally, while the use of Principal Component Analysis (PCA) is a well-documented method, the study’s application of PCA goes beyond mere dimensionality reduction by integrating it with geospatial analysis, thereby providing a data-driven approach to weight assignment. This makes it possible to more accurately determine the relative importance of each variable by reducing the dimensionality of the data while keeping the most important information [20]. This data-driven approach ensures that the final vulnerability maps accurately reflect ground realities. By employing PCA, the study reduces the bias that is frequently connected to manual weight assignment, which raises the analysis’s credibility [20,21]. Once the weights were determined, the geospatial layers corresponding to each vulnerability dimension were integrated to produce individual flash flood vulnerability maps for the four dimensions. These maps offer insights into how each dimension contributes to overall flash flood vulnerability. For example, areas with high social vulnerability may coincide with regions experiencing high physical vulnerability, indicating a compounded risk. The final stage of the analysis involved overlaying the four-dimensional maps to create a composite flash flood vulnerability map, offering a comprehensive view of overall vulnerability. This integrated approach provides a more complete understanding of the spatial distribution of flash flood vulnerability and highlights priority areas for intervention [22]. This methodological fusion enhances the objectivity and accuracy of vulnerability mapping, making it a replicable approach for other disaster-prone regions. Collectively, these methods establish the study’s novelty and underscore its contribution to the field of disaster risk management, particularly for regions facing flash flood hazards.
The expected outcomes of this study are to reveal distinct spatial patterns of flash flood vulnerability. Certain areas are consistently identified as high-risk zones across multiple dimensions, reflecting the need for targeted interventions in these locations. By identifying the regions with the highest composite vulnerability, disaster management authorities can prioritize resource allocation, enhance early warning systems, and develop community-based risk reduction strategies.
The findings of the research provide important new information on the underlying dynamics and geographic variability of flash flood vulnerability in the Feni District. The study offers a sophisticated analysis of how many vulnerability indicators interact and appear across the landscape by using a multifaceted and spatially explicit approach. This information is essential for determining priority intervention areas and guiding the creation of risk mitigation plans tailored to the particular scenario. Additionally, the composite vulnerability map produced by this research is a useful resource for disaster management organizations, urban planners, and local government decision-makers. The design of adaptable infrastructure and community-based resilience initiatives may be supported by these outputs, which can also improve early warning systems and direct resource allocation. In the end, our study adds to the increasing amount of data required in order to move from reactive flood risk management to proactive flood risk governance in areas, like Feni, that are vulnerable to flash floods.

2. Materials and Methods
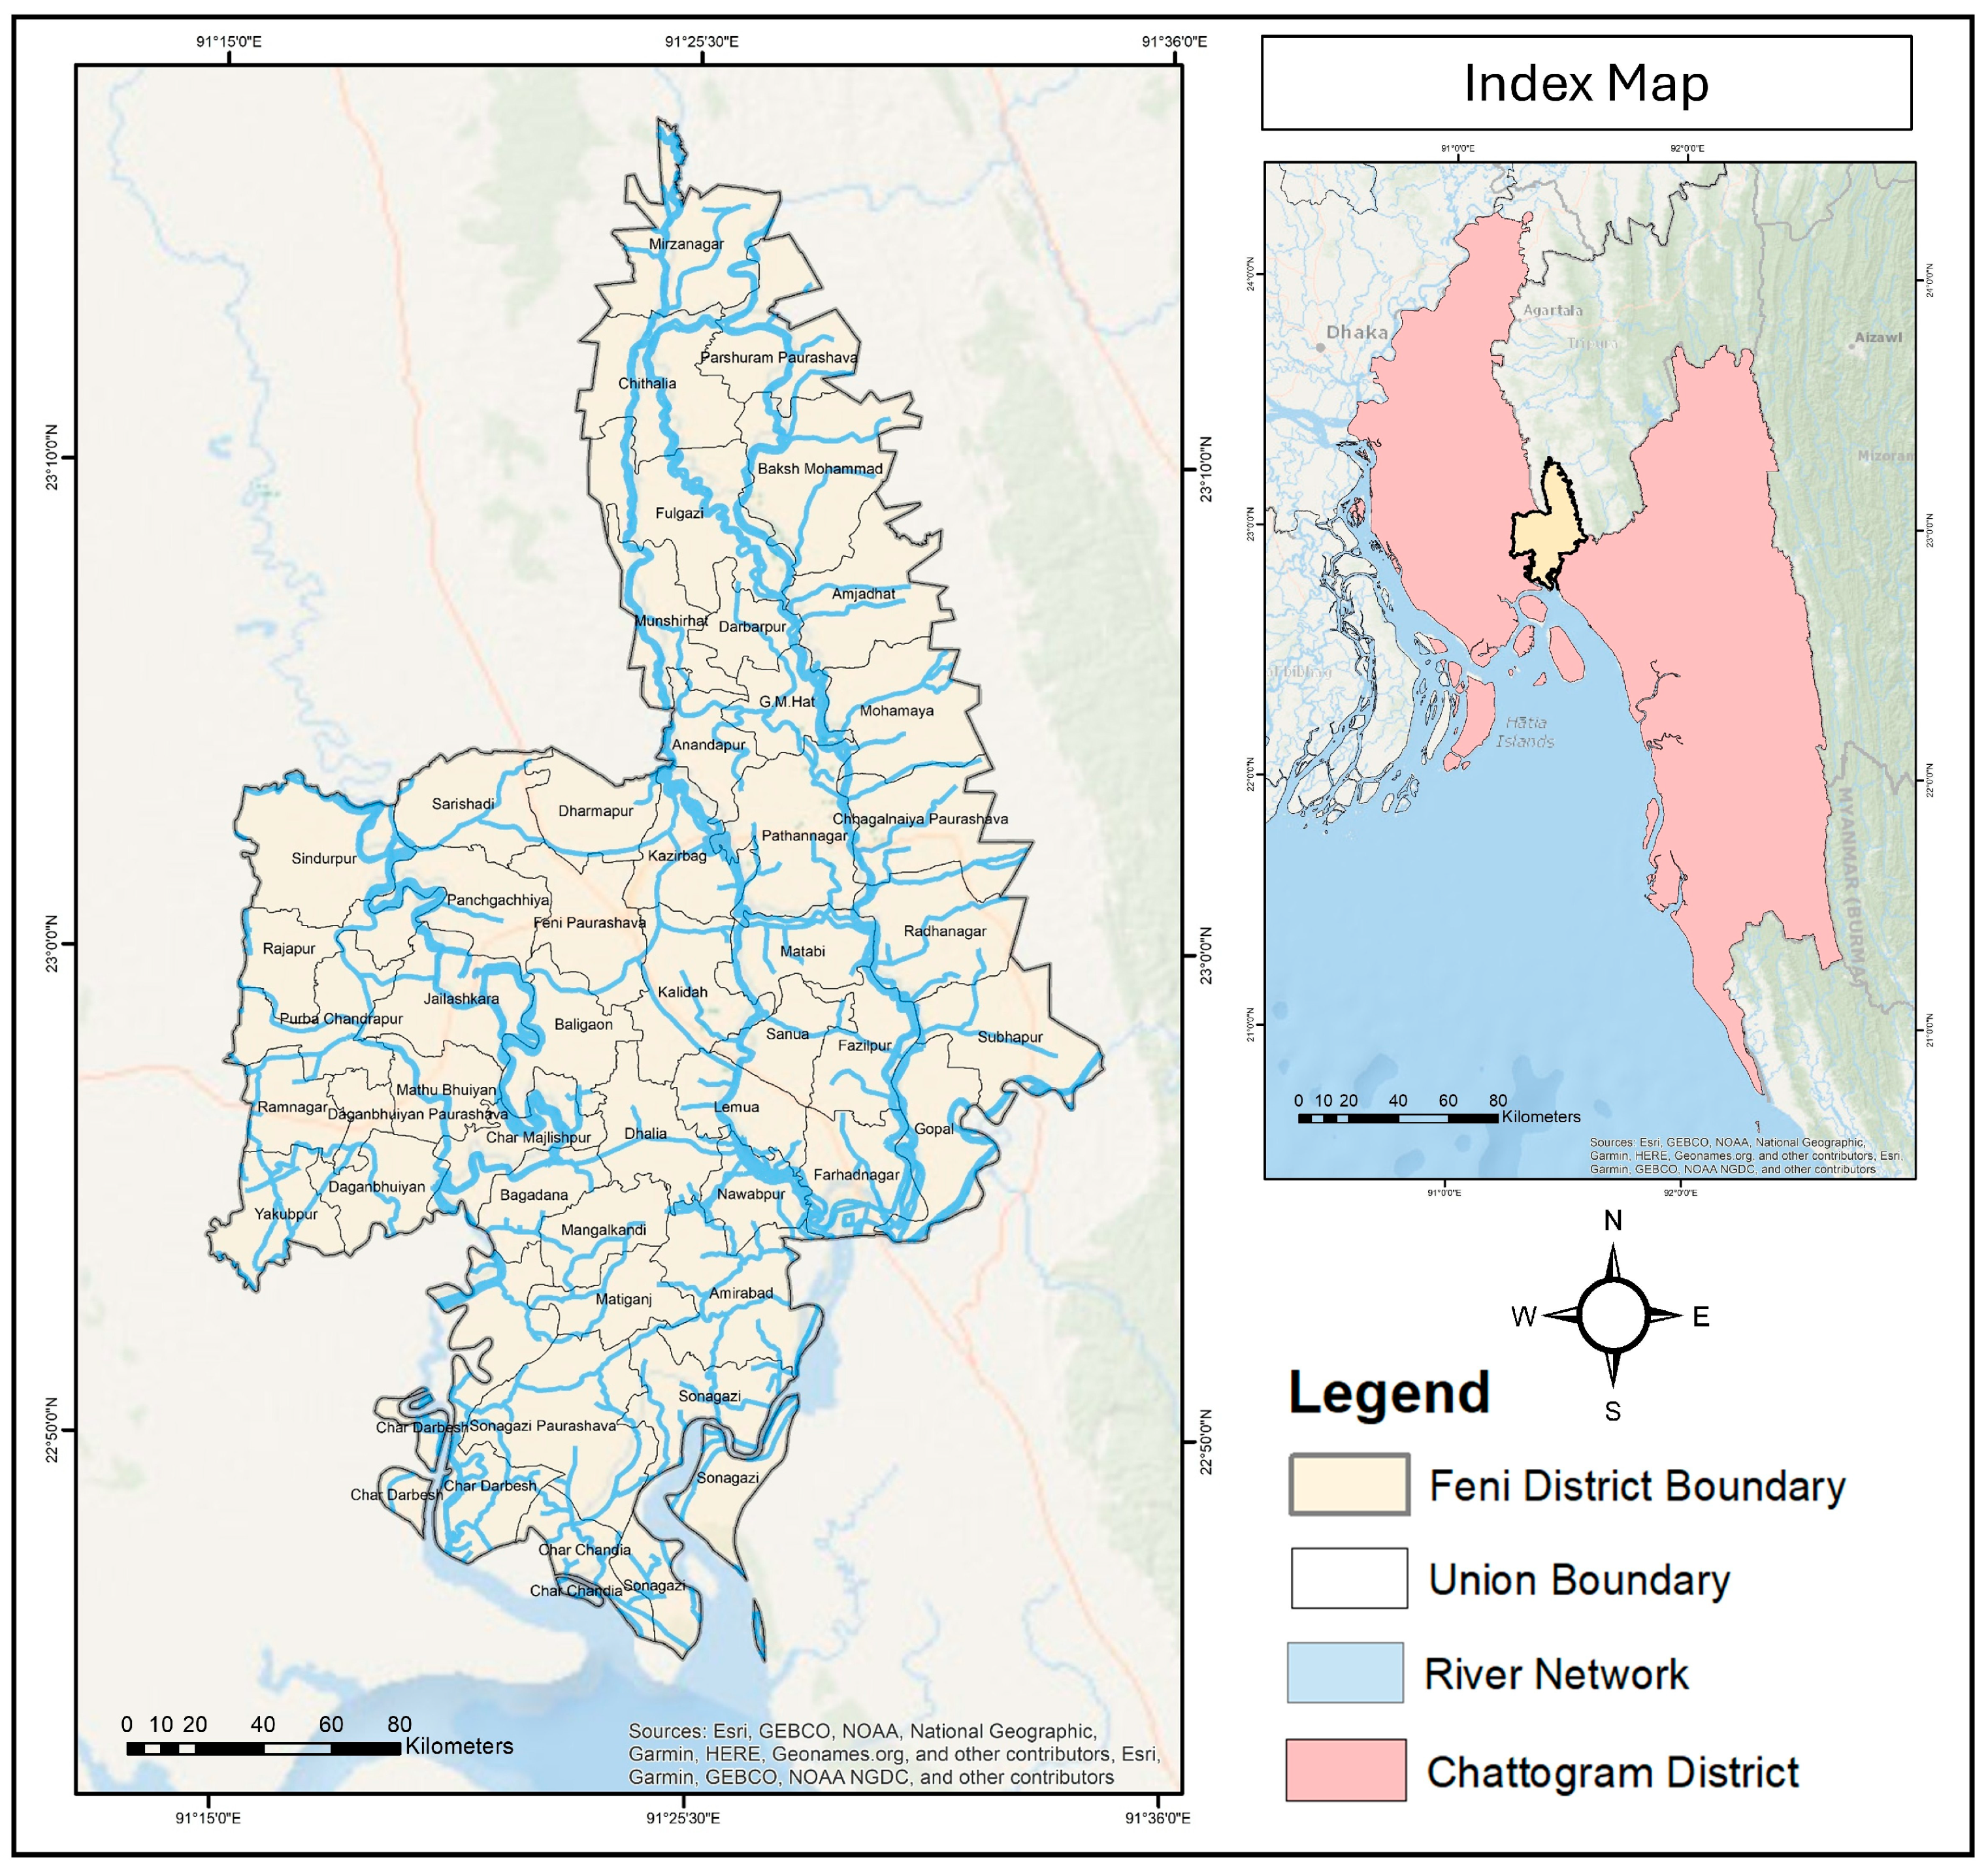
2.1. Study Area

The administrative division of Chattogram includes the Feni District, which is situated in the southeast coastal region of Bangladesh (Figure 1). With a total area of roughly 928.34 square kilometers, it is among the smaller districts in the area [21]. Its topography consists of floodplains, low-lying areas, and a few elevated regions, making it highly exposed to flooding. The Feni, Muhuri, and Selonia rivers, along with intense monsoon rainfall (averaging 2500–3000 mm annually), exacerbate flood risks [21,23].
The climate of Feni District is tropical, with heavy monsoon rains received from June to September. The average annual rainfall is about 2900 mm, out of which the monsoon contributes more than 80%. The warm and humid climate prevailing in the district contributes to flash floods [23].
The drainage system in the area is low-performing and often fails to cope with the enormous amounts of water, creating prolonged periods of static water and common flooding phases [24]. The flat nature of the land, the seasonal rains, and the closeness to big rivers make this district vulnerable to both seasonal flood occurrences and flash floods due to heavy rains or the release of water from other surrounding locations [25].
Feni District has had a long history of flood events due to its geographical location in the flood hazard area of Bangladesh. It is often hit by seasonal flooding during the monsoon, along with flash flooding due to extreme weather events and releases from upstream in India [26]. Historically, considerable floods occurred in this area in 1998, 2004, 2010, and 2017 [23]. All these incidents brought huge losses to property, infrastructure and agriculture, and displaced a large number of people [24]. In August 2024, the area faced a severe flash flood, and its magnitude brought forth the necessity of carrying out a thorough flood vulnerability assessment of the district [26]. The flood situation submerged several upazilas and people were cut off from communication, power and other basic amenities for weeks [27]. More than 137,500 people were rendered homeless but remained within waterlogged conditions, and 78 emergency shelters were opened to provide housing for over 40,000 displaced people [5,6,27].
Feni District was selected for this study because of its historical susceptibility to floods, which is influenced by socioeconomic and topographical variables [6]. The district’s strategic placement inside an active flood danger zone makes it one of Bangladesh’s most flood-prone areas. Apart from its historical susceptibility, Feni District is a crucial case study for assessing flood risk reduction tactics in an environment where increasing urbanization and climate change are making disaster management more difficult [5]. The area is well suited to evaluating the interaction between environmental dangers and human systems due to its varied socioeconomic structure and changing land-use patterns [28]. This in-depth knowledge is crucial for creating focused adaptation and resilience-building strategies that may be successfully incorporated into practice and policy, not just in Bangladesh but also in other internationally vulnerable regions.

2.2. Selection of Variables

In this study, a comprehensive set of indicators (exposure, susceptibility, resilience) was used to assess flood vulnerability across four key dimensions [15]. To assess these indicators, several variables have been selected based on a mixed deductive–inductive approach (Table 1). The geospatial input datasets originated from multiple sources, with varying native spatial resolutions. Population density, vulnerable age groups, poverty, and urban growth layers were obtained from WorldPop at a native resolution of 100 m (Table 1). The education and healthcare facility data were collected as building-level and point vector datasets, respectively, from HDX. Shelter locations were acquired from GeoDASH as vector points (Table 1). Terrain-related layers, including slope, elevation, and drainage density, were derived from the SRTM DEM at 30-m resolution. Land use/land cover (LULC) and urbanized area layers were sourced from the Esri Global LULC dataset at 10 m. Geology and soil type layers were polygonal datasets obtained from USGS and FAO, with resolutions of 1 km. The previous flood extent and recovery time layers were generated from Sentinel-1 SAR data at 10-m resolution (Table 1). Road and river networks were retrieved as vector line data from OpenStreetMap (OSM) and LGED, respectively. Rainfall data were obtained from NASA POWER, originally gridded at 0.5° resolution (~50 km). Finally, unemployment data were obtained from the UNISDR GAR database at 1 km resolution (Table 1). For integrated geospatial analysis, these disparate datasets were then harmonized to a consistent spatial resolution of 30 m.

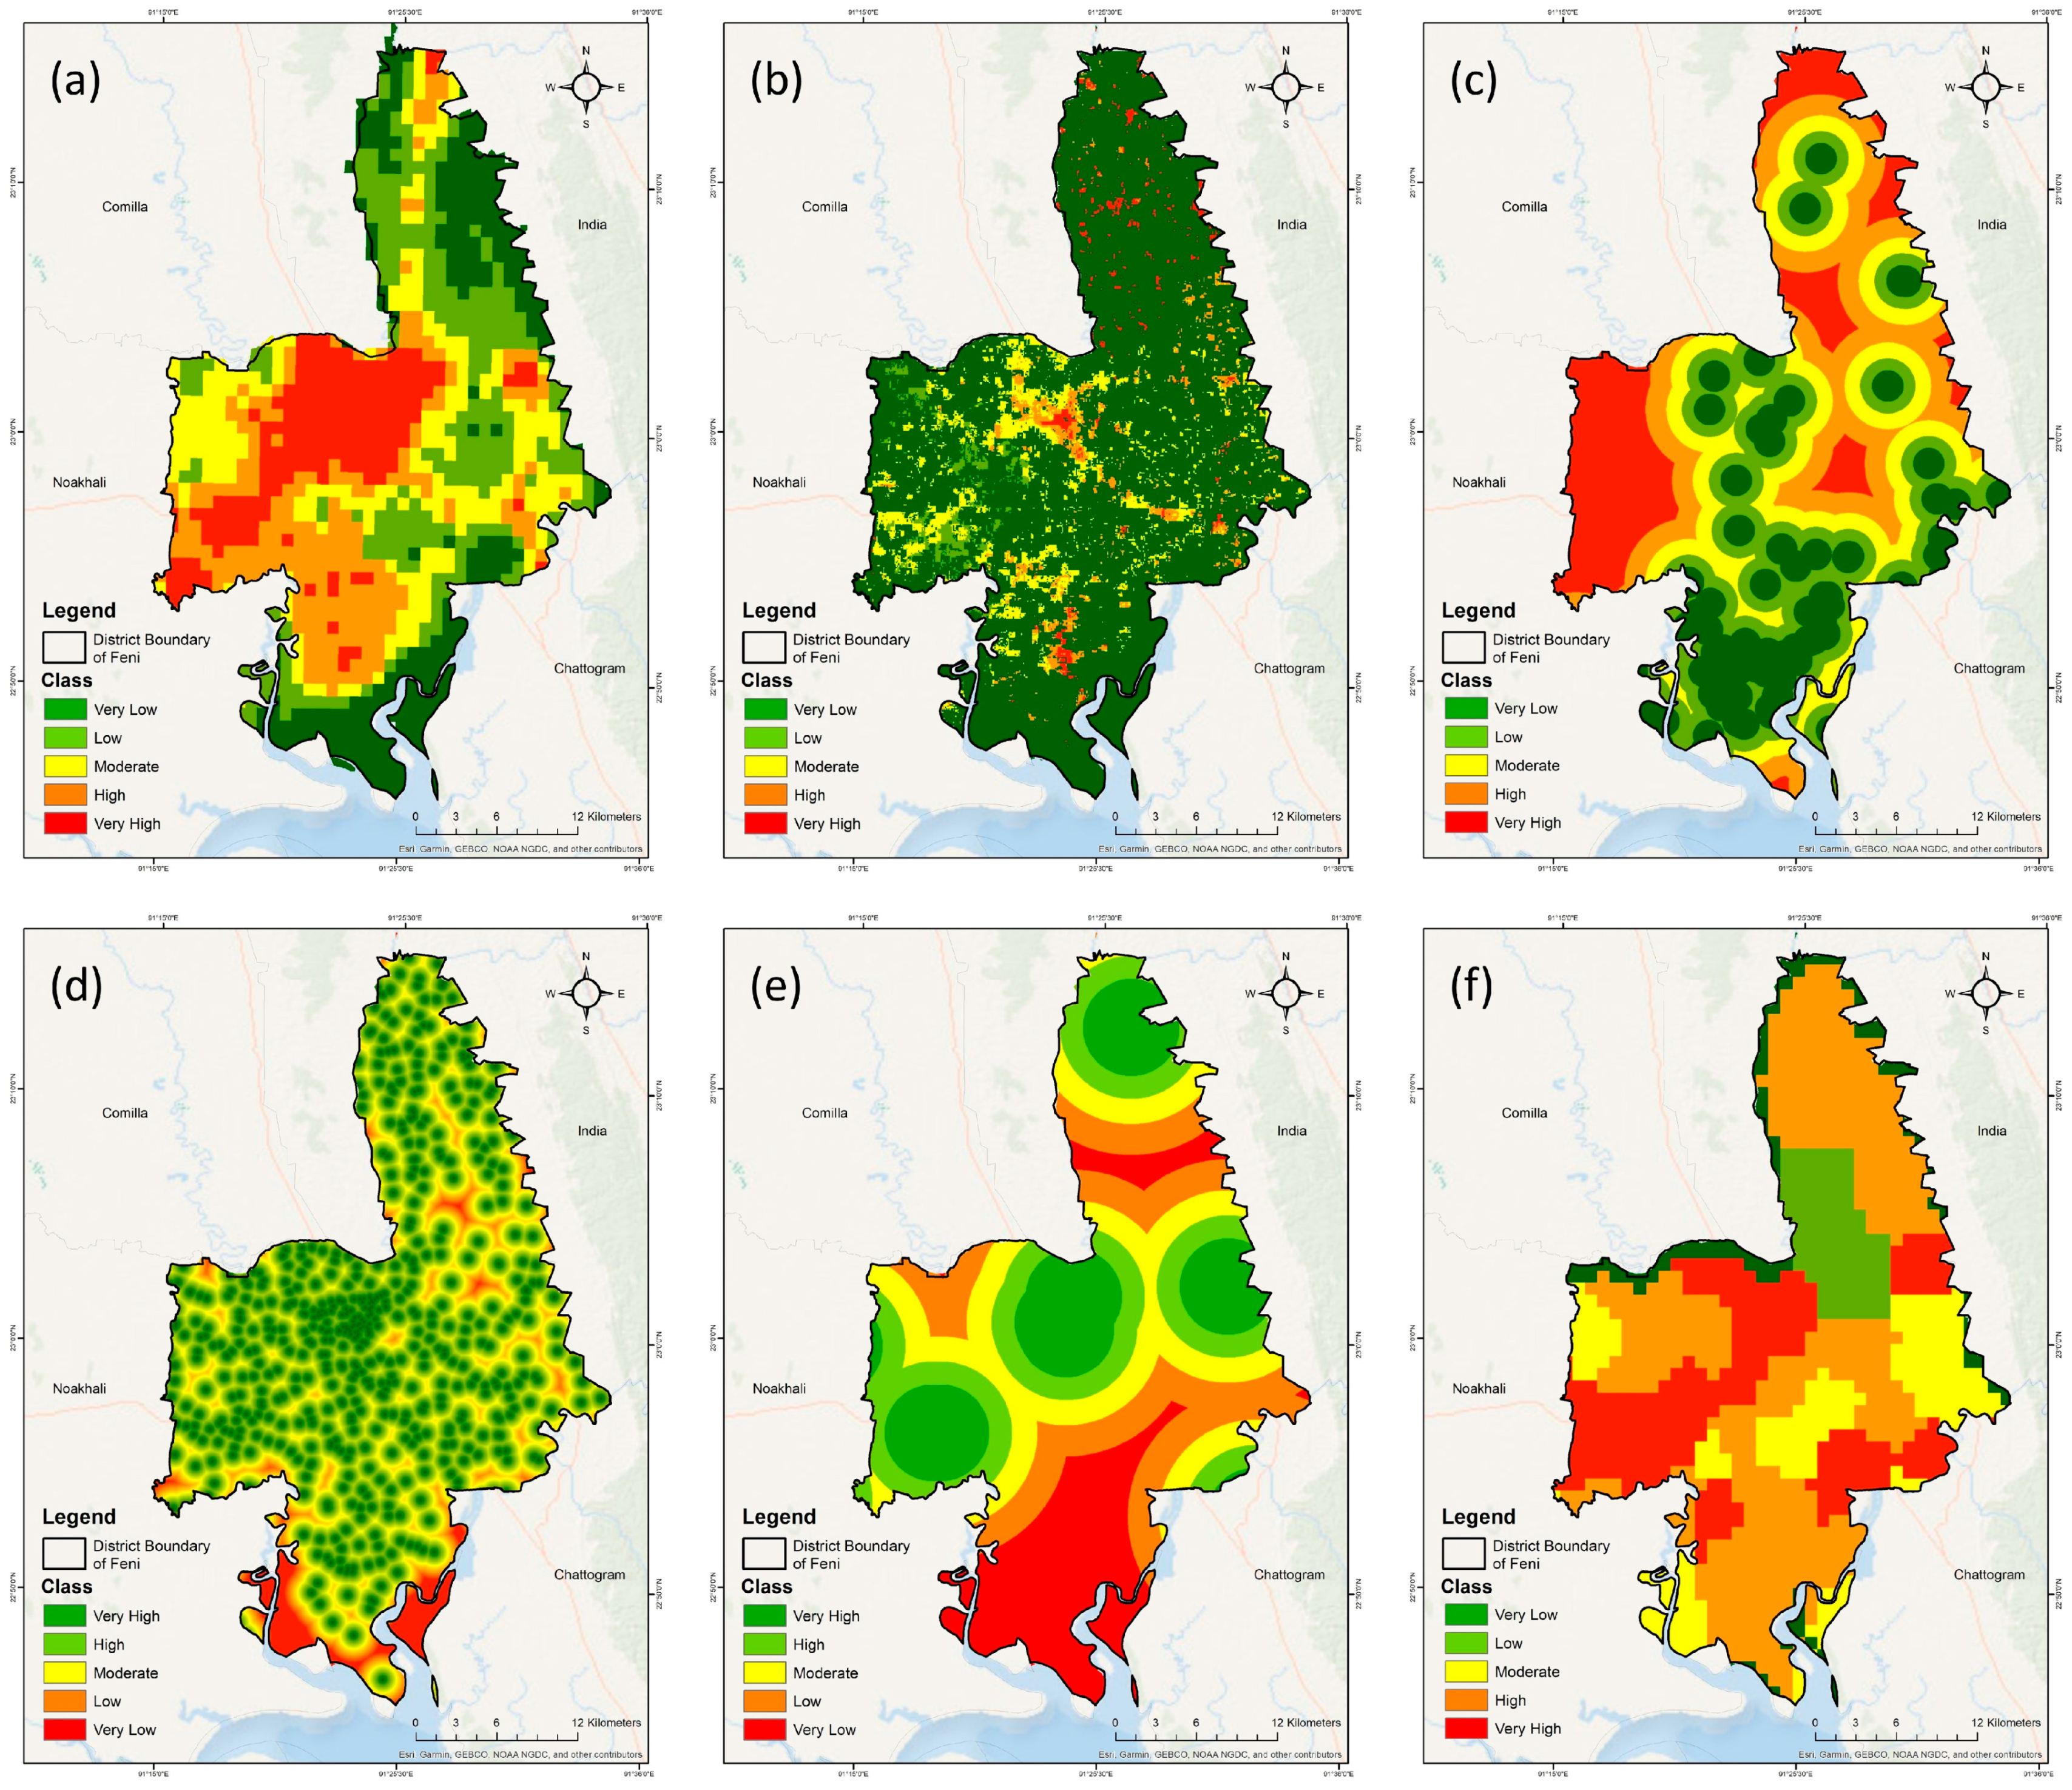
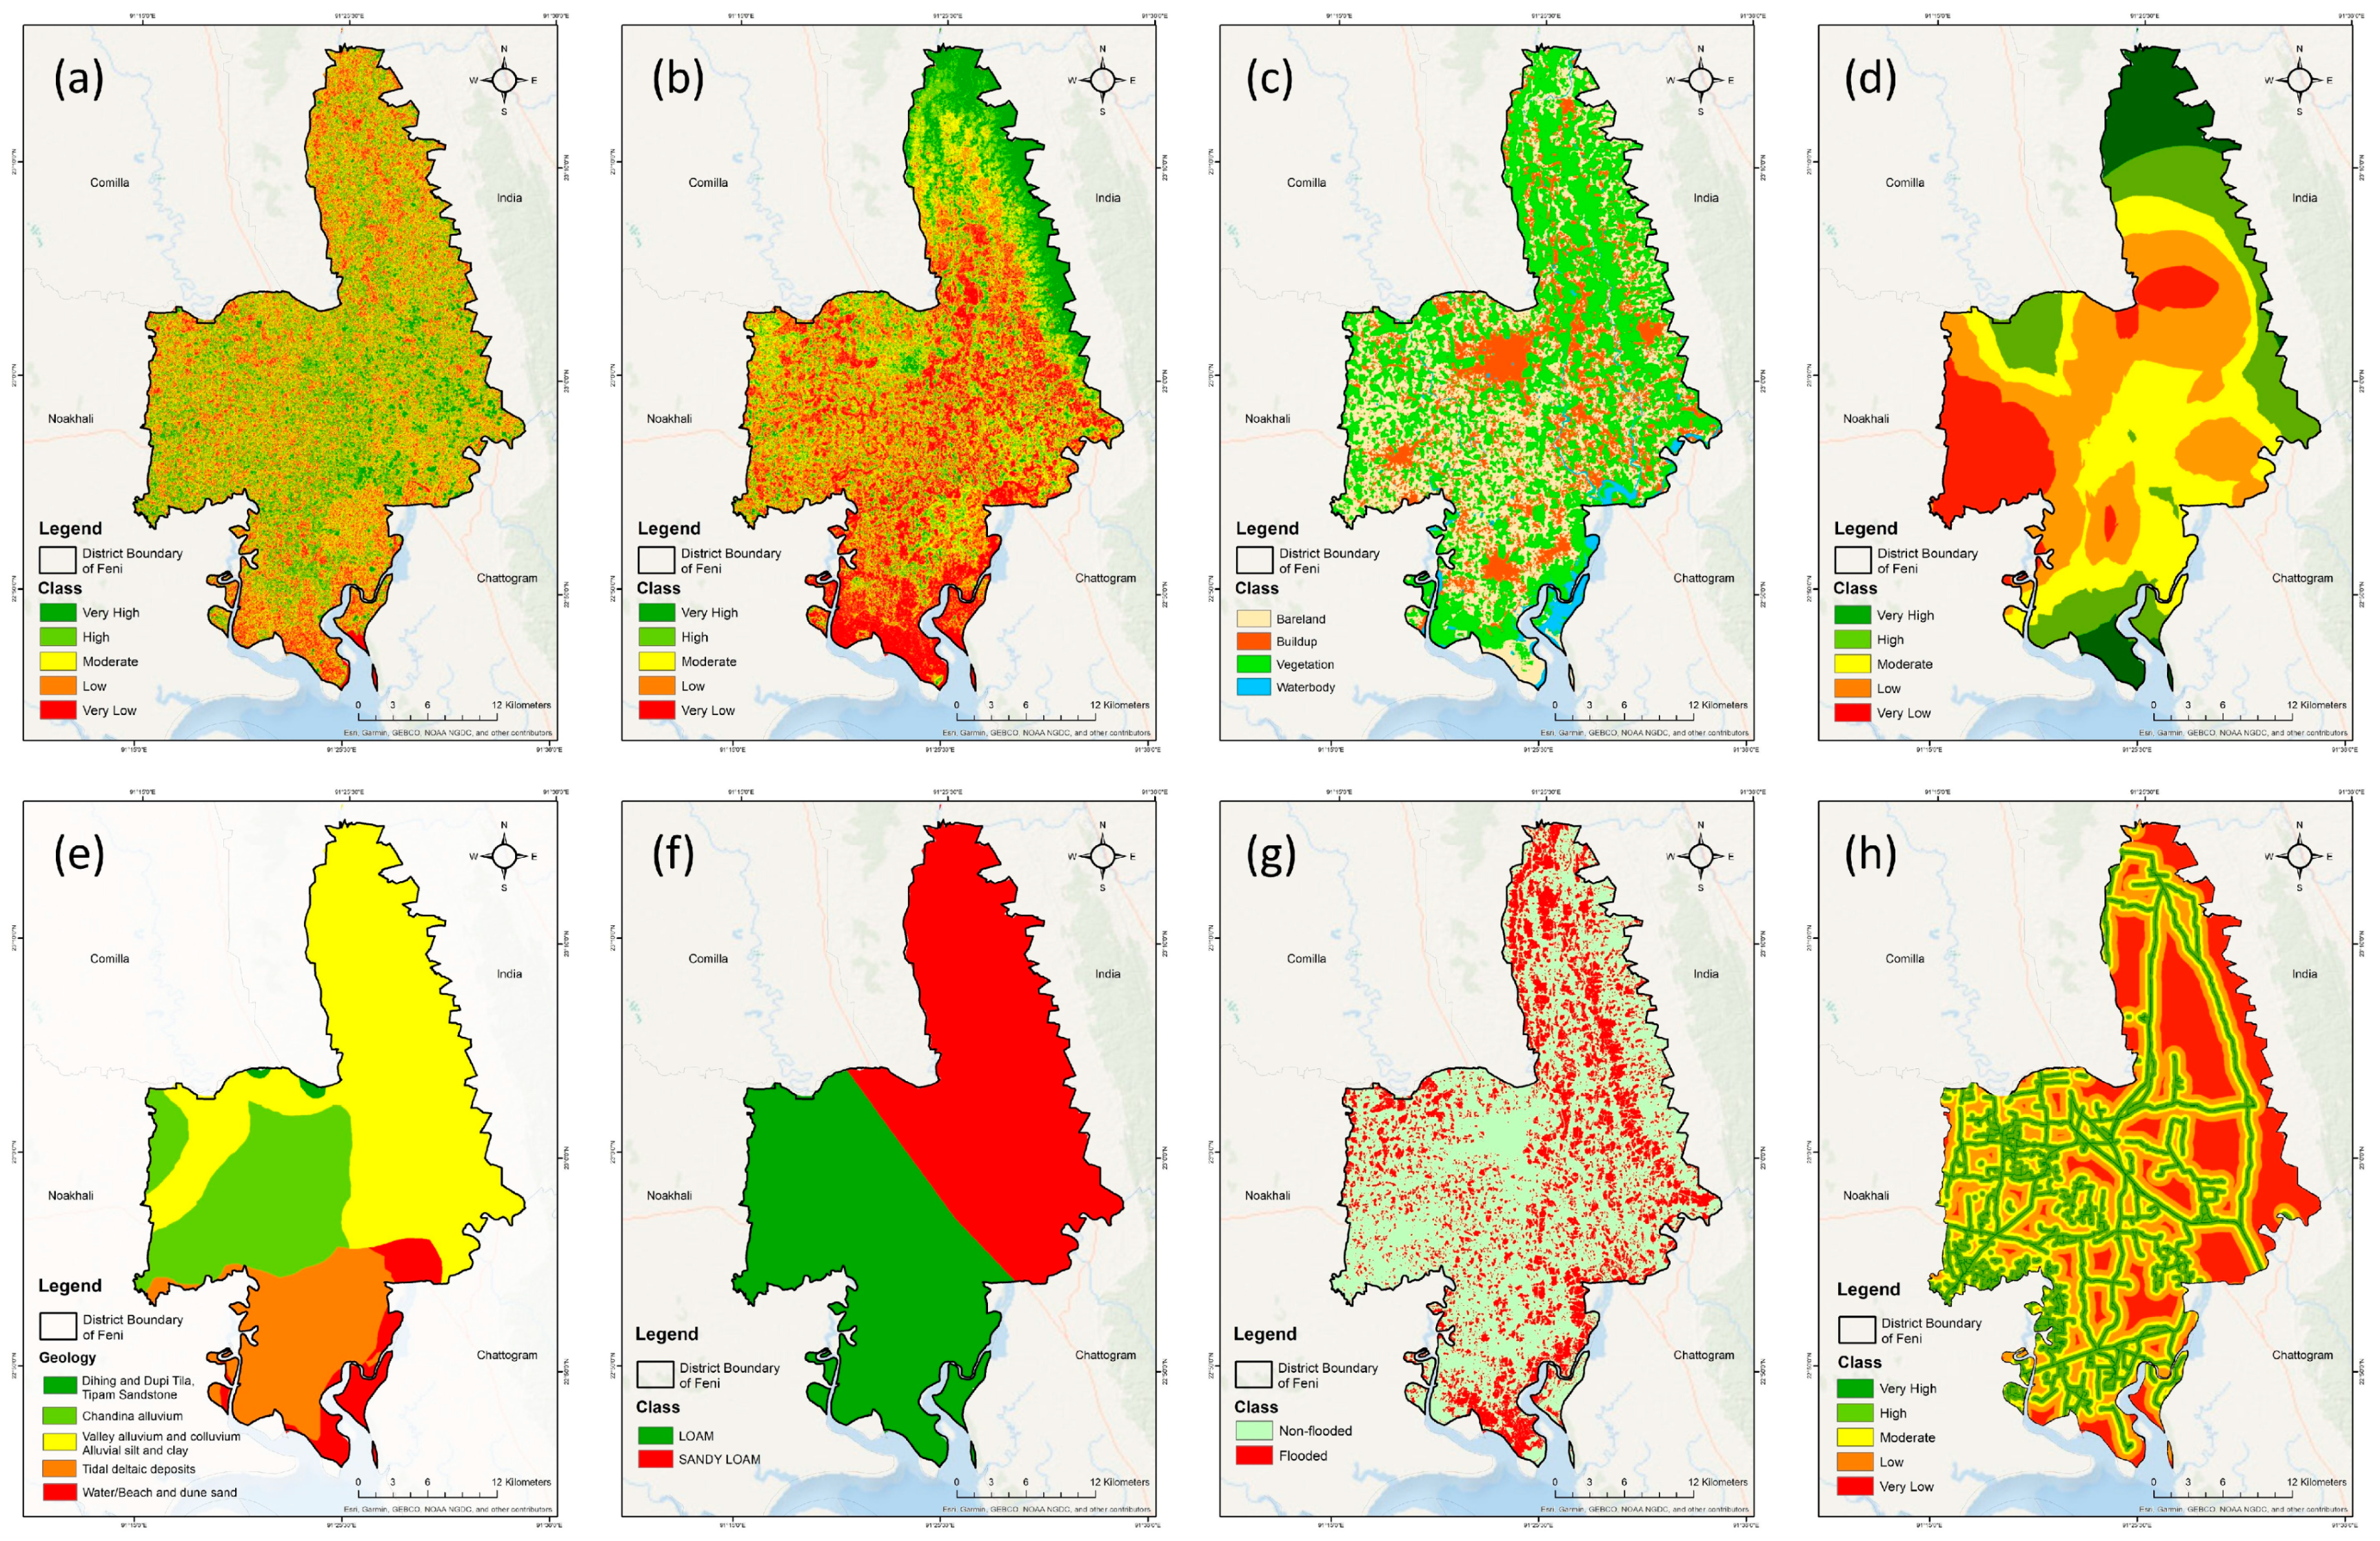
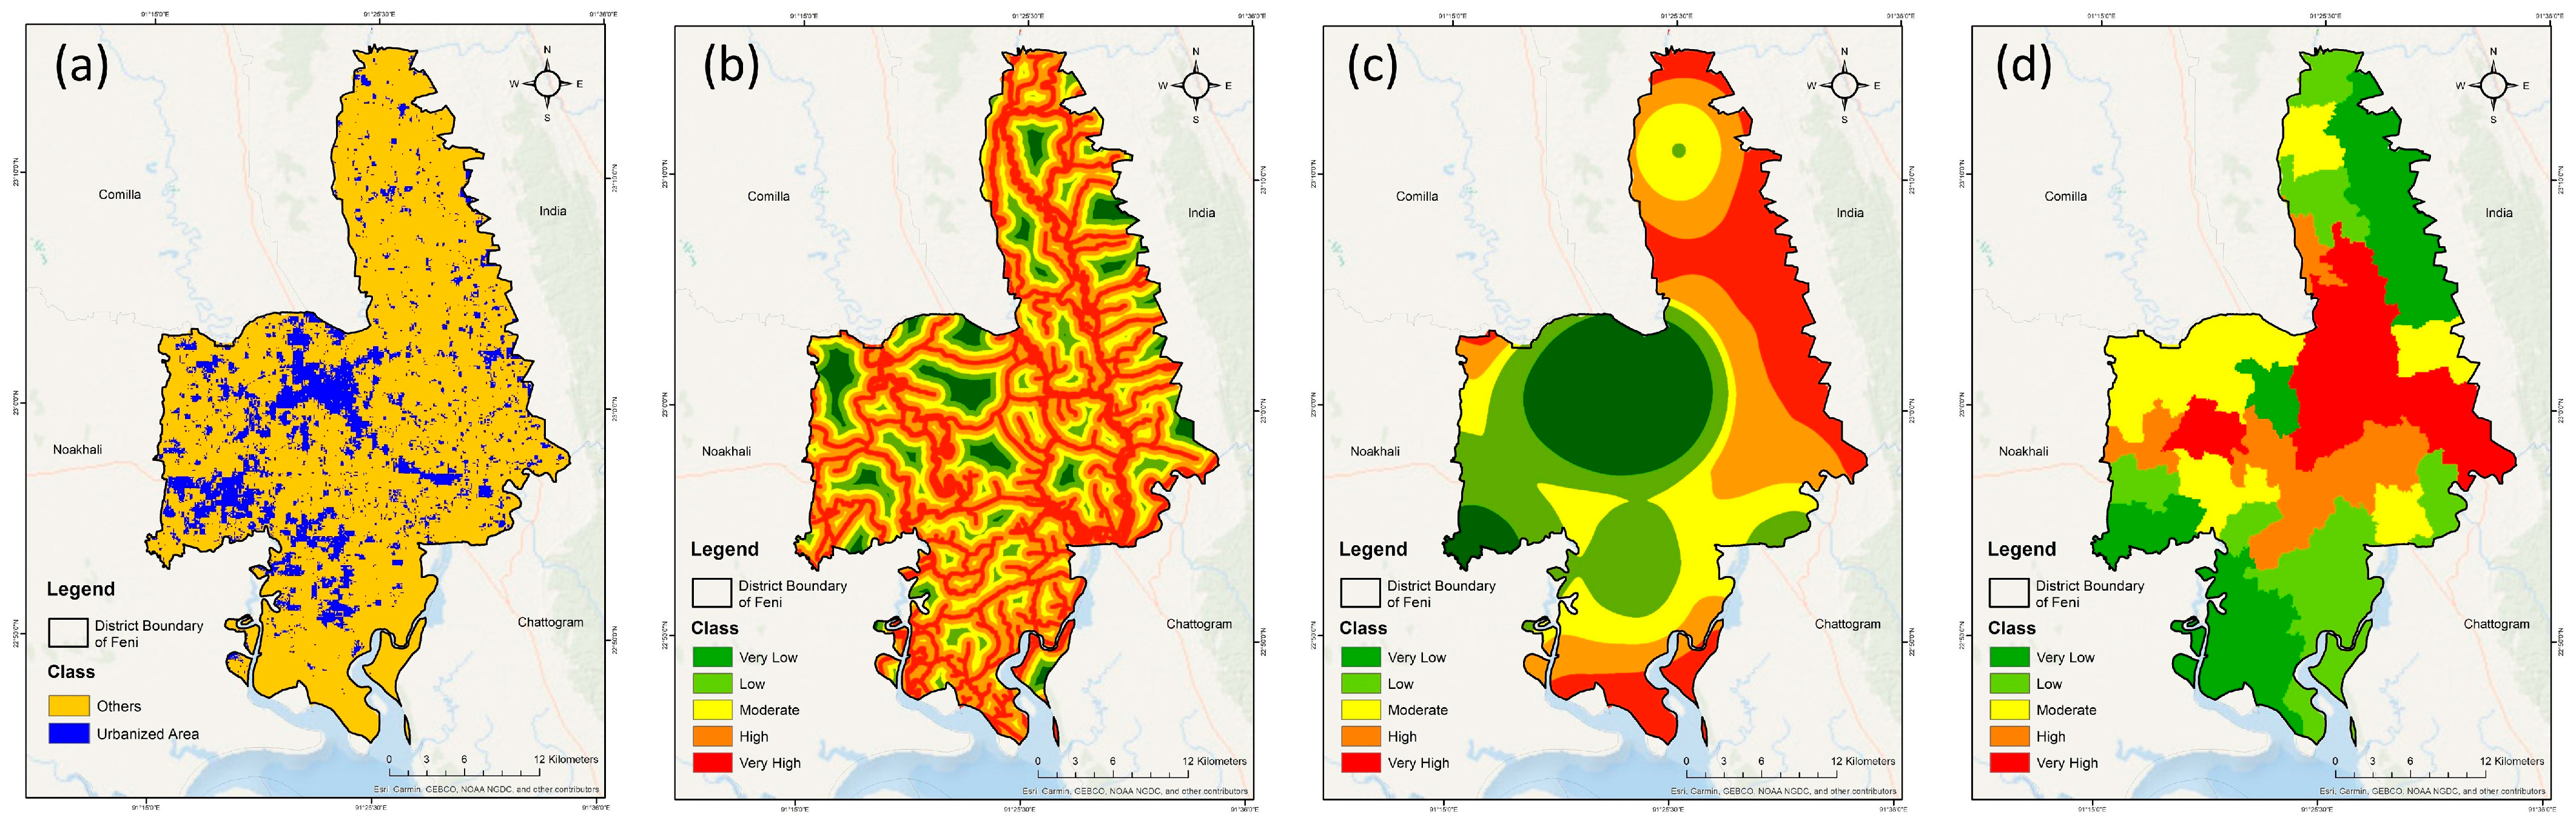
2.2.1. Variables for Social Vulnerability

Social vulnerability is assessed through several important indicators. For assessing exposure, variable population density (Figure 2a), is crucial, as areas with higher population densities are likely to experience greater disruption during flood events [29]. Another social exposure variable is vulnerable age group (people younger than 15 or older than 65 years). Figure 2b is used to capture the number of individuals within these vulnerable age groups, which is significant since they are more susceptible to the adverse effects of floods [14]. Flood shelters were used as a measure of resilience, with data showing the number and location of shelters in each region, impacting the population’s ability to seek immediate relief (Figure 2c) [19].
In assessing susceptibility, literacy rate (Figure 2d) is another key factor, and measures the availability of educational institutions, which is important for disaster preparedness and response capabilities [19]. In addition, proximity to healthcare facilities (Figure 2e) is considered a social susceptibility indicator, as access to healthcare can reduce casualties during floods (Figure S1).
This indicator measures the distance to the nearest health facilities [30]. Finally, poverty rate (Figure 2f) is used to measure the rate of poverty, which impacts the population’s ability to recover [29].

2.2.2. Variables for Physical Vulnerability

In this study, the assessment of physical vulnerability to flash floods was based on a comprehensive collection of datasets (Table 1). To assess exposure, as depicted in Figure 3a,b, slope and elevation data were utilized to analyze the topographical features that influence runoff patterns and flood propagation [31]. Steeper slopes typically increase the velocity and volume of surface runoff, thereby heightening the potential for rapid flood onset and greater impact [32].
Figure 3c presents land use data, which provides insights into how different land cover types affect flood dynamics and vulnerability levels [1]. Understanding the distribution and characteristics of land use is fundamental in determining how various surfaces interact with floodwaters, either mitigating or exacerbating flood risks [31]. Figure 3d illustrates drainage density, a measure of the river and stream networks that direct floodwaters through the landscape [33]. In Figure 3e,f, soil type and geology further contribute to physical vulnerability, as certain soil types and geological conditions absorb water differently, impacting flood risks [23]. Historical flood extents (Figure 3g) are also factored in to determine areas previously affected by floods and to assess susceptibility, providing context for chronic vulnerability [13]. Finally, to assess resilience, Figure 3h focuses on access to roads, which is critical for emergency response and evacuation during flash flood events (Figure S2). Efficient road networks facilitate timely assistance and reduce the risk of prolonged exposure to flood hazards [34].

2.2.3. Variables for Economic Vulnerability

Economic vulnerability focuses on the relationship between financial stability and flood impacts (Table 1) [18]. To assess exposure, the percentage of urbanized areas (Figure 4a) is a critical variable, as urban regions often experience more severe flooding due to impervious surfaces that prevent water absorption [35].
In addition, proximity to rivers increases flood risks (Figure 4b), with this indicator measuring how much of the population lives near major rivers [23]. High unemployment rates are considered an economic susceptibility factor (Figure 4c), as communities with high unemployment typically have fewer resources to recover from flood events [30]. Recovery time to floods, based on past experience, is also used as an indicator of resilience in the economic dimension (Figure 4d) [23]. This factor measures how quickly communities have historically recovered from flood-related economic damage, providing insight into their ability to withstand future events (Figure S3) [33].

2.2.4. Variables for Environmental Vulnerability

Environmental vulnerability is analyzed using several key variables (Table 1). For assessing exposure, rainfall intensity, calculated from a 60-year average, (Figure 5a) measures the exposure of different regions to extreme rainfall events. Areas with higher average rainfall intensities are more prone to flash floods [31]. Urban growth (Figure 5b) is considered a susceptibility factor in assessing environmental vulnerability, as rapidly growing urban areas tend to have more impervious surfaces and insufficient drainage systems, exacerbating flood risks [4]. Lastly, environmental resilience is measured by the recovery time from previous flood events (Figure 5c), assessing how quickly regions recover after floods (Figure S4) [11].
Each of these variables under three different indicators plays a critical role in building a comprehensive understanding of flash flood vulnerability in Feni District [33]. By integrating these diverse datasets and analyzing them through a geospatial approach, the study provides a nuanced perspective on the multifaceted nature of flood vulnerability in the region.

2.3. Data Pre-Processing

Prior to vulnerability assessment, a systematic data pre-processing approach was used to guarantee the consistency, and scientific rigor of the geospatial analysis. This was performed on all spatial data layers to get a uniform spatial resolution of 30 m, in order to ensure analytical consistency across datasets from diverse sources and different spatial formats. The decision to adopt this resolution was primarily guided by the native resolution of the SRTM DEM, which served as the foundational dataset for several derived layers, such as elevation, slope and drainage density. Additionally, a 30-m grid provides an optimal balance between spatial detail and computational efficiency, especially for district-scale flood vulnerability assessments [36], while also being compatible with medium-resolution remote sensing products and widely used in similar geospatial studies in Bangladesh [37].
Following this, all datasets were projected to a common coordinate reference system (WGS 84) to ensure geospatial interoperability and eliminate spatial misalignments during overlay and raster calculations. For datasets provided in vector formats (e.g., education facilities, health centers, shelters, road and river networks, geology polygons), vector-to-raster conversion was executed using the spatial analysis tool in ArcGIS. Point features were rasterized based on Euclidean distance from each feature’s centroid, while polygon features, such as geology, were converted using the majority rule within each raster cell. Line features, such as roads and rivers, were converted to distance raster that calculates the shortest path from each grid cell to the nearest feature. Once all data layers were in raster format, they were resampled to the target resolution using an interpolation technique. Specifically, continuous variables (e.g., rainfall, elevation, poverty index) were resampled using bilinear interpolation, preserving smooth gradients, while categorical or discrete datasets (e.g., LULC, soil type, geology) were resampled using nearest neighbor interpolation to maintain class integrity. All rasterized layers were then normalized to a uniform scale to facilitate multi-criteria evaluation. Subsequently, these processed layers were classified into five vulnerability categories using natural breaks (Jenks) classification to prepare the base maps of individual variables (Figure 3, Figure 4 and Figure 5), which were then used to compute final vulnerability layers.

2.4. Normalization of Data

Normalization in this study is used in making the diversified spatial data comparable and effective to analyze. It brings all variables down to a common scale, which is critical for weight generation in order to study the variables in similar units [38]. In this study, min–max normalization was applied, turning raw data values to a common scale between 0 (indicating the lowest susceptibility) and 1 (indicating the highest vulnerability). This is also useful for comparing maps using a quartile classification process [14]. The min–max normalization for each indicator has been carried out using Equation (1):
yij = (xmax − xmin)/(xij − xmin)
where yij is the normalized value of the j-th indicator for the i-th spatial unit, xmin and xmax are the indicator’s minimum and maximum values, respectively, and xij is the indicator’s original value.
Another important fact that had to be considered when applying normalization was the direction of the relationship between the indicator and vulnerability. For all those variables where higher values showed a greater relationship with vulnerability, such as population density or unemployment, the normalization process has been applied directly. However, for those indicators where higher values meant lower vulnerability or greater resilience, such as access to roads or flood shelters, the normalization formula has been reversed. In this way, in all instances, a high normalized value represented higher vulnerability.
These normalized data were then prepared for PCA, which generated weights for each variable. Normalization not only provided a fair comparison between these diverse data types but also set the bedrock on which these variables can be accurately integrated into the overall geospatial model of vulnerability.

2.5. Weight Generation

Weighting of the various variables corresponding to each indicator of the dimensions of vulnerability is necessary to integrate the variables, in order to assess the actual flood vulnerability condition across Feni District (Figure 6). Generation of weights for such variables was performed using PCA, which reduces the complexity of multi-dimensional data into lower dimensions, while retaining most critical features of the original data [39]. This approach will allow meaningful components to be extracted from the data, whereby the absolute importance for each variable will be derived [40].
The PCA considers the maximum variance, which allows grading of the priorities of regions in terms of the most important factors, without subjective weighting [41]. This is a data-driven approach and highly accurate in the sense that it is free from the frequent dependency of other MCDM techniques, such as AHP, TOPSIS, and SAW, on subjective weight assignment for the criteria [39]. While AHP is useful in decomposing complex decisions, it may be biased and requires too much time when used on large datasets [40]. Similarly, though useful in ranking alternatives, TOPSIS and SAW require assignments of weight and are not as effective with related variables when compared to PCA. The greatest advantage of PCA is the fact that it handles very large datasets consisting of several interrelated indicators to ensure that the selection of influential factors is not influenced by human bias [40]. This makes it a robust and logical choice for studying flood vulnerability, as it reduces complicated datasets to simpler forms and gives a more reliable and data-centric output when compared to other MCDM methods.
In order to confirm the dataset’s fitness for PCA, the study performed two fundamental statistical tests: the Kaisa–Mayer–Olkin (KMO) test [42] and Bartlett’s test of sphericity [43]. Statistical testing of data completeness and of the appropriateness of the variables for factor analysis are the purposes of these tests.
The KMO test was used to measure sampling adequacy, which checks the strength of the relationships among variables. The KMO value ranges between 0 and 1; the closer the value is to 1, the more proper the dataset is for PCA. The next test is Bartlett’s, which reports on whether the correlation matrix was significantly different from an identity matrix, in which all variables would be uncorrelated. This test showed a significant p-value, p < 0.05, indicating that there is significant correlation among the variables, thus making them suitable for PCA [43]. After confirmation of adequacy via these tests, the communalities were calculated. Communalities refer to the proportion of variance for each variable explained by the components extracted from PCA [44]. This was an important step to ascertain that each variable contributed meaningfully to the overall analysis, hence ensuring the reliability of the weights generated.

Principal Component Analysis (PCA)

The data gathered for different flood vulnerability factors were structured in a matrix form, where each observation is denoted by a row and each variable, pertaining to an indicator of vulnerability, is represented by a column. The first step in the analysis involved transforming each variable into a z-score for the variable using Equation (2) [45]. This standardization makes certain that no variable contributes less or more to the PCA:
Z ij = X i j µ i σ i
where Zij is denoted as the standardized value of the ith variable for the jth observation and Xij is the actual value, µi being the mean and σi being the standard deviation of the ith variable, respectively.
After the normalization of data, the covariance matrix of the variables was calculated using (Equation (3)). This shows the variance between the flood vulnerability indicators, bringing out how most vary together [43]:
C = 1 n 1 j = 1 n ( X j X _ ) ( X j X _ ) T
where C represents the covariance matrix, Xj denotes the standardized values for the j-th factor, and X _ refers to the average vector for all the factors.
The covariance matrix is used for further calculations of eigenvalues and eigenvectors using (Equation (4)). Therefore, to eliminate the principal components, it was necessary to perform eigenvalue decomposition on the covariance matrix [43]:
Cv = λv
where v is an eigenvector corresponding to a certain principal component, and λ is the corresponding eigenvalue.
In this way, the principal components’ directions are defined by the eigenvectors, while the variance proportion explained by each component is given by the eigenvalues. The first principal component explains the maximum level of variance in the dataset while the other components will explain progressively less variance [43]. Based on this, the loading for each variable for the principal components was obtained through the analysis of the eigenvectors (Equation (5)):
Lik = vik
where Lik is the loading of the i-th variable on the k-th principal component, and vik is the corresponding eigenvector element.
The loadings show the impact of each variable on each principal component in a comparative manner. To measure the contribution of individual variables to the principal components, the loadings were squared using Equation (6). This eliminates any values that are negative and offers a measure of the total contribution of each variable to the variance explained. The loadings squared for the variables were then aggregated over all principal components to obtain the overall contribution of each variable using Equation (7):
Li2 = (vi)2
Total   squared   loading   S i = k = 1 p L i k 2
where p is the number of principal components that are kept according to their eigenvalues.
This sum depicts the average contribution of each variable in explaining the variation contained within the flood vulnerability. In order to provide weights for the indicators, the squared loadings were made relative by dividing each by the total sum of squared loadings for all variables using Equation (8) [41]:
W i = T o t a l   s q u a r e d   l o a d i n g s i i = 1 n T o t a l   s q u a r e d   l o a d i n g s i
where Wi is the normalized weight for the i-th variable, and n is the total number of variables.
To ease comprehension, these weights were expressed as percentages. The obtained weights suggest how relevant each flooding vulnerability variable level assessment is [41]. These weights were subsequently employed to fuse the various factors into a single index and thus allowed for flood vulnerability assessment over the study area in a more complete manner.

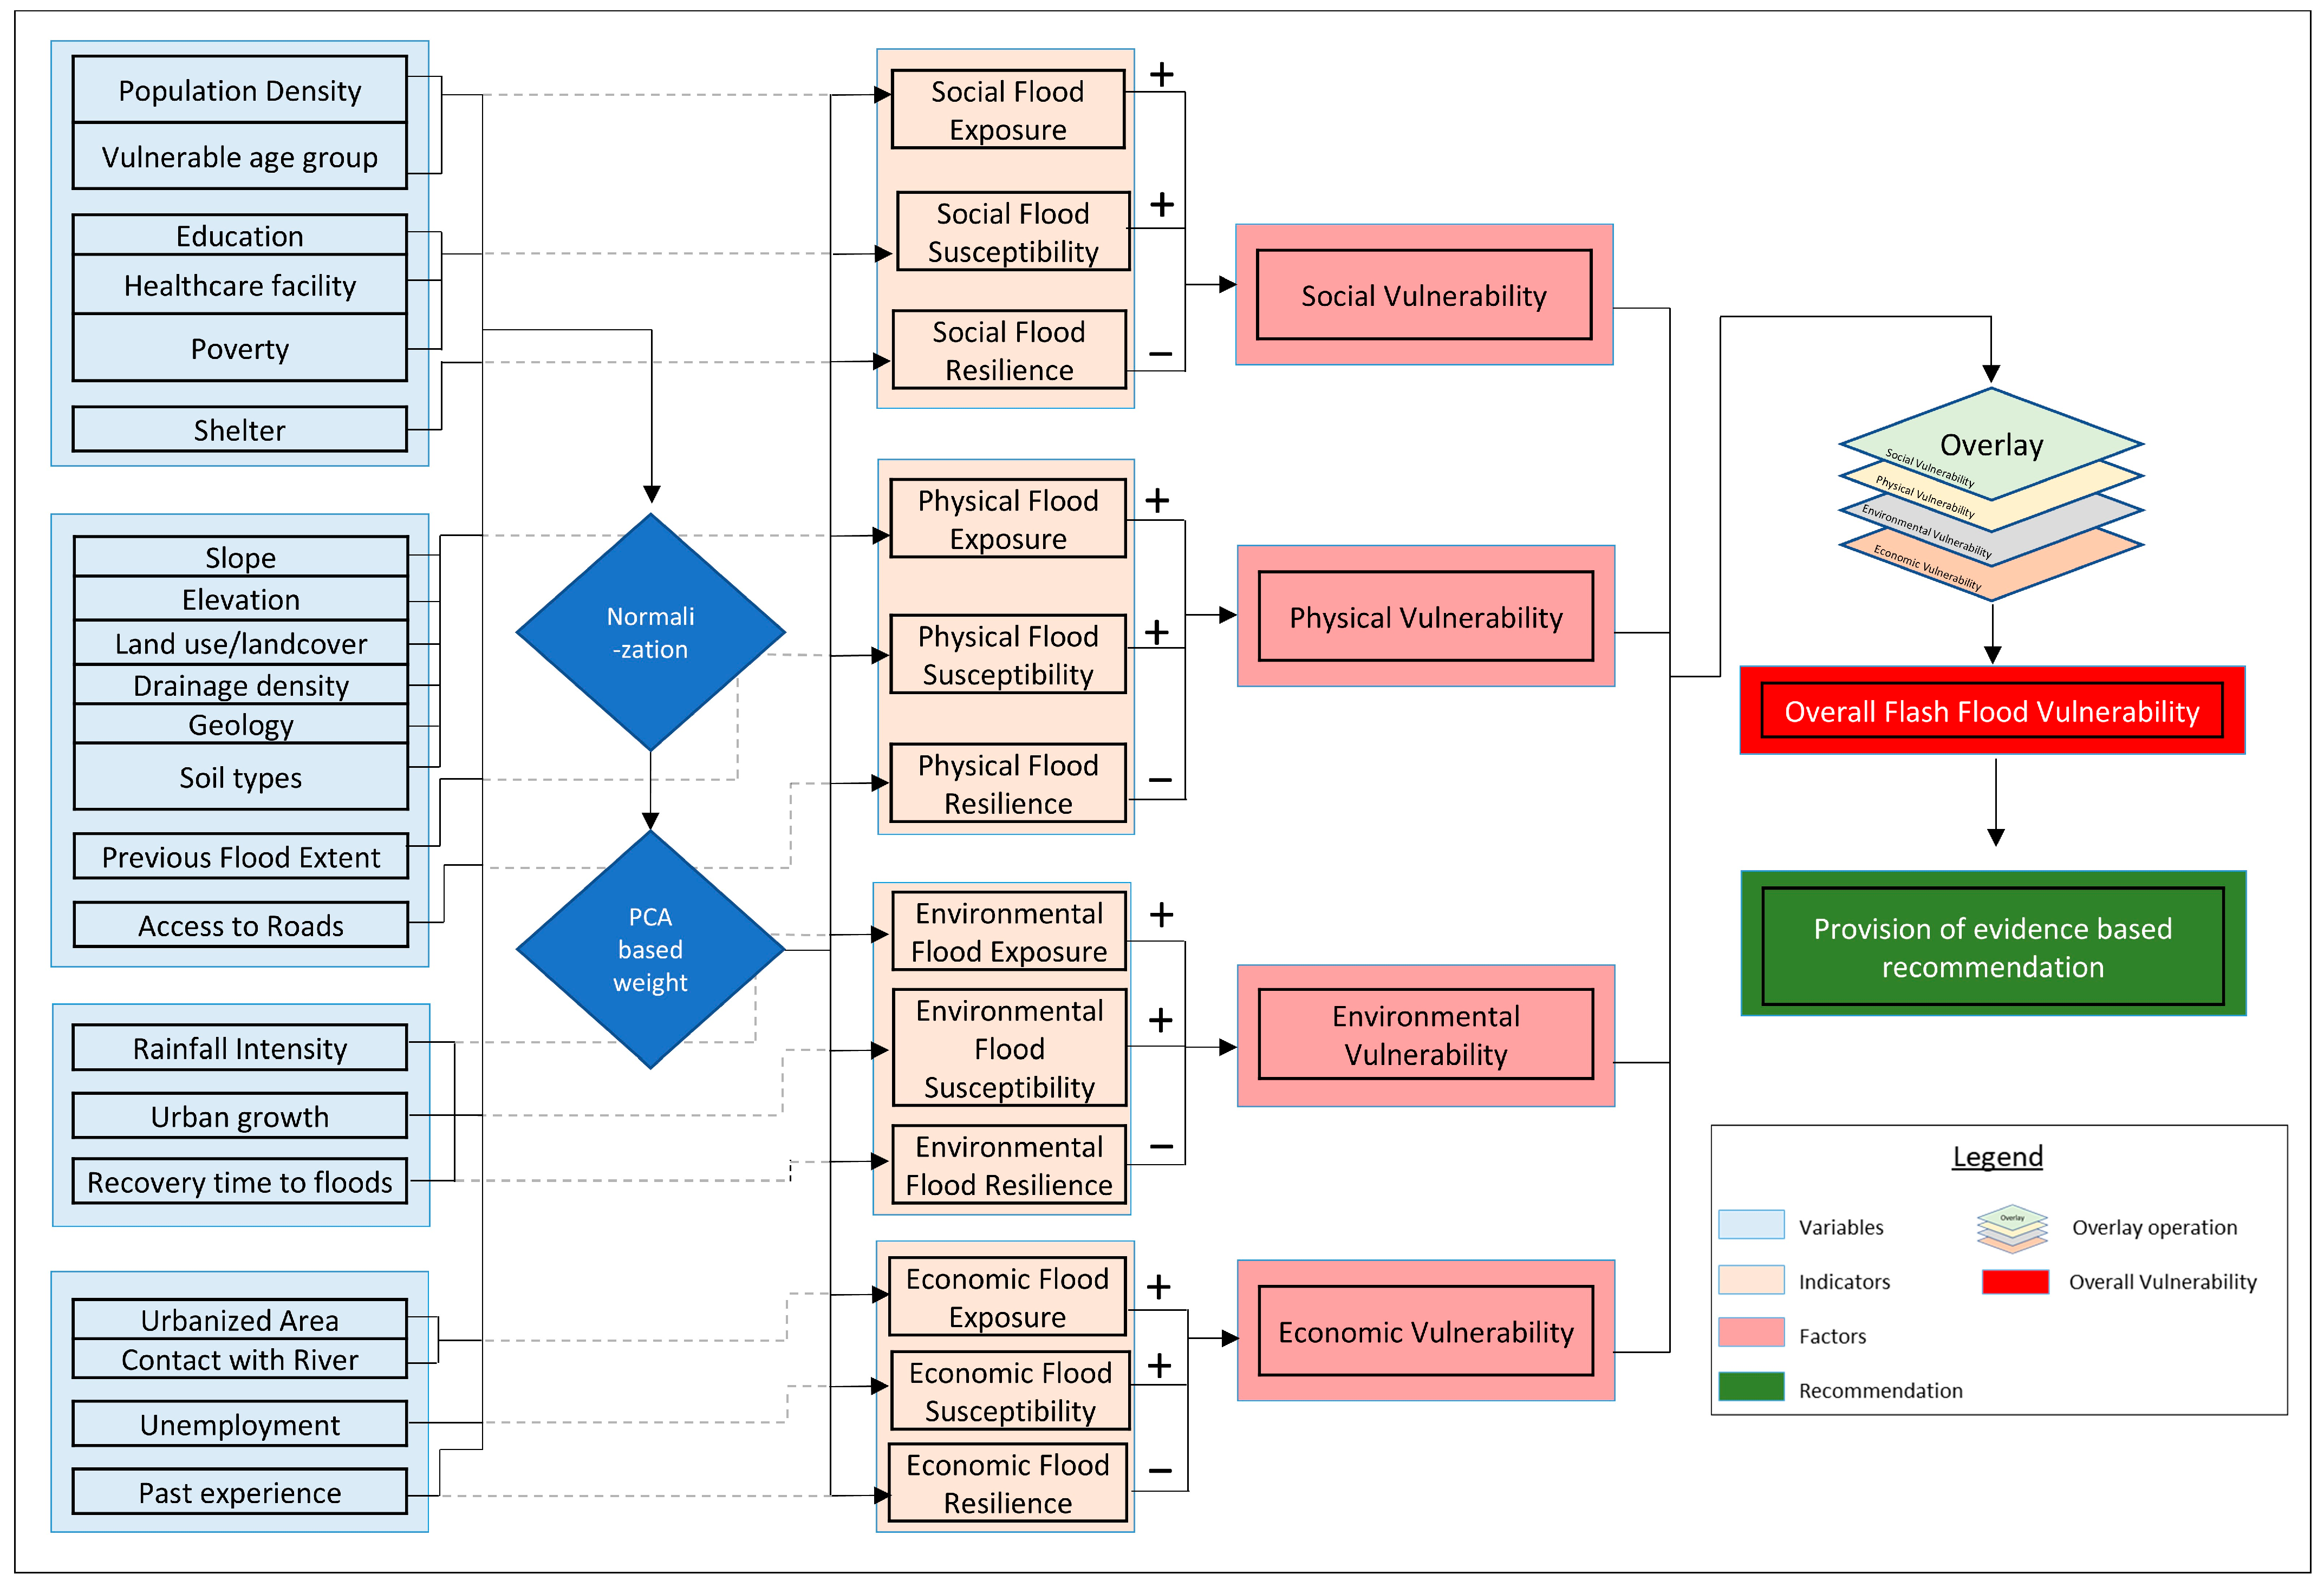
2.6. Flood Vulnerability Assessment Framework

In this study, flood vulnerability assessment was based on a systematic framework set up by Equation (9), issued by UNESCO-IHE [15]. This framework enables the various aspects of vulnerability to be addressed and helps to integrate different elements that contribute to and increase vulnerability to floods. The formula which assesses vulnerability in this study is expressed as follows:
Vulnerability = Exposure + Susceptibility – Resilience
In this study the components of the (Equation (9)), are referred as the indicators of vulnerability and the indicators have several variables in it. According to the generated weights of the PCA, the variables were integrated together to form the spatial layer of these indicators. Which is been done following the (Equation (10)).
Indicator (Exposure, Susceptibility, Resilience) = W1 × V1 + W2 × V2 + … + Wn × Vn
where W(1 to n) are the weights generated from PCA and the variables V(1 to n) are the variables specified in Table 1.
The method offers a uniform framework for understanding flood vulnerability by integrating three major indicators. The meaning of exposure in this context is the degree to which a geographical area or a demographic group is exposed to the impacts of flood hazards [46]. The term susceptibility stands for their respective intrinsic attributes that predispose them to be negatively affected [1]. Resilience is the ability to withstand or recover from floods [47]. The formula makes it clear that exposure and susceptibility contribute to vulnerability, while resilience acts to reduce it. In this way and using this formula to analyze the collected spatial data, the study succeeded in producing vulnerability maps that incorporate these components and show their relationship throughout the Feni District.

3. Results

3.1. Data Suitability and Weight Assessment

According to sensitivity and reliability analysis (Table 2), the KMO test value exceeded the minimum threshold of 0.6, confirming that the dataset was suitable for PCA. This result indicated that the correlations among variables were strong enough to proceed with the analysis. Similarly, Bartlett’s test of sphericity produced a significant result (p < 0.05), which validated that the variables in the dataset were sufficiently correlated for PCA.
This made sure that the data displayed significant correlations needed for factor extraction. The communalities, calculated as part of the PCA process, demonstrated high values close to 1 for most variables. This indicated that a large proportion of each variable’s variance was shared with the others, confirming their strong contribution to the principal components. As a result, the dataset was deemed statistically appropriate for PCA, and the final weights generated from the analysis were reliable for constructing the vulnerability map.
Once the loadings for each indicator were computed, the next step involved squaring these loadings (Equation (7)) to quantify the contribution of each indicator in terms of variance explained. To ensure comparability across indicators and dimensions, the squared loadings were normalized (Equation (8)). The weights for each indicator in the other dimensions (physical, economic, and environmental) followed similar procedures. The final weights derived through PCA reflect the importance of each indicator and provide a balanced approach to integrating them into the overall flood vulnerability assessment for Feni District (Table 3). The final derived weights for each variable allow for the accurate integration of these into the overall vulnerability model to create composite vulnerability maps for each dimension.

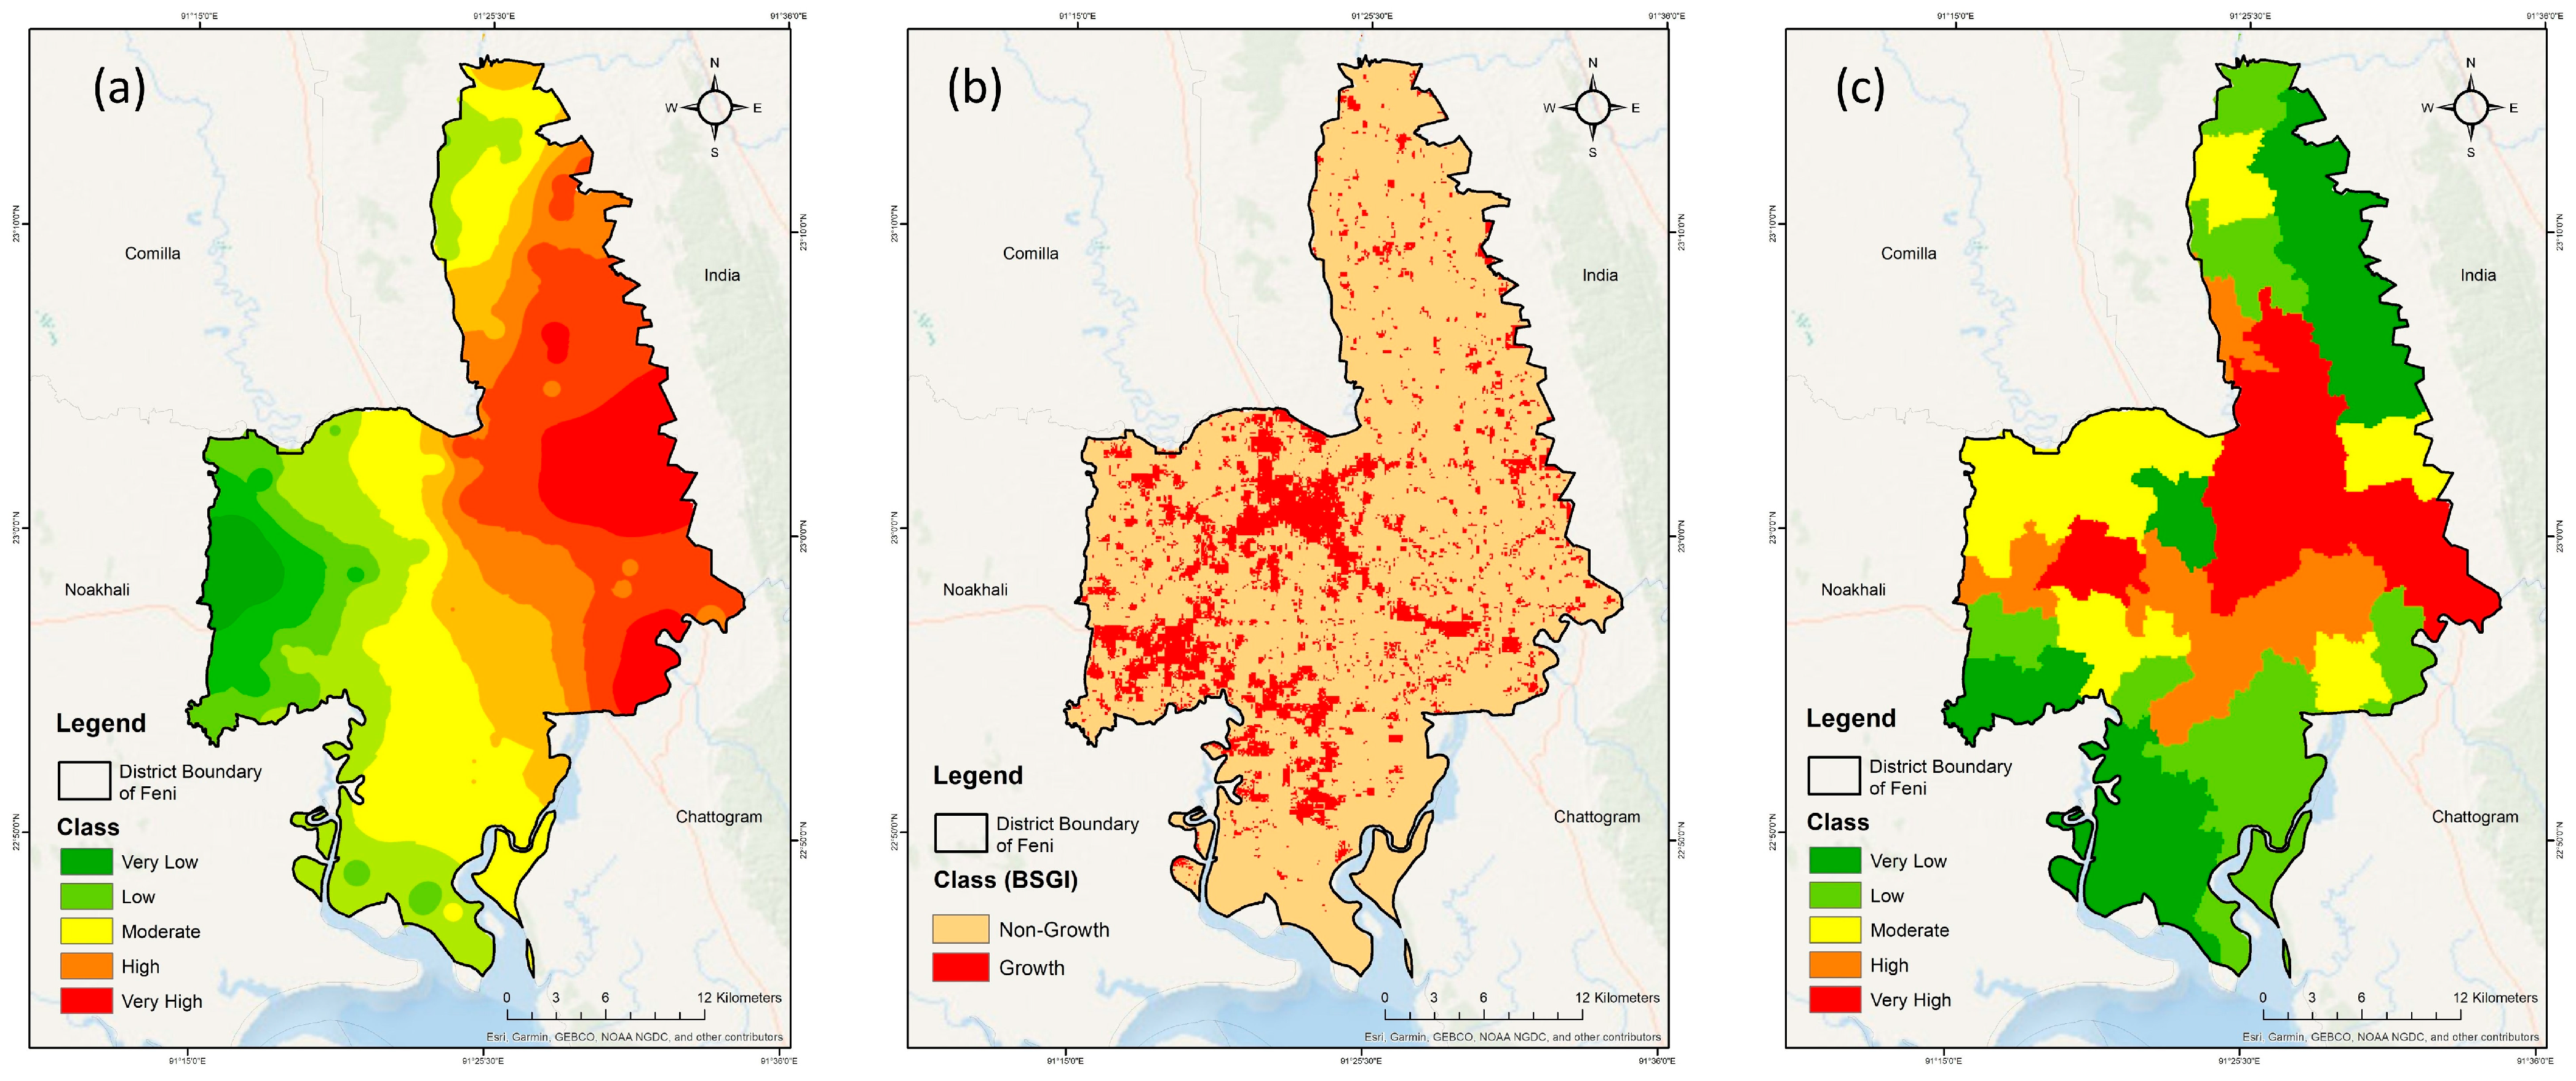
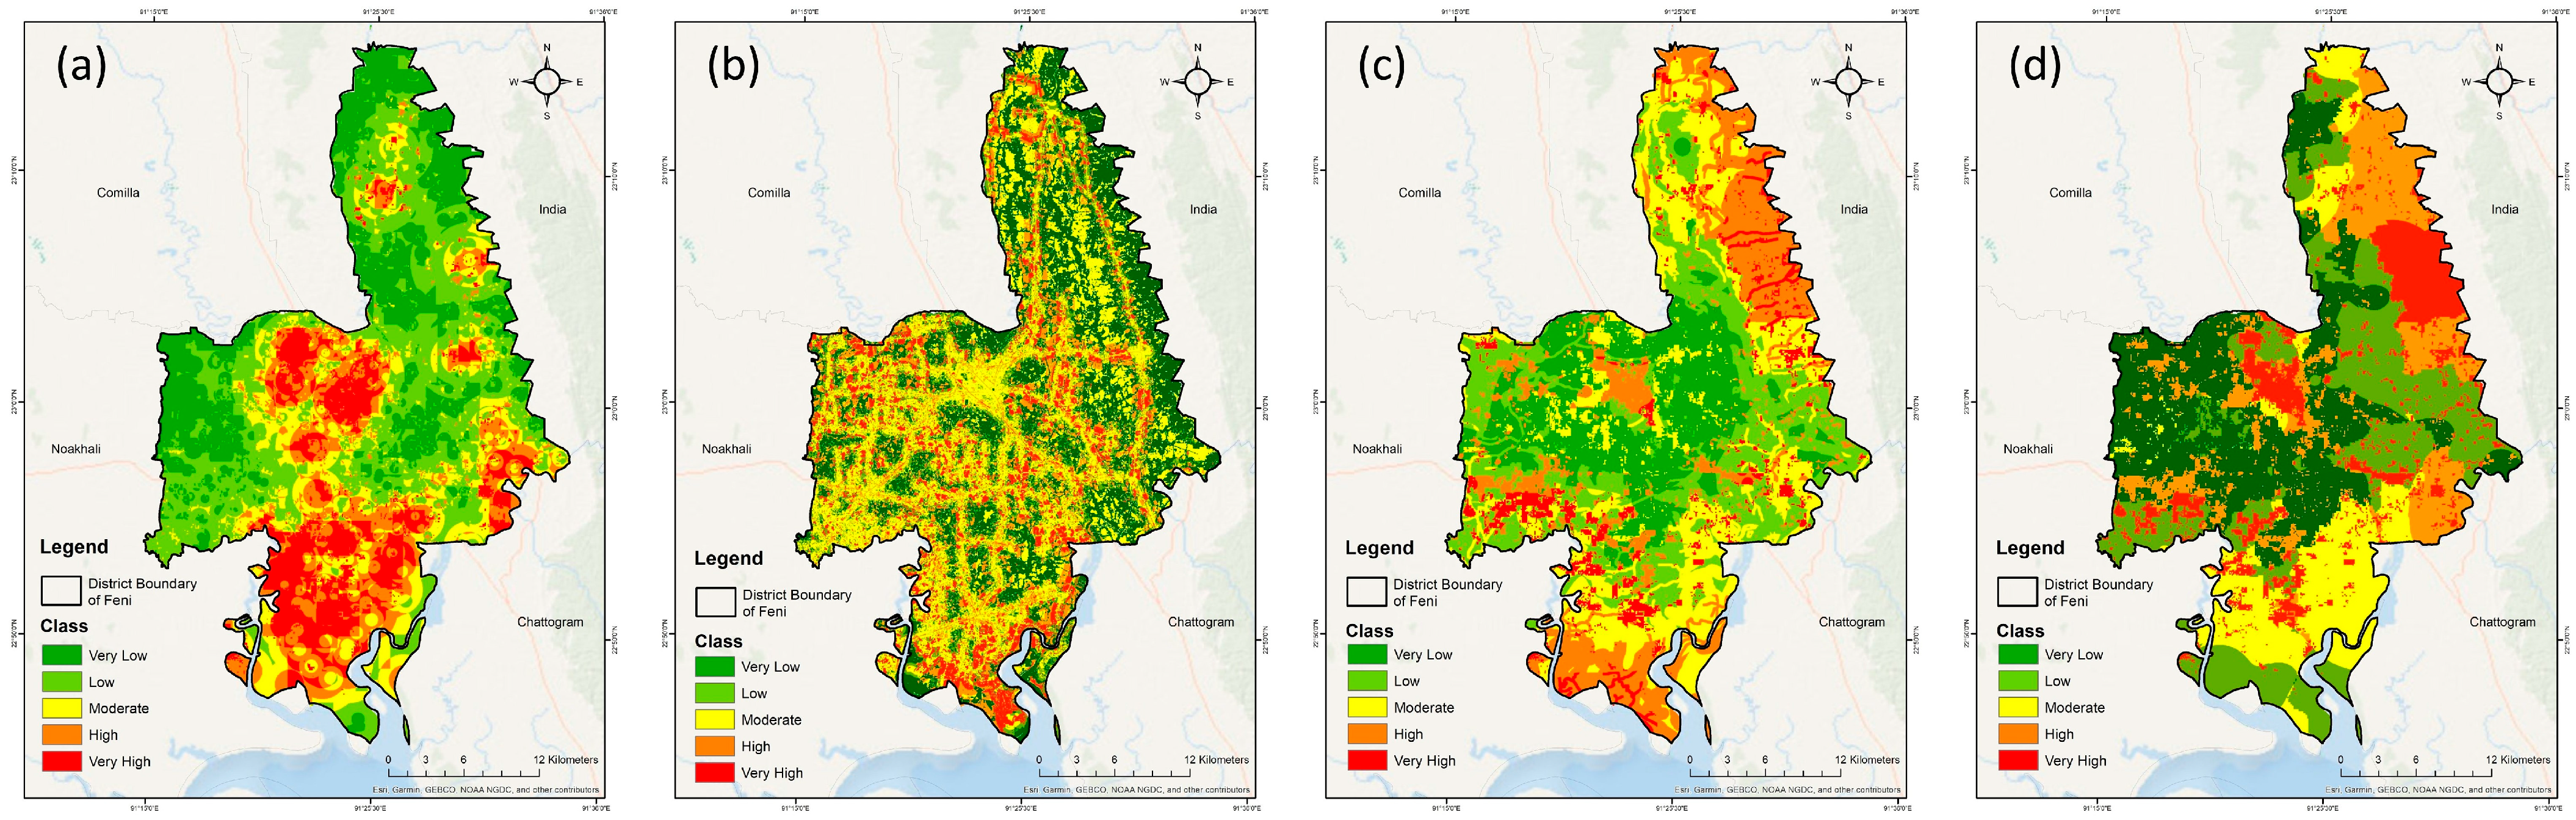
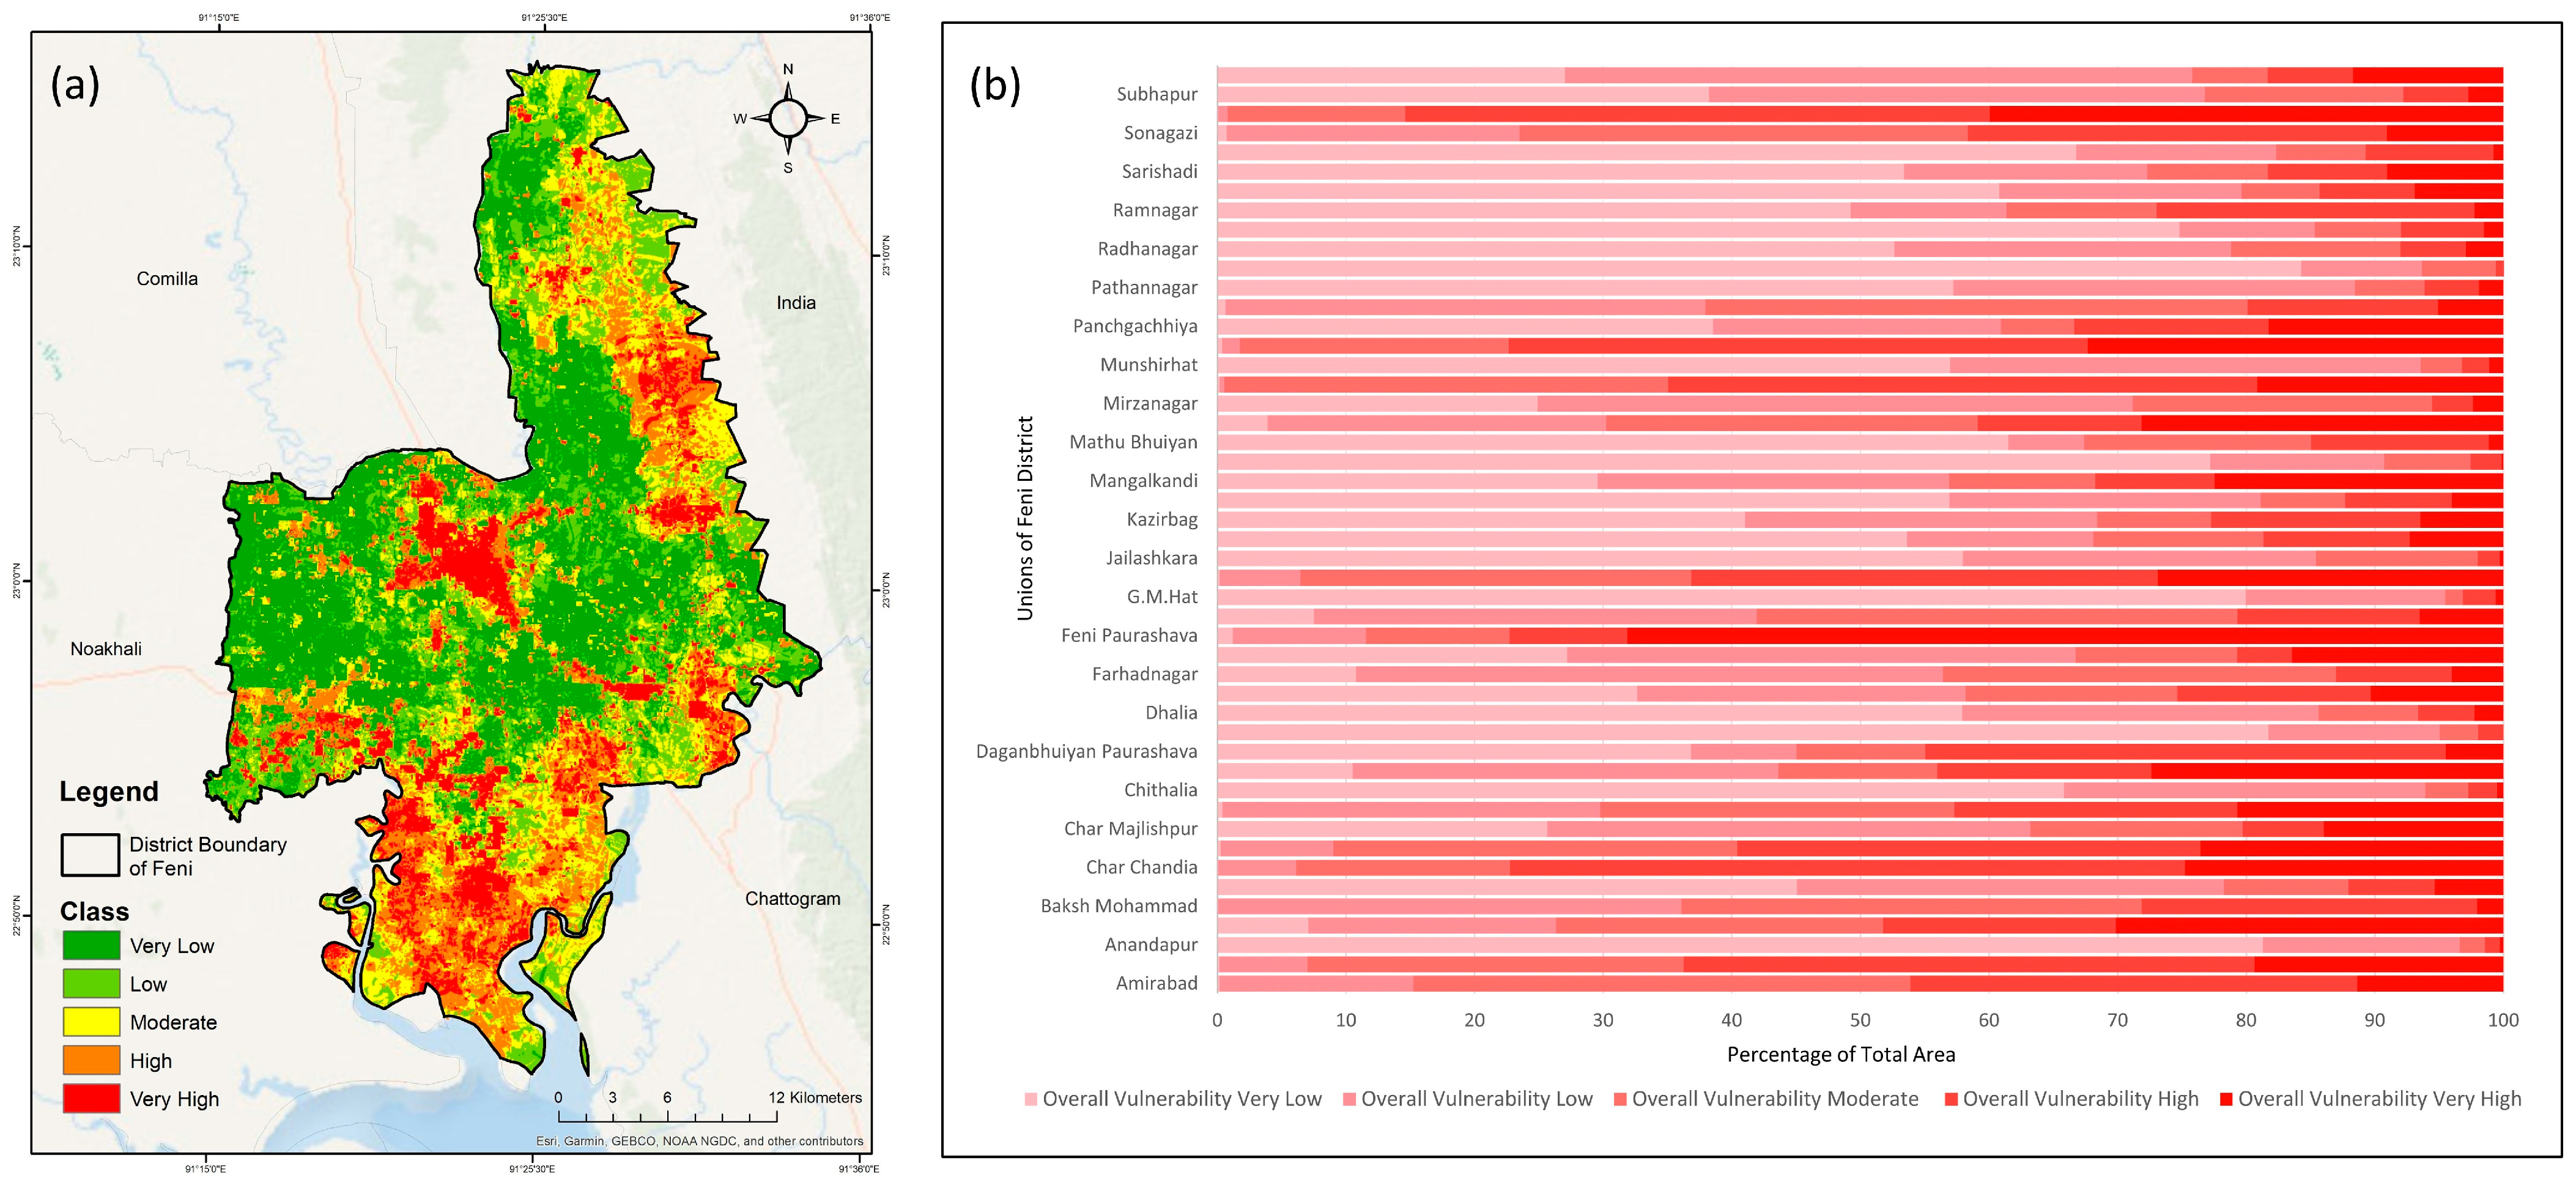
3.2. Spatial Distribution of Flash Flood Vulnerability

The spatial distribution of vulnerability in different dimensions for flash flooding in the Feni district highlights significant spatial variations across different vulnerability dimensions (Figure 7). These vulnerabilities have been classified into five categories: very low, low, moderate, high, and very high, offering a detailed understanding of how different unions (total 48) are impacted by flash floods (Figure 8).
The social vulnerability map (Figure 7a) and union breakdown (Figure 8a) reveal substantial differences in how unions are vulnerable to flash floods. In terms of very low social vulnerability, five unions stand out, with Mirzanagar showing the highest percentage (87.54%) of area classified as of very low vulnerability, followed by Sindurpur (73.23%), Purba Chandrapur (72.89%), Rajapur (71.07%), and Darbarpur (70.15%). These unions are relatively less at risk in terms of social dimension. Conversely, high vulnerability areas include Nawabpur (41.66%) and Dharmapur (37.21%), with Nawabpur appearing again in the very high vulnerability category (42.60%), alongside Mangalkandi (54.47%) and Sonagazi Paurashava (54.05%).
The physical vulnerability map (Figure 7b) and corresponding union analysis (Figure 8b) suggest a wide range of physical risks from flash floods. Mohamaya ranks highest for very low physical vulnerability with 55.22% of the area classified as such, followed by Amjadhat (54.86%), Baksh Mohammad (49.79%), and Subhapur (48.92%). These areas are less prone to physical infrastructure damage from flash flooding. However, moderate and high vulnerability levels are significantly seen in unions like Yakubpur (58.64%) and Char Chandia (51.92%), while Char Chandia also ranks highest for very high vulnerability, with 15.59% of its area classified under this risk category.
Economic vulnerability (Figure 8c) is distributed across various unions, with some regions being more economically vulnerable than others (Table S1). Baligaon leads, with 78.65% of its area showing very low vulnerability, suggesting that the economic impact of flash floods would be relatively minimal. Similarly, Kazirbag (74.82%) and Kalidah (72.04%) follow closely behind in this category. For higher vulnerability classes, unions like Amjadhat (80.61%) and Mohamaya (76.20%) are classified as highly vulnerable in terms of economic loss, reflecting significant risks to local economies during flash floods. Char Chandia stands out, with 33.10% of its area classified as of very high economic vulnerability, underscoring the financial risks posed by recurrent flooding.
Environmental vulnerability (Figure 8d) presents another crucial aspect of the study. Dhalia, with 86.86% of its area categorized as of very low vulnerability, emerges as one of the least environmentally vulnerable unions. Similar trends are seen in Purba Chandrapur (86.46%) and Rajapur (84.64%). At the higher end of the spectrum, Mohamaya is almost entirely categorized as very highly vulnerable, with 99.31% of its area under severe environmental threat. Amjadhat (79.02%) and Feni Paurashava (68.92%) also fall into this high-risk category, indicating areas where flash floods severely impact environmental stability.
The vulnerability to flash floods in the Feni district varies significantly across social, physical, economic, and environmental dimensions. The spatial distribution of vulnerability highlights critical areas that require targeted interventions to mitigate the risks posed by flash floods. Unions like Char Chandia and Nawabpur exhibit high vulnerability across multiple dimensions, while areas like Mirzanagar and Baligaon show relatively lower risks. This detailed vulnerability mapping offers a foundational basis for disaster management strategies aimed at reducing the impact of flash floods in Feni district.

3.3. Composite Flash Flood Vulnerability

The composite vulnerability map for Feni District integrates the four dimensions of vulnerability into a single, comprehensive assessment of flash flood vulnerability.
This map in Figure 9a illustrates the overall spatial distribution of vulnerability across the district, categorizing each region into five vulnerability classes. It provides an overview of areas at greatest vulnerability from flash floods, helping to guide disaster preparedness and response efforts.
Based on the results, approximately 30.19% of the district falls under the “very low” vulnerability category, reflecting areas with favorable physical, social, economic, and environmental conditions that reduce their susceptibility to floods. Around 22.21% of the district has “low” vulnerability, indicating relatively stable conditions but still some exposure to flood risks. Regions classified as having “moderate” vulnerability represent 18.35% of the district, while 17.26% of the area is considered to be at “high” risk. Finally, 11.99% of the district falls into the “very high” vulnerability category, highlighting regions where all four dimensions of vulnerability converge to create significant flood risks.

3.4. Assessment of Vulnerability Hotspots

The integration of all four vulnerability dimensions highlights several key vulnerability hotspots within the Feni District that demand immediate attention. According to Figure 9b, regions such as Bagadana, Sonagazi, and Nawabpur stand out, with substantial portions of their areas classified under “high” or “very high” vulnerability. For example, Bagadana shows a concerning 30.14% of its area classified as of “very high” vulnerability, signaling a significant vulnerability due to socio-economic and physical factors, such as low elevation and a lack of adequate flood defense infrastructure. Similarly, Sonagazi Paurashava faces extreme risks with 45.45% of its area classified as “high” vulnerability, along with an additional 39.96% categorized as “very high.” This combination of physical and economic challenges increases the area’s exposure to flood-related damages.
On the other hand, areas such as Anandapur emerge as significantly less vulnerable, with 81.29% of its region falling under the “very low” vulnerability classification. This was due to its favorable physical characteristics, having a higher elevation and low population density, complemented with more robust social and economic structures.
Overall, Sonagazi Paurashava, Bagadana, Feni Sadar, and Nawabpur have been marked as zones of high vulnerability emanating from high exposure levels to flash floods. These areas need to be given maximum priority in planning flood mitigation and disaster preparedness programs in order to reduce impacts.

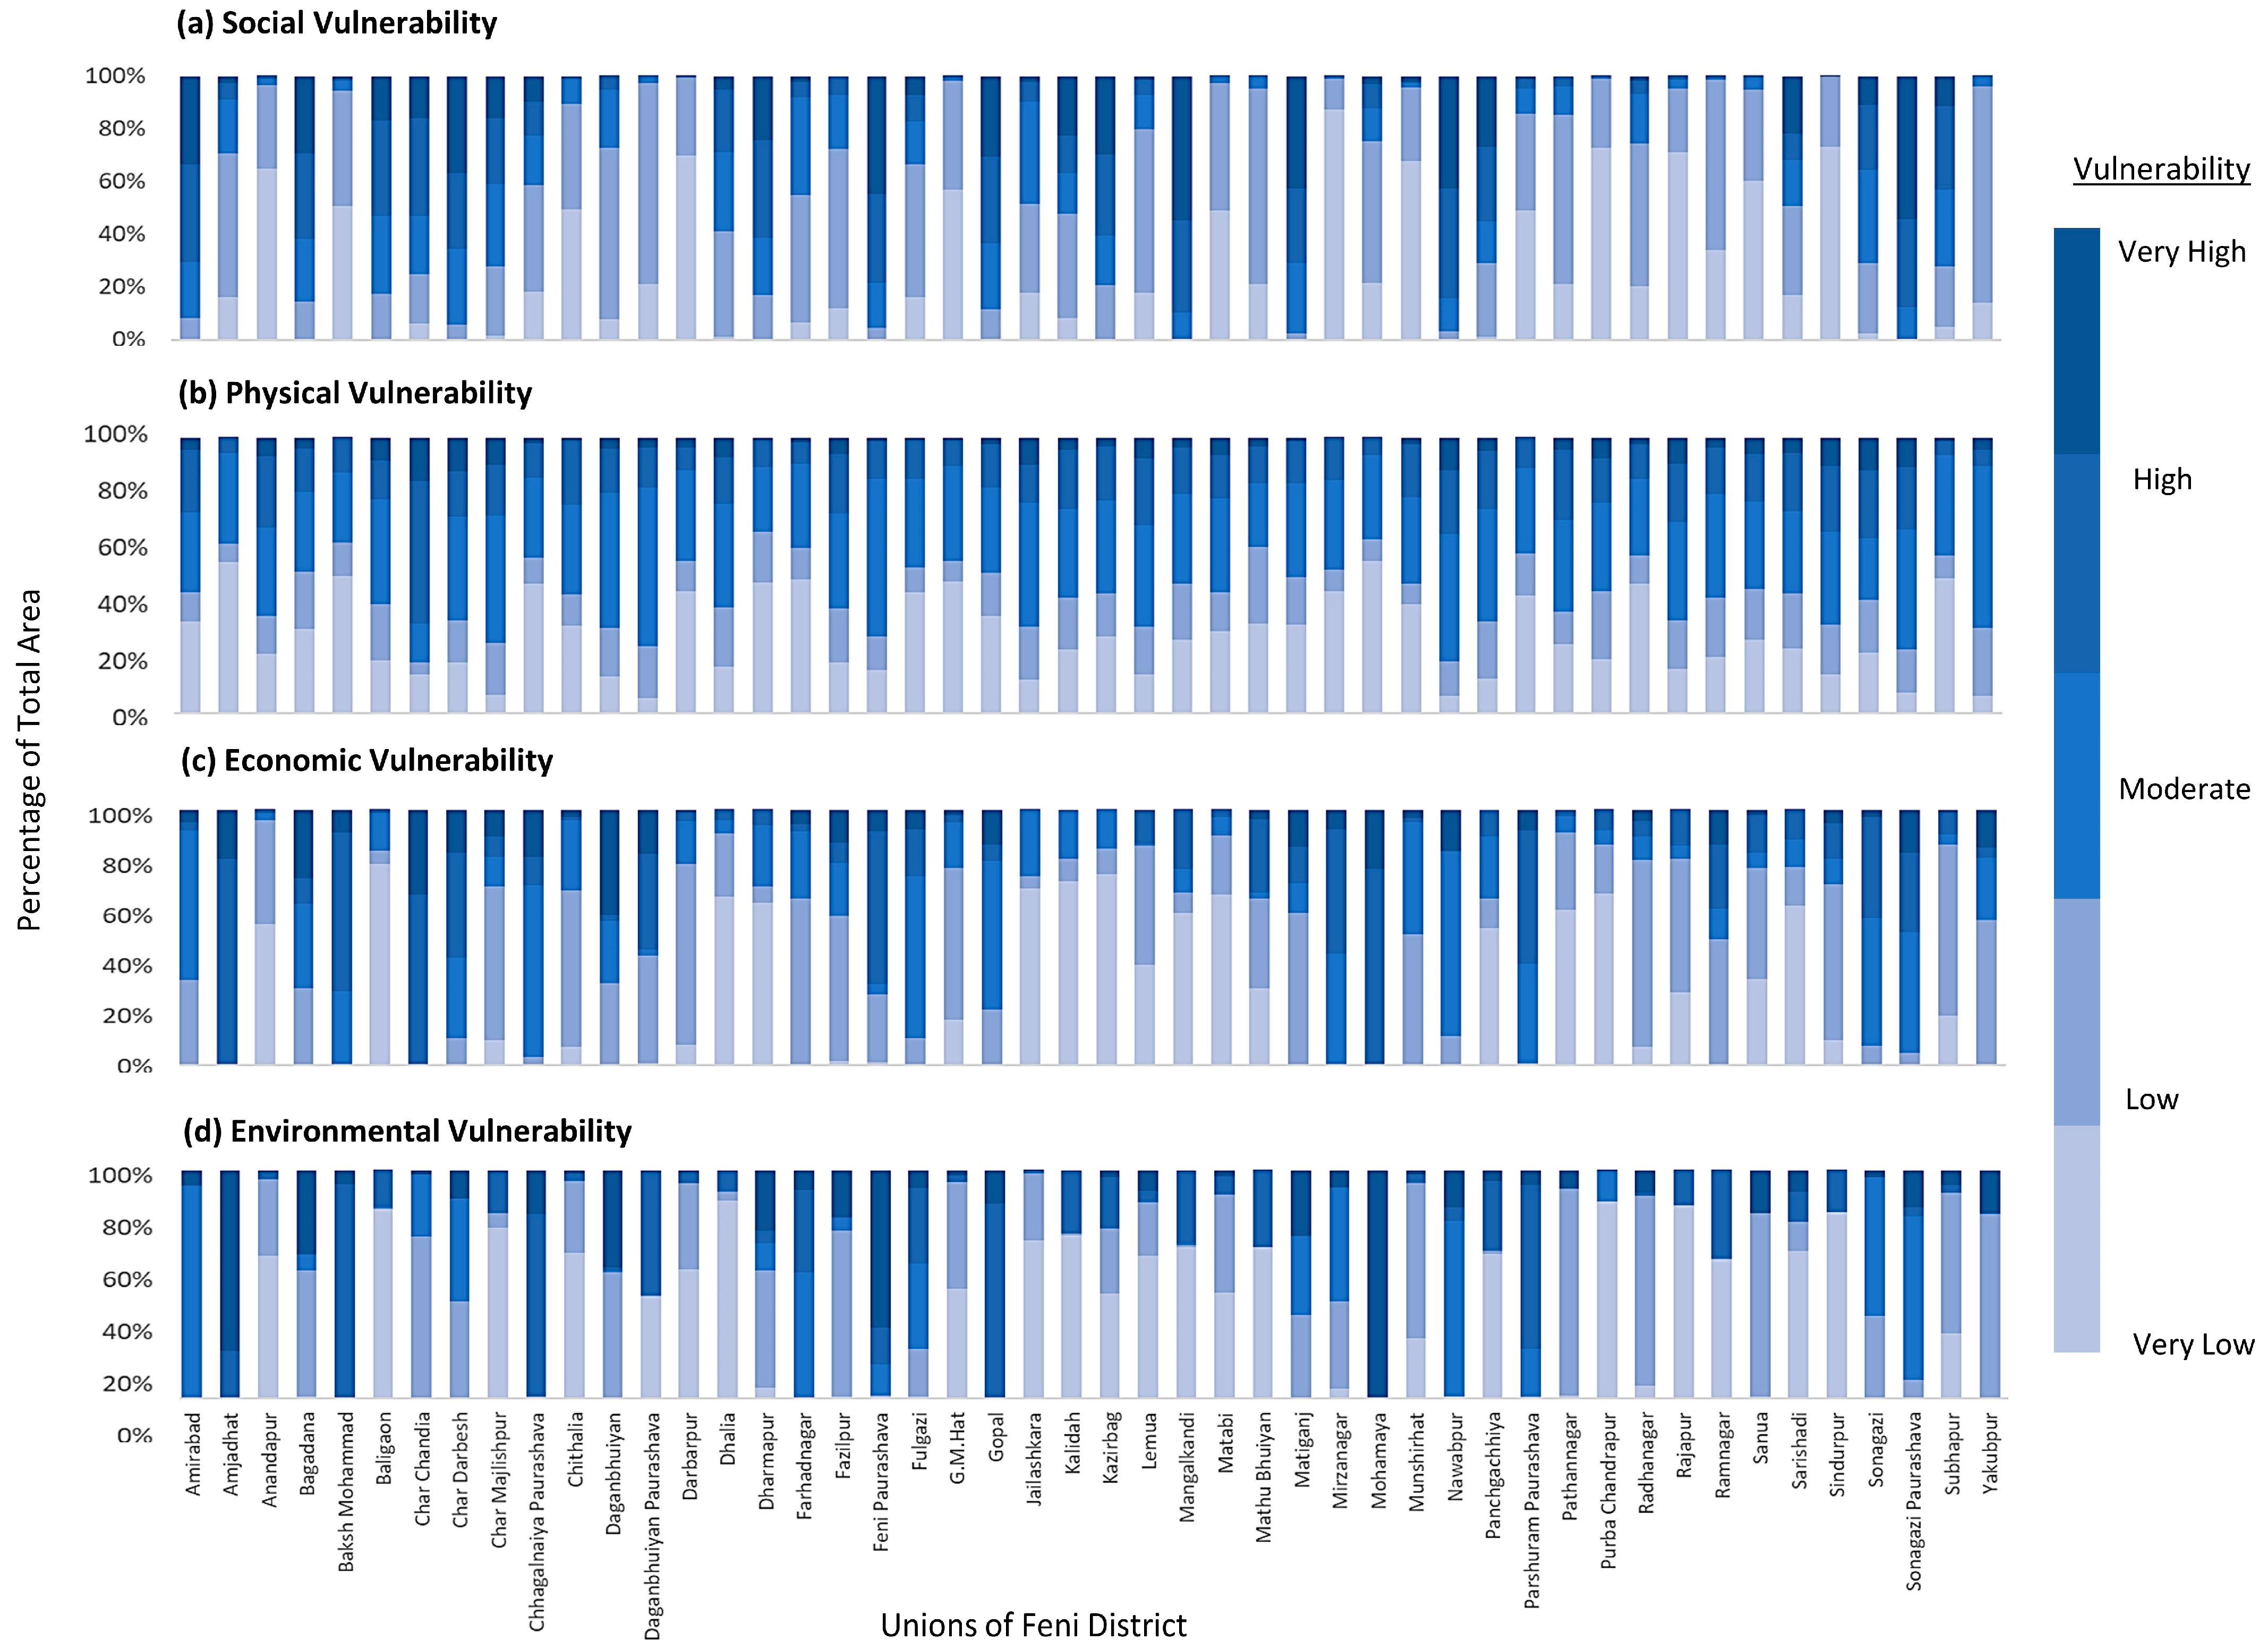
3.5. Comparison of Vulnerability Across Dimensions

When vulnerability is compared across the four dimensions, it becomes clear that various factors influence different sections of the Feni District. Social vulnerability predominates in certain contexts, whereas environmental or physical elements are more important in others.
In the case of Feni Sadar, one of the main causes of overall vulnerability is social vulnerability, which is caused by very high population density and higher population composition of the most vulnerable age groups. This is further aggravated by the economic vulnerability caused by high urbanization and the dominance of commercial as well as infrastructural developments in the area. There are also other physical causes, such as low altitude and inadequate drainage, which further increase the flood risk in this region.
On the other hand, in the union of Amirabad, physical vulnerability is less important but the economic environmental vulnerability is high, especially for urbanization and rainfall, so types of vulnerabilities are differently distributed. This indicates that there should be a focus on specific measures that will reduce the risks that come from the unique vulnerabilities of the region.
These dimensions of comparative vulnerability highlight the need for a more comprehensive approach to flood risk management. Economically and socially vulnerable regions, such as Feni Sadar and Sonagazi, should not only be supplied with infrastructural enhancements, but also with programs that will help manage the populations in these high-risk areas and improve communities, rather than just build walls to cage them in. On the contrary, regions such as Amirabad, where environment and physical aspects are the leading causes of vulnerability, need to focus on putting in place better water and land policies to control flooding effects. To sum up, the composite vulnerability assessment more comprehensively explains the flood risk in Feni District, focusing on the suitability of flood preparedness measures that respond to the vulnerabilities of specific regions within the district.

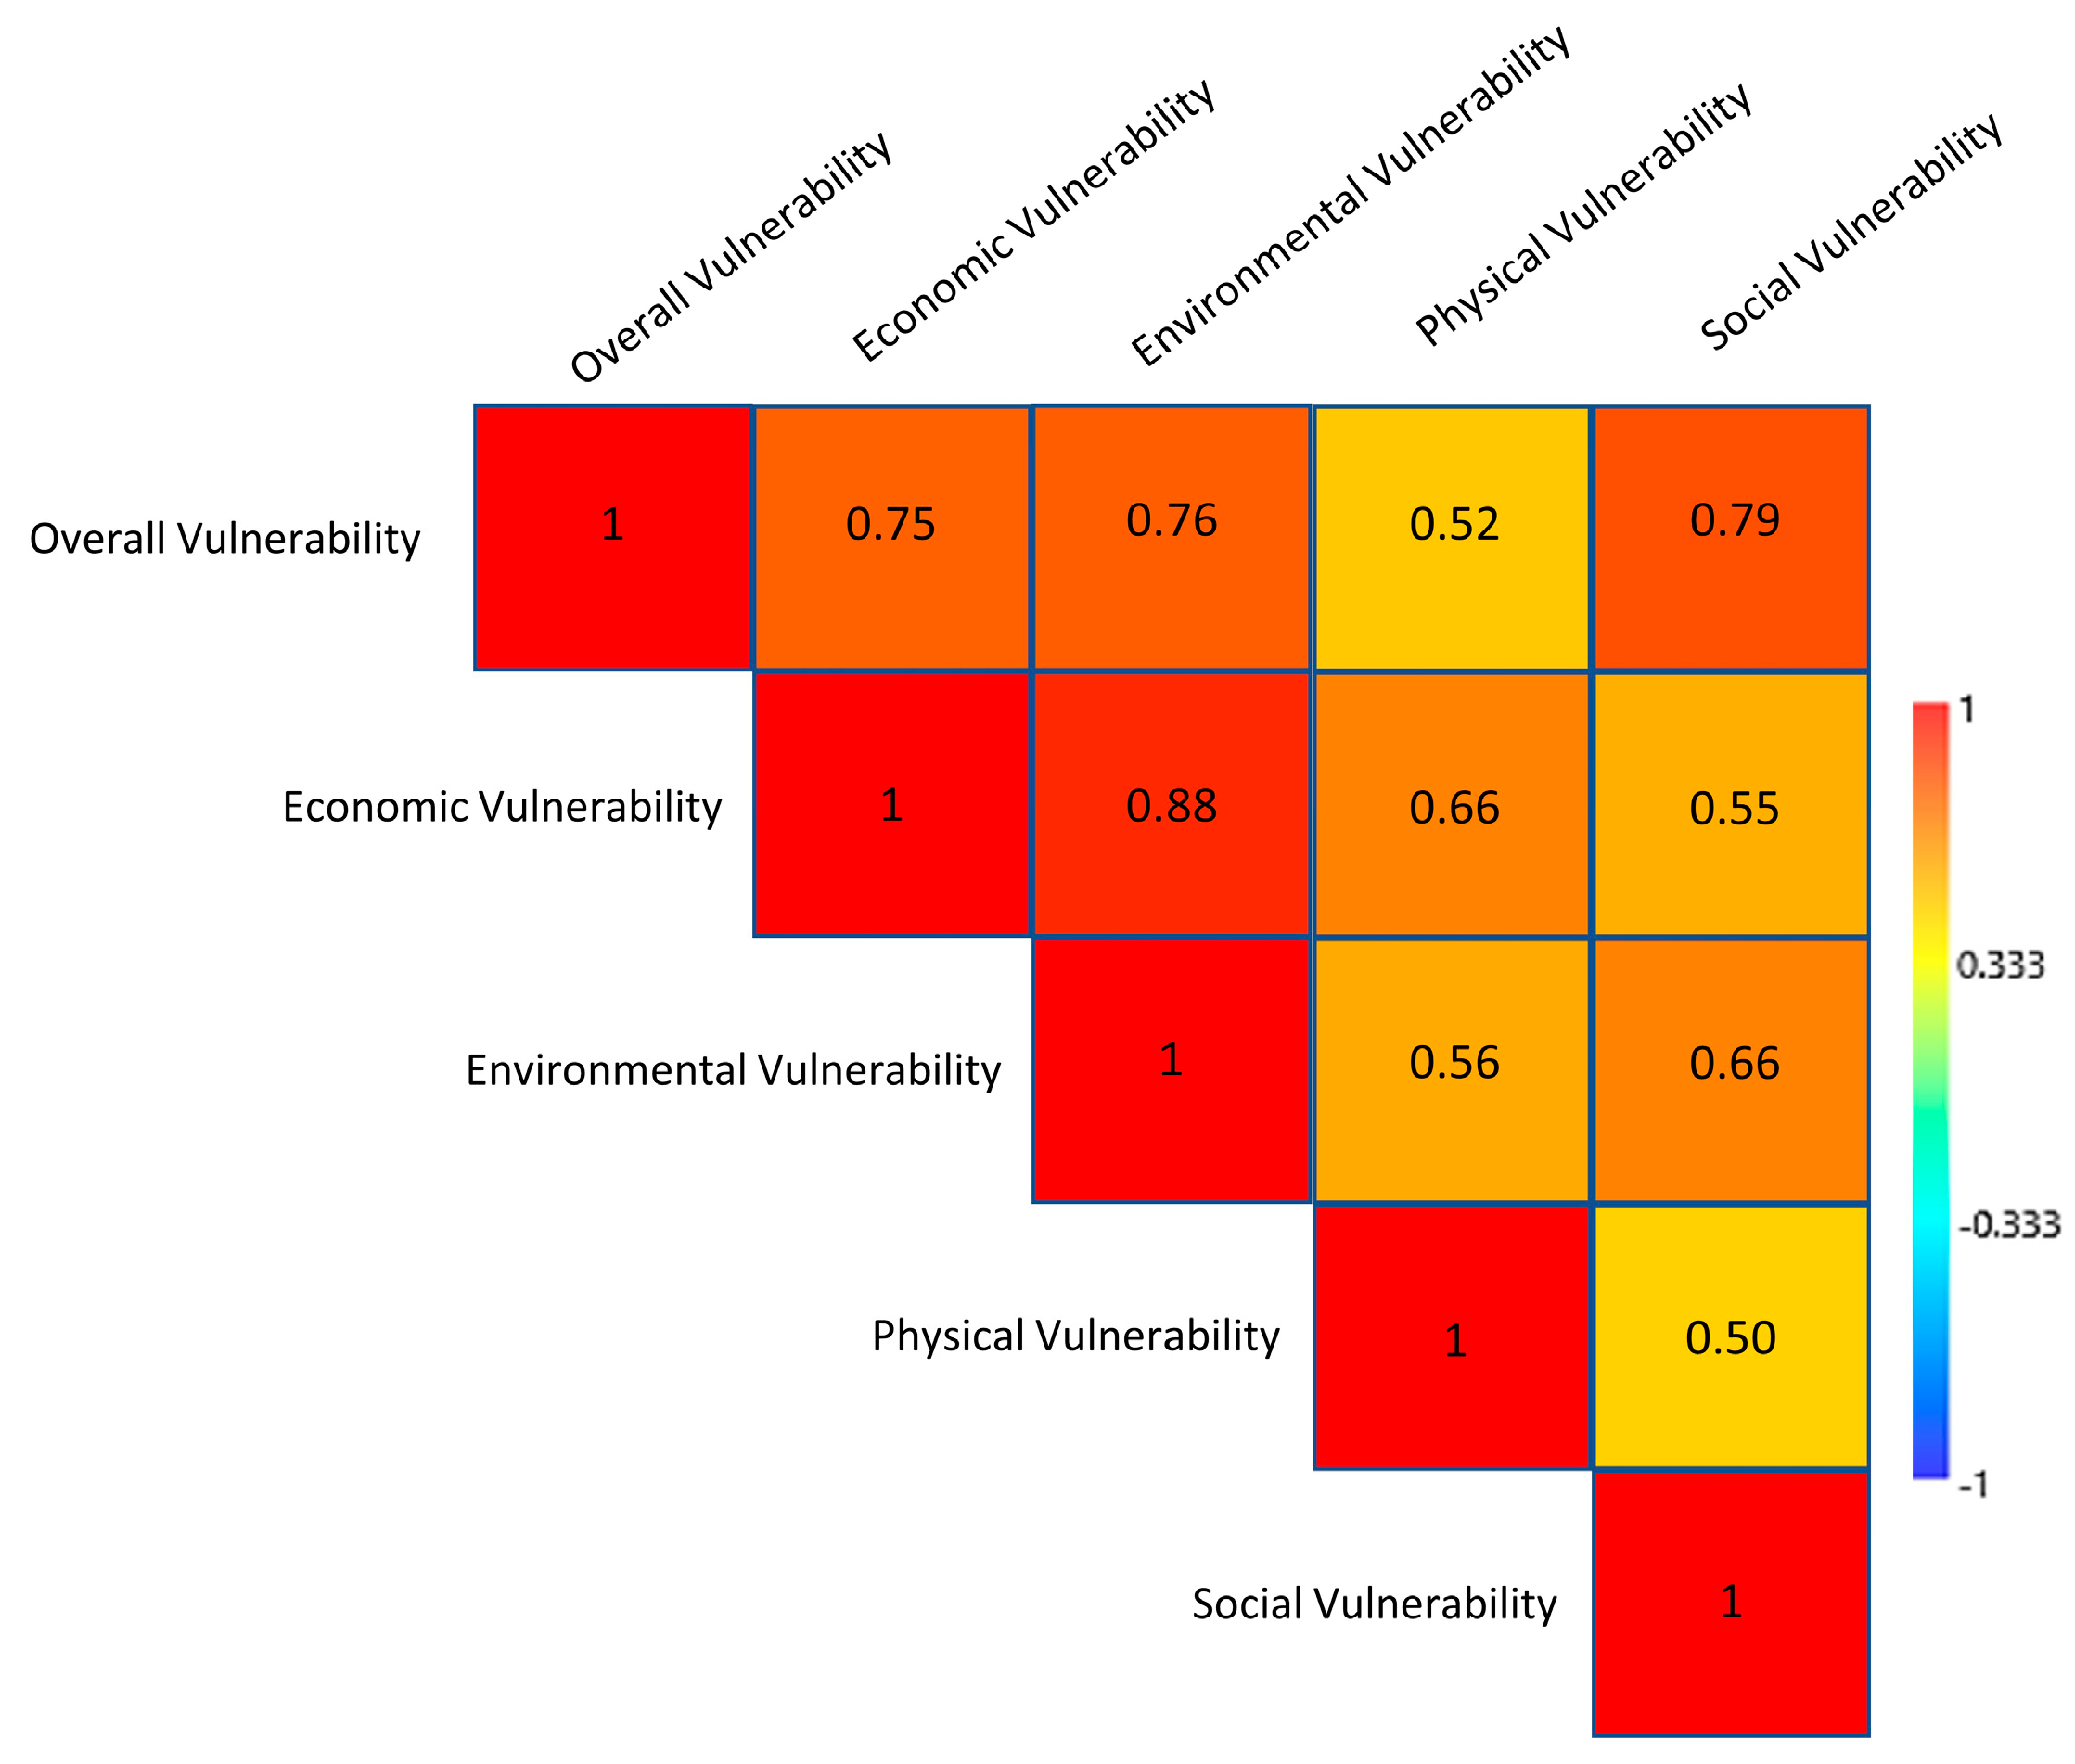
3.6. Correlation Between Vulnerability Dimensions

An in-depth statistical examination of the interdependence of social, physical, economic, and environmental vulnerabilities shows interesting aspects that enhance overall vulnerability (Figure 10). This study applied Pearson’s correlation coefficient (r), a statistical method, based on the linear relationship existing between the stated dimensions, taking values over the range −1 to 1, whereby 1 is a complete positive correlation, −1 is a total inversion correlation, while 0 means there is no relationship [14].
Figure 10 shows multiple strong relationships between dimensions. These correlations offer insightful information on the ways in which various dimensions interact to affect the district’s overall flood vulnerability. Overall vulnerability has strong positive correlations with most dimensions. The highest value of correlation coefficient between overall vulnerability and social vulnerability is 0.79. It can be inferred that the driving elements of Feni District’s overall flood vulnerability are predominantly social factors. Economic vulnerability also strongly correlates with overall vulnerability, with a coefficient of 0.75, which specifies that regions with high economic vulnerability face increased severity of impacts in the case of a flash flood. Similarly, the strong positive value for environmental vulnerability and overall vulnerability is 0.76. This evidence points to environmental influences as key determinants in setting an overall level of vulnerability within the district. Physical vulnerability correlations are more modest at 0.52, indicating that physical factors, though important, may be mitigated somewhat in certain areas by social and economic resilience.
Economic vulnerability is strongly correlated with environmental vulnerability at a coefficient of 0.88, which confirms that, indeed, regions with high economic risk, for instance, unemployment and rapid urbanization, tend to be more environmentally challenged, particularly those in areas with the highest rainfall, along with rapidly urbanizing areas. There are also moderate associations of economic vulnerability with both physical (0.66) and social vulnerability (0.55), underlining the interrelatedness of infrastructure issues, poor drainage, and low elevation in relation to socio-economic concerns, such as health care access and education. Similarly, environmental vulnerability also correlates strongly with economic vulnerability at 0.88 and is moderately related to physical vulnerability at 0.56, showing that those areas with poor drainage and generally low-lying topography carry both economic and environmental risk. It is also moderately correlated with social vulnerability, at 0.66. Physical vulnerability is strongly related to economic vulnerability, at 0.66, and to environmental vulnerability, at 0.56, but less so in the case of social vulnerability, at 0.50. Among these factors, social vulnerability is highly correlated with overall vulnerability and environmental vulnerability, whereas it is moderately correlated with economic vulnerability and is poorly correlated with physical vulnerability.

3.7. Detailed Validation Findings

In this work, Receiver Operating Characteristic (ROC) curve analysis was used for the validation of flood vulnerability assessment. Indeed, this is one of the most acknowledged methods for assessing performance in spatial models and has also been widely applied in flood risk assessments [48]. The assessed vulnerability in this study was compared against the actual flood occurrences data, derived from in-person responses using a questionnaire survey. A total number of 384 random survey points (using Cochran’s Formula [49]) were gathered, determined from the field within the study area. These points were overlaid with the generated overall vulnerability map, and values from the vulnerability layer extracted for every point.
The effectiveness of the vulnerability framework results for the occurrence of floods in these random places was then assessed using the ROC curve. A visual evaluation of the framework’s performance is made possible by this curve, which shows the sensitivity (true positive rate) versus 1- specificity (false positive rate) for various threshold values. From the ROC curve, as represented in Figure 11, the AUC value of the model is 0.86 (Table 4), falling within the “very good” category of the standard AUC classification [48].
The created vulnerability map, therefore, means that the overall vulnerability framework has a high assessment performance in identifying areas that are usually vulnerable to flooding. The ability to accurately assess flood-prone vulnerable areas allows local governments and disaster management organizations to identify high-risk areas and carry out focused measures to lessen the effects of upcoming floods.

4. Discussion

The spatial pattern of vulnerability in Feni District reflects high geographic variability within the district and is produced by the combined processes of social, economic, physical, and environmental factors. This supports the idea that vulnerability is context-specific and multi-scalar, which is more widely accepted in the literature on disaster risk. Prior studies [12,50] emphasize that vulnerability is the outcome of the dynamic interaction of different exposure, susceptibility, and resilience components. This is reflected in the vulnerability pattern, which shows that, across the district, vulnerability to flash floods is not uniform. Higher vulnerability occurs in certain areas where a set of dimensions combine, resulting in a higher level of vulnerability to flash flooding. The study found that the southern and central parts of the district are the most vulnerable, especially Feni Sadar and Sonagazi unions, which fall within high social vulnerability driven by population density and age-related factors, and also within highly economically vulnerable conditions resulting from rapid urbanization and unemployment. In addition, these regions are poorly settled physically because the elevation is low, and drainage systems are not well designed to reduce flood occurrences. This result is in line global studies like those of [51,52], which highlight that socioeconomic pressures and inadequate physical infrastructure create vulnerability hotspots, which are more likely to experience the effects of disasters.
The results of composite vulnerability analysis showed that nearly 30% of the district falls within a very low vulnerability class, mainly in the north, where higher elevation combined with better drainage systems and relatively low population densities brings the flood risk down. This is in line with the findings of [10,34], who highlighted the importance of infrastructure quality and natural topography in determining flood risk and mitigating potential.
On the other hand, about 12% of the district falls into a very high vulnerability category, indicating areas where all the social, economic, physical, and environmental factors coincide to raise flood susceptibility. Studies like [53] have noted this tendency and contend that multidimensional vulnerability frameworks provide a more accurate depiction of areas that are at risk, particularly in areas that are prone to flooding. These findings imply that the flood vulnerability of the Feni District is due to a complex interplay of natural and human-induced factors, with different regions more likely than others to incur flood risks associated with physical environmental and socio-economic attributes.
Policy and practice, especially with regard to flood vulnerability management in Feni District, will benefit greatly from the results of this study. Identifying flood vulnerability hotspots indicates the need for flood mitigation strategies in these specific areas. Therefore, local authorities and disaster management agencies should focus on these regions for the improvement of infrastructural facilities, particularly in the construction and improvement of drainage facilities and the extension of embankments for water runoff control. In areas at geographical risk, especially in the areas with a low topography where water tends to accumulate, the construction of flood-resistant structures, like roads above the flood level and flood walls, should be adopted in order to reduce physical vulnerability to flash floods.
Social interventions are equally important. As social vulnerability contributed significantly to the overall assessment of vulnerability, policies should be intended at augmenting health access, reducing population in flood-prone areas, and preparing communities for flood events which cannot be eliminated. Public education through disaster preparedness programs in regard to flood risks and the process of emergency response would thereby increase the resiliency of vulnerable populations. Construction of additional flood shelters in high-vulnerability areas would ensure safe evacuation options for populations at-risk during flood events.
From an economic point of view, the results highlight the addressing of unemployment and increasing resilience to economic vulnerability along flood-prone areas. Local authorities should consider policies promoting economic diversification and improvement in livelihood development which is resilient to floods, especially in areas where economic vulnerability is higher. Microfinance initiatives and disaster recovery loans can alleviate the financial burden on vulnerable households and help them recover more quickly from economic losses due to flooding.
Environmental interventions involve sustaining proper urban planning and land-use management to reduce environmental vulnerability. For instance, the nature of urban growth in flood-prone areas, the provision of green spaces that can absorb excess rainwater, and the implementation of building codes that require construction to protect against flooding should be addressed. Expanding the flood early warning system, integrated with outreach programs at the community level, will also ensure minimization of environmental vulnerability due to flash floods. Overall, these findings emphasize that integrated flood risk management needs to be addressed when considering the multidimensionality of flash flood vulnerability in Feni.
Although the present study provides valuable insight into flood vulnerability, it is highly important to recognize several limitations. First among these will be the availability and resolution of data. Using secondary data sources, like demographic information and land-use data at 30-m resolution, cannot precisely capture the micro-level situation at the district level, especially regarding rapidly changing urban areas. Furthermore, it is critical to acknowledge the inherent limits of Principal Component Analysis (PCA), despite the fact that it is a reliable technique for objectively assigning weights to indicators and decreasing dimensionality. PCA uses statistical variance to give weights, which may not accurately represent the intricate and sometimes nonlinear causal linkages among vulnerability indicators, while being effective at spotting patterns. This restriction is especially important for the social and environmental components, where contextual elements and qualitative subtleties are important.
Future research should use other techniques to supplement PCA results in order to lessen these problems. It is possible to confirm the vulnerability assessments and offer crucial context by including stakeholder viewpoints and expert opinion using field data gathering techniques, like questionnaires and interviews. By shedding light on the impact of individual variables outside of their statistical correlations, sensitivity analysis may further improve the robustness of the model. When combined, these strategies will make sure that the weighing process represents the intrinsic complexity of vulnerability dynamics and captures empirical linkages, resulting in a more thorough and contextually appropriate evaluation.

5. Conclusions

The present study is an overall assessment of flood vulnerability in the district of Feni by using an integrated geospatial approach, i.e. the integration of different factors that show multi-dimensional pathways through which different dimensions of vulnerability intersect with each other to create a diverse spatial pattern of vulnerability to floods.
Results show that flash flood vulnerability varied over space in Feni District, indicating a larger area of the southern and central parts, and most of Feni Sadar and Sonagazi, falling into a high vulnerability zone. These areas were characterized by high population density, rapid urbanization, and inadequate drainage infrastructure, hence their high susceptibility to flood impacts. In contrast, areas in the northern parts of this district, such as Parshuram and Anandapur, present much lower vulnerability relatively, due to favorable physical conditions along with a low order of social and economic pressures.
Some of the contributions that arise from this study involve using a multi-dimensional framework to conduct flood vulnerability assessment; therefore, it could provide a more holistic understanding of the various contributing factors associated with flash flood vulnerability. The results show that social vulnerability plays a leading role in shaping overall vulnerability in Feni District. This is followed by economic vulnerability, which perpetuates flood risks in urban areas. In addition, physical factors, such as elevation and drainage density, were also considerable variables that determined the degree of flood exposure, particularly in low-lying areas with inefficient infrastructure. At the same time, environmental vulnerability, which is conditioned by rainfall intensity and growth of urban agglomerations, was especially high in the southern parts of the district due to rapid urban development, resulting in a great increase in impervious surfaces and low resilience against flooding. The ROC curve analysis for the model validation showed that the reliability of the model was confirmed. An AUC score of 0.86 gave proof that the framework was highly effective in assessing flood-prone areas. The capability of identifying vulnerable areas with high accuracy based on multi-dimensional integration provides a strong tool for local authorities and disaster management agencies looking to enhance resilience against flood hazards.
These findings have many consequences for flood preparedness and mitigation strategies in the Feni District. Appropriate measures aimed at flood risk reduction, e.g., improving drainage systems as well as construction of flood resilient structures and provision of flood shelters, should be carried out more urgently in areas that have been marked as high risk, such as Feni Sadar and Sonagazi. The research has also indicated that most of the flood prone communities should be targeted for socio-economic initiatives that, for instance, aim at enhancing better health care services and creating jobs as a way of helping the communities deal with the effects of the floods.
In the same context, it is also worth noting that the outcomes point out the need for sustainable urbanization and land use restrictions, as the aforementioned aspects of environmental vulnerability to floods are determined mainly by human activities. Adoption of settling policies within the district that prevent further urban development in flood risk areas and encourages development of green infrastructure to improve water retention capacity is expected to significantly lower flood risks in the southern section of the district. It would also be important to put in place early warning systems and strata of disaster preparedness measures for the communities to enhance the ability of local populations to counter the threat posed by floods.
As a result, this study provides a solid framework for evaluating the Feni District’s flood vulnerability and practical insights for improving flood risk management in the area. The research offers a comprehensive study of flood risk by combining social, economic, physical, and environmental aspects. It also identifies the regions and characteristics that have the greatest impact on susceptibility. The results emphasize the necessity of a multifaceted strategy for flood preparedness, integrating environmental, socioeconomic, and infrastructure enhancements to lessen the district’s total flood susceptibility.

Supplementary Materials

The following supporting information can be downloaded at: https://www.mdpi.com/article/10.3390/ijgi14050194/s1, The additional material, which was submitted to MDPI with the manuscript, contains the following supporting documents, which can be downloaded, Figure S1: Components of Social Flash Flood Vulnerability Assessment: (a) Exposure, (b) Susceptibility, (c) Resilience; (d) Social Vulnerability due to flash flood; Figure S2: Components of Physical Flash Flood Vulnerability Assessment: (a) Exposure, (b) Susceptibility, (c) Resilience; (d) Physical Vulnerability due to flash flood; Figure S3: Components of Economic Flash Flood Vulnerability Assessment: (a) Exposure, (b) Susceptibility, (c) Resilience; (d) Economic Vulnerability due to flash flood; Figure S4: Components of Environmental Flash Flood Vulnerability Assessment: (a) Exposure, (b) Susceptibility, (c) Resilience; (d) Environmental Vulnerability due to flash flood; Table S1: Union-Wise Breakdown of Vulnerability in Feni District.

Author Contributions

Conceptualization, Sajib Sarker and Israt Jahan; methodology, Sajib Sarker; field investigation, Sajib Sarker; data preparation, Sajib Sarker and Israt Jahan; formal analysis, Sajib Sarker and Israt Jahan; original draft preparation, Sajib Sarker and Abul Azad; review and editing, Sajib Sarker, Xin Wang and Abul Azad; visualization, Sajib Sarker; supervision, Israt Jahan and Abul Azad. All authors have read and agreed to the published version of the manuscript.

Funding

This research received no specific grant from any funding agency in the public, commercial, or nonprofit sectors.

Institutional Review Board Statement

Not applicable.

Informed Consent Statement

Not applicable.

Data Availability Statement

The original data presented in the study are openly available at the following links provided in Table 1.

Acknowledgments

All authors are grateful for the logistic support from the Department of Urban and Regional Planning, Chittagong University of Engineering and Technology (CUET), and Department of Geomatics Engineering, University of Calgary for conducting the survey and research. Their appreciation extends to different authorities for their kind support in providing the relevant spatial data. Special thanks go to all of the survey respondents for providing their valuable insights and information.

Conflicts of Interest

The authors declare no conflicts of interest.

References

  1. Riaz, R.; Mohiuddin, M.D. Application of GIS-Based Multi-Criteria Decision Analysis of Hydro-Geomorphological Factors for Flash Flood Susceptibility Mapping in Bangladesh. Water Cycle 2024, 6, 13–27. [Google Scholar] [CrossRef]
  2. Coleman, N.; Clarke, A.; Esparza, M.; Mostafavi, A. Analyzing Common Social and Physical Features of Flash-Flood Vulnerability in Urban Areas. Int. J. Disaster Risk Reduct. 2025, 105437. [Google Scholar] [CrossRef]
  3. Hasan, M.M.; Islam, M.N. Effectiveness of Flood Early Warning for the Jamuna Char-Dwellers at Sirajganj District in Bangladesh. Prog. Disaster Sci. 2024, 24, 100373. [Google Scholar] [CrossRef]
  4. Islam, R.; Chowdhury, P. Local-Scale Flash Flood Susceptibility Assessment in Northeastern Bangladesh Using Machine Learning Algorithms. Environ. Chall. 2024, 14, 100833. [Google Scholar] [CrossRef]
  5. Flooding in Eastern Bangladesh (Feni, Comilla, Noakhali, Habiganj, Moulvibazar, Khagracchari and Rangamati), Briefing Note—24/08/2024—Bangladesh|ReliefWeb. Available online: https://reliefweb.int/report/bangladesh/flooding-eastern-bangladesh-feni-comilla-noakhali-habiganj-moulvibazar-khagracchari-and-rangamati-briefing-note-24082024 (accessed on 3 October 2024).
  6. Flood in Feni. Available online: https://www.thedailystar.net/tags/flood-feni (accessed on 3 October 2024).
  7. Ibrahim, A.; Salifu, A.-H.; Peprah, C. Does Governance Matter When Disaster Looms? Zooming into Proactive Institutional Measures for Flood Risk Management. Int. J. Disaster Risk Reduct. 2023, 97, 104021. [Google Scholar] [CrossRef]
  8. De Majo, V. Institutional Conditions for Building Proactive Flood Management: Lessons from Santa Fe in Argentina. Int. J. Disaster Risk Reduct. 2022, 81, 103251. [Google Scholar] [CrossRef]
  9. Forte, G.; De Falco, M.; Santo, A.; Gautam, D.; Santangelo, N. Flash Flood Impacts and Vulnerability Mapping at Catchment Scale: Insights from Southern Apennines. Eng. Geol. 2025, 350, 107988. [Google Scholar] [CrossRef]
  10. Al-Rawas, G.; Nikoo, M.R.; Al-Wardy, M. A Review on the Prevention and Control of Flash Flood Hazards on a Global Scale: Early Warning Systems, Vulnerability Assessment, Environmental, and Public Health Burden. Int. J. Disaster Risk Reduct. 2024, 115, 105024. [Google Scholar] [CrossRef]
  11. Jerin, T.; Azad, M.A.K.; Khan, M.N. Climate Change-Triggered Vulnerability Assessment of the Flood-Prone Communities in Bangladesh: A Gender Perspective. Int. J. Disaster Risk Reduct. 2023, 95, 103851. [Google Scholar] [CrossRef]
  12. Measuring Vulnerability to Natural Hazards: Towards Disaster Resilient Societies, 2nd ed.; Birkmann, J., Ed.; United Nations University Press: Tokyo, Japan, 2013; ISBN 978-92-808-1202-2. [Google Scholar]
  13. Dewan, T.H. Societal Impacts and Vulnerability to Floods in Bangladesh and Nepal. Weather Clim. Extrem. 2015, 7, 36–42. [Google Scholar] [CrossRef]
  14. Sarker, S.; Adnan, M.S.G. Evaluating Multi-Hazard Risk Associated with Tropical Cyclones Using the Fuzzy Analytic Hierarchy Process Model. Nat. Hazards Res. 2024, 4, 97–109. [Google Scholar] [CrossRef]
  15. Flood Vulnerability Index, FVI. Available online: http://www.unesco-ihe-fvi.org/ (accessed on 3 October 2024).
  16. He, X.; Fang, Y.; Wang, B.; Huang, X. Towards a Verifiable, Uncertainty-Controlled Assessment of the Spatiotemporal Dynamics of Social Vulnerability to Flash Floods. Ecol. Indic. 2024, 166, 112323. [Google Scholar] [CrossRef]
  17. Abd-Elaty, I.; Kuriqi, A.; Pugliese, L.; Zelenakova, M.; El Shinawi, A. Mitigation of Urban Waterlogging from Flash Floods Hazards in Vulnerable Watersheds. J. Hydrol. Reg. Stud. 2023, 47, 101429. [Google Scholar] [CrossRef]
  18. Thakur, D.A.; Mohanty, M.P. A Synergistic Approach towards Understanding Flood Risks over Coastal Multi-Hazard Environments: Appraisal of Bivariate Flood Risk Mapping through Flood Hazard, and Socio-Economic-Cum-Physical Vulnerability Dimensions. Sci. Total Environ. 2023, 901, 166423. [Google Scholar] [CrossRef] [PubMed]
  19. Rumpa, N.T.; Real, H.R.K.; Razi, M.A. Disaster Risk Reduction in Bangladesh: A Comparison of Three Major Floods for Assessing Progress towards Resilience. Int. J. Disaster Risk Reduct. 2023, 97, 104047. [Google Scholar] [CrossRef]
  20. Bhuiya, A.; Yasmin, S.; Mustafa, M.G.; Shaikh, M.A.A.; Saima, J.; Moniruzzaman, M.; Kabir, M.H. Spatiotemporal Distribution, Ecological Risk Assessment, and Human Health Implications of Currently Used Pesticide (CUP) Residues in the Surface Water of Feni River, Bangladesh. Sci. Total Environ. 2024, 944, 173857. [Google Scholar] [CrossRef]
  21. Murshed, S.; Griffin, A.L.; Islam, M.A.; Oliver, T.; Wang, X.H.; Paull, D.J. A Framework for Appraising the Status of Disaster Resilience within the Multi-Hazard Environment of Coastal Bangladesh. Int. J. Disaster Risk Reduct. 2024, 113, 104832. [Google Scholar] [CrossRef]
  22. Lapietra, I.; Colacicco, R.; Capolongo, D.; La Salandra, M.; Rinaldi, A.; Dellino, P. Unveiling Social Vulnerability to Natural Hazards in the EEA and UK: A Systematic Review with Insights for Enhanced Emergency Planning and Risk Reduction. Int. J. Disaster Risk Reduct. 2024, 108, 104507. [Google Scholar] [CrossRef]
  23. Uddin, M.J.; Hasan, M.M.; Eisenreich, S.J.; Quevauviller, P. Strengthening Pluvial Flood Risk Management in the Southeast Region of Bangladesh: Lessons Learnt from the EU Policy and Practice. Environ. Process. 2019, 6, 859–881. [Google Scholar] [CrossRef]
  24. Islam, F.; Parvin, A.; Parvin, A.; Akhtar, U.S.; Ali Shaikh, M.A.; Uddin, M.N.; Moniruzzaman, M.; Saha, B.; Khanom, J.; Suchi, P.D.; et al. Sediment-Bound Hazardous Trace Metals(Oid) in South-Eastern Drainage System of Bangladesh: First Assessment on Human Health. Heliyon 2023, 9, e20040. [Google Scholar] [CrossRef]
  25. Rashid, M.B. Monitoring of Drainage System and Waterlogging Area in the Human-Induced Ganges-Brahmaputra Tidal Delta Plain of Bangladesh Using MNDWI Index. Heliyon 2023, 9, e17412. [Google Scholar] [CrossRef] [PubMed]
  26. Bangladesh: Eastern Flash Floods 2024 Situation Report No. 02 (As of 30 August 2024)—Bangladesh. ReliefWeb. Available online: https://reliefweb.int/report/bangladesh/bangladesh-eastern-flash-floods-2024-situation-report-no-02-30-august-2024 (accessed on 3 October 2024).
  27. UNICEF. Bangladesh Situation Report No. 1 (Flash Floods in Northern and Southeastern Regions) 27 August 2024—Bangladesh. ReliefWeb. Available online: https://reliefweb.int/report/bangladesh/unicef-bangladesh-situation-report-no-1-flash-floods-northern-and-southeastern-regions-27-august-2024 (accessed on 3 October 2024).
  28. Officials: Flood Caused Loss of 500C in Feni. Available online: https://www.dhakatribune.com/bangladesh/nation/357531/feni-officials-estimate-losses-from-flood-amount (accessed on 3 October 2024).
  29. Zhang, Y.; Li, Z.; Xu, H.; Ge, W.; Qian, H.; Li, J.; Sun, H.; Zhang, H.; Jiao, Y. Impact of Floods on the Environment: A Review of Indicators, Influencing Factors, and Evaluation Methods. Sci. Total Environ. 2024, 951, 175683. [Google Scholar] [CrossRef] [PubMed]
  30. Rouhanizadeh, B.; Safapour, E. A MAP-Based Approach to Identify the Social Vulnerability to Flood Hazard in States Adjacent to Mexican Gulf. Int. J. Disaster Risk Reduct. 2024, 111, 104717. [Google Scholar] [CrossRef]
  31. Chen, G.; Hou, J.; Liu, Y.; Li, X.; Qiao, X.; Li, D. Study on the Sensitivity of Urban Inundation and Watershed Flood Simulation to Rainfall Data Spatial Resolution. Urban Clim. 2024, 57, 102125. [Google Scholar] [CrossRef]
  32. Wang, J.; Liu, L. Analysis on Slope Stability by Anchorage Based on Soil Creep with Flood Effect. Heliyon 2024, 10, e37126. [Google Scholar] [CrossRef]
  33. Meng, H.; Hu, S.; Yang, Y.; Chen, G.; Chi, W.; Cheng, K.; Liu, T. Quantitative Understanding of the Impact of Flooding Durations on Cd Variations in an Acidic Paddy Soil during the Flooding and Drainage Processes. Soil Secur. 2023, 13, 100114. [Google Scholar] [CrossRef]
  34. Gallina, V.; Torresan, S.; Critto, A.; Sperotto, A.; Glade, T.; Marcomini, A. A Review of Multi-Risk Methodologies for Natural Hazards: Consequences and Challenges for a Climate Change Impact Assessment. J. Environ. Manag. 2016, 168, 123–132. [Google Scholar] [CrossRef]
  35. Stoorvogel, M.M.; van Belzen, J.; Temmerman, S.; Wiesebron, L.E.; Fivash, G.S.; van IJzerloo, L.; van de Koppel, J.; Bouma, T.J. Salt Marshes for Nature-Based Flood Defense: Sediment Type, Drainage, and Vegetation Drive the Development of Strong Sediment Beds. Ecol. Eng. 2024, 207, 107335. [Google Scholar] [CrossRef]
  36. Sarkar, D.; Mondal, P. Flood Vulnerability Mapping Using Frequency Ratio (FR) Model: A Case Study on Kulik River Basin, Indo-Bangladesh Barind Region. Appl. Water Sci. 2020, 10, 17. [Google Scholar] [CrossRef]
  37. Akhter, S.; Rahman, M.M.; Monir, M.M. Flood Susceptibility Analysis to Sustainable Development Using MCDA and Support Vector Machine Models by GIS in the Selected Area of the Teesta River Floodplain, Bangladesh. HydroResearch 2025, 8, 127–138. [Google Scholar] [CrossRef]
  38. Rahman, M.A.; Alam, M.S.; Sultana, R.; Sultana, R. Assessing the Interrelationship between Monsoon Flood Disasters and Major Crop Production in Bangladesh. Int. J. Disaster Risk Reduct. 2025, 121, 105401. [Google Scholar] [CrossRef]
  39. Bucherie, A.; Hultquist, C.; Adamo, S.; Neely, C.; Ayala, F.; Bazo, J.; Kruczkiewicz, A. A Comparison of Social Vulnerability Indices Specific to Flooding in Ecuador: Principal Component Analysis (PCA) and Expert Knowledge. Int. J. Disaster Risk Reduct. 2022, 73, 102897. [Google Scholar] [CrossRef]
  40. Shojaeian, A.; Shafizadeh-Moghadam, H.; Sharafati, A.; Shahabi, H. Extreme Flash Flood Susceptibility Mapping Using a Novel PCA-Based Model Stacking Approach. Adv. Space Res. 2024. [Google Scholar] [CrossRef]
  41. de Costa, A.P.; Choren, R.; de Pereira, D.A.M.; Terra, A.V.; de Costa, I.P.A.; de Junior, C.S.R.; dos Santos, M.; Gomes, C.F.S.; Moreira, M.Â.L. Integrating Multicriteria Decision Making and Principal Component Analysis: A Systematic Literature Review. Cogent Eng. 2024, 11, 2374944. [Google Scholar] [CrossRef]
  42. Tu, J.-C.; Tu, Y.-W.; Wang, T.-R. An Investigation of the Effects of Infographics and Green Messages on the Environmental Attitudes of Taiwanese Online Shoppers. Sustainability 2018, 10, 3993. [Google Scholar] [CrossRef]
  43. Dugger, Z.; Halverson, G.; McCrory, B.; Claudio, D. Principal Component Analysis in MCDM: An Exercise in Pilot Selection. Expert Syst. Appl. 2022, 188, 115984. [Google Scholar] [CrossRef]
  44. Islam, M.A.; Khadem, M.M.R.K. Productivity Determinants in Oman Construction Industry. IJPQM 2013, 12, 426. [Google Scholar] [CrossRef]
  45. Mokarram, M.; Akbarian Ronizi, S.R.; Negahban, S. Optimizing Biomass Energy Production in the Southern Region of Iran: A Deterministic MCDM and Machine Learning Approach in GIS. Energy Policy 2024, 195, 114350. [Google Scholar] [CrossRef]
  46. Yang, Z.; Huang, W.; McKenzie, J.E.; Yu, P.; Wu, Y.; Xu, R.; Ye, T.; Ju, K.; Zhang, Y.; Huang, Y.; et al. The Association of Adverse Birth Outcomes with Flood Exposure before and during Pregnancy in Australia: A Cohort Study. Lancet Planet. Health 2024, 8, e554–e563. [Google Scholar] [CrossRef]
  47. Wang, Y.; Zhang, P.; Xie, Y.; Chen, L.; Cai, Y. Machine Learning Insights into the Evolution of Flood Resilience: A Synthesized Framework Study. J. Hydrol. 2024, 643, 131991. [Google Scholar] [CrossRef]
  48. Airola, A.; Pahikkala, T.; Waegeman, W.; De Baets, B.; Salakoski, T. An Experimental Comparison of Cross-Validation Techniques for Estimating the Area under the ROC Curve. Comput. Stat. Data Anal. 2011, 55, 1828–1844. [Google Scholar] [CrossRef]
  49. Sample Size in Statistics (How to Find It): Excel, Cochran’s Formula, General Tips. Available online: https://www.statisticshowto.com/probability-and-statistics/find-sample-size/ (accessed on 3 October 2024).
  50. Islam, M.M.; Ujiie, K.; Noguchi, R.; Ahamed, T. Flash Flood-Induced Vulnerability and Need Assessment of Wetlands Using Remote Sensing, GIS, and Econometric Models. Remote Sens. Appl. Soc. Environ. 2022, 25, 100692. [Google Scholar] [CrossRef]
  51. Singh, G.; Pandey, A. Flash Flood Vulnerability Assessment and Zonation through an Integrated Approach in the Upper Ganga Basin of the Northwest Himalayan Region in Uttarakhand. Int. J. Disaster Risk Reduct. 2021, 66, 102573. [Google Scholar] [CrossRef]
  52. Yang, W.; Xu, K.; Ma, C.; Lian, J.; Jiang, X.; Zhou, Y.; Bin, L. A Novel Multi-Objective Optimization Framework to Allocate Support Funds for Flash Flood Reduction Based on Multiple Vulnerability Assessment. J. Hydrol. 2021, 603, 127144. [Google Scholar] [CrossRef]
  53. Papathoma-Köhle, M.; Promper, C.; Glade, T. A Common Methodology for Risk Assessment and Mapping of Climate Change Related Hazards—Implications for Climate Change Adaptation Policies. Climate 2016, 4, 8. [Google Scholar] [CrossRef]
Figure 1. Geographical Location and Extent of the Study Area.
Ijgi 14 00194 g001
Figure 2. Variables under exposure: (a) Density of population; (b) Density of vulnerable age group; Resilience: (c) Distance from shelter; Susceptibility: (d) Literacy rate; (e) Distance from healthcare facilities; (f) Rate of poverty.
Ijgi 14 00194 g002
Figure 3. Variables under exposure: (a) Slope; (b) Elevation; (c) LULC; (d) Drainage density; (e) Geology; (f) Soil type; Susceptibility: (g) Previous flood extent; Resilience: (h) Access to road.
Ijgi 14 00194 g003
Figure 4. Variables under exposure: (a) Urbanized area; (b) Contact with river; Susceptibility: (c) Unemployment; Resilience: (d) Recovery time to flood.
Ijgi 14 00194 g004
Figure 5. Variables under exposure: (a) Rainfall intensity; Susceptibility: (b) Urban Growth (Build Settlement Growth Index); Resilience: (c) Recovery time after flood.
Ijgi 14 00194 g005
Figure 6. Methodological Workflow Diagram of the Research Process.
Ijgi 14 00194 g006
Figure 7. Spatial Analysis of Vulnerability in Feni District, Bangladesh: (a) Social Vulnerability, (b) Physical Vulnerability, (c) Economic Vulnerability, (d) Environmental Vulnerability.
Ijgi 14 00194 g007
Figure 8. Union-Wise Breakdown of Vulnerability in Feni District, Bangladesh: (a) Social Vulnerability, (b) Physical Vulnerability, (c) Economic Vulnerability, (d) Environmental Vulnerability.
Ijgi 14 00194 g008
Figure 9. (a) Composite vulnerability map for Feni District, (b) Union wise distribution of the overall flash flood vulnerability for Feni District.
Ijgi 14 00194 g009
Figure 10. Correlation between overall vulnerability and its dimensions.
Ijgi 14 00194 g010
Figure 11. ROC curve: the trade-off between sensitivity and 1-specificity.
Ijgi 14 00194 g011
Table 1. Description of various variables related to different vulnerability indicators.
VariablesFormat DescriptionSource
Population DensityGridded dataPeople number in each grid cell.WorldPop
https://dataforgood.facebook.com/dfg/tools/high-resolution-population-density-maps (accessed on 26 January 2025)”
Vulnerable age groupGridded dataThe number of vulnerable individuals in each grid cell (male or female, aged < 15 or >65).Age and sex structure Index
data from WorldPop “https://hub.worldpop.org/project/categories?id=8 (accessed on 26 January 2025)”
EducationGridded dataNumber of educational establishments in each grid cell.Humanitarian Data Exchange “https://data.humdata.org/ (accessed on 26 January 2025)”
Healthcare facilityMap (geographical location)The Euclidean distance between the current healthcare facilities.
PovertyGridded dataValue of the wealth index for each grid cell.Wealth Index data
https://hub.worldpop.org/geodata/summary?id=1274 (accessed on 26 January 2025)”
ShelterMap (geographical location)Euclidean distance to the shelters that are in place.GeoDASH “http://data.gov.bd/dataset/geodash/resource/808b3ae3-d1f5-4f1e-ae3c-3a360400a9e3 (accessed on 26 January 2025)”
SlopeGridded dataComputed with the DEM.Estimated from DEM
ElevationGridded dataA spatially resolved digital elevation model (DEM) at 30 m.
Land use/land coverGridded dataWhether a land cover type is a built-up area or not is indicated by each grid cell.Esri Global Land Cover Map “https://livingatlas.arcgis.com/landcover/ (accessed on 26 January 2025)”
Drainage densityGridded dataCalculated with the DEM.Estimated from DEM
GeologyMap of polygon featureA number of geologic maps were taken in support of the 2000 World Petroleum Assessment (DDS60), providing almost worldwide coverage of coarse resolution surface geology.https://www.usgs.gov/centers/central-energy-resources-science-center/science/world-geologic-maps (accessed on 26 January 2025)”
Soil typesGridded dataFAO soil maps and databases refer to data and maps compiled using field surveys backed up by remote sensing.Food and Agriculture Organization (FAO) “https://data.apps.fao.org/map/catalog/srv/eng/catalog.search#/home (accessed on 26 January 2025)”
Previous Flood ExtentGridded dataCoverage of flood in 2024 flood eventEstimated from Sentinel 1 Image Processing in GE
Access to RoadsGridded dataEuclidean distance to the current roadway system.Derived from OpenStreetMap “https://www.openstreetmap.org/#map=7/23.721/90.351 (accessed on 26 January 2025)”
Rainfall IntensityGridded dataDaily precipitation data from 2017 to 2024.Precipitation Data “https://power.larc.nasa.gov/ (accessed on 26 January 2025)”
Urban growthGridded dataAnnually modeling built-settlements between remotely-sensed observations using relative changes in subnational populations and lights at nightWorldPop Urban change “https://hub.worldpop.org/project/categories?id=7(accessed on 26 January 2025)”
Recovery time to floodsGridded dataRecovery from flood event occured in 2024Estimated from Sentinel 1 Image Processing in GE
Urbanized AreaGridded dataEach grid cell indicates whether the land cover type is a built-up area or not.Esri Global Land Cover Map “https://livingatlas.arcgis.com/Landcover/(accessed on 26 January 2025)”
Contact with RiverGridded dataEuclidean distance from the riversEstimated from LGED river shapefile
UnemploymentGridded dataDensity estimation of unemployed populationGlobal Assessment Report (GAR) on disaster risk reduction 2015 dataset by UNISDR
http://surl.li/fjcril (accessed on 26 January 2025)”
Table 2. Data Adequacy Confirmation Test Result.
TestValueMeaning
Kaiser–Meyer–Olkin Sampling Adequacy Measure0.86Regarded as good (>0.7). This implies that factor analysis may be performed on the data.
Bartlett’s Sphericity TestSig.0.00Bartlett’s Test of Sphericity is significant (p < 0.001), demonstrating the presence of correlations in the dataset suitable for factor analysis.
Table 3. Assigning Weights to Indicators.
FactorsIndicatorsVariablesFinal Weights for Each Criterion
Social VulnerabilityExposurePopulation Density56.74
Vulnerable age group43.26
SusceptibilityEducation39.42
Healthcare facility26.4
Poverty34.19
ResilienceShelter100
Physical vulnerabilityExposureSlope11.23
Elevation20.11
Land use/landcover28.32
Drainage density13.62
Geology17.71
Soil types9
SusceptibilityPrevious Flood Extent100
ResilienceAccess to Roads100
Environmental VulnerabilityExposureRainfall Intensity100
SusceptibilityUrban growth100
ResilienceRecovery time to floods100
Economic vulnerabilityExposureUrbanized Area76.45
Contact with River23.55
SusceptibilityUnemployment100
ResilienceRecovery time to floods100
Table 4. AUC Score.
Table 4. AUC Score.
Area Under the Curve
Test Result Variable(s)Scores
0.86
Test QualityVery Good
Disclaimer/Publisher’s Note: The statements, opinions and data contained in all publications are solely those of the individual author(s) and contributor(s) and not of MDPI and/or the editor(s). MDPI and/or the editor(s) disclaim responsibility for any injury to people or property resulting from any ideas, methods, instructions or products referred to in the content.

