Article

Vulnerability Identification and Cascading Failure Spatiotemporal Patterns on Road Network under the Rainstorm Disaster

1
Key Laboratory of Geospatial Technology for the Middle and Lower Yellow River Regions (Henan University), Ministry of Education, Kaifeng 475004, China
2
College of Geography and Environmental Science, Henan University, Kaifeng 475004, China
3
Henan Industrial Technology Academy of Spatiotemporal Big Data, Henan University, Zhengzhou 450046, China
4
Henan Technology Innovation Center of Spatiotemporal Big Data, Henan University, Zhengzhou 450046, China
5
Urban Big Data Institute, Henan University, Kaifeng 475004, China
*
Author to whom correspondence should be addressed.
ISPRS Int. J. Geo-Inf. 2022, 11(11), 564; https://doi.org/10.3390/ijgi11110564
Submission received: 25 August 2022 / Revised: 20 October 2022 / Accepted: 31 October 2022 / Published: 9 November 2022
(This article belongs to the Special Issue Urban Geospatial Analytics Based on Crowdsourced Data)

Abstract

:
Road vulnerability is crucial for enhancing the robustness of urban road networks and urban resilience. In medium or large cities, road failures in the face of unexpected events, such as heavy rainfall, can affect regional traffic efficiency and operational stability, which can cause high economic losses in severe cases. Conventional studies of road cascading failures under unexpected events focus on dynamic traffic flow, but the significant drop in traffic flow caused by urban flooding does not accurately reflect road load changes. Meanwhile, limited studies analyze the spatiotemporal pattern of cascading failure of urban road networks under real rainstorms and the correlation of this pattern with road vulnerability. In this study, road vulnerability is calculated using a network’s global efficiency measures to identify locations of high and low road vulnerability. Using the between centrality as a measure of road load, the spatiotemporal patterns of road network cascading failure during a real rainstorm are analyzed. The spatial association between road network vulnerability and cascading failure is then investigated. It has been determined that 90.09% of the roads in Zhengzhou city have a vulnerability of less than one, indicating a substantial degree of spatial heterogeneity. The vulnerability of roads adjacent to the city ring roads and city center is often lower, which has a significant impact on the global network’s efficiency. In contrast, road vulnerability is greater in areas located on the urban periphery, which has little effect on the global network’s efficiency. Five hot spots and three cold spots of road vulnerability are identified by using spatial autocorrelation analysis. The cascading failure of a road network exhibits varied associational characteristics in distinct clusters of road vulnerability. Road cascading failure has a very minor influence on the network in hot spots but is more likely to cause widespread traffic congestion or disruption in cold spots. These findings can help stakeholders adopt more targeted policies and strategies in urban planning and disaster emergency management to build more resilient cities and promote sustainable urban development.

1. Introduction

Assessing the vulnerability of infrastructure to rainstorm disasters has become an increasing concern in the context of global changes leading to the continuous occurrence of extreme climate events [1,2,3,4]. As a vital part of urban infrastructure, urban road networks are crucial for urban transportation [5,6]. Because of their nature as physical networks composed of nodes (road intersections) and edges (road segments), road networks exhibit complex network properties such as robustness and vulnerability. Unexpected events (such as traffic accidents and road damage) occurring on a road network lead to traffic congestion, thereby increasing the road load and decreasing the overall traffic efficiency within the corresponding spatial region. This congestion has time evolution characteristics, initially affects only small local areas, and spreads in the road network if not relieved in time. The failure of a node or an edge may cause the failure of other nodes or edges, leading to a cascading effect, which may generate large-scale traffic congestion and severely affect urban traffic [7,8,9]. Identifying the spatial distribution of urban road vulnerability and analyzing the spatiotemporal characteristics of urban road network cascading failure are crucial for enhancing the robustness of urban road networks and urban resilience.
Road vulnerability is susceptibility to events that may lead to substantial degradation of road network services [10,11]. With rapid urbanization worldwide, identifying urban road vulnerability has become a focus of attention in transportation and geography studies, including different analysis methods and research perspectives [1,12]. In transportation studies, the traffic flow in a road network has been taken as research subject to analyze the impact of a sudden increase in urban traffic flow on vehicle traffic [13,14,15] and to discuss the influence of different traffic signal timing schemes on road traffic efficiency [16,17,18]. From the perspective of complex networks, urban road network models have been constructed by different network modeling methods, and the statistical characteristics of the network have been comparatively analyzed [19,20,21]. Road network robustness can be divided into static and dynamic robustness, depending on whether the dynamic characteristics of the network are considered, and the time-varying characteristics of urban road network robustness [22,23,24] and the response characteristics of the road network after an attack are analyzed [25,26]. Using a local world evolution network model, Sun built network instances transitioning from an exponential distribution to a power-law distribution [27] and then examined how the network responded to random and intentional attacks. The network built using the local priority connection mechanism maintained the robustness of the scale-free network against random attacks and made highly connected nodes more secure against intentional attacks. Taking the public transportation networks of 14 large cities as examples, Ferber et al. found that most of the public transportation networks are scale-free networks with small-world characteristics. This means that in a large-scale network, the distance between any two nodes is short; that is, in a public transportation network, any two nodes can interoperate with a short connection distance [28,29]. They also compared the effects of random failures on the public transportation networks in London and Paris. Latora et al. proposed a method for analyzing the small-world characteristics of a network, and empirically analyzed the Boston subway network with relatively low local efficiency and high global efficiency [30]. From the perspective of spatial distribution, identifying vulnerable areas of urban road networks by using vulnerability indicators helps clarify these networks’ spatial distribution patterns and improves the robustness of urban road networks [31,32].
In recent years, cascading failures in complex networks have attracted extensive attention. By defining a load-capacity cascading failure model, networks with a highly heterogeneous distribution of loads are found to be particularly prone to cascading failure when a high-load node is intentionally attacked [33,34,35,36]. By treating network nodes as active and bistable elements, a disaster sprawling dynamics model was proposed to investigate the time dependence and cascading failure characteristics of different network topologies [37,38,39,40]. In urban transportation studies, cascading failure analysis has been performed by combining the road network topology, attack mode and travel demand characteristics. By considering the traffic characteristics of road segments in urban road networks, the road traffic flow is mapped to the travel time, and the “actual capacity” is dynamically introduced into the cost function to define the coupled map lattice model [41,42,43,44]. Wu and Gao studied the impact of important road segments in an urban road network on cascading failure and analyzed the impact of different network attack modes on the cascading failure of the road network [45]. By improving the capacity-load model of cascading failure, Wu and Sun proposed three cascading failure models of urban road networks with flow-based removal, betweenness-based removal, and mix-based removal [46]. Dui et al. studied cascading failure in scale-free networks in terms of the payoffs of nodes in a multi-strategy evolutionary game to analyze the impact of cascading failure on the topology of complex networks [47]. Some studies have been devoted to defense strategies against network cascading failure by adjusting edges and nodes to ensure the maximum robustness of the network; these strategies include increasing or decreasing the number of network edges, node (edge) capacity optimization, and node (edge) load distribution [48,49,50,51]. The risk of cascading failure in road networks under natural disasters is mostly simulated by artificially setting random damage [52,53]; floods may cause road disruptions at corresponding locations, resulting in long traffic delays. The current research focuses on cascading failure models and postattack network responses [52,54], but few cases analyze the spatiotemporal pattern of the cascading failure of urban road networks under rainstorms and the correlation of this pattern with road vulnerability. For example, Santos et al. analyzed the road network vulnerability and influencing factors in 69 cities in Japan by using the random and targeted attack scenarios [55]; Valenzuela examined the urban road network attributes and vulnerability by using the Open Street Map (OSM) data with some nodes randomly removed [56]. These studies did not discuss the spatiotemporal distribution patterns of road cascade failures. Based on flood inundation extent, Kermanshah et al. analyzed the road network robustness characteristics and its spatial distribution in New York City and Chicago [57] but did not discuss its spatial association characteristics with road cascading failure. To address these issues, this study focused on the spatiotemporal patterns of the cascading failure and vulnerability of an urban road network in real rainstorms. Furthermore, the spatial association of the road vulnerability and cascading failure are also examined to provide decision support for improving urban road network robustness and urban resilience.
The remainder of this paper is organized as follows. Section 2 describes our study area and data. Section 3 introduces the method for measuring the complex network characteristics and their vulnerability and defines the cascading failure model. Section 4 examines the spatial patterns and relationships between road vulnerability and cascading failure. Section 5 discusses the paper’s findings. Section 6 concisely summarizes the paper.

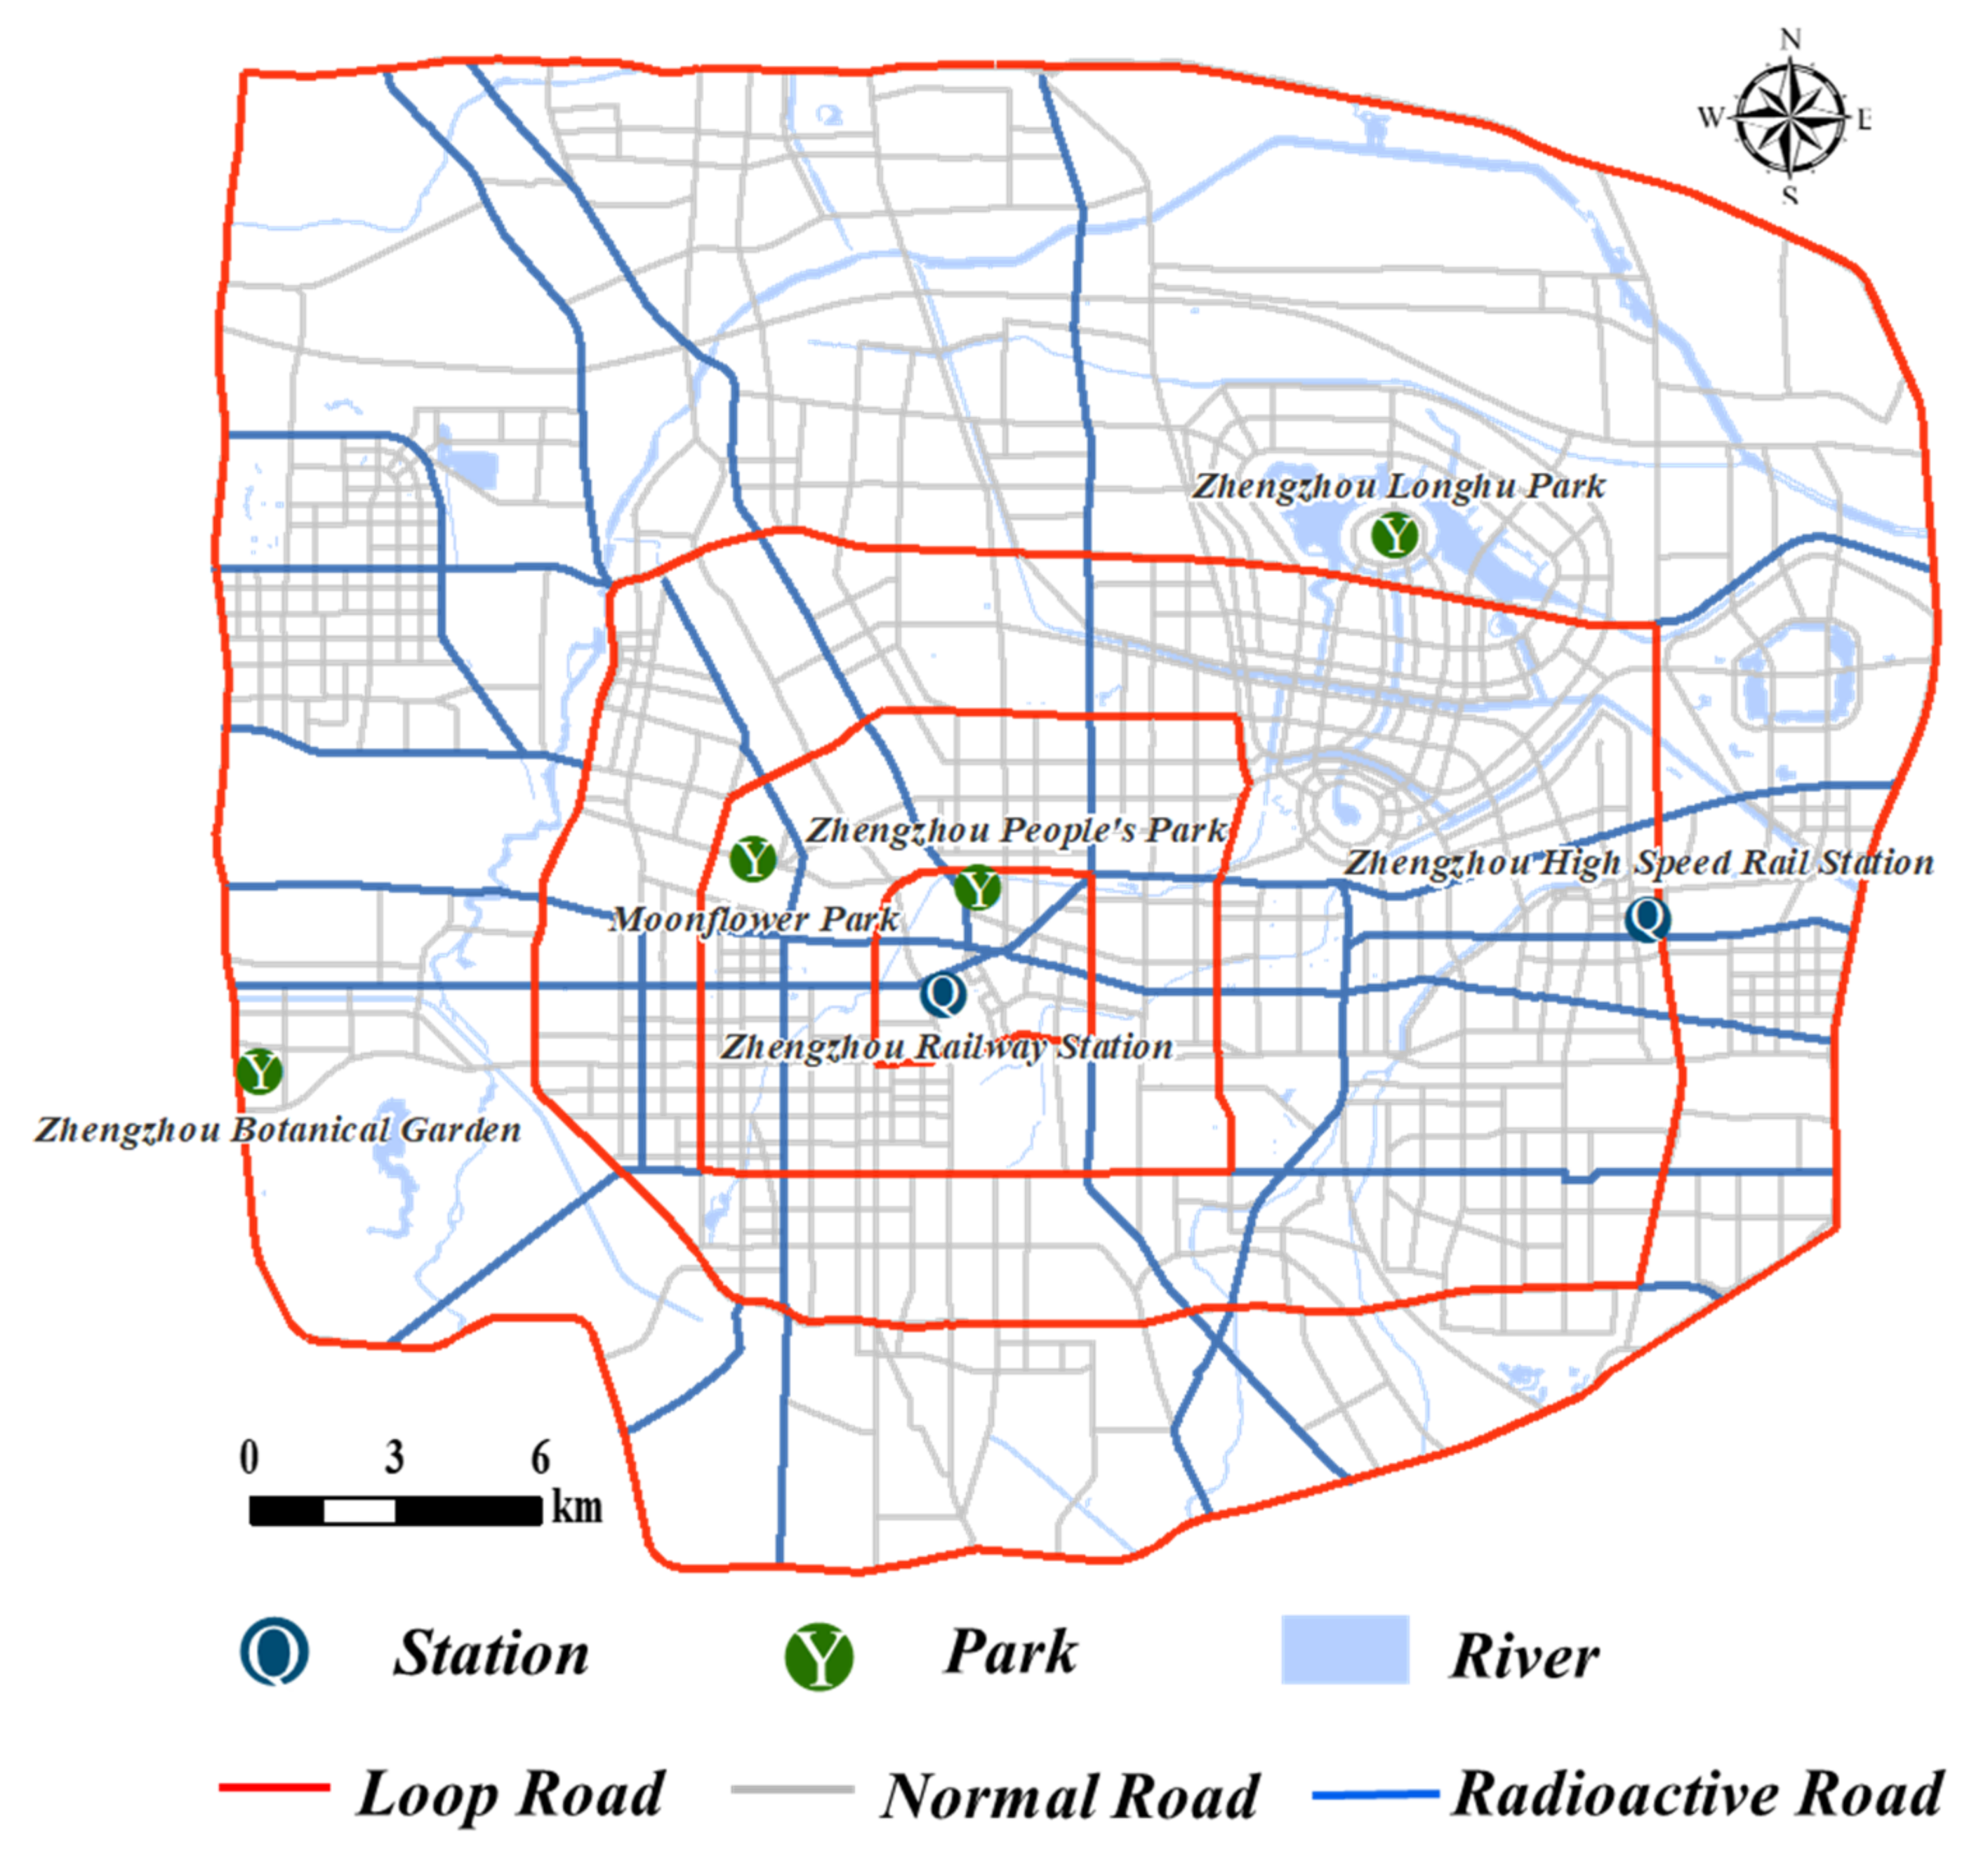
2. Study Area and Data
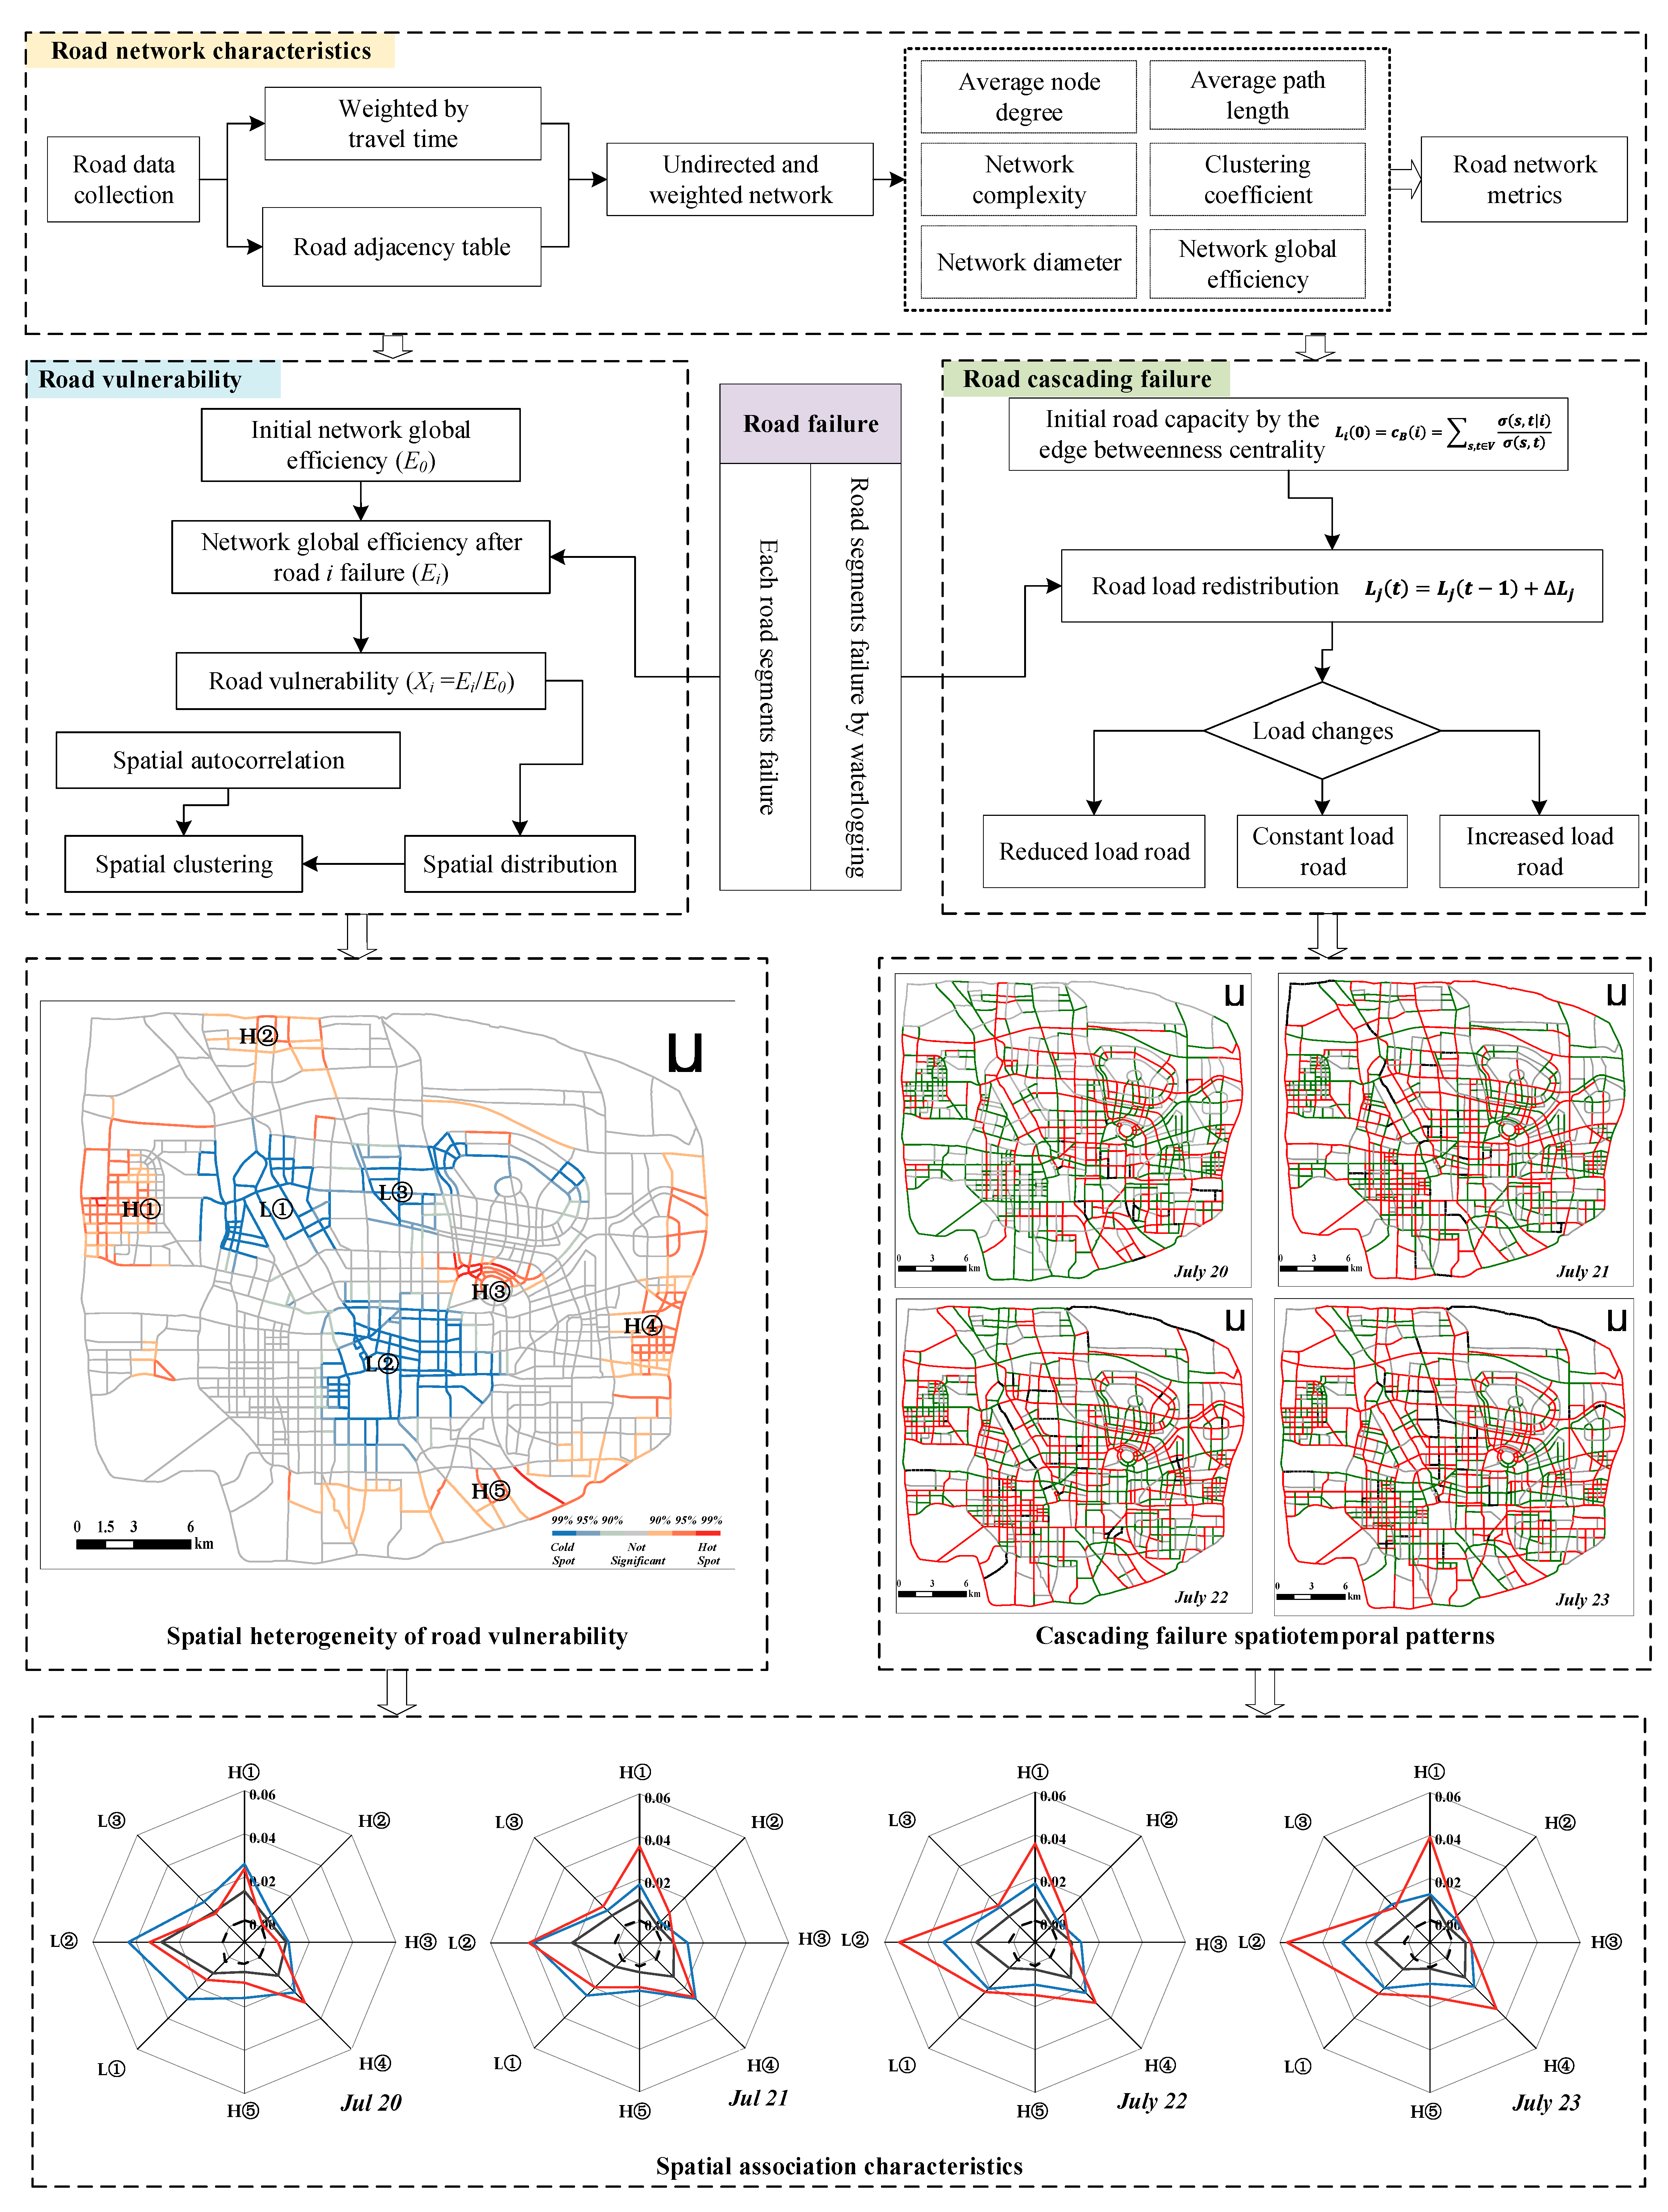
Zhengzhou is a national central city; the capital of Henan Province; and the political, economic, cultural, and transportation center of the province. The city is located at 113°27′–113°51′ E and 34°36′–35°00′ N and has a total population of 12.74 million [58]. Since 2010, the basic framework of urban roads with a “crisscross + ring” pattern has been constructed in Zhengzhou, along with a continuously improved branch road network, which forms a three-level structure consisting of ring roads, radial arterial roads, and ordinary roads (Figure 1). The study area is a contiguous urban built-up area of Zhengzhou, with a total road length of 1283.65 km. As shown in Figure 1, this area is located in the central part of Zhengzhou, bounded by the north, east, west, and south of the city’s fourth ring road, and has an area of 562.54 km2.
From 17–23 July 2021, Zhengzhou experienced an extreme rainstorm, with rainfall reaching 201.9 mm from 16:00 to 17:00 on 20 July, 552.5 mm in a 24 h period from 20:00 on 19 July to 20:00 on 20 July, and 624.1 mm from 0:00 on 19 July to 0:00 on 22 July, breaking historical records of hourly and single-day precipitation. This “7.20” extreme rainstorm was characterized by long duration, high accumulated rainfall, and extremely high precipitation intensity, resulting in severe flooding and an extended disruption of rail transit, highways, and power and communications facilities. According to the characteristics of “7.20” rainstorm, the maximum rainstorm volume for 17 series from 5 min to 1440 min and 3 days was retrieved from the Zhengzhou Meteorological Station, as shown in Table 1 [59]. The disaster led to 380 deaths and disappearances in Zhengzhou and a direct economic loss of CNY 40.9 billion (USD 6.14 billion) [60], causing tremendous damage to the city.
The data include the road dataset and the failed road segments due to waterlogging from the rainstorm. The urban road dataset was extracted using the application programming interface of Gaode Map (www.amap.com), and the road network dataset was constructed as the undirected network by the primal modeling method using intersections as nodes and road segments as edges. Based on the road grade data and the relevant driving speeds, the travel time (t) on each road segment was calculated by the length and the speed of the road segment, then defined as the network weight. The formula is as shown in Equation (1).
t = L v
where L is the length of the road and v is the restricted passage speed for that class of road (Table 2).
According to the National Technical Standard of Highway Engineering (JTG B01-2003), the speed limits for expressway (80 km/h), main roads (60 km/h), secondary arterial roads (50 km/h), and tertiary arterial and feeder roads (30 km/h) are assigned to each road segment. However, when heavy rain occurs, drivers judge the situation and decrease their speed accordingly [61,62]. Existing studies showed that the speed reduction ratio under heavy rain is about 42–47% [63,64]. Based the existed studies and the “7.20” rainfall storm in Zhengzhou City, we set the percentage of speed reduction at 50% (Table 2). The data on failed road segments were obtained from the National Earth System Science Data Center. The distribution of failed road segments at different times is shown in Figure 2. The number of failed road segments increased from 22 on 20 July to 35, 41 and 49 on 21, 22 and 23 July, respectively, and the distribution area gradually expanded.

3. Methodology

By using the global network efficiency index, road vulnerability was evaluated, and the spatial cluster of road vulnerability was identified using the spatial autocorrelation approach. Meanwhile, an improved cascading failure model was used to detect the spatiotemporal characteristics of the cascading failure of the road network based on the locations of failed road segments caused by the rainstorm. The association between the vulnerability and the cascading failure distributions of the road network was then investigated. Figure 3 depicts the framework of the research methodology.
In the next sections, we will present the meaning of the concepts, methods, and parameters included in the flowchart and the calculation process.

3.1. Complexity Network Characteristics on Urban Road Network

Urban roads are a complex network, and analyzing their network characteristics helps clarify their structure, scale, and state [65]. The primal method is mostly used for road network modeling, which can simplify the modeling process and improves the efficiency of network analysis [66,67,68]. In an emergency case, such as urban rainstorm studies, the roads can be used in both directions to enhance accessibility [69,70]. This study uses a primal graph to construct a weighted undirected network, i.e., road intersections are abstracted as network nodes, road segments between intersections are abstracted as network edges, and the travel time on each road segment is used as a weight [71]. Here, the metrics—including average node degree, network complexity, network diameter, average path length, clustering coefficient, and global network efficiency—are defined to measure the characteristics of the urban road network. The meaning and calculation method of each index are shown in Table 3.

3.2. Road Vulnerability Calculation and Its Spatial Patterns Identification

In the road network, traffic accidents lead to congestion or inaccessibility of road segments for a certain period, decreasing the global efficiency of the road network. Based on network global efficiency and considering the impact of a single road segment failure on network global efficiency, the vulnerability of the road network x i is defined as shown in Equation (2) [72].
x i = E i E 0
where x i is the vulnerability of road segment i; E 0 is the global efficiency of the initial network, which represents the average of the inverse of the shortest distance between road segment intersections in the study area (Table 3). E i is the global network efficiency of the network after the failure of element i, which is calculated by the same method as E 0 after removing the road segment i . After the failure of the road segment, the more significant the decrease in network efficiency, the lower the vulnerability; conversely, the less significant the decrease in network efficiency, the higher the vulnerability. Low vulnerability indicates that the road segment failure has a high impact on global network efficiency; meanwhile, high vulnerability indicates that the road segment failure has a low impact on global network efficiency. We calculated the global network efficiency using Python language and NetworkX library.
The spatial patterns of road vulnerability are analyzed by using the spatial autocorrelation method. From a global perspective, we identify whether the distribution of road vulnerability is clustered by using Moran’s I (Equation (3)) [32].
I = n i = 1 n j = 1 n W i j x i x ¯ x j x ¯ i = 1 n x i x ¯ 2 i = 1 n j = 1 n W i j i j
where n is the number of edges in the road network; x i and x j denote the average vulnerability indices corresponding to edge i and edge j, respectively; and W i j is the spatial weight. The value of Moran’s I ranges from −1 to 1. At a given significance level, I > 0 indicates the presence of positive spatial correlation, i.e., the spatially clustered distribution is more pronounced. The standardized statistic Z is often used to test the significance level of Moran’s I (Equation (4)).
Z s c o r e = 1 E I V A R I
where E I and VAR(I) represent the expected value and variance of Moran’s I, respectively. To further investigate the local distribution pattern of road vulnerability and identify the “hot spot” and “cold spot” areas of the network vulnerability, the Getis-Ord G i * statistic is used to analyze the high-value and low-value concentration areas of the vulnerability distribution of different edges (Equation (5)) [73]. The spatial clustering patterns of road network vulnerability are explored by using the spatial autocorrelation and cold hotspot geoprocessing tools in ArcGIS.
G i * = j = 1 n W i j x i x ¯ j = 1 n W i j S n j = 1 n W i j 2 j = 1 n W i j 2 n 1 , x ¯ = j = 1 n x j 2 n , S = j = 1 n x j 2 n x ¯ 2

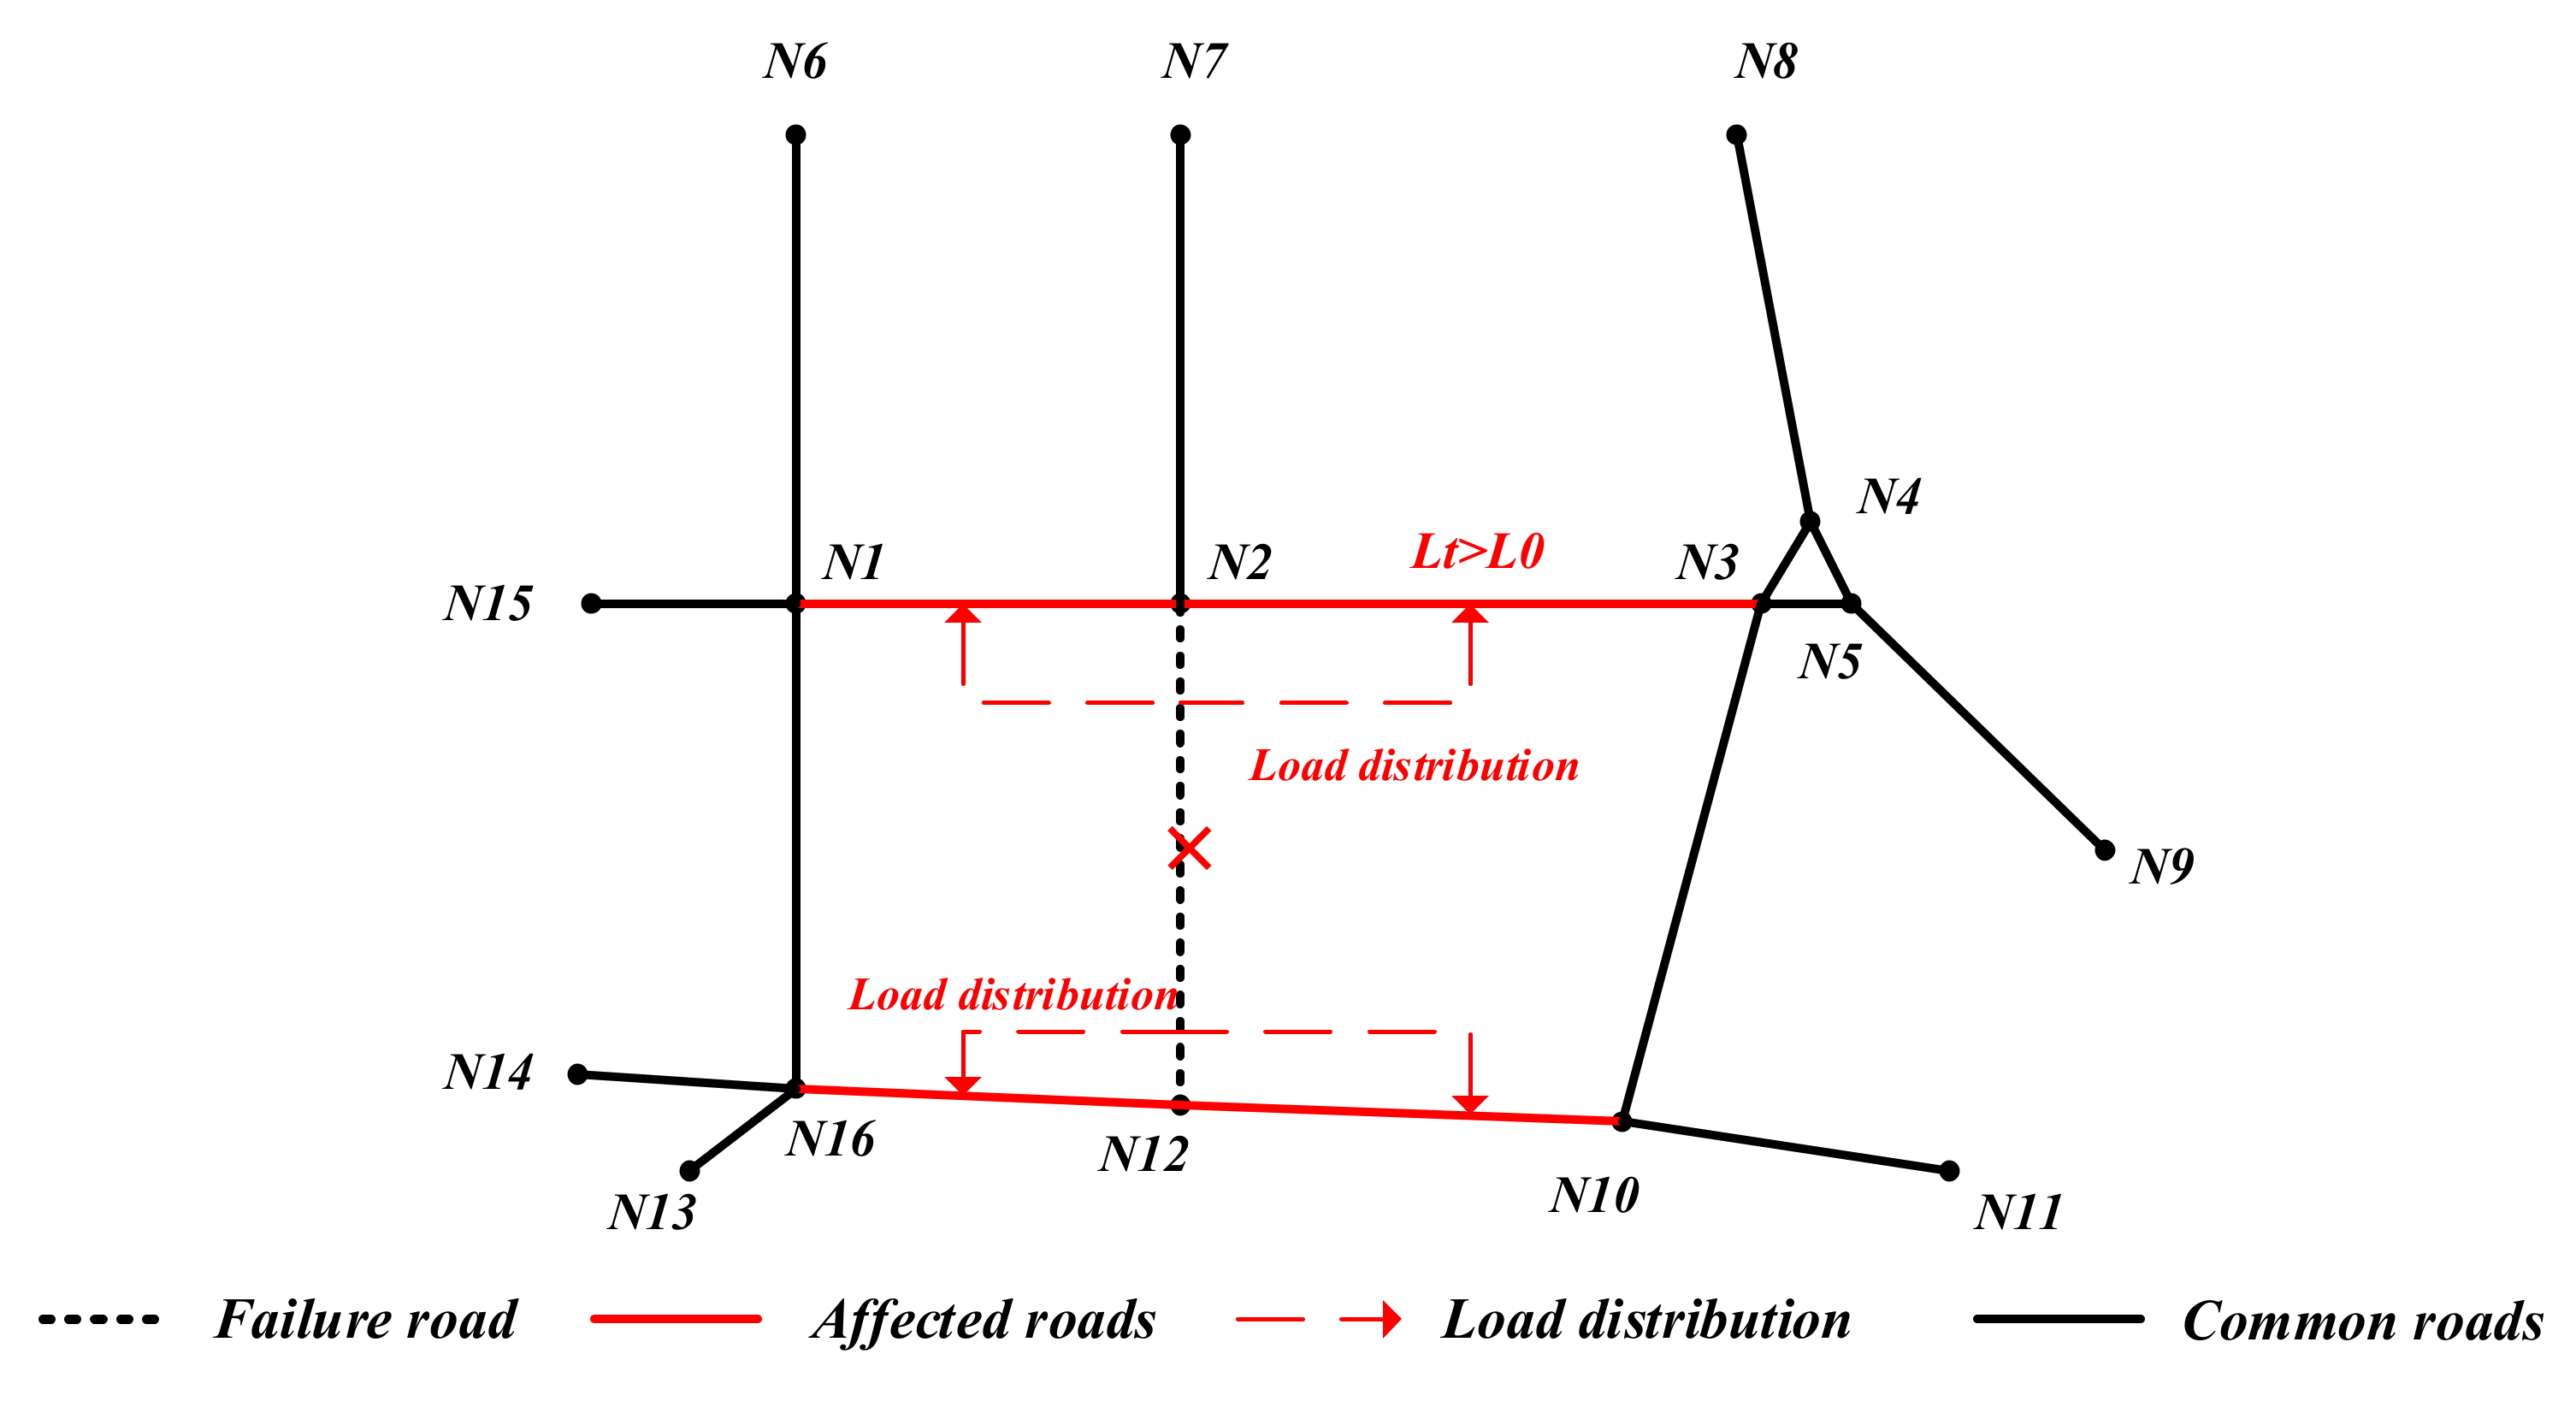
3.3. Road Network Cascade Failure Model

When analyzing the cascading failure characteristics of the road network, it is assumed that failure occurs on a certain edge of the network, and after this edge is removed, the original load traffic will be rerouted to adjacent road segments. The loads on adjacent road segments will change accordingly, generating a new round of loads distributed to other nonfailing roads. This process leads to a cascading effect (Figure 4), which affects the efficiency of the road network. The road traffic volume is usually used as an indicator to reflect the road load. However, when a rainstorm occurs, the road traffic volume decreases significantly and cannot accurately reflect the change in the load. Here, the road load is calculated using the betweenness centrality index of the complexity network. The initial load of a road segment i is defined as L i 0 (Equation (6)) [74,75].
L i 0 = c B i = s , t V σ s , t | i σ s , t
where V is the set of network nodes, σ s , t is the number of shortest paths in the network, and σ ( s , t | i ) is the number of shortest paths through edge i . After a road segment fails, the original load on that road is redistributed, and the traffic load is thus redistributed to adjacent edge i from failed edge j , as shown in Equation (7):
L j = k j L i 0 = c B j m r φ c B m L i 0
where k j represents the proportion of load originally on the failed edge distributed to adjacent edge j , c B j is the betweenness of adjacent edge j , and r φ is the set of adjacent nodes of edge j . On this basis, the load of a road segment is updated to the sum of the road segment’s initial load and the newly distributed load, as shown in Equation (8).
L j t = L j t 1 + L j
where L j t 1 is the load on the adjacent edge v j of the failed network node at the moment t 1 . As the load on the adjacent road segment increases, the relationship between L j t and the initial L j 0 must be redetermined, and the road segment is an affected edge if the load is not equal to the initial load (Equation (9)).
F j t = 1 , L j t < L j 0 0 , L j t = L j 0 1 , L j t > L j 0
where 0 represents a road segment with a constant load, 1 represents a road segment with an increased load and −1 represents a road segment with a reduced load.
In this study, with the help of the spatial analysis module in ArcGIS, we build the road network dataset, then export the dataset to NetworkX library for the complexity network metrics calculation by using the Python language and ArcPy library. We establish the spatial weight matrix based on the adjacency matrix, then the global Moran’s I index and the spatial cluster patterns of the road network vulnerability ( x i ) are examined by using the spatial autocorrelation and cold hotspot geoprocessing tools in ArcGIS. Additionally, the Pandas or NumPy library is used for related auxiliary calculations such as correlation coefficients.

4. Results

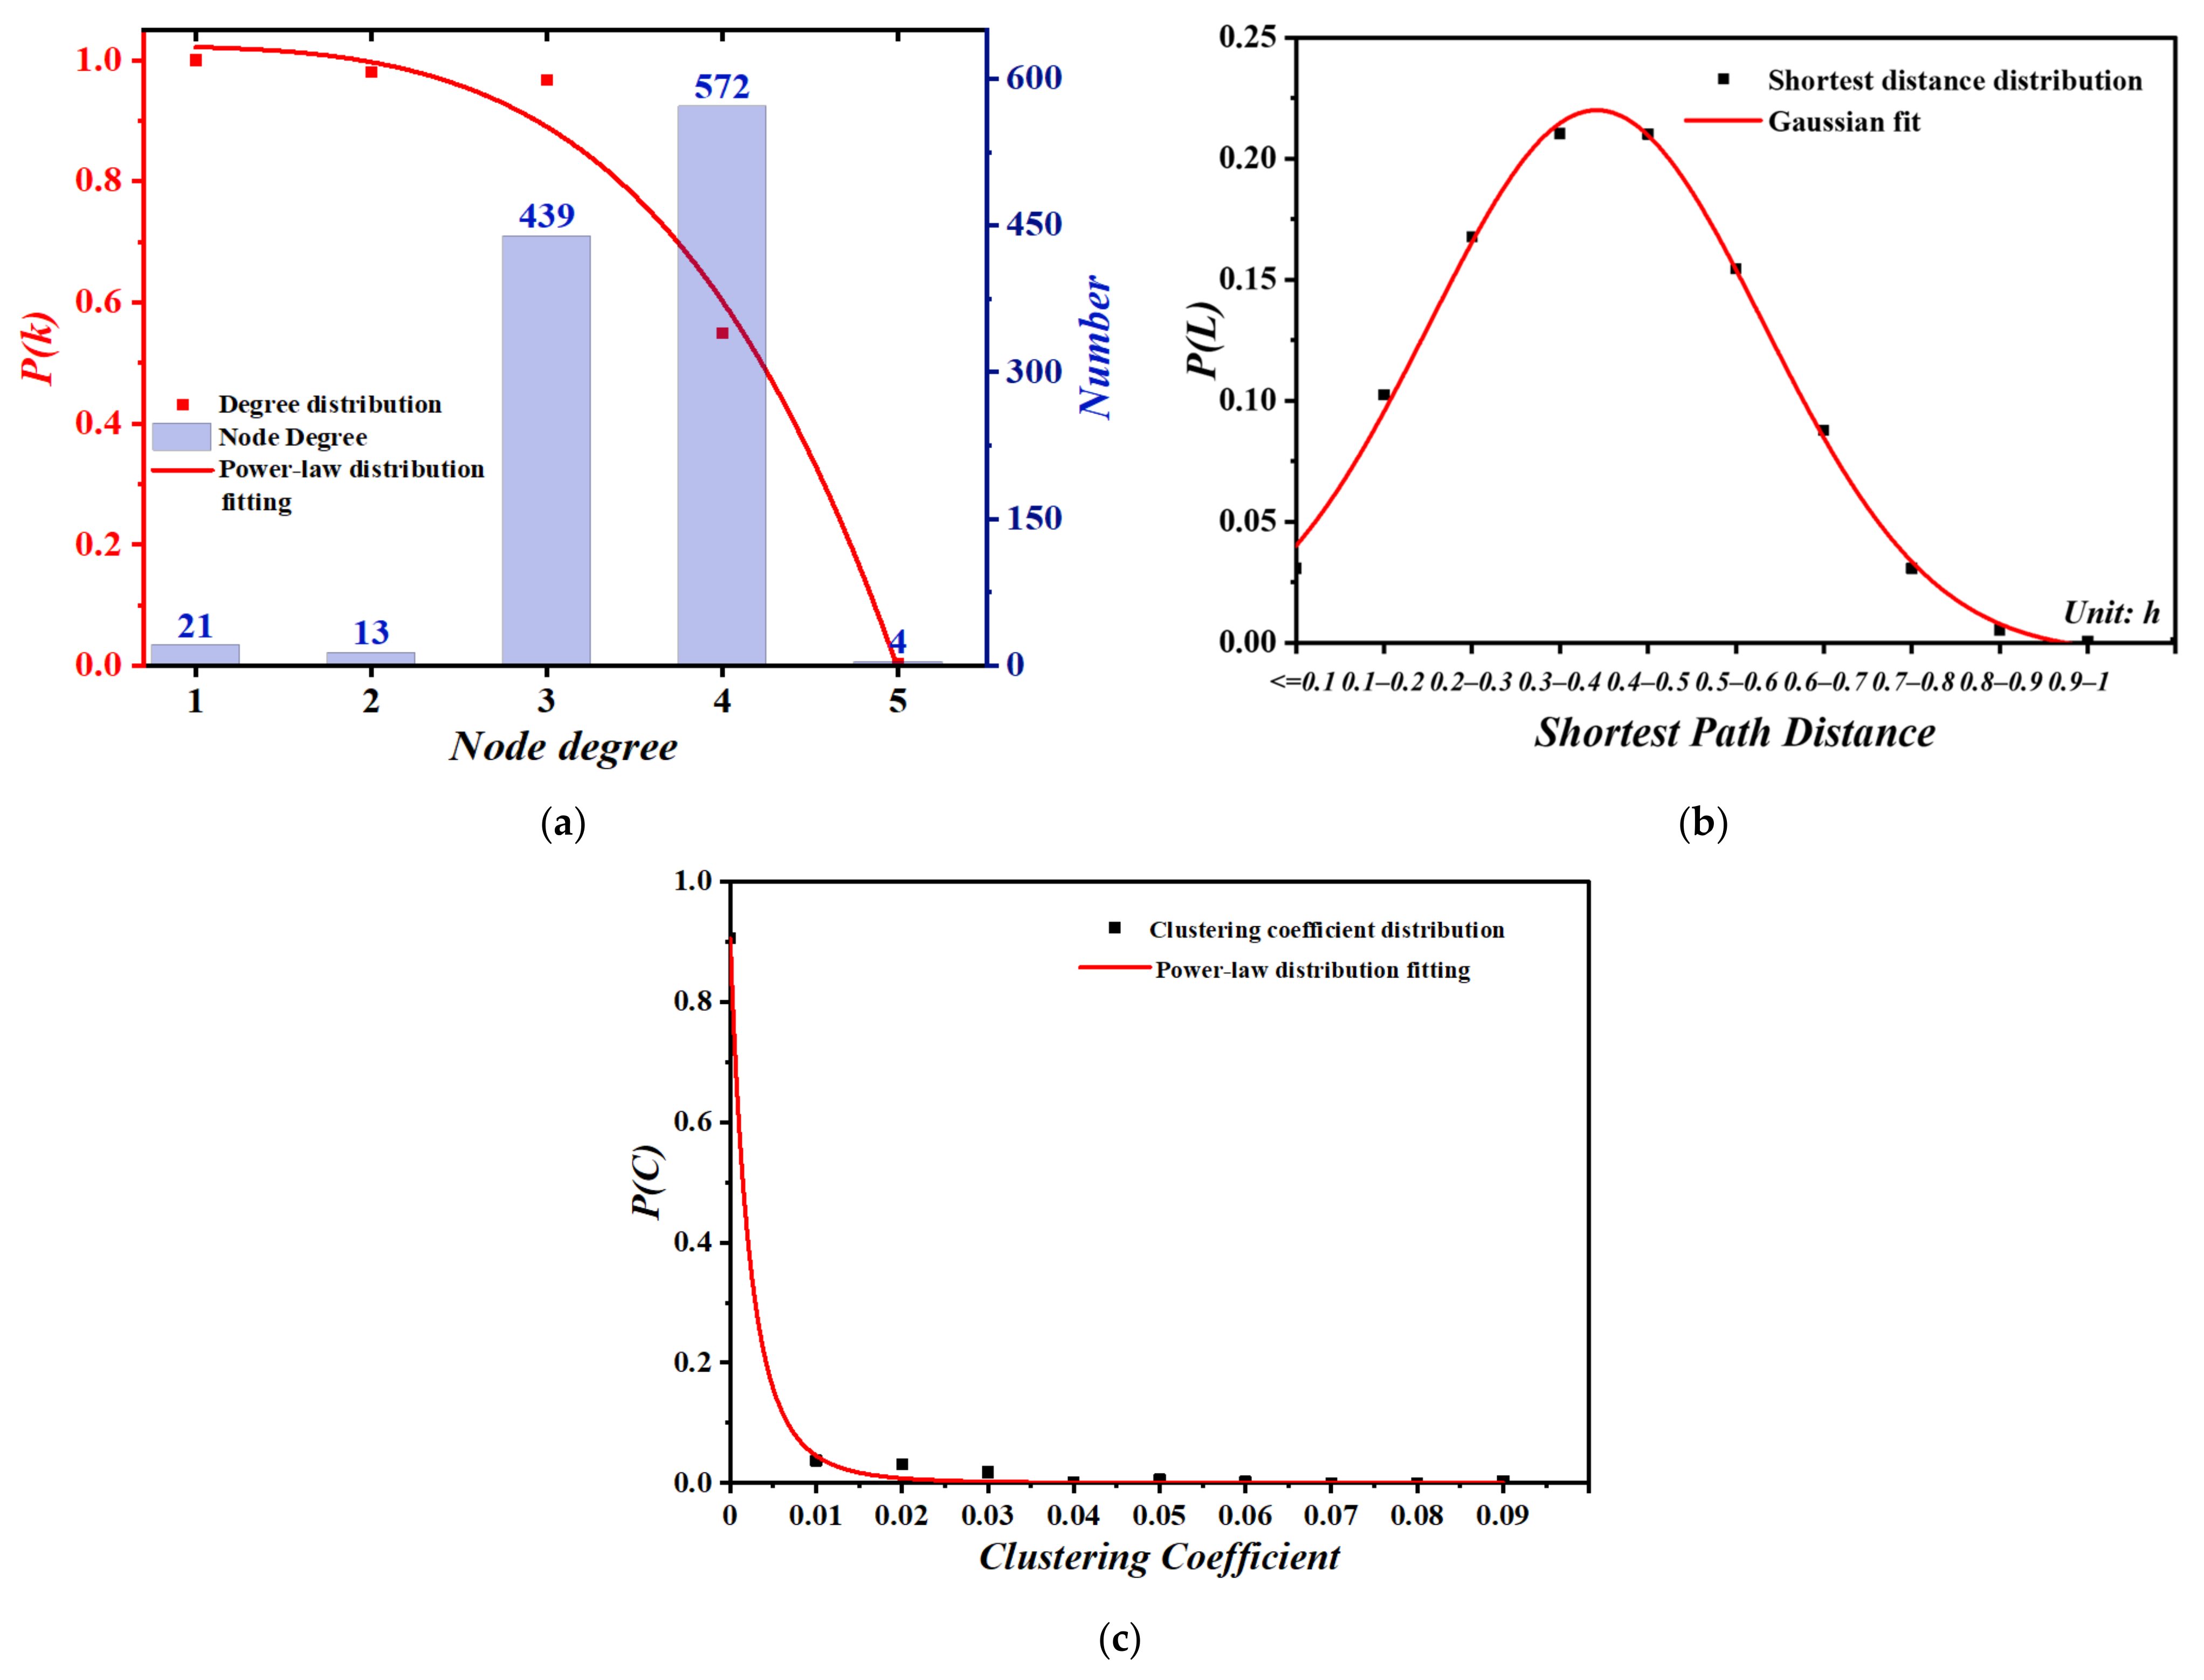
4.1. Complexity Network Characteristics on Road Network

The road network in Zhengzhou comprises 1049 nodes and 1836 edges. The degree of nodes on the road network is called the Node. The degree function in the NetworkX library uses python language. It generates the bar statistical graph, as shown in Figure 5a. Then, the cumulative degree distribution is fitted by using the power-law fitting function in NumPy library. As shown in Figure 5a, the road network in the study area has a maximum node degree of 5.0, a minimum node degree of 1.0, and an average node degree of 3.5. Nodes with a degree of one represent road starting points, nodes with a degree of two represent road turning points, and nodes with a degree greater than two are intersections. In terms of quantity, intersection nodes dominate the road network. The node degree distribution of the road network in the study area is fitted and found to be a power-law distribution with a goodness of fit above 0.98. The degree distribution is highly nonuniform, and the network has scale-free characteristics (Figure 5a). By calculating the shortest distance and clustering coefficient statistics of the road network using the NetworkX library, their probability distributions are fitted by using the Gaussian and power-law fitting function, respectively (Figure 5b,c). The shortest path length of the road network has a maximum (network diameter) of 1.10 h, a minimum of 0.01 h, and an average of 0.40 h (Figure 5b). The distance follows a Gaussian distribution with a goodness of fit above 0.99. The clustering coefficient of the road network has a maximum of 0.08, accounting for 0.20%; a minimum value of 0, which is the case for 90.55% of the nodes; and an average of 0.0016. The average clustering coefficient of the whole road network in the study area is small, indicating that the density of roads in the study area is high; the average clustering coefficient is greater than zero, indicating that the road network may be characterized as a small-world network. The distribution of the clustering coefficient is fitted, and the resulting distribution curve accords with a power-law distribution with a goodness of fit above 0.98 (Figure 5c).

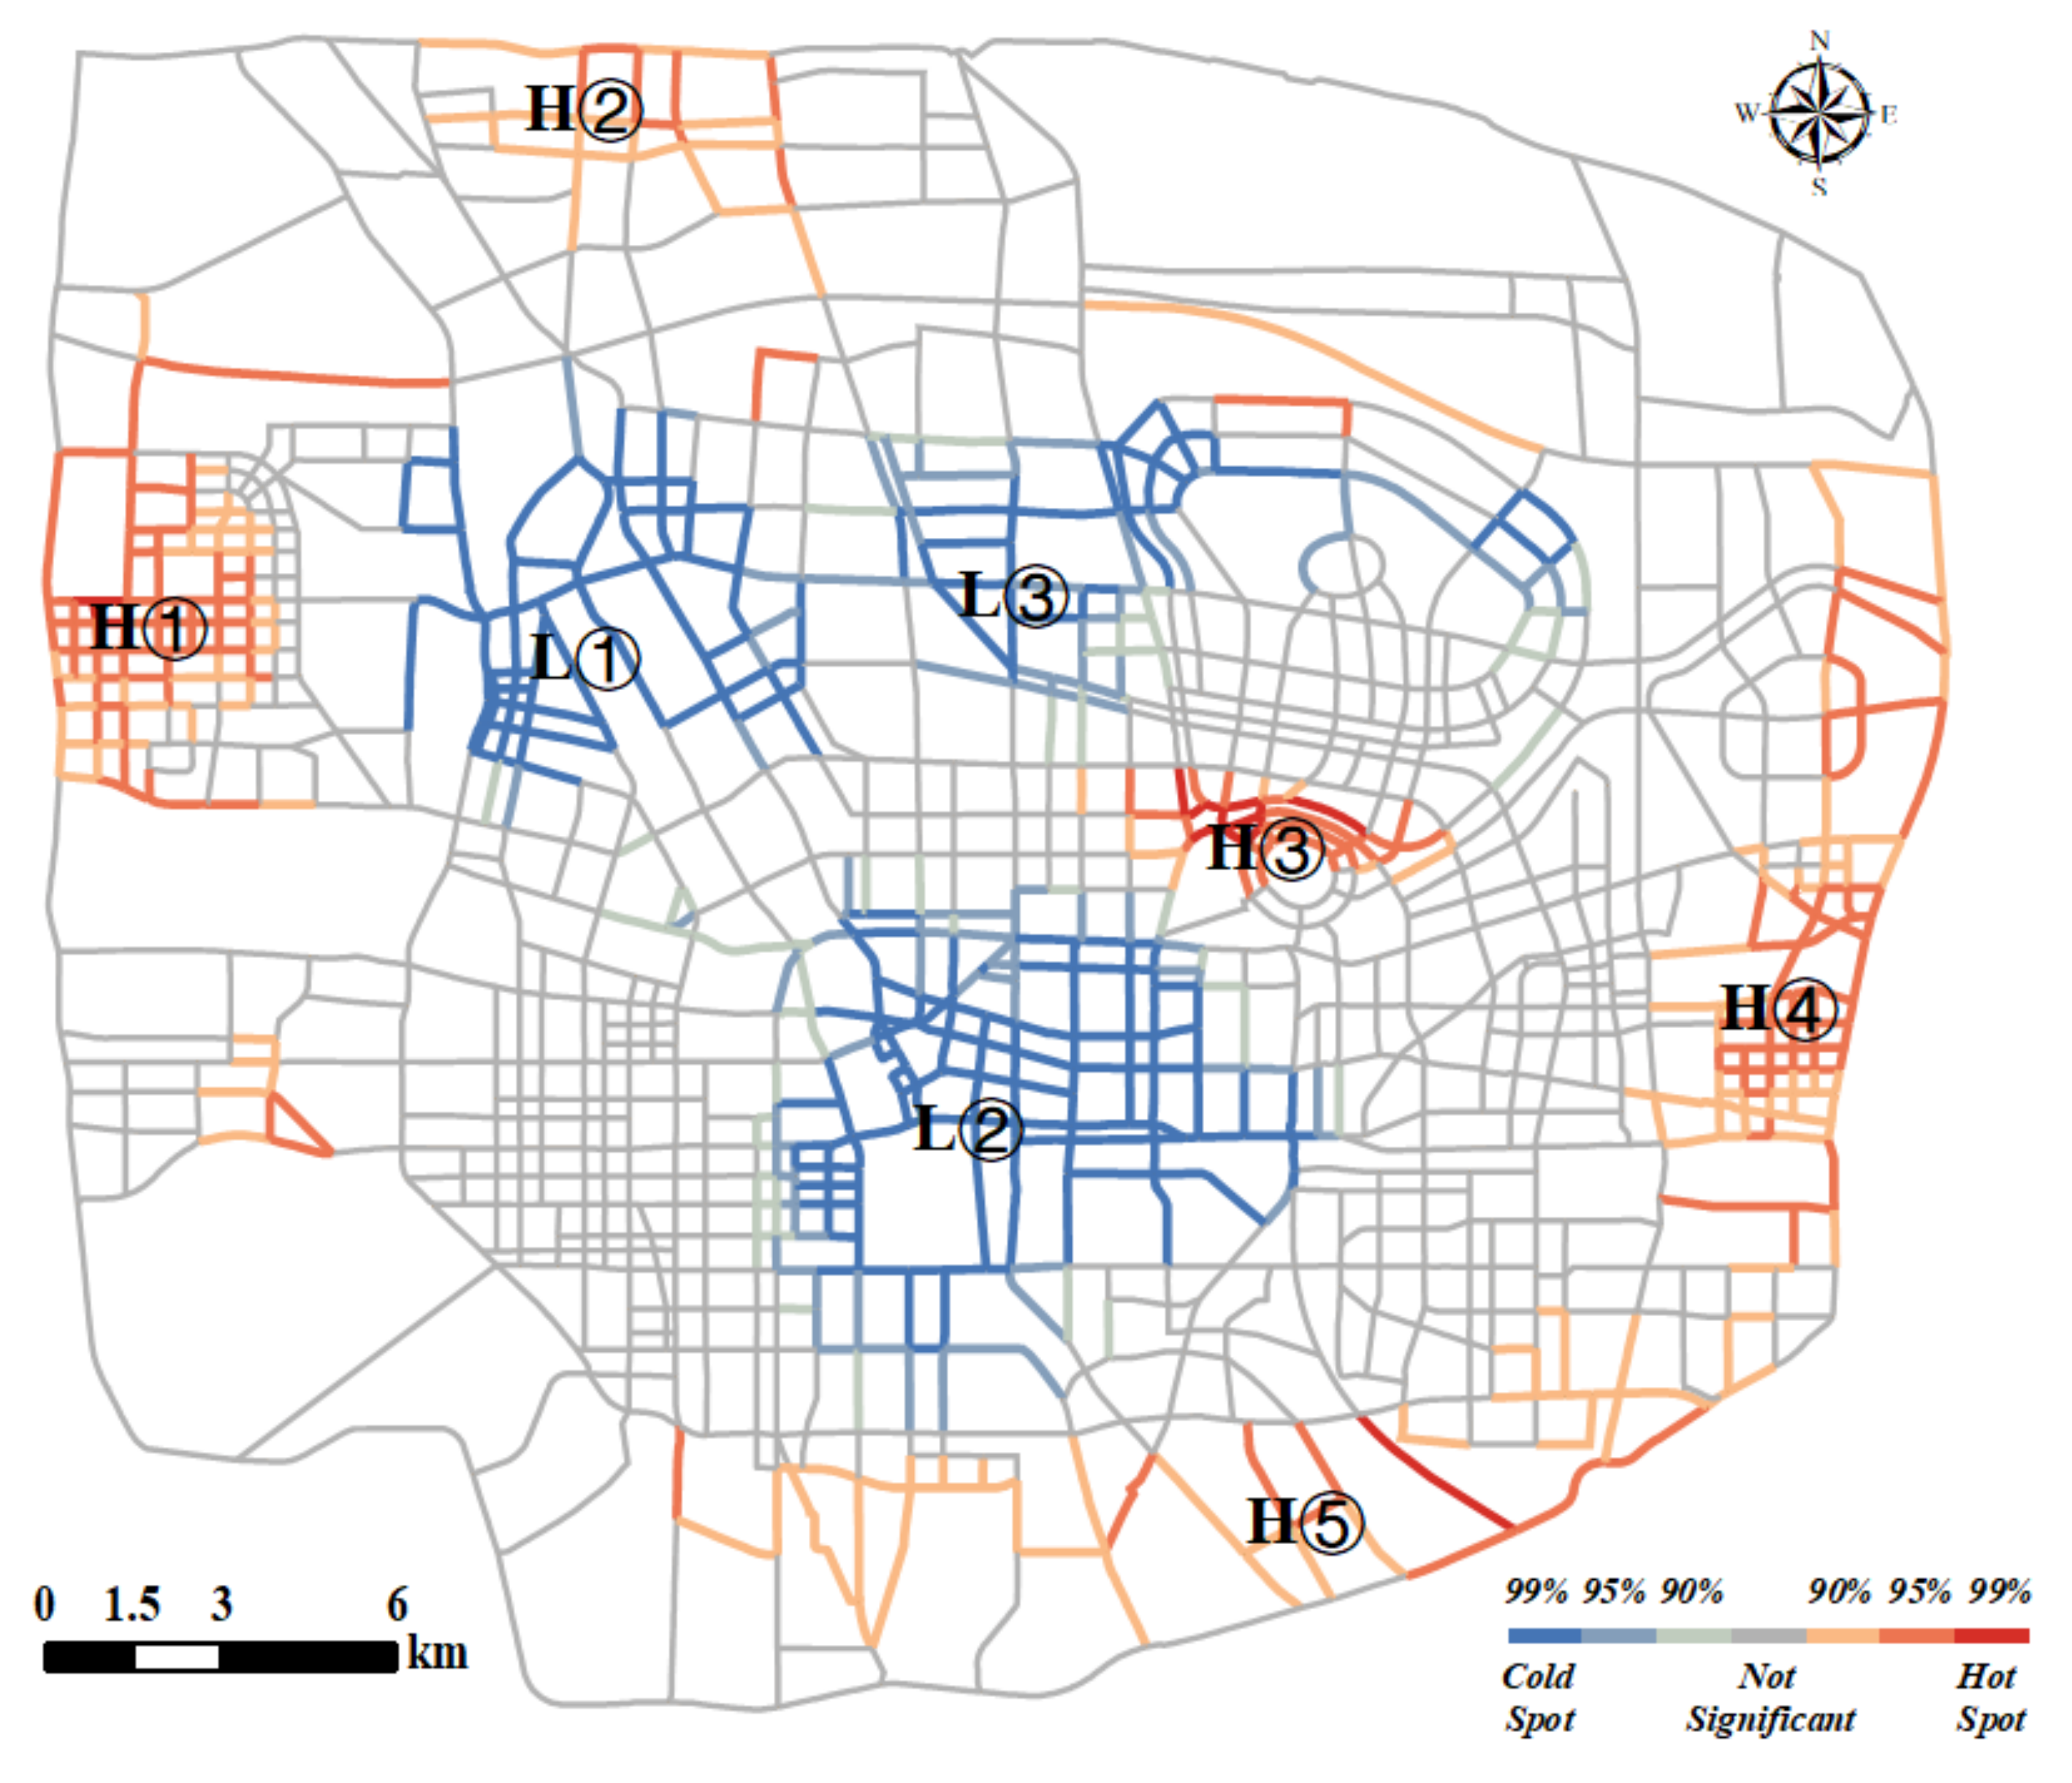
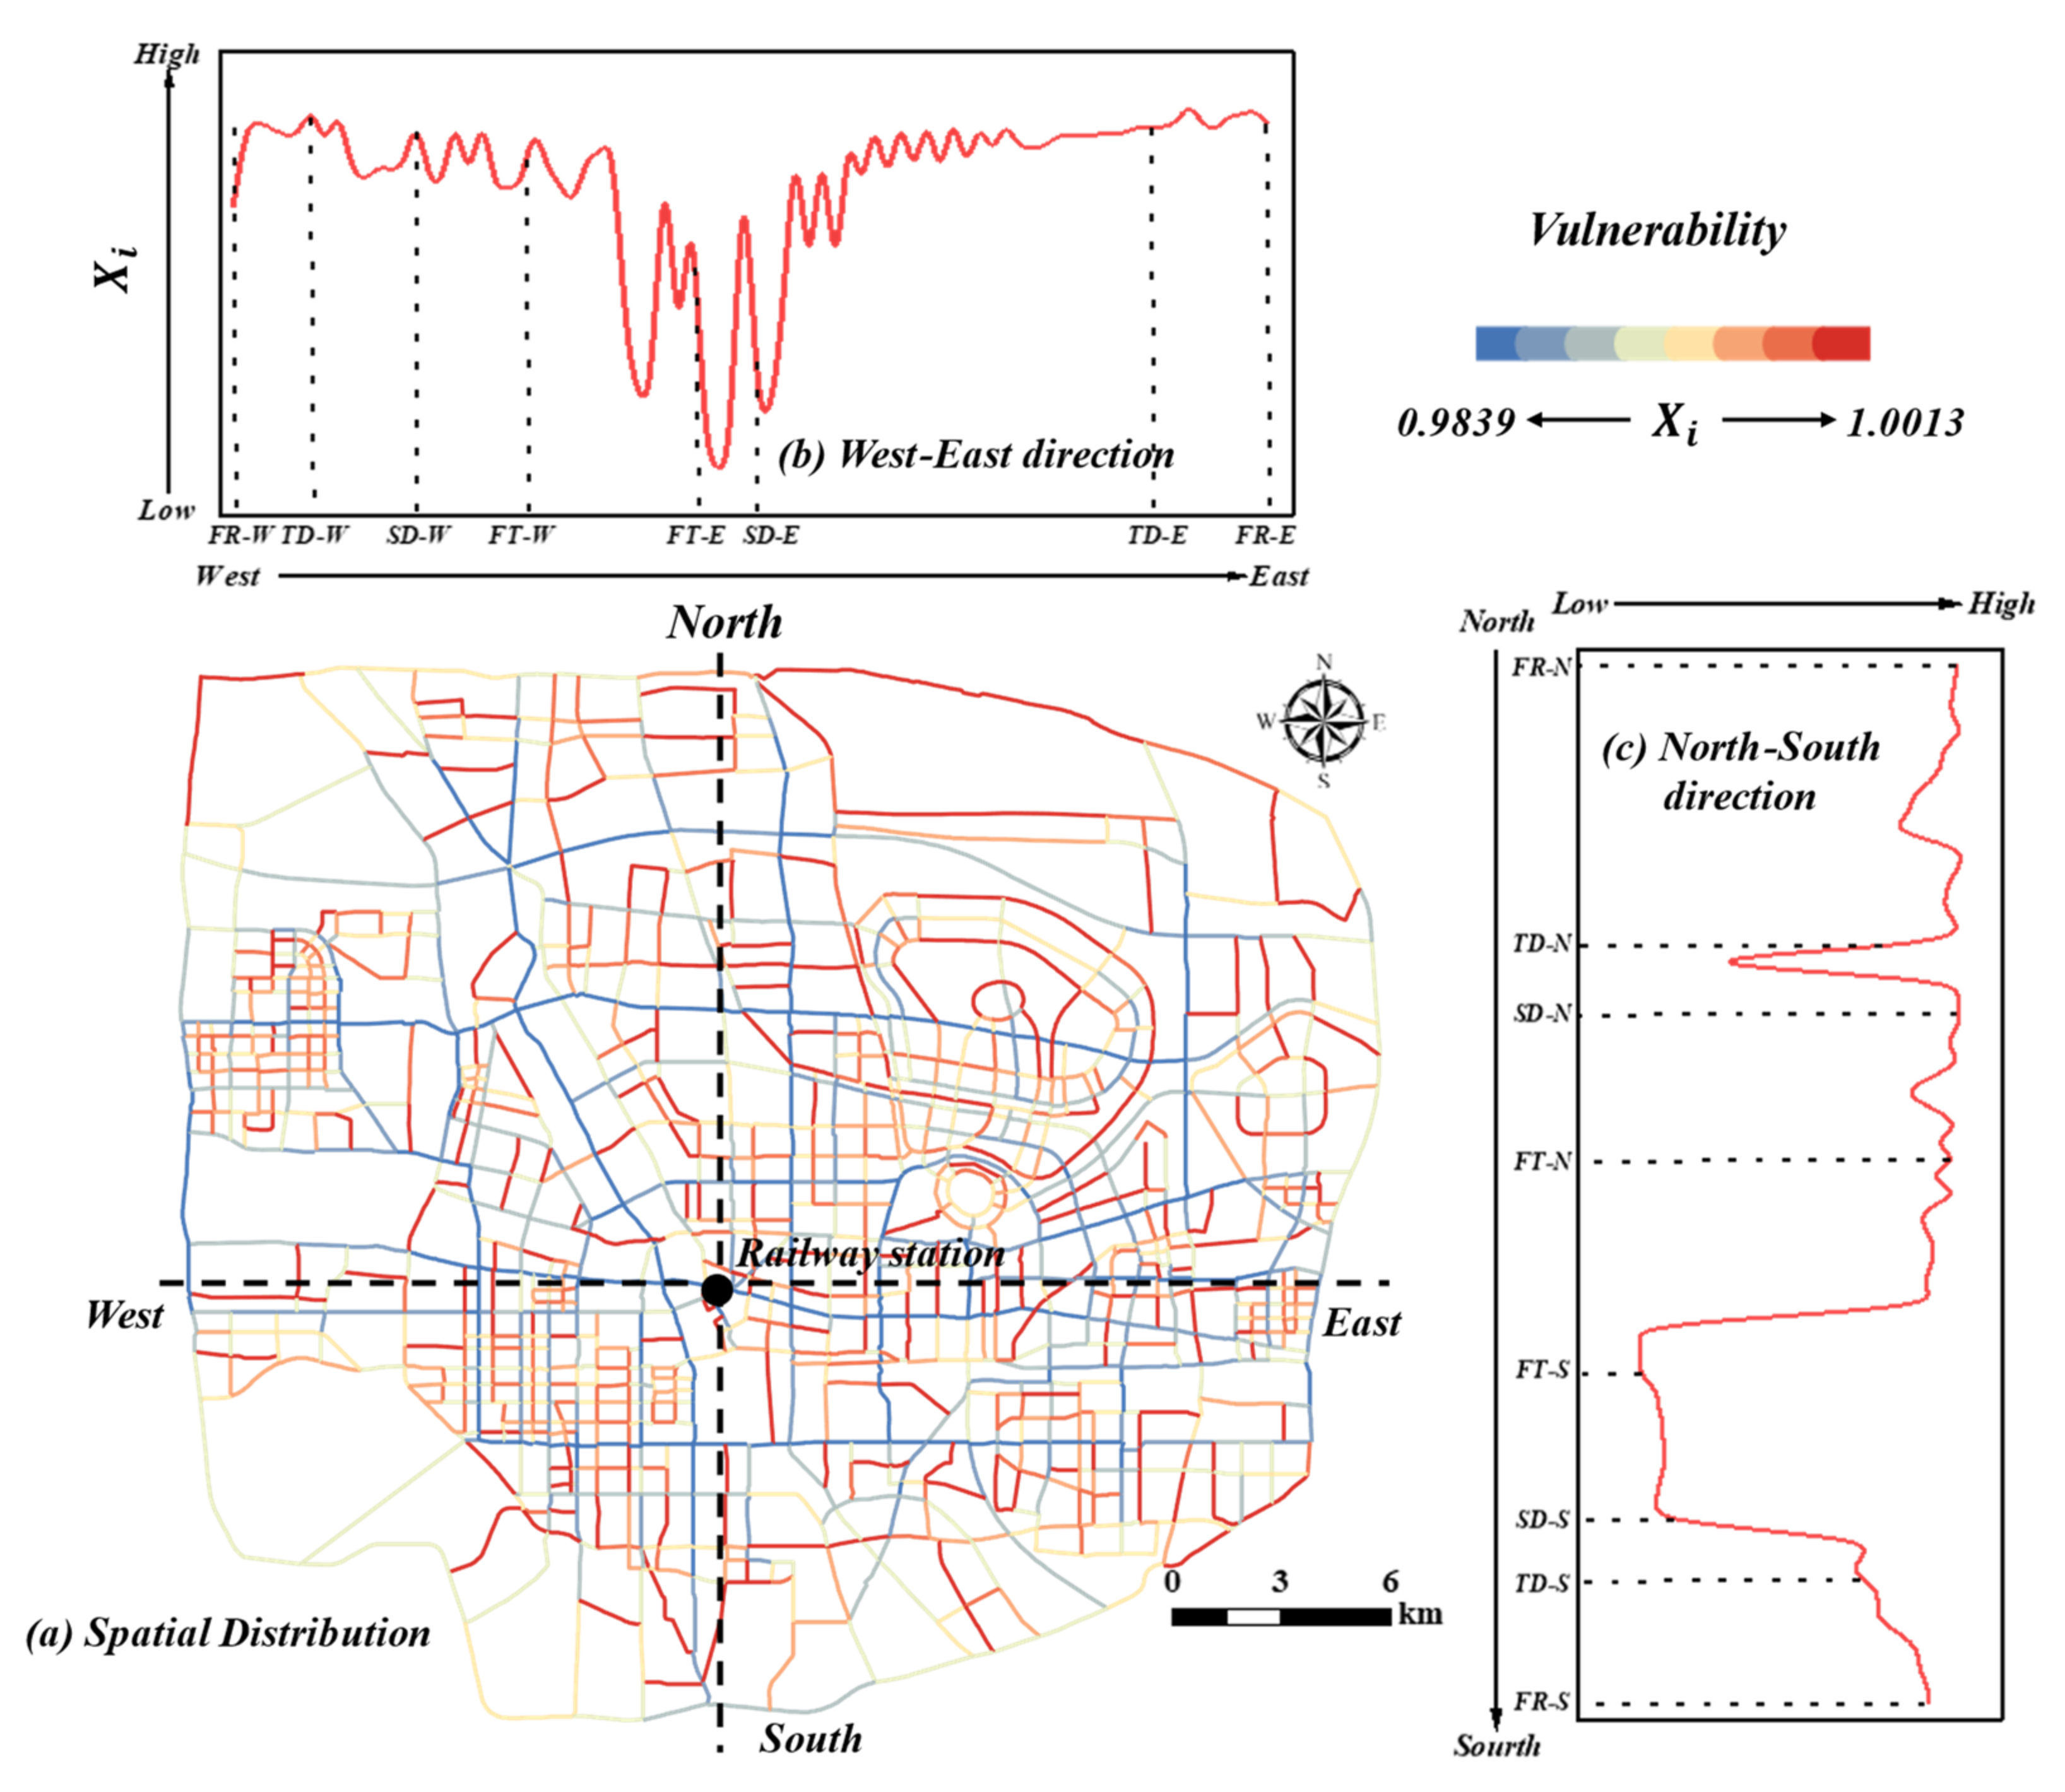
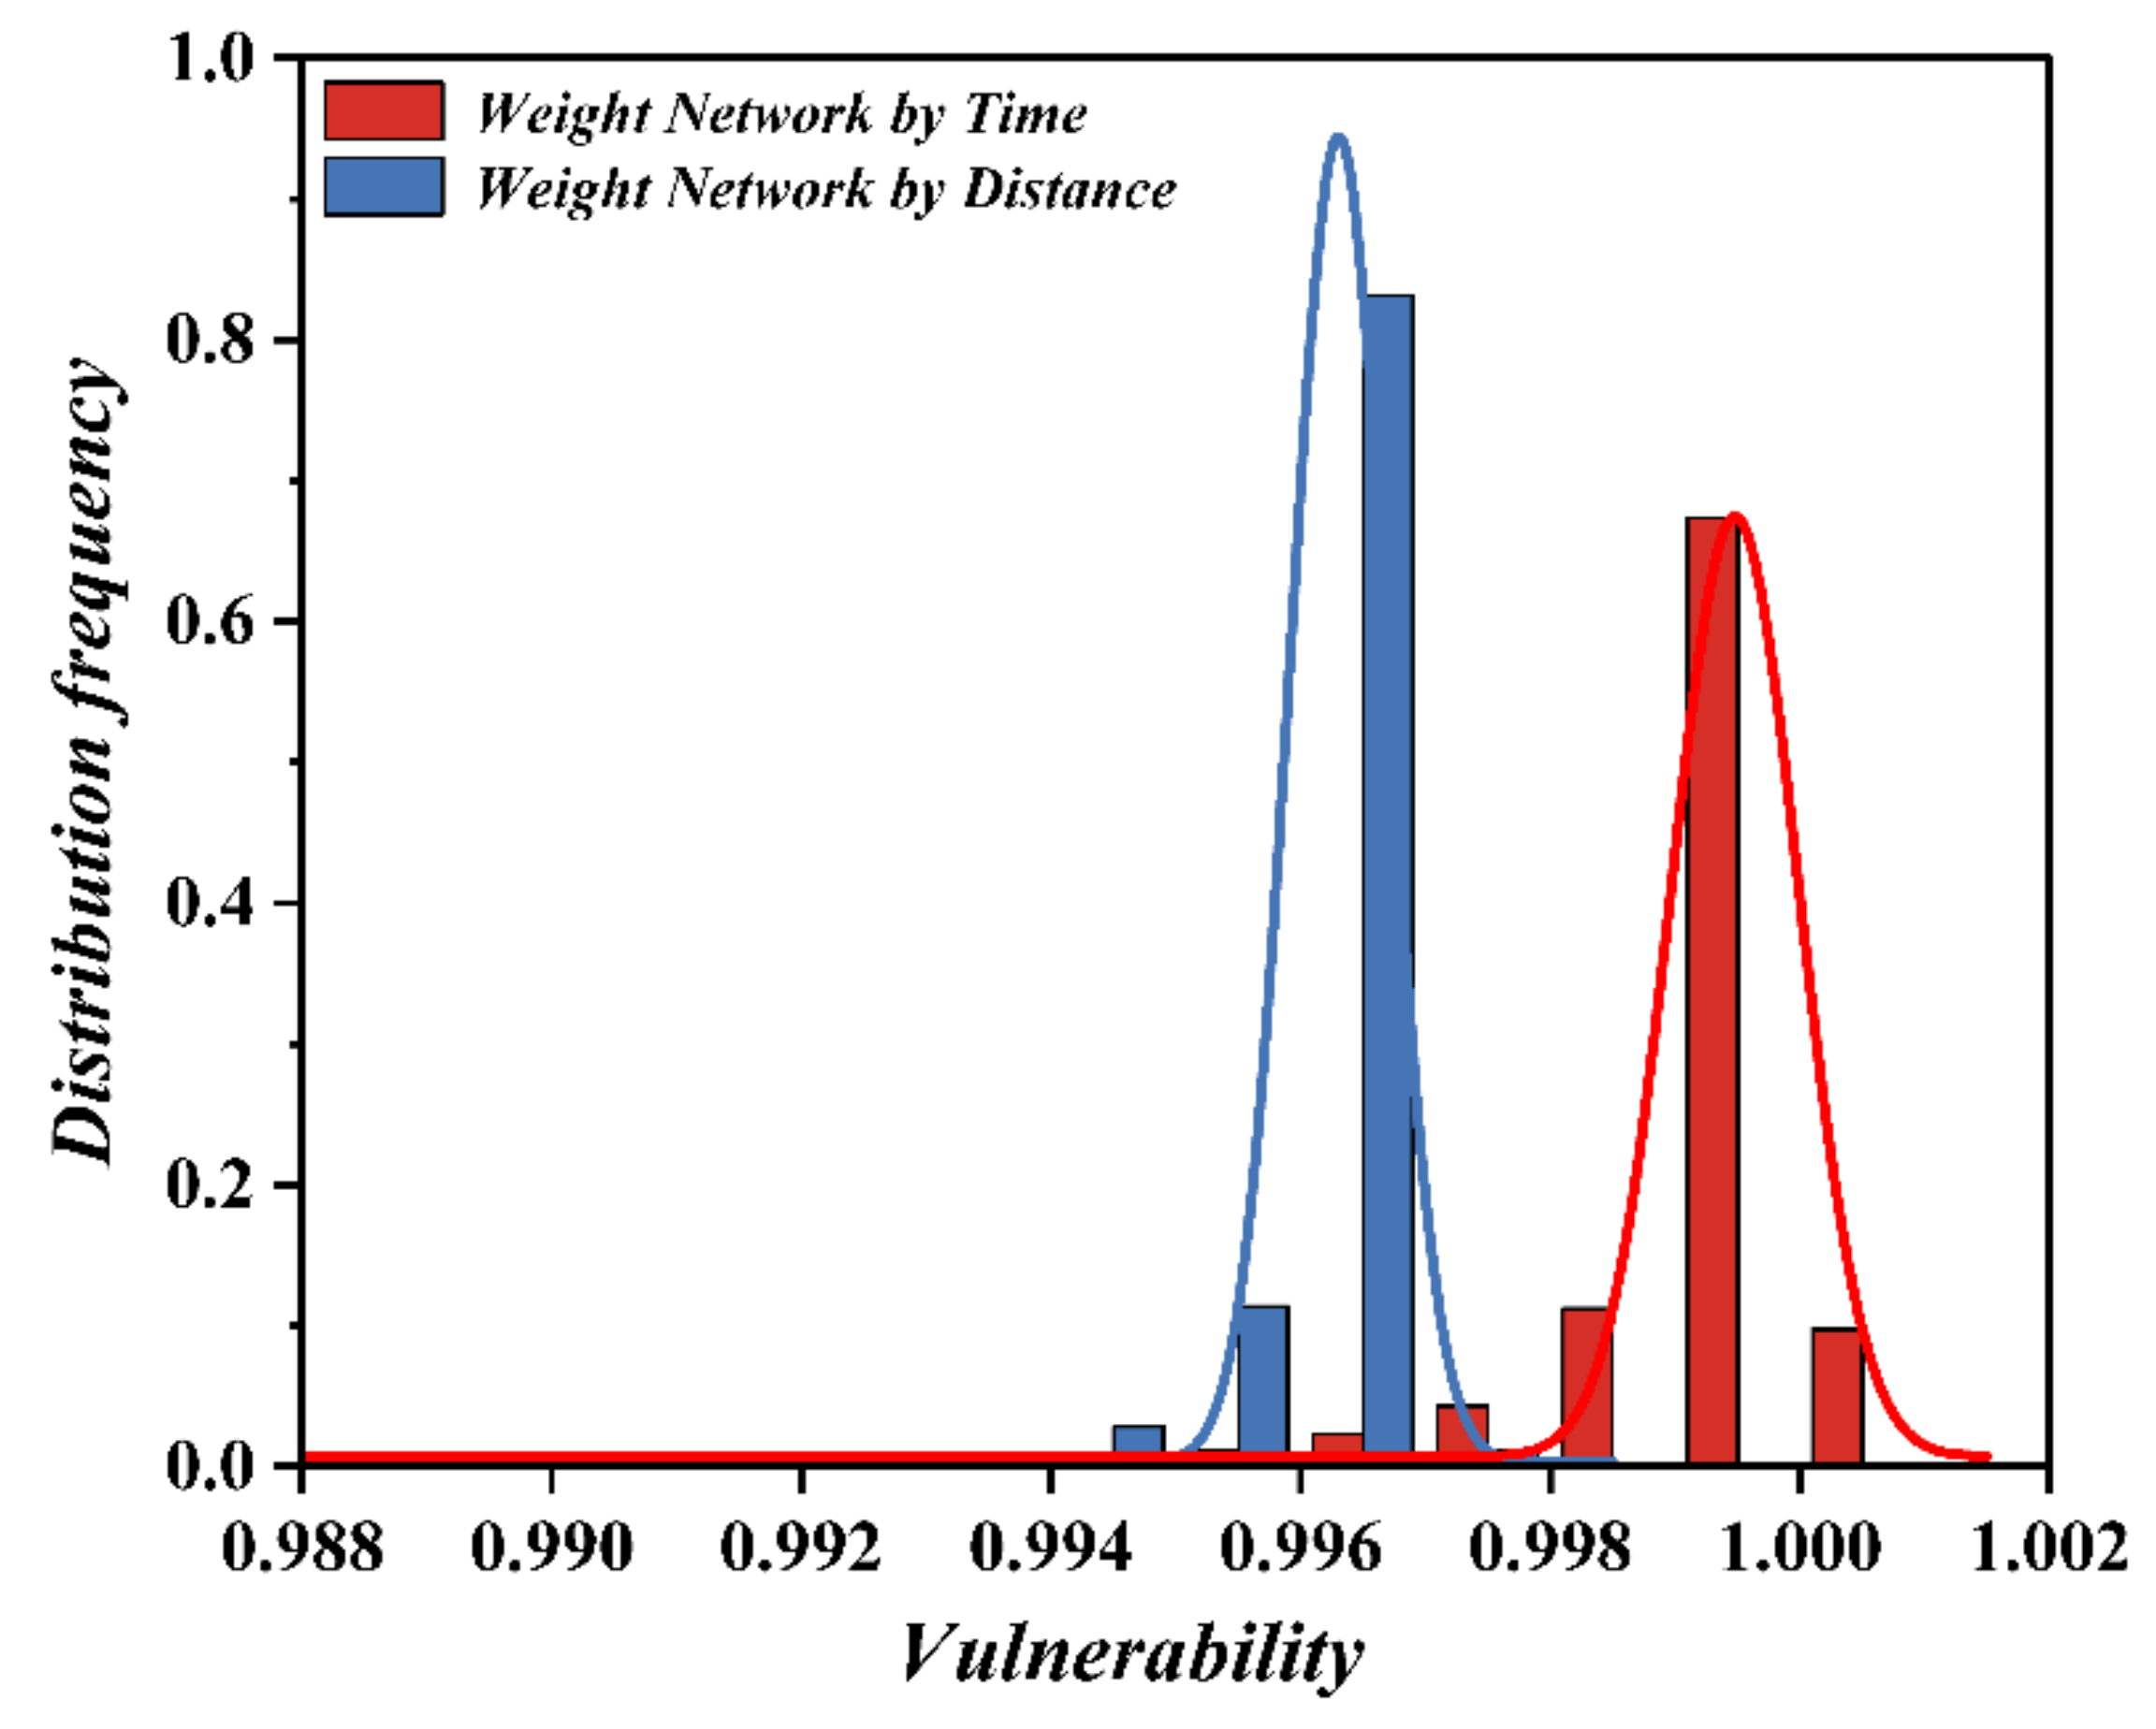
4.2. Spatial Distribution of the Road Vulnerability

The vulnerability of roads in the study area is calculated using Equation (1), and the results are shown in Table 4. Most road segments (1655 or 90.09%) have a vulnerability of less than one, with a total length of 1083.75 km. The minimum vulnerability, which is 0.9839, occurs in the urban arterial roads. Twenty road segments (1.14%) have a vulnerability higher than one, with the maximum vulnerability (which is 1.0013) appearing on tertiary roads. The overall average vulnerability of the roads is 0.9991, which is higher than the average values of urban expressways and urban arterial roads and lower than the average values of urban secondary roads, tertiary roads, and branch roads. The standard deviations of the vulnerability of secondary roads, tertiary roads, and branch roads are small, but the standard deviations of the vulnerability of urban expressways and urban arterial roads are larger than the overall level, indicating large differences within these two types of roads.
The different travel times on roads lead to significant spatial heterogeneity in the vulnerability of different road segments (Figure 6a). Road failure leads to a decrease in network global efficiency. The lower the vulnerability of a road segment, the greater the impact of the road segment’s failure on the global traffic efficiency of the network. Roads with low vulnerability often belong to ring roads and central urban roads and are connected to the branch road segments of radial roads, making these roads the only ones that reach other roads in the network; additionally, these roads have a short travel time and a high utilization rate. In addition, after branch roads fail, the network becomes disconnected, leading to a decrease in network global efficiency. The closer a branch road is to urban ring roads and the urban center, the more pronounced the decrease in efficiency. A few roads have a vulnerability greater than one. These roads are generally located at the periphery of the city and include the starting points of the roads, and the failure of these roads, to a certain extent, reduces the maximum connected subgraph, decreases the shortest path, and improves the global network efficiency. The failure of high-grade roads has the greatest impact on overall network efficiency. To further analyze the distribution of vulnerability of different grades of roads, the road vulnerability profile is plotted in the east–west direction (Figure 6b) and the south–north direction (Figure 6c). The road vulnerability in each direction shows a distribution pattern that is low in the middle and high in the surrounding area. The ring roads near the urban center have the lowest vulnerability, especially the first and second ring roads, whose grade and betweenness centrality are higher than others in the urban road network. In comparison, some roads located at the periphery of the city have high vulnerability due to their long distance from the urban center and their lower grades.
According to the vulnerability indices of different road segments, their spatial patterns can be further identified to detect the high-value or low-value concentration area of road vulnerability (Figure 7). Roads in the low-vulnerability area (L), when attacked, easily severely affect the overall network, while the failure of roads in the high-vulnerability area (H) has a relatively small impact on the overall network. From a global perspective, the vulnerability of the road network in the study area has a Moran’s I of 0.2929, which has a Z value of 12.567 and passes the significance test, thereby indicating spatial clustering in the distribution of road vulnerability. From a local perspective, the results of a Getis-Ord G i * statistical analysis (Figure 7) show that areas H①, H②, H④, and H⑤ are high-value concentration areas of road vulnerability; they are located at the periphery of the city, where a road failure has little impact on the main urban traffic efficiency. The roads in area H③ are of low grade, are far from the city’s important roads, and have a low utilization rate; hence, this area is also a high-value concentration area of road vulnerability. Areas L①, L②, and L③ are low-value concentration areas of road vulnerability. Areas L① and L③ are located near the intersection of ring roads and arterial roads; therefore, these roads are important roads connecting the east and west of the city. Additionally, the roads have a high grade and a high driving speed, and therefore an overall high load. The roads in area L② are located in the urban center and are short. Therefore, the speed only slightly affects the travel time on these roads, and the utilization rate is high. Consequently, a failure of some of these roads greatly affects the overall road traffic efficiency.

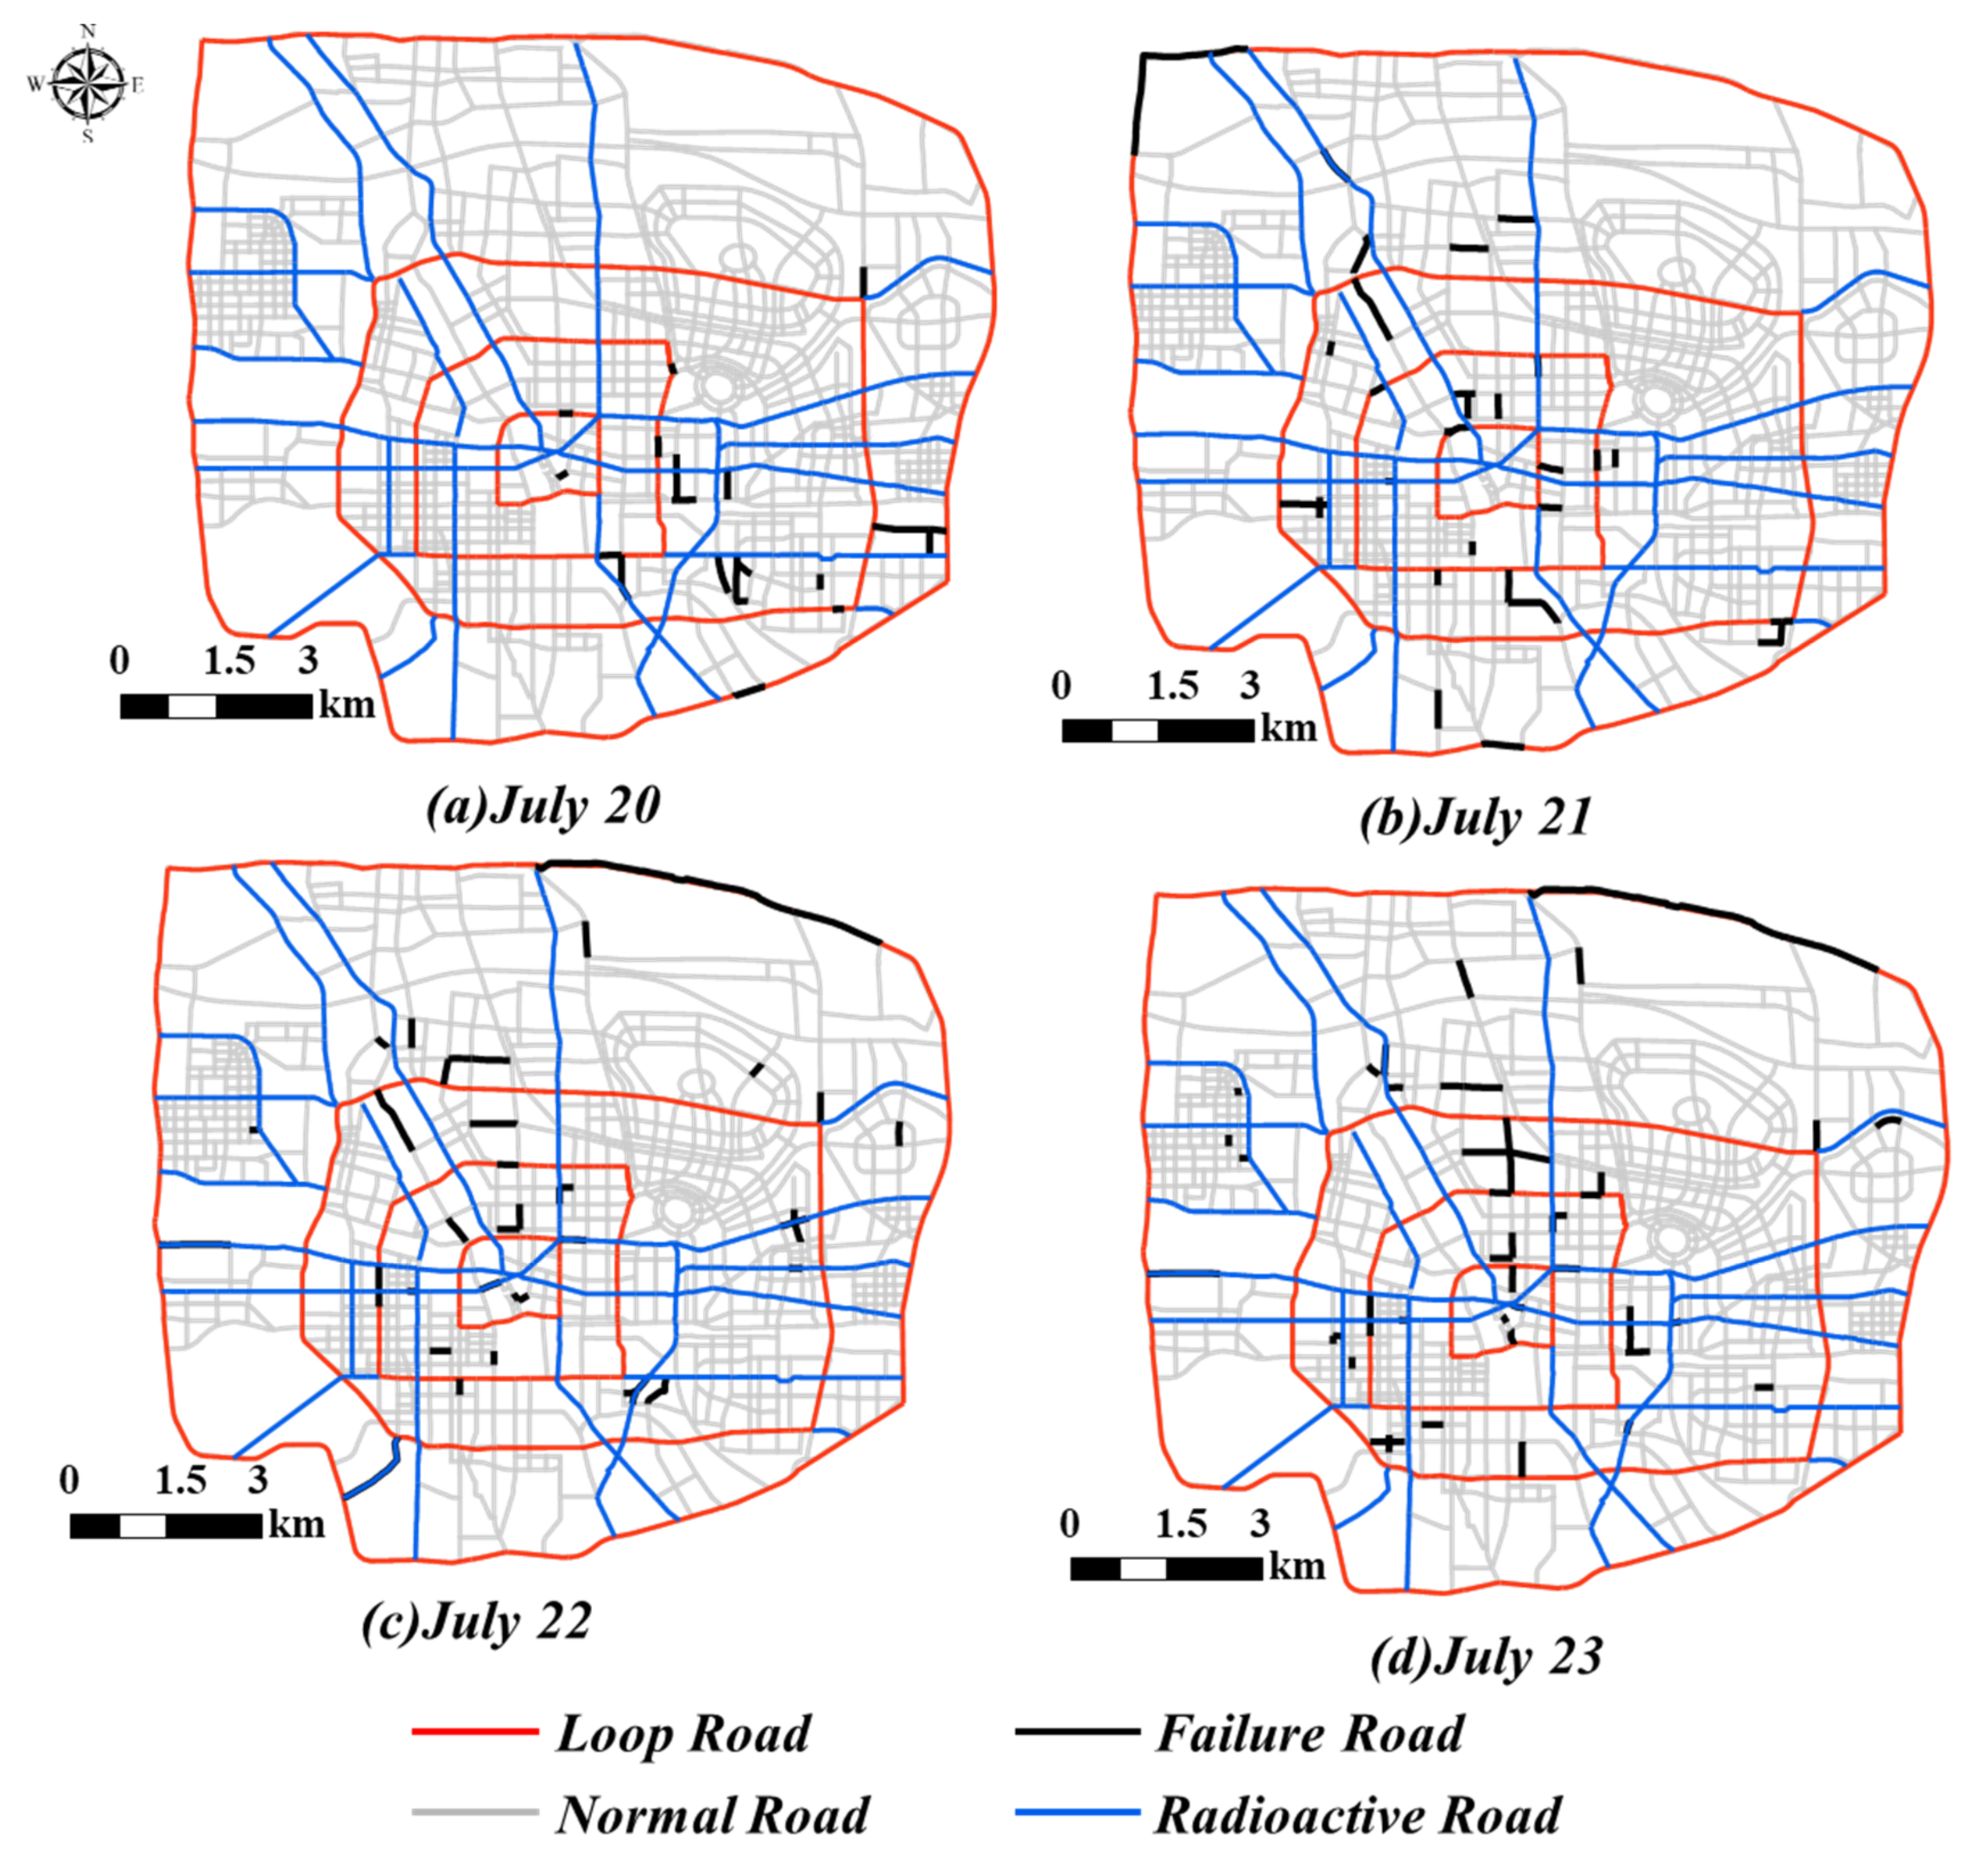
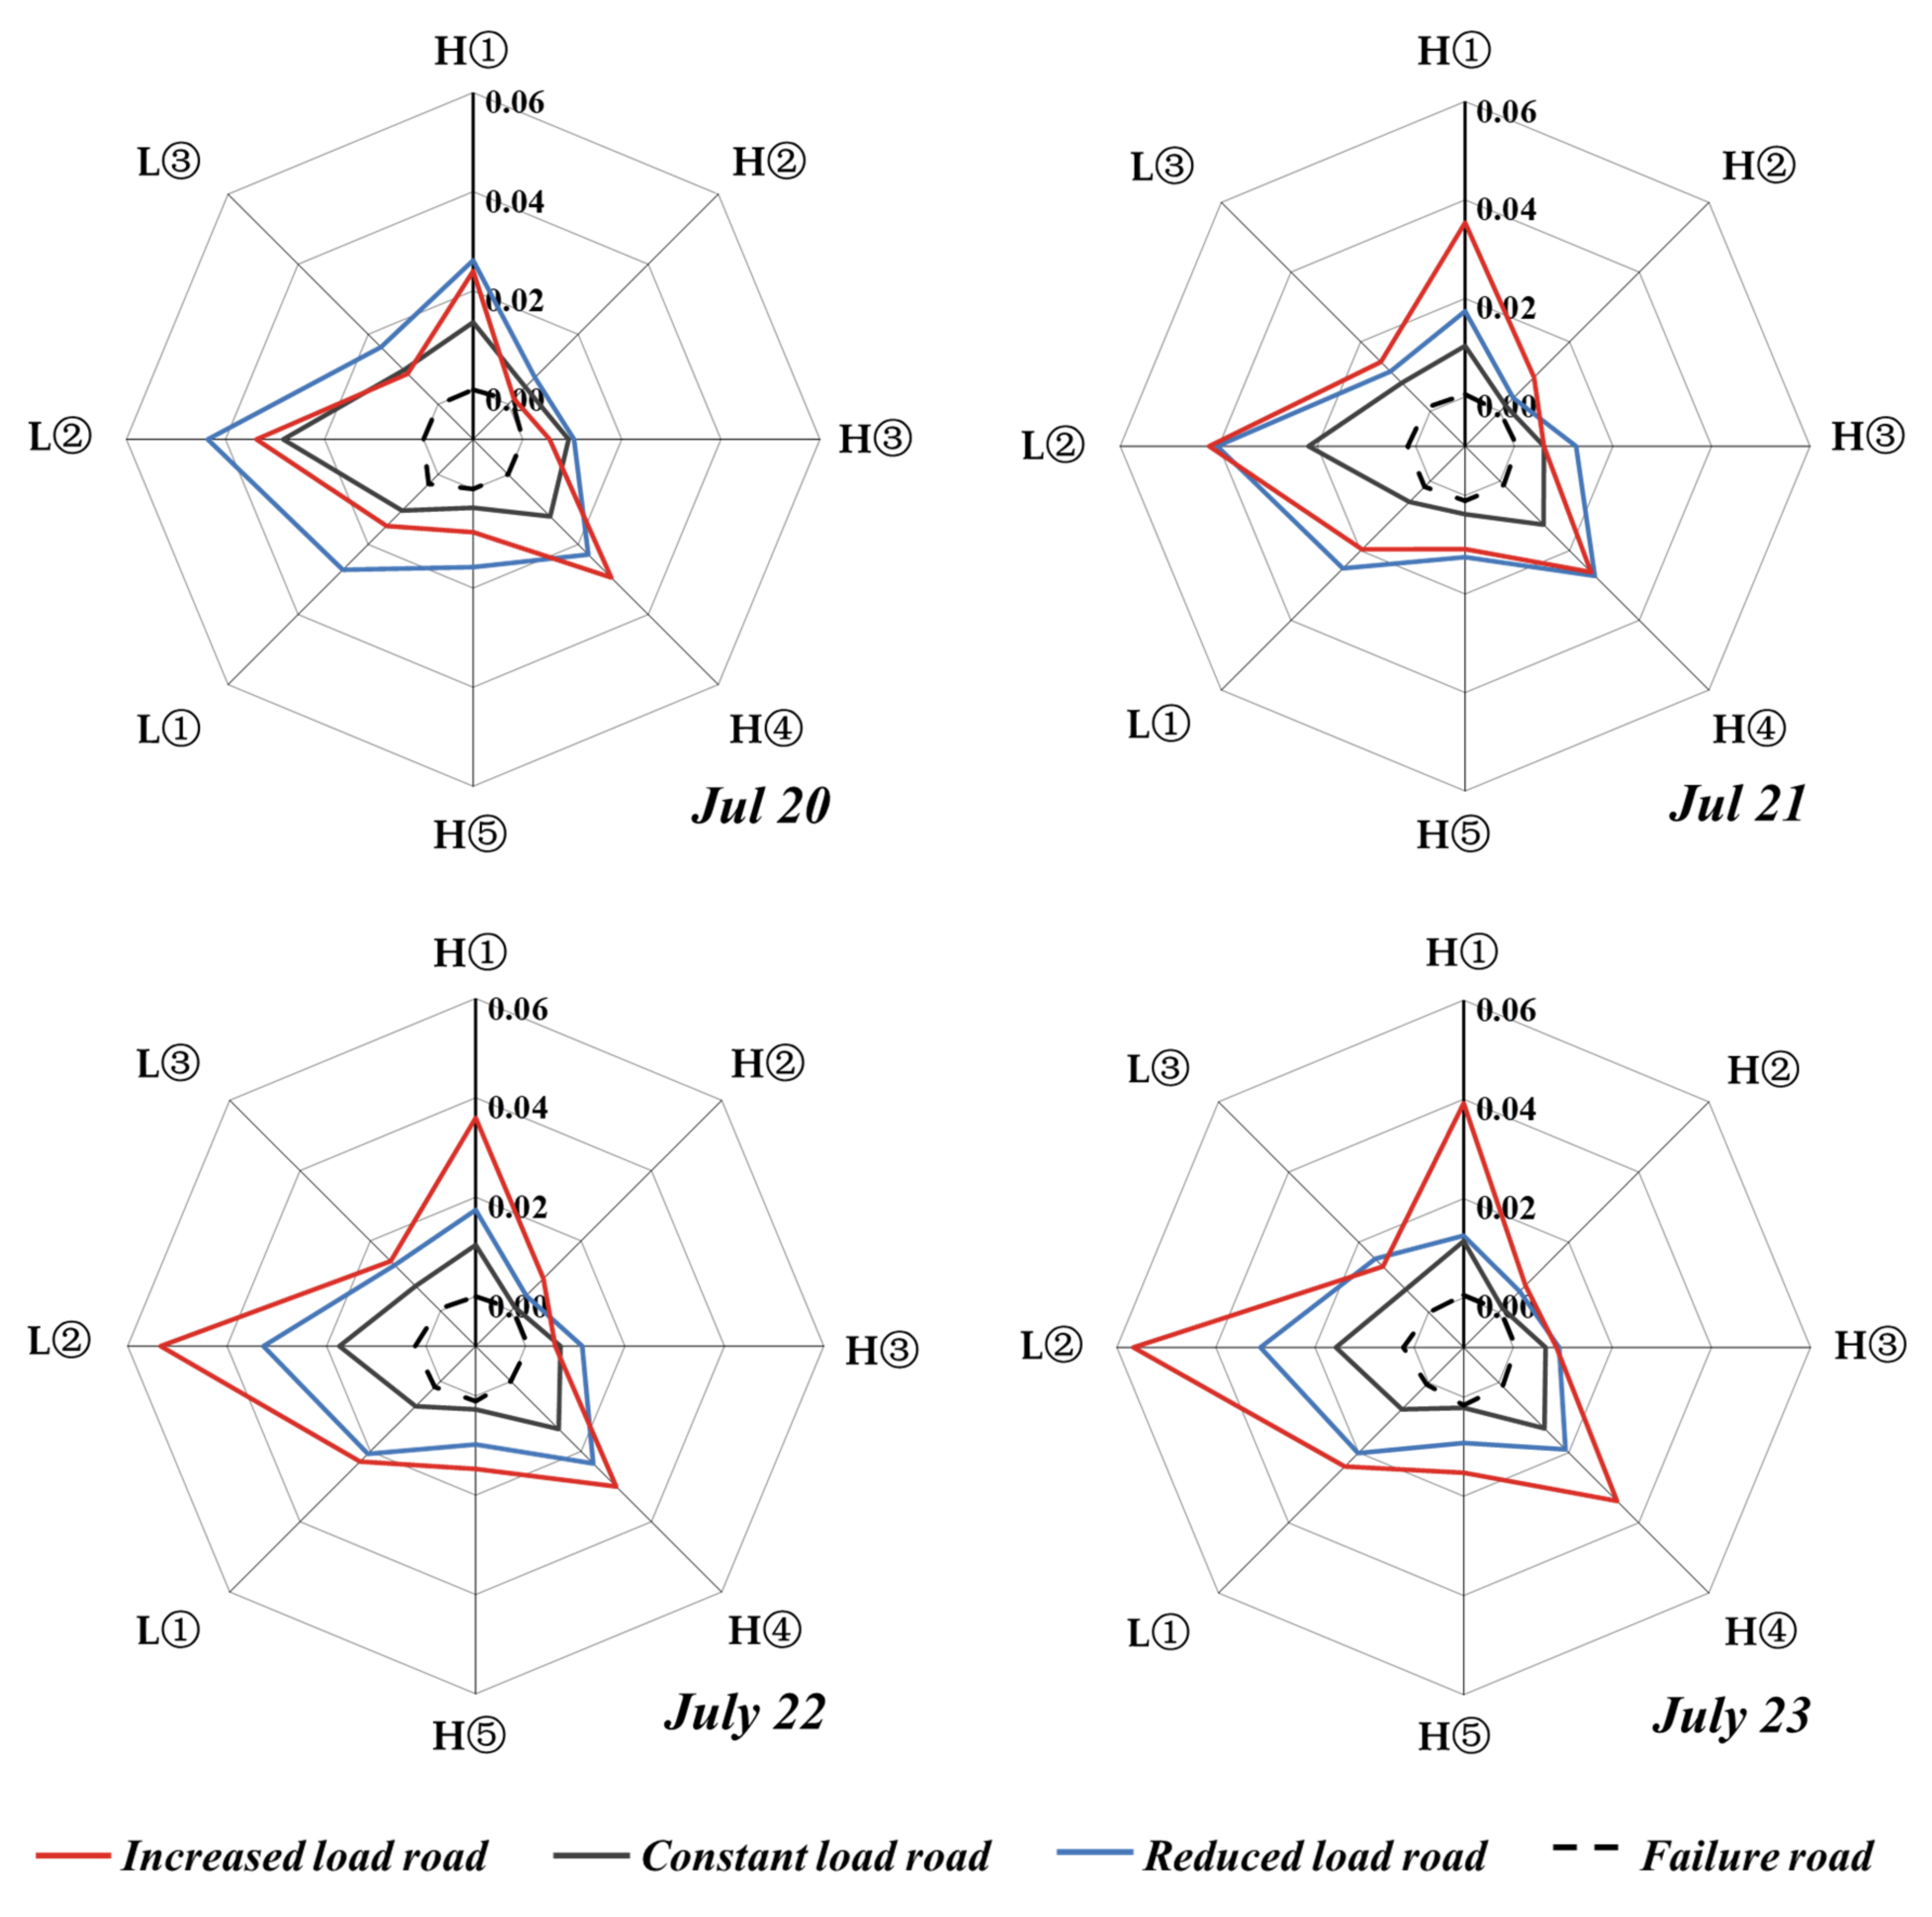
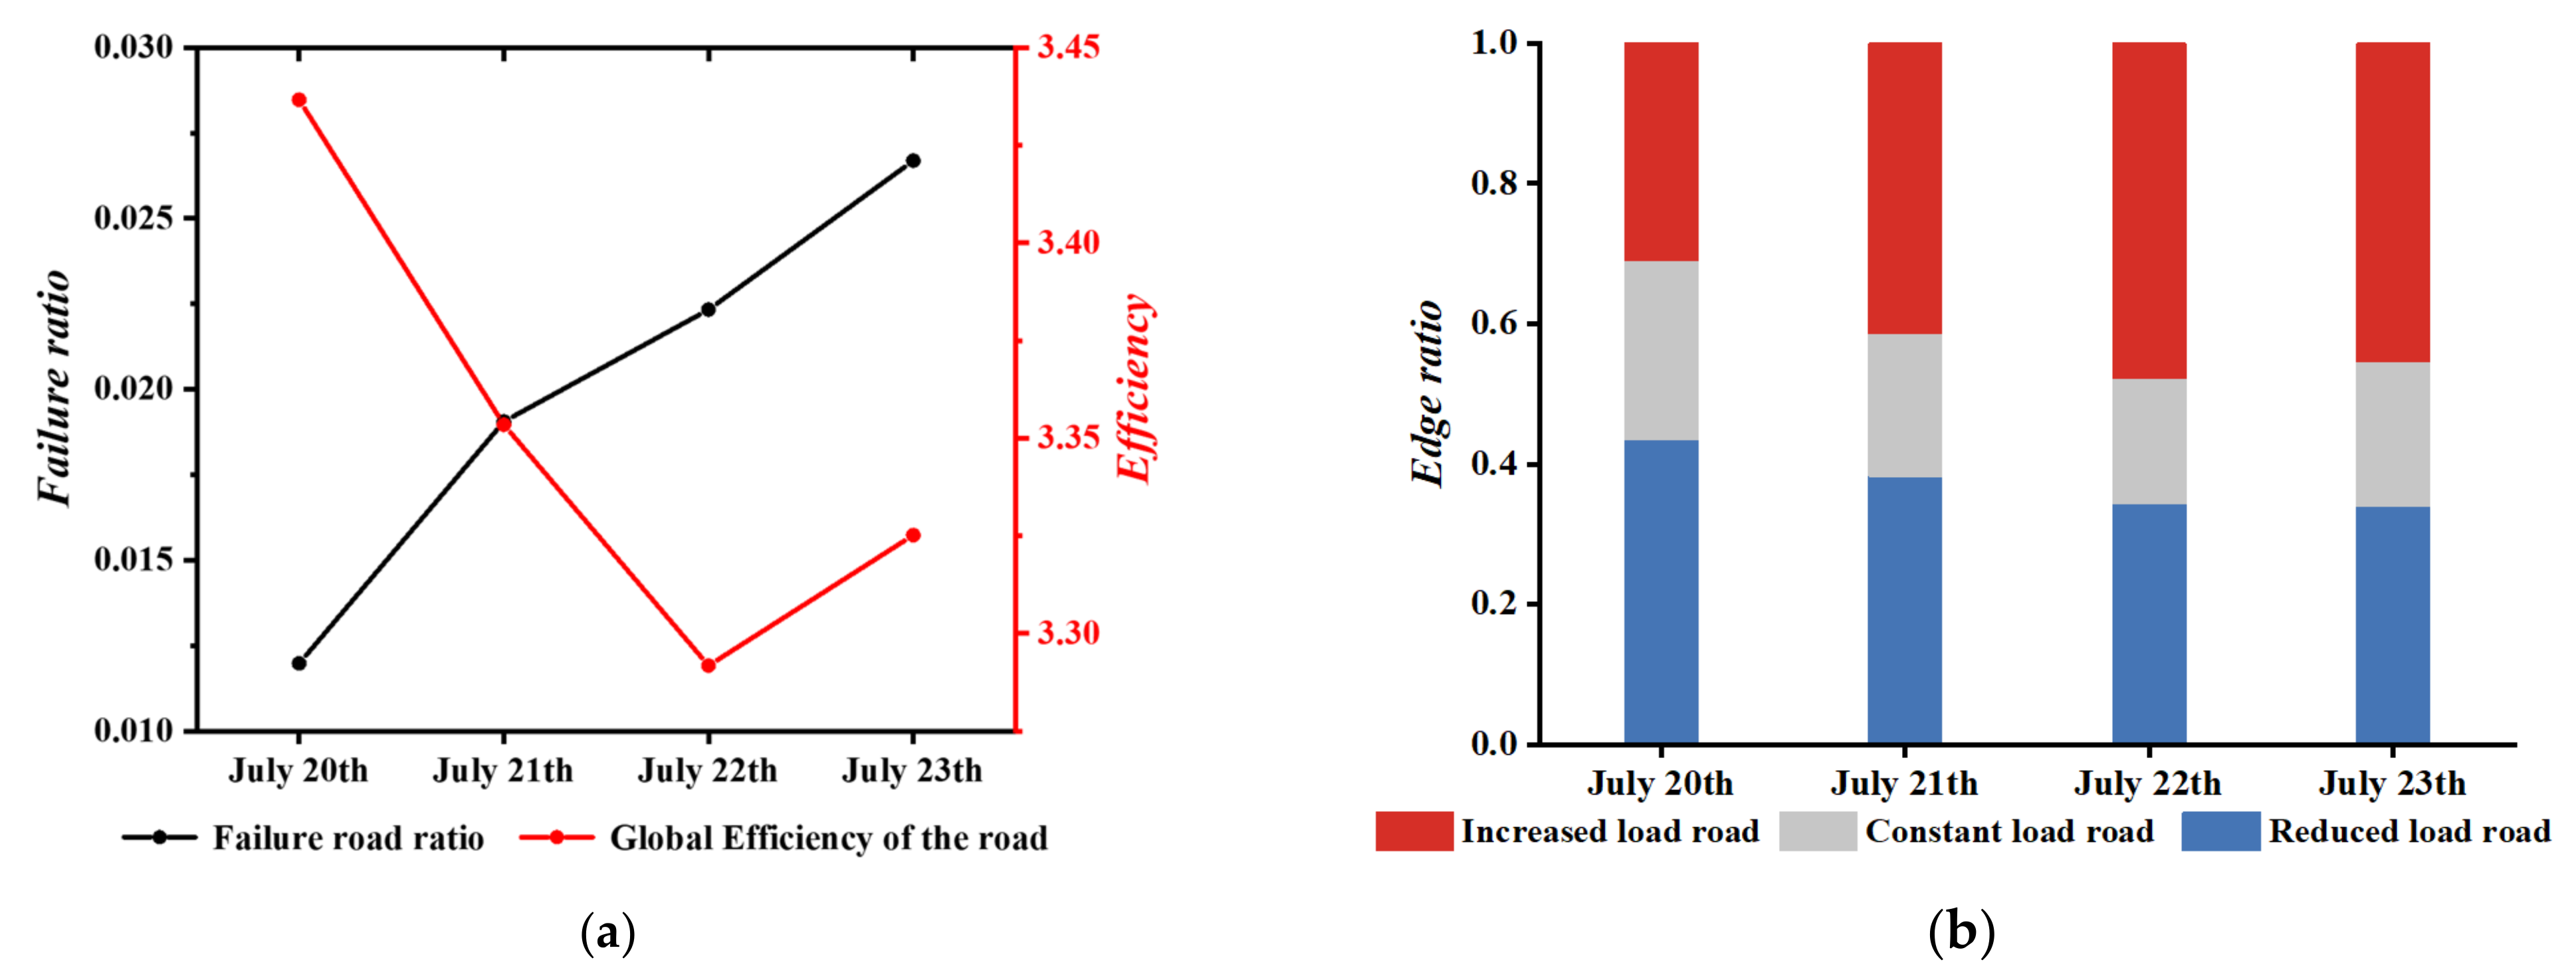
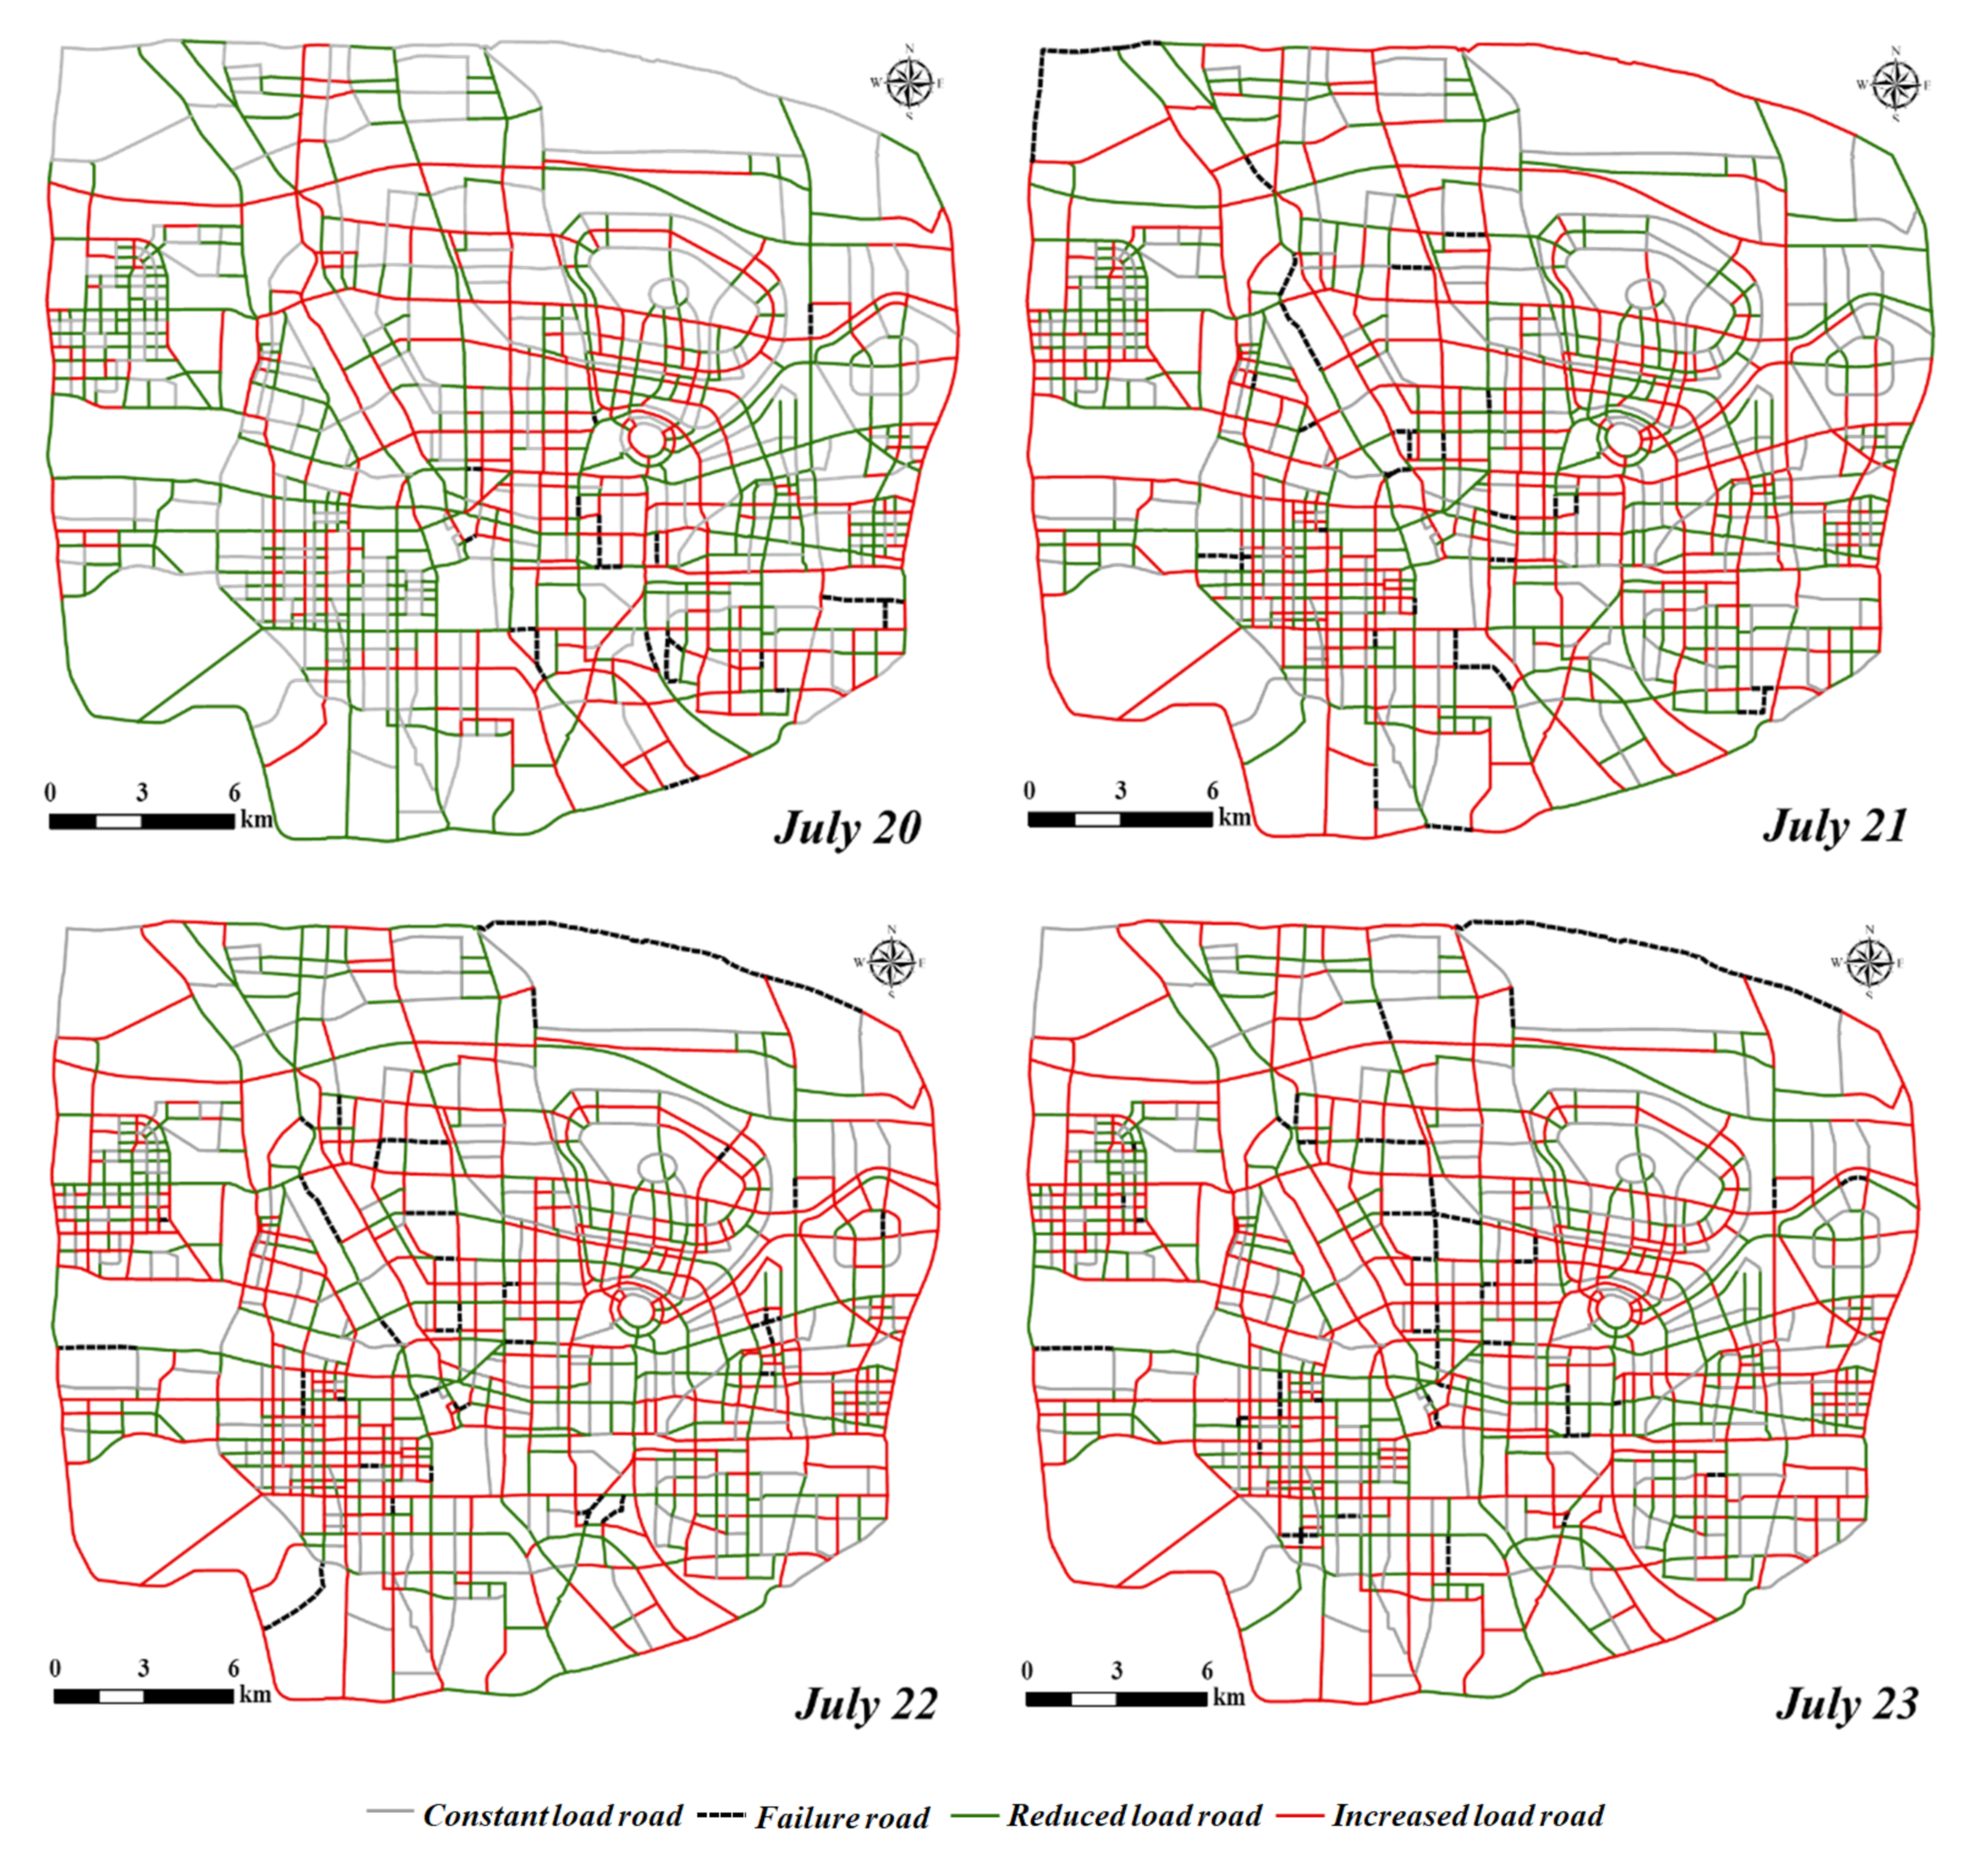
4.3. Spatiotemporal Patterns of the Road Network Cascade Failure

Road failure in areas with different vulnerabilities damages the overall road network to varying degrees; such damage is especially pronounced during sudden rainstorms. As shown in Figure 8a, during the rainstorm, the proportion of road segment failures increased from 1.20% to 2.67%, and the proportion of affected roads continued to increase. Thus, road traffic efficiency significantly decreased at the beginning of the rainstorm from 3.44 on 20 July to 3.29 on 22 July. Network efficiency rebounded to a certain extent after 22 July, possibly because after the roads were damaged, the load on the high-grade roads that remained operational increased continuously, and the network structure was affected by the gradual increase in the number of failed road segments. Consequently, the network diameter and the traffic time on some road segments decreased, thereby increasing network efficiency. When a network is damaged by rainstorms, high-grade roads, which have a short travel time, are greatly affected, while low-grade, short roads, which are the most numerous, are less affected. In terms of road load, as shown in Figure 8b, from 20 July to 22 July, the number of road segments with an increasing load increased from 30.66% on 20 July to 46.46% on 22 July; the proportion of such road segments on 23 July was slightly lower than that on 22 July. Overall, the change trend in network global efficiency was opposite to that in the proportion of roads with an increasing load and consistent with that in the proportion of roads with a decreasing load.
To examine the spatiotemporal patterns of the road network cascade failure in the study area, Figure 9 presents the result for the road network cascade failure model. In terms of spatial distribution, the number of road segments with increased loads caused by rainstorms increased gradually (Figure 9). On 20 July, there were only a few failed roads, concentrated mainly in the southeastern part of the study area, and the affected road segments were mostly in the eastern part of the city. With a continuous increase in the number of failed road segments, their spatial distribution evolved from a concentrated distribution in local areas to a pattern in which they were mainly in the urban center and distributed in surrounding areas, resulting in the expansion of the affected roads to the entire study area. High-grade roads have a high speed and a short traffic time; hence, their load increases almost entirely. On 22 July, 46.46% of the road segments were affected by the failed road segments, spatially dominated by urban ring roads and radial roads; and including ordinary roads connected to urban ring roads, radial roads, and failed roads. On 23 July, more than 50% of road segments significantly increased in load.

4.4. Spatial Association between the Road Vulnerability and Cascading Failure Distribution

According to the variation in road load with the cascading failure of the road network, the association between different road vulnerability areas and road network cascading failure distributions is analyzed. As shown in Figure 10, overall, the proportion of road segments with increased load road in the low-vulnerability areas (L①, L②, and L③) was 2.64% on average, and the proportion of road segments with increased loads in the high-vulnerability areas (H①, H②, H③, H④ and H⑤) was 1.79%. The load increase in low-vulnerability areas was significantly higher than that in high-vulnerability areas. The proportion of road segments with increased loads had a maximum of 5.67% in the low-vulnerability areas, which appeared in area L② on 23 July, and a maximum of 3.92% in the high-vulnerability areas (H①). As the rainstorm continued, the number of failed road segments increased, and the proportion of road segments with increased loads in areas with different vulnerabilities changed accordingly. On 20 July, the largest proportion of road segments with increased loads was 3.38% in the low-vulnerability area L② and 2.94% in the high-vulnerability area H①. On 21 July, the proportion of road segments with increased loads was large in H① (3.54%) and H④ because of the connection with the ring roads and urban arterial roads, and it was large in L② because of the connection with the main urban area. From 22 to 23 July, the proportion of road segments with increased loads in areas H④ and L② continued to increase. To analyze the correlation between the road network’s cascading failure caused by the rainstorm and the vulnerability of the road segments, the Pearson correlation coefficients between the proportion of the failed roads and the proportion of road segments with increased loads in areas with different vulnerabilities are further calculated. The correlation coefficient for the hot spot area of road vulnerability is −0.265, indicating that in this area, as the number of failed roads increased, the proportion of road segments with increased loads decreased, and the road cascading failure had a relatively low impact on the road network. In the cold spot area of road vulnerability, the proportion of road segments with increased loads and the proportion of failed road segments are positively correlated with a correlation coefficient of 0.651, indicating that in this area, the cascading failure of road segments was more likely to cause large-scale traffic congestion or disruption. The areas with clustered low vulnerability are more likely to be affected during rainstorms, and the road network’s cascading failure caused by rainstorms presents different correlation characteristics in different areas with clustered road vulnerability. The above correlation coefficients passed the significance test of p = 0.05.

5. Discussion

Road vulnerability is an important indicator reflecting the robustness of road networks. The analysis of road vulnerability reveals that the low-value concentration area of road vulnerability is located in the urban center and that the high-value concentration area of road vulnerability is located in the peripheral area of the city. In fact, road vulnerability is influenced by a variety of factors. The correlation coefficients of road length, travel time, and distance from the urban center are calculated for roads in the concentration and nonsignificant areas of vulnerability distribution, as shown in Table 5. Compared with the nonsignificant areas of vulnerability distribution, the road vulnerability in the concentration areas strongly correlates with the distance from the urban center and the road length; i.e., the closer the road is to the urban center and the shorter the road length, the lower the road vulnerability, and the local disruption of the road network more greatly affects the overall road network. Road vulnerability is positively correlated with the travel time in the concentration areas of vulnerability distribution, and the shorter the travel time, the lower the road vulnerability, but the correlation coefficient is slightly smaller than that for the nonsignificant areas. Meanwhile, the larger the distance from the urban center, or the longer the road length and the longer the travel time, the higher the road vulnerability, the better the robustness of the road network, and the smaller the impact of local failure on the overall road network. In the nonsignificant area of vulnerability distribution, road length and distance from the urban center weakly correlate with road vulnerability.
The effect of different network weights on road vulnerability is further analyzed by using road segment lengths as network weights (Figure 11). Overall, the distribution of the number of roads with length-based vulnerabilities is similar to the distribution of the number of roads with time-based vulnerabilities, with most road segments having vulnerabilities below one. However, length-based road vulnerabilities have an average of 0.9997, which is greater than the average of time-based road vulnerabilities (0.9991), and the maximum and minimum length-based road vulnerabilities are 1.0009 and 0.9930, respectively. In terms of distribution, roads with length-based vulnerabilities are more concentrated than those with time-based vulnerabilities, and hence, the differential distribution of road vulnerabilities is not fully reflected. Because of differences in road grades, different road segments have different traffic speeds. Therefore, the travel times on road segments with the same length differ significantly, resulting in a more pronounced difference in the distribution of road vulnerabilities.
By analyzing the vulnerability of the road network and identifying areas with high and low road vulnerabilities, different planning policies and management measures can be implemented in urban road system planning and disaster emergency management. Areas with high road vulnerability are mainly located at the periphery of a city. The network structure of these areas should be further optimized during planning, with roads in these areas used as backup evacuation routes, and traffic guidance should be carried out during emergency management to reduce the traffic pressure in local areas. For areas with low road vulnerability, it is necessary for urban governments to build more new roads, extend the length of existing roads, and increase the number of roads and the density of the road network to improve the robustness of the road network. The optimization on urban spatial structure to build a polycentric city could reduce the impact of the distance from the urban center on road vulnerability. In emergency management, the management and control of traffic conditions must be strengthened in areas with low road vulnerability to achieve rapid response and traffic diversion in the event of a sudden disruption, and to avoid large-scale regional traffic congestion and disruption, thereby improving the emergency response capability of the city in the face of emergencies, building a more resilient city, and promoting sustainable urban development.

6. Conclusions

Road failure caused by natural disasters or traffic emergencies not only leads to an increase in the load of surrounding roads and a decrease in the traffic efficiency of a network, but also causes traffic congestion or disruption, which severely affects urban traffic and emergency response. Based on the road network data for Zhengzhou, this study calculates road vulnerability in terms of the global efficiency of the network, analyzes the spatial distribution of road vulnerability, and further investigates the spatial pattern of road vulnerability in Zhengzhou by using the Getis-Ord G i * statistic. Based on the actual road disruption locations caused by waterlogging during the 20–23 July rainstorm in the study area, the spatiotemporal pattern of the cascading failure of the road network is analyzed using the improved cascading failure model by using the between centrality index to represent the road load, and the spatial association characteristics of road vulnerability and cascading failure distribution are discussed.
Overall, the vulnerability of most road segments in the study area is less than one, and their disruption leads to a decrease in network global efficiency. The average vulnerability is 0.9991, and the vulnerability of roads of different grades differs significantly. In terms of spatial distribution, the spatial heterogeneity characteristics of the vulnerability of different road segments are significant. Specifically, the vulnerability of roads near the urban ring roads and the urban center is generally low, while roads with high vulnerability are located mainly at the periphery of the city; the road vulnerability in the east–west and north–south axes shows the distribution characteristics as being high in the middle and low at both ends; and five areas with high road vulnerability and three areas with low vulnerability are identified. During rainstorms, the proportion of failed road segments increased from 1.2% to 2.67%, and the network efficiency significantly declined at first and then slightly rebounded; the road loads showed a change trend that was essentially consistent with that of network efficiency, and the pattern of their spatial distribution evolved from a concentration in local areas to dominance in the urban center with distribution in the surrounding areas. In areas with different road vulnerability concentrations, the proportion of disrupted roads and the proportion of road segments with increased loads exhibited different correlation characteristics: negative correlation in high-value areas, where the cascading failure of roads had relatively little impact on the network, and positive correlation in low-value areas, where the cascading failure of roads was more likely to cause traffic congestion or disruption in large regions.
Transportation resiliency, and more specifically road vulnerability in our case, is a crucial factor in sustainability and post-disaster management of cities. The unpredictable nature of extreme events such as rainstorm can have a substantial impact on urban road systems. This study identified the vulnerability area and uncovered the spatiotemporal patterns of the cascade failure on the road network under real rainstorm conditions. Although conventional studies have used a stochastic approach by removing some of the network edges, we preferred to adopt this deterministic approach as a real scenario. The main advantages of our method are as follows. First, the paper identified the spatial cluster patterns of road network vulnerability by using the global efficiency index and the Getis-Ord G i * statistic. Second, the spatiotemporal pattern of the cascading failure of the road network is analyzed using the cascading failure model, which is improved by replacing the conventional traffic volume with the betweenness centrality index in the complex network as a measure of road load capacity. Thirdly, the spatial association between the road vulnerability and cascading failure distribution is carefully explored. The method enhanced the research on the spatiotemporal patterns of the road network vulnerability and cascade failure and their spatial association from a spatial perspective.
The analysis of the spatial distribution of urban road vulnerability, as well as the discussion of the spatial association characteristics of cascading failure and road vulnerability distribution in the context of actual rainstorms, make it possible to adopt more targeted policies and strategy in urban planning and disaster emergency management, allowing us to build more resilient cities and promote sustainable urban development. For example, it is important to strengthen traffic monitoring in vulnerable areas to improve the ability to quickly respond to disruptions. Urban planners should consider extending the overall road length or increasing road network density to enhance the road network’s robustness. However, to gain more insights and arrive at more conclusions, further studies and applications of the following three topics should be performed: (i) to analyze the impact of the road network structure on the vulnerability and cascading failure of roads by considering the other factors such as economic, social, and environmental factors, etc.; (ii) to optimize the road network from the perspective of improving road robustness to enhance the transportation emergency response capability of cities in the face of emergencies; (iii) to extend the method to other infrastructure networks such as power networks to provide theoretical and methodological support for disaster prevention and post-disaster rescue.

Author Contributions

Conceptualization, Zhigang Han and Qirui Wu; methodology, Qirui Wu and Zhigang Han; software, Qirui Wu and Feng Liu; validation, Caihui Cui and Zhigang Han; formal analysis, Caihui Cui; investigation, Qirui Wu and Yifan Zhao; resources, Feng Liu and Yifan Zhao; data curation, Yifan Zhao and Zhaoxin Xie; writing—original draft preparation, Qirui Wu; writing—review and editing, Zhigang Han and Caihui Cui; visualization, Yifan Zhao and Zhaoxin Xie; supervision, Zhigang Han; project administration, Caihui Cui; and funding acquisition, Zhigang Han. All authors have read and agreed to the published version of the manuscript.

Funding

This research was funded by the National Natural Science Foundation of China, grant number 41871316 and U21A2014; the National Key Research and Development Program of China, grant number 2021YFE0106700; the Science and Technology Foundation of Henan Province, grant number 212102310421; Open Project Fund of the Key Laboratory of Soil and Water Conservation on Loess Plateau, Ministry of Water Resources, Yellow River Institute of Hydraulic Research, grant number 202201; and the Natural Resources Science and Technology Innovation Project of Henan Province, China, grant number 202016511.

Institutional Review Board Statement

Not applicable.

Informed Consent Statement

Not applicable.

Data Availability Statement

Data available on request in order to protect research participants’ privacy.

Acknowledgments

Special thanks go to the editor and anonymous reviewers of this paper for their constructive comments.

Conflicts of Interest

The authors declare no conflict of interest.

References

  1. Papilloud, T.; Keiler, M. Vulnerability patterns of road network to extreme floods based on accessibility measures. Transp. Res. Part D Transp. Environ. 2021, 100, 103045. [Google Scholar] [CrossRef]
  2. Papalexiou, S.M.; Montanari, A. Global and regional increase of precipitation extremes under global warming. Water Resour. Res. 2019, 55, 4901–4914. [Google Scholar] [CrossRef]
  3. Hasan, S.; Foliente, G. Modeling infrastructure system interdependencies and socioeconomic impacts of failure in extreme events: Emerging R&D challenges. Nat. Hazards 2015, 78, 2143–2168. [Google Scholar]
  4. Bubeck, P.; Dillenardt, L.; Alfieri, L.; Feyen, L.; Thieken, A.H.; Kellermann, P. Global warming to increase flood risk on European railways. Clim. Change 2019, 155, 19–36. [Google Scholar] [CrossRef]
  5. Weiner, E. Urban Transportation Planning in the United States; Springer: Berlin/Heidelberg, Germany, 1987. [Google Scholar]
  6. Cleophas, C.; Cottrill, C.; Ehmke, J.F.; Tierney, K. Collaborative urban transportation: Recent advances in theory and practice. Eur. J. Oper. Res. 2019, 273, 801–816. [Google Scholar] [CrossRef]
  7. Wang, Q.; Nie, X. A stochastic programming model for emergency supply planning considering transportation network mitigation and traffic congestion. Socio Econ. Plan. Sci. 2022, 79, 101119. [Google Scholar] [CrossRef]
  8. Busari, A.; Loto, R.; Ajayi, S.; Odunlami, O.; Folake, A.; Kehinde, O.; Olawuyi, O. Ameliorating urban traffic congestion for sustainable transportation. In Proceedings of the IOP Conference Series: Materials Science and Engineering; IOP Publishing: Bristol, UK, 2021; p. 012102. [Google Scholar]
  9. Zhao, J.; Li, D.; Sanhedrai, H.; Cohen, R.; Havlin, S. Spatio-temporal propagation of cascading overload failures in spatially embedded networks. Nat. Commun. 2016, 7, 10094. [Google Scholar] [CrossRef] [Green Version]
  10. Berdica, K. An introduction to road vulnerability: What has been done, is done and should be done. Transp. Policy 2002, 9, 117–127. [Google Scholar] [CrossRef]
  11. Jenelius, E.; Petersen, T.; Mattsson, L.-G. Importance and exposure in road network vulnerability analysis. Transp. Res. Part A Policy Pract. 2006, 40, 537–560. [Google Scholar] [CrossRef]
  12. Jenelius, E.; Mattsson, L.-G. Road network vulnerability analysis: Conceptualization, implementation and application. Comput. Environ. Urban Syst. 2015, 49, 136–147. [Google Scholar] [CrossRef]
  13. Xiao, F.; Li, J.; Wei, B. Cascading failure analysis and critical node identification in complex networks. Phys. A Stat. Mech. Its Appl. 2022, 596, 127117. [Google Scholar] [CrossRef]
  14. Wang, S.; Chen, C.; Zhang, J.; Gu, X.; Huang, X. Vulnerability assessment of urban road traffic systems based on traffic flow. Int. J. Crit. Infrastruct. Prot. 2022, 38, 100536. [Google Scholar] [CrossRef]
  15. Noor, M.A.; Ashrafi, S.; Fattah, M.A.; Morshed, S.R.; Rahman, S. Assessment of traffic congestion scenario at the CBD areas in a developing city: In the context of Khulna City, Bangladesh. Transp. Res. Interdiscip. Perspect. 2021, 11, 100435. [Google Scholar] [CrossRef]
  16. Zhou, A.; Peeta, S.; Yang, M.; Wang, J. Cooperative signal-free intersection control using virtual platooning and traffic flow regulation. Transp. Res. Part C Emerg. Technol. 2022, 138, 103610. [Google Scholar] [CrossRef]
  17. Wei, H.; Zheng, G.; Gayah, V.; Li, Z. Recent advances in reinforcement learning for traffic signal control: A survey of models and evaluation. ACM SIGKDD Explor. Newsl. 2021, 22, 12–18. [Google Scholar] [CrossRef]
  18. Du, Y.; ShangGuan, W.; Chai, L. A coupled vehicle-signal control method at signalized intersections in mixed traffic environment. IEEE Trans. Veh. Technol. 2021, 70, 2089–2100. [Google Scholar] [CrossRef]
  19. Tian, J.; Fang, H.; Liu, J.; Zhao, F.; Ren, C. Robustness analysis of urban street networks using complex network method. Geomat. Inf. Sci. Wuhan Univ. 2019, 44, 771–777. [Google Scholar]
  20. Duan, Y.; Lu, F. Robustness analysis of city road network at different granularities. In Space-Time Integration in Geography and GIScience; Springer: Dordrecht, The Netherlands, 2015; pp. 127–143. [Google Scholar]
  21. Scott, D.M.; Novak, D.C.; Aultman-Hall, L.; Guo, F. Network robustness index: A new method for identifying critical links and evaluating the performance of transportation networks. J. Transp. Geogr. 2006, 14, 215–227. [Google Scholar] [CrossRef]
  22. Zhang, J.; Xu, X.; Hong, L.; Wang, S.; Fei, Q. Networked analysis of the Shanghai subway network, in China. Phys. A Stat. Mech. Its Appl. 2011, 390, 4562–4570. [Google Scholar] [CrossRef]
  23. Yang, Y.; Liu, Y.; Zhou, M.; Li, F.; Sun, C. Robustness assessment of urban rail transit based on complex network theory: A case study of the Beijing Subway. Saf. Sci. 2015, 79, 149–162. [Google Scholar] [CrossRef]
  24. Xing, Y.; Lu, J.; Chen, S.; Dissanayake, S. Vulnerability analysis of urban rail transit based on complex network theory: A case study of Shanghai Metro. Public Transp. 2017, 9, 501–525. [Google Scholar] [CrossRef]
  25. Bellingeri, M.; Bevacqua, D.; Scotognella, F.; Zhe-Ming, L.; Cassi, D. Efficacy of local attack strategies on the Beijing road complex weighted network. Phys. A Stat. Mech. Its Appl. 2018, 510, 316–328. [Google Scholar] [CrossRef]
  26. Brown, G.G.; Carlyle, W.M.; Salmeron, J.; Wood, K. Analyzing the vulnerability of critical infrastructure to attack and planning defenses. In Emerging Theory, Methods, and Applications; Informs: Catonsville, MD, USA, 2005; pp. 102–123. [Google Scholar]
  27. Sun, S.; Liu, Z.; Chen, Z.; Yuan, Z. Error and attack tolerance of evolving networks with local preferential attachment. Phys. A Stat. Mech. Its Appl. 2007, 373, 851–860. [Google Scholar] [CrossRef]
  28. Watts, D.J.; Strogatz, S.H. Collective dynamics of ‘small-world’networks. Nature 1998, 393, 440–442. [Google Scholar] [CrossRef] [PubMed]
  29. Berche, B.; Holovatch, T.; Holovatch, Y.; von Ferber, C. A tale of two cities. Vulnerabilities of the London and Paris transit networks. J. Transp. Secur. 2012, 5, 199–216. [Google Scholar]
  30. Latora, V.; Marchiori, M. Is the Boston subway a small-world network? Phys. A Stat. Mech. Its Appl. 2002, 314, 109–113. [Google Scholar] [CrossRef] [Green Version]
  31. Getis, A. Reflections on spatial autocorrelation. Reg. Sci. Urban Econ. 2007, 37, 491–496. [Google Scholar] [CrossRef]
  32. Balijepalli, C.; Oppong, O. Measuring vulnerability of road network considering the extent of serviceability of critical road links in urban areas. J. Transp. Geogr. 2014, 39, 145–155. [Google Scholar] [CrossRef]
  33. Motter, A.E.; Lai, Y.-C. Cascade-based attacks on complex networks. Phys. Rev. E 2002, 66, 065102. [Google Scholar] [CrossRef] [Green Version]
  34. Kinney, R.; Crucitti, P.; Albert, R.; Latora, V. Modeling cascading failures in the North American power grid. Eur. Phys. J. B Condens. Matter Complex Syst. 2005, 46, 101–107. [Google Scholar] [CrossRef]
  35. Ren, W.; Wu, J.; Zhang, X.; Lai, R.; Chen, L. A stochastic model of cascading failure dynamics in communication networks. IEEE Trans. Circuits Syst. II Express Briefs 2018, 65, 632–636. [Google Scholar] [CrossRef]
  36. Fu, X.; Yang, Y. Modeling and analyzing cascading failures for Internet of Things. Inf. Sci. 2021, 545, 753–770. [Google Scholar] [CrossRef]
  37. Buzna, L.; Peters, K.; Helbing, D. Modelling the dynamics of disaster spreading in networks. Phys. A Stat. Mech. Its Appl. 2006, 363, 132–140. [Google Scholar] [CrossRef]
  38. Weng, W.G.; Ni, S.J.; Yuan, H.Y.; Fan, W.C. Modeling the dynamics of disaster spreading from key nodes in complex networks. Int. J. Mod. Phys. C 2007, 18, 889–901. [Google Scholar] [CrossRef]
  39. Duan, D.; Lv, C.; Si, S.; Wang, Z.; Li, D.; Gao, J.; Havlin, S.; Stanley, H.E.; Boccaletti, S. Universal behavior of cascading failures in interdependent networks. Proc. Natl. Acad. Sci. USA 2019, 116, 22452–22457. [Google Scholar] [CrossRef]
  40. Chen, C.; Xu, L.; Zhao, D.; Xu, T.; Lei, P. A new model for describing the urban resilience considering adaptability, resistance and recovery. Saf. Sci. 2020, 128, 104756. [Google Scholar] [CrossRef]
  41. Wang, X.F.; Xu, J. Cascading failures in coupled map lattices. Phys. Rev. E 2004, 70, 056113. [Google Scholar] [CrossRef]
  42. Zheng, J.-F.; Gao, Z.-Y.; Zhao, X.-M. Modeling cascading failures in congested complex networks. Phys. A Stat. Mech. Its Appl. 2007, 385, 700–706. [Google Scholar] [CrossRef]
  43. Lu, Q.C.; Zhang, L.; Xu, P.C.; Cui, X.; Li, J. Modeling network vulnerability of urban rail transit under cascading failures: A Coupled Map Lattices approach. Reliab. Eng. Syst. Saf. 2022, 221, 108320. [Google Scholar] [CrossRef]
  44. Shen, Y.; Ren, G.; Ran, B. Cascading failure analysis and robustness optimization of metro networks based on coupled map lattices: A case study of Nanjing, China. Transportation 2021, 48, 537–553. [Google Scholar] [CrossRef]
  45. Wu, J.; Gao, Z.; Sun, H. Effects of the cascading failures on scale-free traffic networks. Phys. A Stat. Mech. Its Appl. 2007, 378, 505–511. [Google Scholar] [CrossRef]
  46. Wu, J.; Sun, H.; Gao, Z. Cascading failures on weighted urban traffic equilibrium networks. Phys. A Stat. Mech. Its Appl. 2007, 386, 407–413. [Google Scholar] [CrossRef]
  47. Dui, H.; Meng, X.; Xiao, H.; Guo, J. Analysis of the cascading failure for scale-free networks based on a multi-strategy evolutionary game. Reliab. Eng. Syst. Saf. 2020, 199, 106919. [Google Scholar] [CrossRef]
  48. Kornbluth, Y.; Cwilich, G.; Buldyrev, S.V.; Soltan, S.; Zussman, G. Distribution of blackouts in the power grid and the Motter and Lai model. Phys. Rev. E 2021, 103, 032309. [Google Scholar] [CrossRef] [PubMed]
  49. Su, Z.; Li, L.; Peng, H.; Kurths, J.; Xiao, J.; Yang, Y. Robustness of interrelated traffic networks to cascading failures. Sci. Rep. 2014, 4, 5413. [Google Scholar] [CrossRef] [Green Version]
  50. Sun, H.; Zhao, H.; Wu, J. A robust matching model of capacity to defense cascading failure on complex networks. Phys. A Stat. Mech. Its Appl. 2008, 387, 6431–6435. [Google Scholar] [CrossRef]
  51. Motter, A.E. Cascade control and defense in complex networks. Phys. Rev. Lett. 2004, 93, 098701. [Google Scholar] [CrossRef] [Green Version]
  52. Dong, S.; Yu, T.; Farahmand, H.; Mostafavi, A. Probabilistic modeling of cascading failure risk in interdependent channel and road networks in urban flooding. Sustain. Cities Soc. 2020, 62, 102398. [Google Scholar] [CrossRef]
  53. Ma, F.; Liu, F.; Yuen, K.F.; Lai, P.; Sun, Q.; Li, X. Cascading failures and vulnerability evolution in bus–metro complex bilayer networks under rainstorm weather conditions. Int. J. Environ. Res. Public Health 2019, 16, 329. [Google Scholar] [CrossRef] [Green Version]
  54. Huang, W.; Zhou, B.; Yu, Y.; Sun, H.; Xu, P. Using the disaster spreading theory to analyze the cascading failure of urban rail transit network. Reliab. Eng. Syst. Saf. 2021, 215, 107825. [Google Scholar] [CrossRef]
  55. Santos, J.R.; Safitri, N.D.; Safira, M.; Varghese, V.; Chikaraishi, M. Road network vulnerability and city-level characteristics: A nationwide comparative analysis of Japanese cities. Environ. Plan. B Urban Anal. City Sci. 2021, 48, 1091–1107. [Google Scholar] [CrossRef]
  56. Valenzuela, J.F.B.; Legara, E.F.T.; Monterola, C.P. Typology, network features and damage response in worldwide urban road systems. PLoS ONE 2022, 17, e0264546. [Google Scholar] [CrossRef]
  57. Kermanshah, A.; Derrible, S. Robustness of road systems to extreme flooding: Using elements of GIS, travel demand, and network science. Nat. Hazards 2017, 86, 151–164. [Google Scholar] [CrossRef]
  58. Zhengzhou Bureau of Statistics. Zhengzhou Population Pevelopment Report in 2021. Available online: http://tjj.zhengzhou.gov.cn/tjgb/6490689.jhtml (accessed on 16 June 2022).
  59. Xu, S.; Zhou, Z. Study on 7-20 Extreme Rainstorm and metro line flood control in Zhengzhou. Water Resour. Hydropower Eng. 2022, 53, 41–54. [Google Scholar]
  60. Disater Investigation Team of the State Council. Investigation Report of Extraordinarily Heavy Rainfall Disaster on July, 20 in Zhengzhou, Henan. Available online: https://www.mem.gov.cn/gk/sgcc/tbzdsgdcbg/202201/P020220121639049697767.pdf (accessed on 16 March 2022).
  61. Su, B.; Huang, H.; Li, Y. Integrated simulation method for waterlogging and traffic congestion under urban rainstorms. Nat. Hazards 2016, 81, 23–40. [Google Scholar] [CrossRef]
  62. Kilpeläinen, M.; Summala, H. Effects of weather and weather forecasts on driver behaviour. Transp. Res. Part F Traffic Psychol. Behav. 2007, 10, 288–299. [Google Scholar] [CrossRef]
  63. Yin, J.; Yu, D.; Liao, B. A city-scale assessment of emergency response accessibility to vulnerable populations and facilities under normal and pluvial flood conditions for Shanghai, China. Environ. Plan. B Urban Anal. City Sci. 2021, 48, 2239–2253. [Google Scholar] [CrossRef]
  64. Yin, J.; Xu, S.; Jing, Y.; Yin, Z.; Liao, B. Evaluating the impact of fluvial flooding on emergency responses accessibility for a mega-city’s public services: A case study of emergency medical service. J. Geogr. Sci. 2018, 73, 1737–1747. [Google Scholar]
  65. Wang, X.F. Complex networks: Topology, dynamics and synchronization. Int. J. Bifurc. Chaos 2002, 12, 885–916. [Google Scholar] [CrossRef]
  66. Porta, S.; Crucitti, P.; Latora, V. The network analysis of urban streets: A primal approach. Environ. Plan. B Plan. Des. 2006, 33, 705–725. [Google Scholar] [CrossRef] [Green Version]
  67. Yang, S.; Tang, S.; Zhang, X. Privacy-preserving k nearest neighbor query with authentication on road networks. J. Parallel Distrib. Comput. 2019, 134, 25–36. [Google Scholar] [CrossRef]
  68. Angelelli, E.; Morandi, V.; Speranza, M.G. Congestion avoiding heuristic path generation for the proactive route guidance. Comput. Oper. Res. 2018, 99, 234–248. [Google Scholar] [CrossRef]
  69. Akbari, V.; Shiri, D.; Salman, F.S. An online optimization approach to post-disaster road restoration. Transp. Res. Part B Methodol. 2021, 150, 1–25. [Google Scholar] [CrossRef]
  70. Qian, Y.-S.; Wang, M.; Kang, H.-X.; Zeng, J.-W.; Liu, Y.-F. Study on the road network connectivity reliability of valley city based on complex network. Math. Probl. Eng. 2012, 2012, 430785. [Google Scholar] [CrossRef] [Green Version]
  71. Sienkiewicz, J.; Hołyst, J.A. Statistical analysis of 22 public transport networks in Poland. Phys. Rev. E 2005, 72, 046127. [Google Scholar] [CrossRef]
  72. Chen, H.; Zhang, L.; Liu, Q.; Wang, H.; Dai, X. Simulation-based vulnerability assessment in transit systems with cascade failures. J. Clean. Prod. 2021, 295, 126441. [Google Scholar] [CrossRef]
  73. Ord, J.K.; Getis, A. Local spatial autocorrelation statistics: Distributional issues and an application. Geogr. Anal. 1995, 27, 286–306. [Google Scholar] [CrossRef]
  74. Mirzasoleiman, B.; Babaei, M.; Jalili, M.; Safari, M. Cascaded failures in weighted networks. Phys. Rev. E 2011, 84, 046114. [Google Scholar] [CrossRef] [Green Version]
  75. Holme, P.; Kim, B.J.; Yoon, C.N.; Han, S.K. Attack vulnerability of complex networks. Phys. Rev. E 2002, 65, 056109. [Google Scholar] [CrossRef]
Figure 1. Study area of Zhengzhou, China.
Ijgi 11 00564 g001
Figure 2. Failure Road location during the rainstorm.
Ijgi 11 00564 g002
Figure 3. The methodology framework.
Ijgi 11 00564 g003
Figure 4. Road network cascade failure model diagram.
Ijgi 11 00564 g004
Figure 5. Distribution of the node degree, shortest distance, and clustering coefficient on the road network in study area. (a) Distribution of the road node degrees; (b) distribution of the shortest distance; (c) distribution of the clustering coefficient.
Ijgi 11 00564 g005
Figure 6. (a) Spatial distribution of road vulnerability; (b) differences in road vulnerability in the west–east direction; (c) differences in road vulnerability in the north–south direction. FR, TD, SD, FT stands for the 4th, 3rd, 2nd, and 1st Ring Road, respectively; N, S, W, and E stand for the north, south, west, and east directions.
Ijgi 11 00564 g006
Figure 7. The hot and cold spot area of road vulnerability.
Ijgi 11 00564 g007
Figure 8. The change in the failure road ratio and network efficiency during the rainstorm. (a) The change in the failure road ratio and global network efficiency during the rainstorm; (b) the change in the edge ratio of increased load road, reduced load road, and constant load road during the rainstorm.
Ijgi 11 00564 g008
Figure 9. Spatiotemporal patterns of the road network cascade failure during the rainstorm.
Ijgi 11 00564 g009
Figure 10. The road segment ratio with increased/reduced/constant loads in different vulnerability hot or cold spots.
Ijgi 11 00564 g010
Figure 11. The histogram and Gaussian fitting curve of road vulnerability frequency distribution under two network weight.
Ijgi 11 00564 g011
Table 1. Statistics on Zhengzhou “7.20” Rainstorm in different short duration.
Durations
(min)
Max.
(mm)
Time
(from–to)
Durations
(min)
Max.
(mm)
Time
(from–to)
517.316:35–16:40150258.815:20–17:50
1033.716:35–16:45180271.015:00–18:00
1539.116:30–16:45240351.414:30–18:30
2053.216:25–16:45360378.213:30–19:30
30101.016:20–16:50540418.411:00–20:00
45150.216:10–16:55720458.609:30–21:30
60201.916:00–17:001440552.520:00 (19 July)–20:00 (20 July)
90236.115:30–17:003 days624.100:00 (19 July)–00:00 (22 July)
120253.615:30–17:30
Table 2. The speed and number of different types of roads segments.
Road ClassExpresswayMain RoadSecondary Arterial RoadTertiary Arterial and Feeder Road
Speed * (km/h)40302510
Number140225478993
* The speed is set as 50% of the normal speed limit during the rainstorm.
Table 3. The complexity network metrics.
MetricsFormulasDescription
Average node degree K = 1 N i = 1 N a i The average of the degrees of all nodes in the network
Network complexity β = e N The development level of the network
Network diameter D = max d i j The maximum value of the shortest distance of all node pairs in the network
Average path length L = 2 N N 1 i , j V , i j d i j The degree of connectivity between nodes as a whole
Clustering coefficient C i = 2 E i a i a i 1 The aggregation of nodes in the network
Global network efficiency E = 1 N N 1 i , j V , i j 1 d i j The connectivity efficiency of the network
Notes: N is the number of nodes in the network, a i is the degree of a node, e is the number of edges in the network, d i j is the shortest distance between node pairs i and j , E i is the number of edges actually present in the set of neighboring nodes of node i . V is the set of nodes in the network.
Table 4. Descriptive statistics of the road vulnerability.
Road TypeNumber of EdgesDescriptive Statistics
>1=1<1MaxMinMeanStandard Deviation
Expressway vulnerability001400.99980.98760.99670.0034
Main Road vulnerability002250.99990.98390.99700.0028
Secondary Arterial Road vulnerability314741.00040.99590.99920.0007
Tertiary Arterial Road and Feeder Road vulnerability171608161.00130.99890.99990.0002
All roads vulnerability2016116551.00130.98390.99910.0018
Table 5. Correlation coefficients between different factors and road vulnerability.
Different Vulnerability AreaRoad LengthDistance from the Urban CenterTravel Time
Concentration areas of vulnerability0.541 **0.643 **0.331 ***
nonsignificant areas of vulnerability0.057 *0.075 **0.336 ***
Notes: *** significance level of 0.01, ** significance level of 0.05, * significance level of 0.1.
Publisher’s Note: MDPI stays neutral with regard to jurisdictional claims in published maps and institutional affiliations.

