Article

Mining the Spatial Distribution Pattern of the Typical Fast-Food Industry Based on Point-of-Interest Data: The Case Study of Hangzhou, China

1
College of Resources and Environment, Anhui Agricultural University, Hefei 230036, China
2
Anhui Province Key Lab. of Farmland Ecological Conservation and Pollution Prevention, Anhui Agricultural University, Hefei 230036, China
*
Author to whom correspondence should be addressed.
ISPRS Int. J. Geo-Inf. 2022, 11(11), 559; https://doi.org/10.3390/ijgi11110559
Submission received: 23 August 2022 / Revised: 24 October 2022 / Accepted: 5 November 2022 / Published: 9 November 2022
(This article belongs to the Special Issue Urban Geospatial Analytics Based on Crowdsourced Data)

Abstract

:
There is a Chinese proverb which states “Where there are Shaxian Snacks, there are generally Lanzhou Ramen nearby”. This proverb reflects the characteristics of spatial clustering in the catering industry. Since the proverbs are rarely elucidated from the geospatial perspective, we aimed to explore the spatial clustering characteristics of the fast food industry from the perspective of geographical proximity and mutual attraction. Point-of-interest, OSM road network, population, and other types of data from the typical fast-food industry in Hangzhou were used as examples. The spatial pattern of the overall catering industry in Hangzhou was analyzed, while the spatial distribution of the four types of fast food selected in Hangzhou was identified and evaluated. The “core-edge” circle structure characteristics of Hangzhou’s catering industry were fitted by the inverse S function. The common location connection between the Western fast-food KFC and McDonald’s and the Chinese fast-food Lanzhou Ramen and Shaxian Snacks and the spatial aggregation were elucidated, being supported by correlation analysis. The degree of mutual attraction between the two was applied to express the spatial correlation. The analysis demonstrated that (1) the distribution of the catering industry in Hangzhou was northeast–southwest. The center of the catering industry in Hangzhou was located near the economic center of the main city rather than in the center of urban geography. (2) The four types of fast food were distributed in densely populated areas and exhibited an anti-S law, which first increased but then decreased as the distance from the center increased. Among these, the number of four typical fast foods was the highest within a distance of 4–10 km from the center. (3) It was concluded that 81.6% of KFCs had a McDonald’s nearby within 2500 m, and 68.5% of Shaxian Snacks had a Lanzhou Ramen nearby within 400 m. McDonald’s attractiveness to KFC was calculated as 0.928448. KFC’s attractiveness to McDonald’s was 0.908902. The attractiveness of the Shaxian Snacks to Lanzhou Ramen was 0.826835. The attractiveness of Lanzhou Ramen to Shaxian Snacks was 0.854509. McDonald’s was found to be dependent on KFC in the main urban area. Shaxian Snacks were strongly attributed to Lanzhou Ramen in commercial centers and streets, while Shaxian Snacks were distributed independently in the eastern Xiaoshan and Yuhang Districts. This study also helped us to optimize the spatial distribution of a typical fast-food industry, while providing case references and decision-making assistance with respect to the locations of catering industries.

1. Introduction

A Chinese proverb states, “Where there are Shaxian Snacks, there are generally Lanzhou Ramen nearby”, which reflects the characteristics of spatial clustering in the catering industry. The catering industry represents a promising dimension, in which cultural characteristics can be elucidated. Food culture affects people’s supply and consumption behavior during catering, thus forming a special urban social space landscape [1]. By unveiling previously unknown places in a city, such as restaurants, an individual learns about the local culture [2]. Since ancient times, food has played a vital role in human life. Of the many catering-related studies, the location attribute of the POI in the catering industry has attracted considerable attention from scholars. While examining the spatial distribution patterns, spatial geographic objects or events are abstracted into points, while point pattern analysis is commonly used to study the spatial distribution patterns of the points [3,4,5,6,7]. In recent years, the role of internet information technology in contemporary urban life has become intensified, and network technology has become increasingly important in the era of big data, thereby emphasizing the role of geospatial space [8]. From the perspective of spatial planning, the spatial distribution status and changing trends of commercial facilities were analyzed using the existing data to unveil the underlying laws and patterns. Based on location information about social networks, we can perceive the relationship between human activities and urban spaces from multiple perspectives. Examples include the geotagging and tagging classification of POIs from take-out data [9] and Twitter data [10]; the relationship between Airbnb locations and urban elements [11]; over-commuting [12]; separation of the workplace and residence [13]; the application of spatial clustering in spatial partitioning [14]; and the location and colocation associations of economic activities [15].
The correlation between industries and their spatial distribution can be explored as well. In this light, some scholars have studied the spatial relationship between industries based on spatial statistical analysis using the location information of manufacturing units and automobile sale outlets extracted from POIs, thereby shedding the light on their integration, correlation, and coordination [16]. The different spatial patterns between local and non-local restaurants were analyzed and discussed from global and local perspectives using hotspot detectors and G-statistical models. Subsequently, the spatial correlations between food culture preferences, climate, and the socio-economy were quantified [17]. Qiu et al. used correlation analysis, the input–output model, spatial autocorrelation model, coefficient of variation, and geographic connection rate to conduct an empirical study on the industrial correlation and spatial distribution of the interactions between producer services and manufacturing [18]. An improved spatial co-location pattern mining method was further proposed. The method included a network constraint neighborhood and the addition of a distance decay function to discover spatial dependencies between network phenomena, namely, the urban facilities [19]. The overall characteristics of the spatial correlation and local spatial correlation patterns of the two types of building facilities were further examined using the collaborative location quotient method [20]. Li et al. utilized multi-source data, including taxi and bike-sharing trajectories, user reviews, and cultural facility POIs [21]. On this basis, the correlation between built-up environmental factors and the multidimensional urban vitality of streets was quantified through multiple regression models [21].
The agglomeration morphological characteristics of cities and urban functional areas were previously analyzed. To this end, some scholars have previously examined the directionality and agglomeration of restaurants using the standard deviation ellipse method and nearest neighbor index analysis [22]. By using hotspot analysis, weighted superposition analysis [23], location entropy [24], and the local G e t i s O r d   G i * index [25,26], other researchers analyzed the hotspots of commercial activities and hot blocks [27]. In this way, the agglomeration characteristics and multi-center identification of urban areas were elucidated. A spatial co-location model was also applied to explore the symbiotic characteristics of the industry [28]. A transportation network model was constructed, and the density of facilities distributed in a square was quantified to study its functions [29]. The grid was applied to split the kernel density and to quantify the division and identification of urban functional areas [30]. Using origin-destination streams to reflect human activities, a flow-based position measure I-index was proposed to quantify the irreplaceability of the locations of urban functional areas with strong mixing [31]. Spatial co-occurrence patterns are learned through explicit random walking in POI networks, and manifold learning algorithms are used to capture classification semantics to estimate the proportional distribution of functional types in urban areas [32]. The development of an adaptive method to detect regional co-positioning patterns of network constraints can deepen our understanding of the spatial organization of urban functions [33]. To quantify the urban land density, a quantitative method using the inverse S-function to analyze the urban circle structure and growth pattern was previously established [34].
In terms of the evolutionary characteristics of time and space, some scholars have mined the multidimensional composition types and temporal evolution characteristics of catering clusters based on DBSCAN [35,36] and word cloud analyses. Sequence snapshots were constructed from POI and GPS data and integrated using the Jensen–Shannon distance and hierarchical clustering. As a result, an improved weighted k-kernel decomposition method was introduced to analyze the spatiotemporal variation characteristics of spatial interaction networks [37]. Moreover, the dynamic urban function structure over different timescales has been analyzed using a random forest model to determine the temporal changes in different urban function ratios through studying the relationship between the POI and Tencent location request (TLR) data [38]. Multi-source datasets such as Baidu heat map data, POI data, and floor area and land use data, as well as geographic and time-weighted regression (GTWR) models have all been utilized to reveal the spatiotemporal relationship between built environments and urban vitality [39,40].
The aforementioned scholars have conducted in-depth research on the spatial distribution characteristics of POI data from multiple perspectives, methods, and scales. However, to date, there have been few studies on the spatial distribution characteristics of the fast-food industry from the perspectives of geographical proximity and mutual attraction. The full text begins with a Chinese proverb, which is “Where there are Shaxian Snacks, there are generally Lanzhou Ramen nearby”. In addition, in this study, two categories of Western and Chinese fast foods were used as examples to conduct the research. The main contribution of this study is that it reveals the spatial clustering patterns of the typical fast-food industry, including KFC, McDonald’s, Lanzhou Ramen, and Shaxian Snacks. First, we analyzed the direction of the overall distribution of the catering industry in Hangzhou and explored the spatial pattern of the overall catering industry in Hangzhou using the hotspot analysis method. Secondly, a combination of population data and road network data were used to identify and verify the spatial distribution of the four types of fast food. The “core-edge” circle structure characteristics of four typical fast-food industries in Hangzhou are revealed based on the inverse S-fitting function. The inverse S function provides an understanding of the structure and spatial pattern of the city. Finally, the spatial clustering and the degree of mutual attraction of two categories, the Western and Chinese fast food, were explored using the bivariate Moran’s I index, geographic connection rate, distance to the nearest hub (points), and collaborative location quotient analysis. This study also helps us to optimize the spatial distribution of a typical fast-food industry, while providing case references and decision-making assistance with respect to the locations of catering industries.
The remainder of this paper is structured as follows: Section 2 introduces the research data preprocessing and methodology. Section 3 presents the results, which are discussed with conclusions in Section 4. The paper concludes with a summary of the results and implications for future research. This study also helps us to optimize the spatial distribution of a typical fast-food industry, while providing case references and decision-making assistance respect to the locations of catering industries.

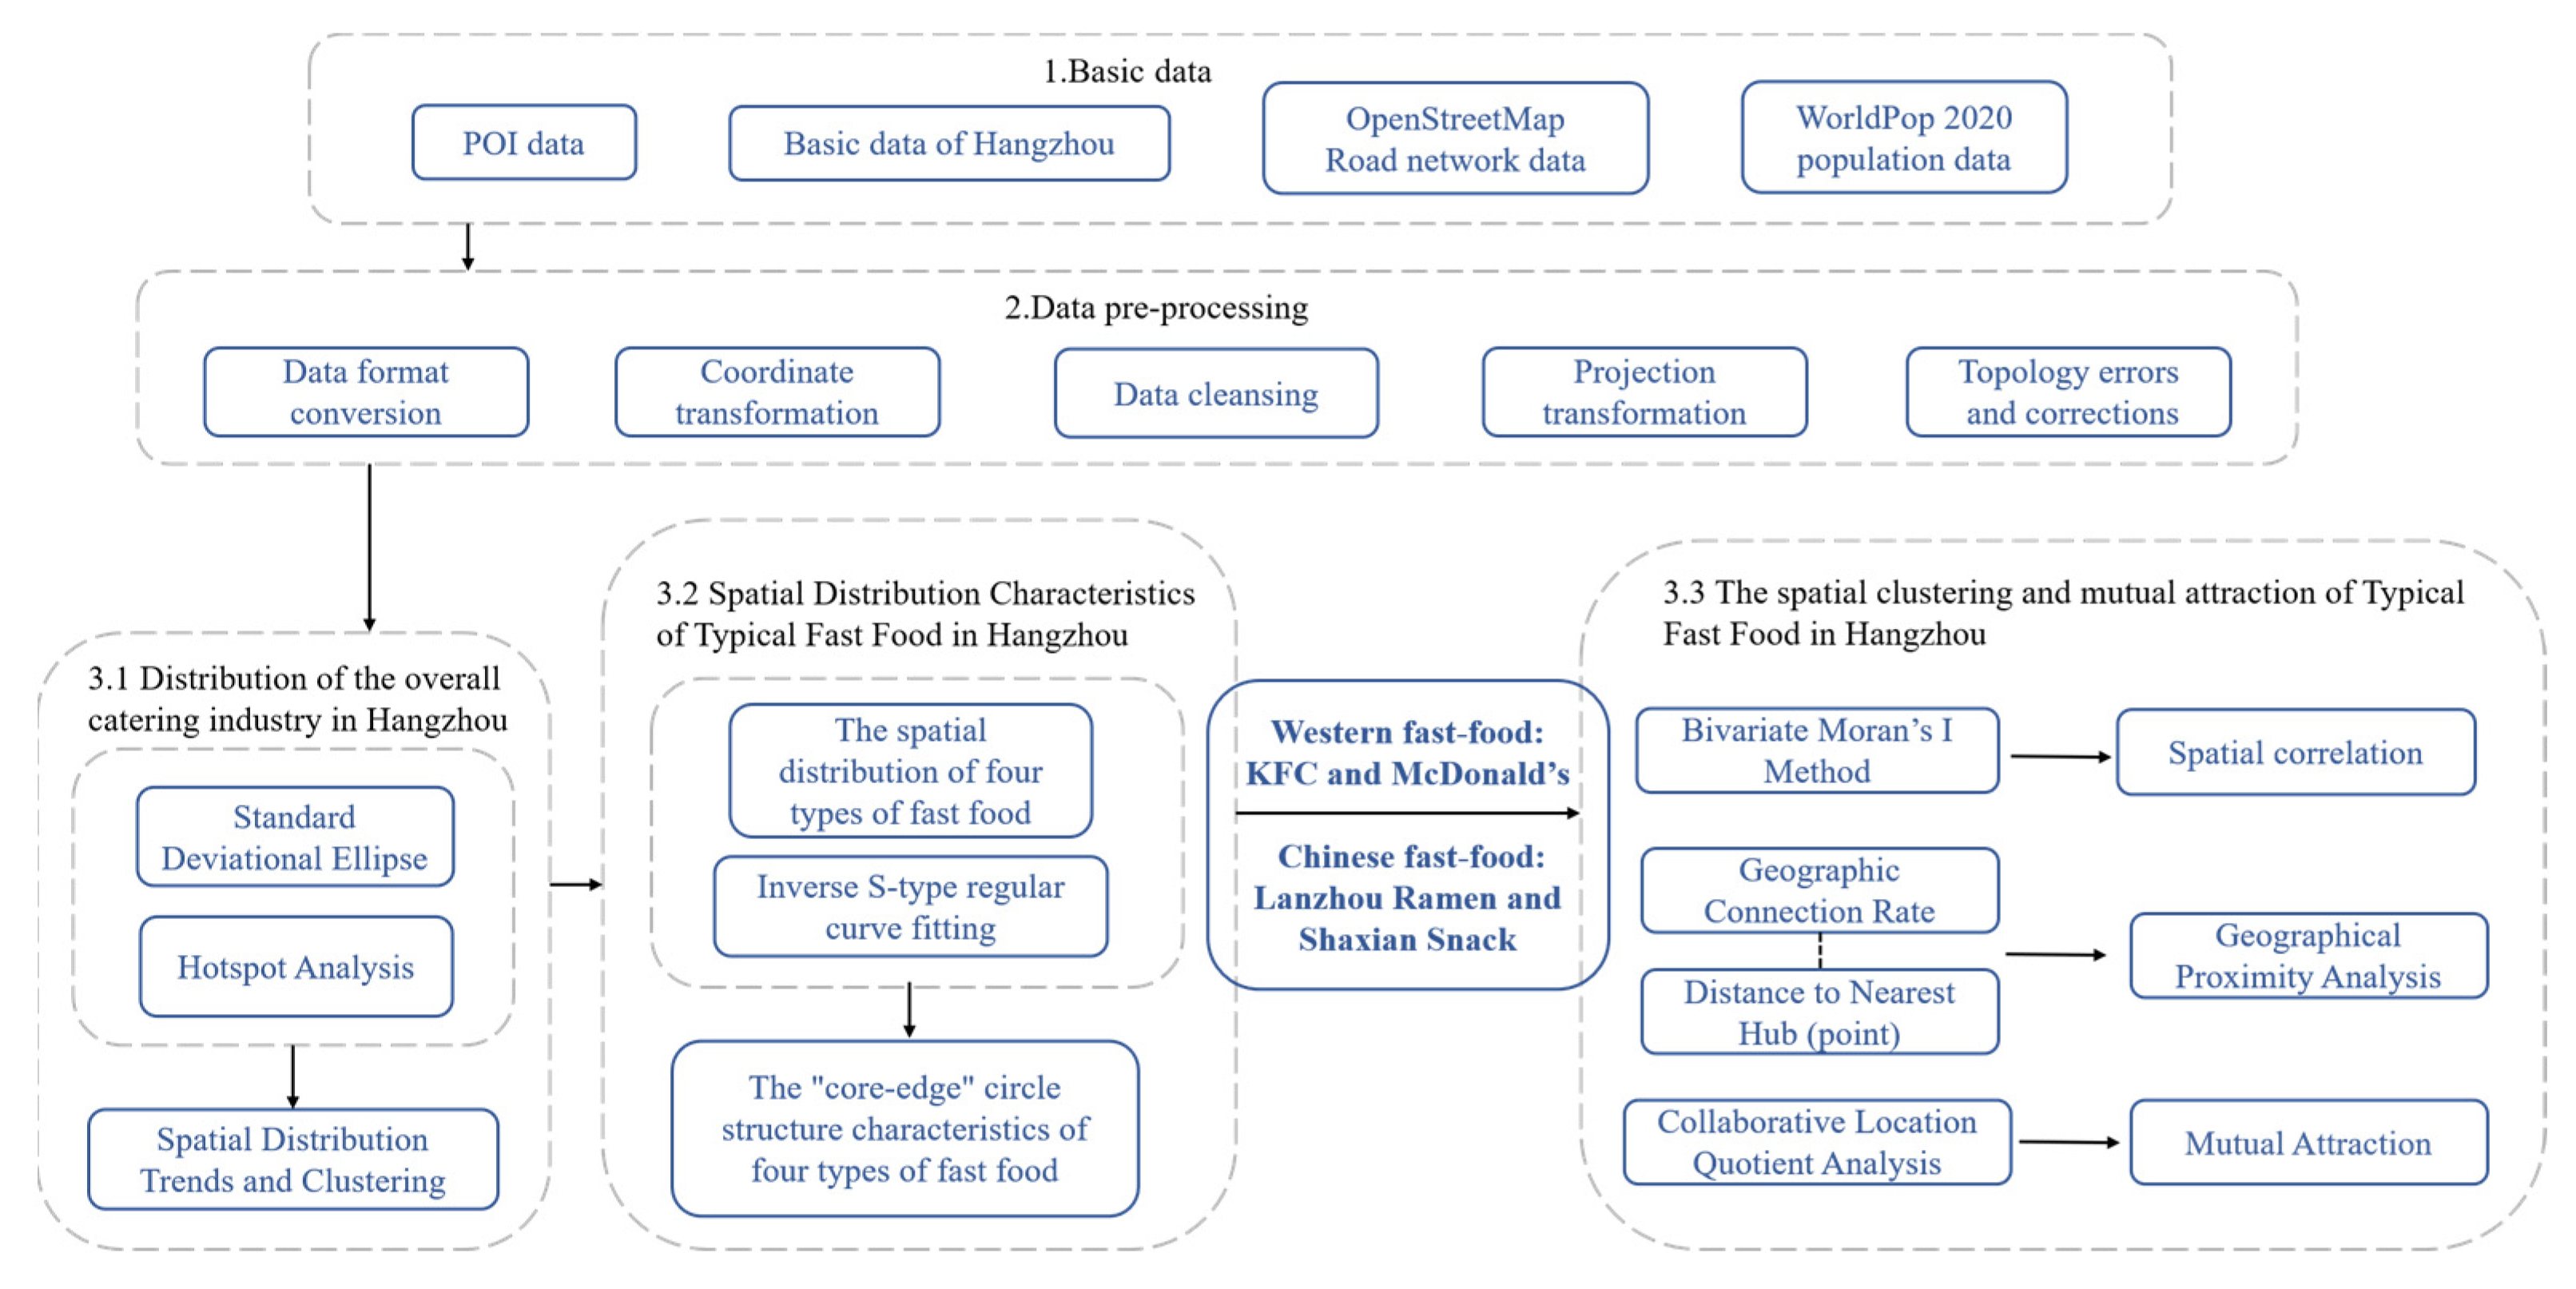
2. Materials and Methods
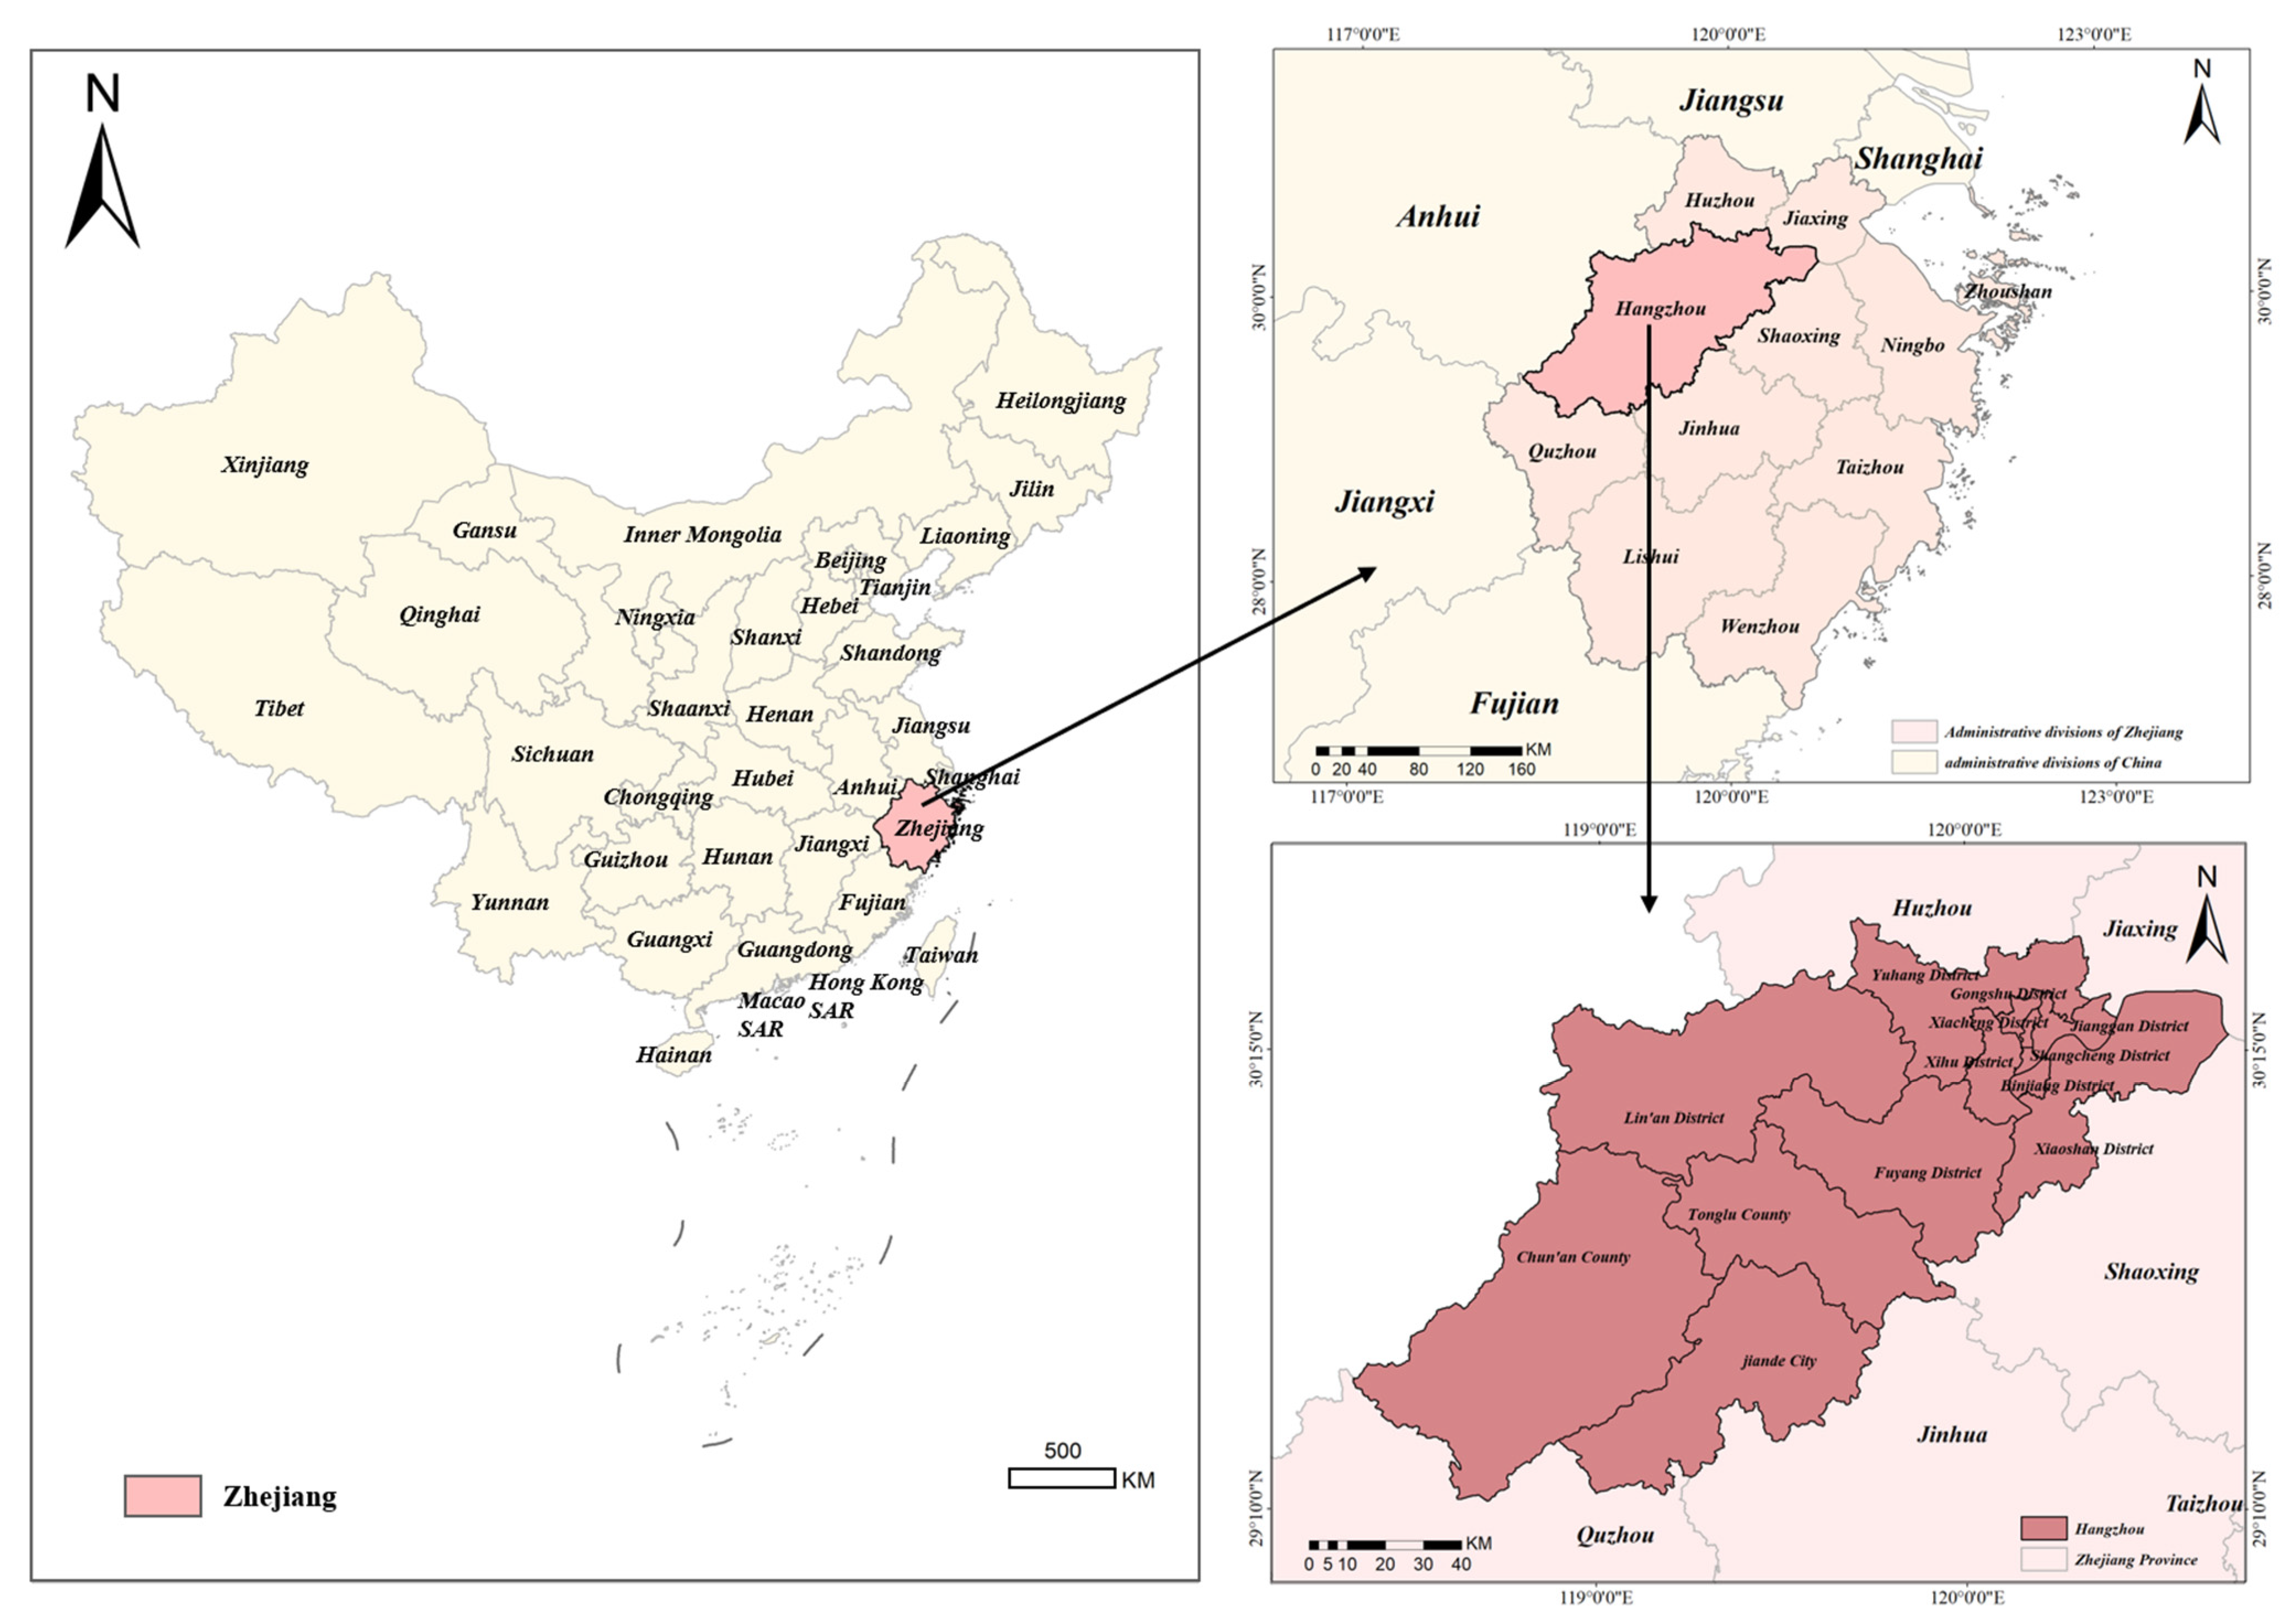
2.1. Data

The city of Hangzhou is located in East China, downstream of the Qiantang River, in the north of Zhejiang Province, the economic, cultural, scientific, and educational center of Zhejiang Province, and is one of the central cities of the Yangtze River Delta. The total area of the city is 16,853.57 square kilometers, stretching between 29°11′–30°34′ N and 118°20′–120°37′ E. We selected Hangzhou City in Zhejiang Province as the study area, which includes ten municipal districts, two counties, and one county-level city (Figure 1). To this end, the screening of the entire catering industry (referred to as food) and KFC, Lanzhou Ramen, McDonald’s, and Shaxian Snacks was performed (Table 1). The data are from the first geographical conditions census of Hangzhou in 2018 and the Amap POI data of Hangzhou in 2021. There are 155193 POI data points derived from the Gaode maps. We selected the population data of China for 2020 from WorldPop and the road network data of Hangzhou from OpenStreetMap.

2.2. Methodology and Analysis Flowcharts

The directional research fundamentally adopts the standard deviation ellipse method to evaluate whether the distribution of the studied elements is narrow and long. A standard deviation ellipse was quantified to reflect the spatial characteristics of the geographical elements, including central, discrete, and directional trends [41] in this study.

2.2.1. Hotspot Analysis

Hotspot analysis calculates the G e t i s O r d   G i * statistic for each feature in the dataset. The resultant z-scores and p-values show where features with either high or low values cluster spatially. The calculation formula from [41] is formalized as:
G i * = j = 1 n w i , j x j x ¯ j = 1 n w i , j S [ n j = 1 n w i , j 2 ( j = 1 n w i , j ) 2 ] n 1
where x j is the attribute value for feature j, w i , j is the spatial weight between features i and j, and n is the total number of features. The G i * statistic is the z-score. If the z-score of the element is high and the p-value is small, this indicates spatial clustering with a high value. If the z-score of an element is low and negative and the p-value is small, this means that the spatial clustering is low. The higher (or lower) the z-score is, the greater the degree of clustering is. If the z-score is close to zero, there is no significant spatial clustering.

2.2.2. Spatial Clustering and Mutual Attraction Analysis

(1)
Bivariate Moran’s I method.
The bivariate Moran’s I can measure the connection between two types of industries in different space units and supports the expression of the spatial heterogeneity of the connection strength, thereby intuitively reflecting the spatial correlation pattern of the two industries. The calculation formula is provided by [16]:
I x y = n i j w i j · i j w i j ( ( x i x ¯ ) ( y i y ¯ ) ) i ( x i x ¯ ) 2 j ( y j y ¯ ) 2
where x i is the x attribute value of the adjacent study area i, and y j is the attribute value y of the adjacent area j. x ¯ and y ¯ are the average values of every attribute x and y in the sample, and w i is the spatial connection weight matrix between spatial unit i and spatial unit j.
(2)
Geographical Proximity Analysis
The geographic connection rate reflects the geographical distribution of the two economic factors and the differences in spatial structure through similarity differences. The calculation formula from [18] is shown below:
L = 100 1 2 i n | S i P i |     ( i = 1 , 2 , , n )
where L is the geographic connection rate, n is the number of neighborhood units, and S i and P i are the percentages of each economic factor in each neighborhood unit. The L value was defined as follows: 0 ≤ L ≤ 25, 26 ≤ L ≤ 50, 51 ≤ L ≤ 75, and 76 ≤ L ≤ 100, indicating that the two types of elements were highly inconsistent, relatively inconsistent, relatively consistent, or highly consistent, respectively.
Given the origin and destination layers, the distance to the nearest hub (point) algorithm computes the distance between the origin features and their closest destinations. The distance calculations were based on feature centers [42]. The resulting layer contains origin feature center points with an additional field, reflecting the identifier of the nearest destination feature and the distance to it.
(3)
Collaborative Location Quotient analysis.
The collaborative location quotient was used to quantify the spatial correlation mode between the two types of point factors and is divided into the local collaborative location quotient (LCLQ) and global collaborative location quotient (GCLQ). The LCLQs calculated from point A i in the category of interest A to the neighboring category B [41] were determined by:
L C L Q A i B = N A i B N B / ( N 1 )
where N B is the total number of categories B in the study area and N is the total number of points in the study area. N A i B is the weighted average of the number of category B points in the neighborhood of each category A point ( A i ). The GCLQ equation from [41] was used:
G C L Q A B = N A B / N A N B / ( N 1 )
where N is the total number of features, N A is the number of features in category A, and N B is the number of features of category B. Permutation was applied to calculate the p-value for each of the input features of interest. In this way, the statistical significance of the observed co-location quotient values was determined, where a p-value of <0.05 was considered a statistically significant value hereafter.
The flowchart of the analysis is shown in Figure 2. This study is based on the POI data of Hangzhou City in 2021, and OSM road network data and population data were used as the auxiliary data. The data were preprocessed by format conversion, coordinate transformation, data cleaning, projection conversion, and topology error correction. Section 3.1 analyzes the spatial distribution trends and clustering of the restaurant industry in Hangzhou. Section 3.2 analyzes the spatial distribution pattern of the four types of typical fast-food industries in Hangzhou. Section 3.3 explores the spatial correlation, geographic association, and inter-spatial dependence of KFC and McDonald’s and Lanzhou Ramen and Shaxian Snacks in Hangzhou.

3. Results

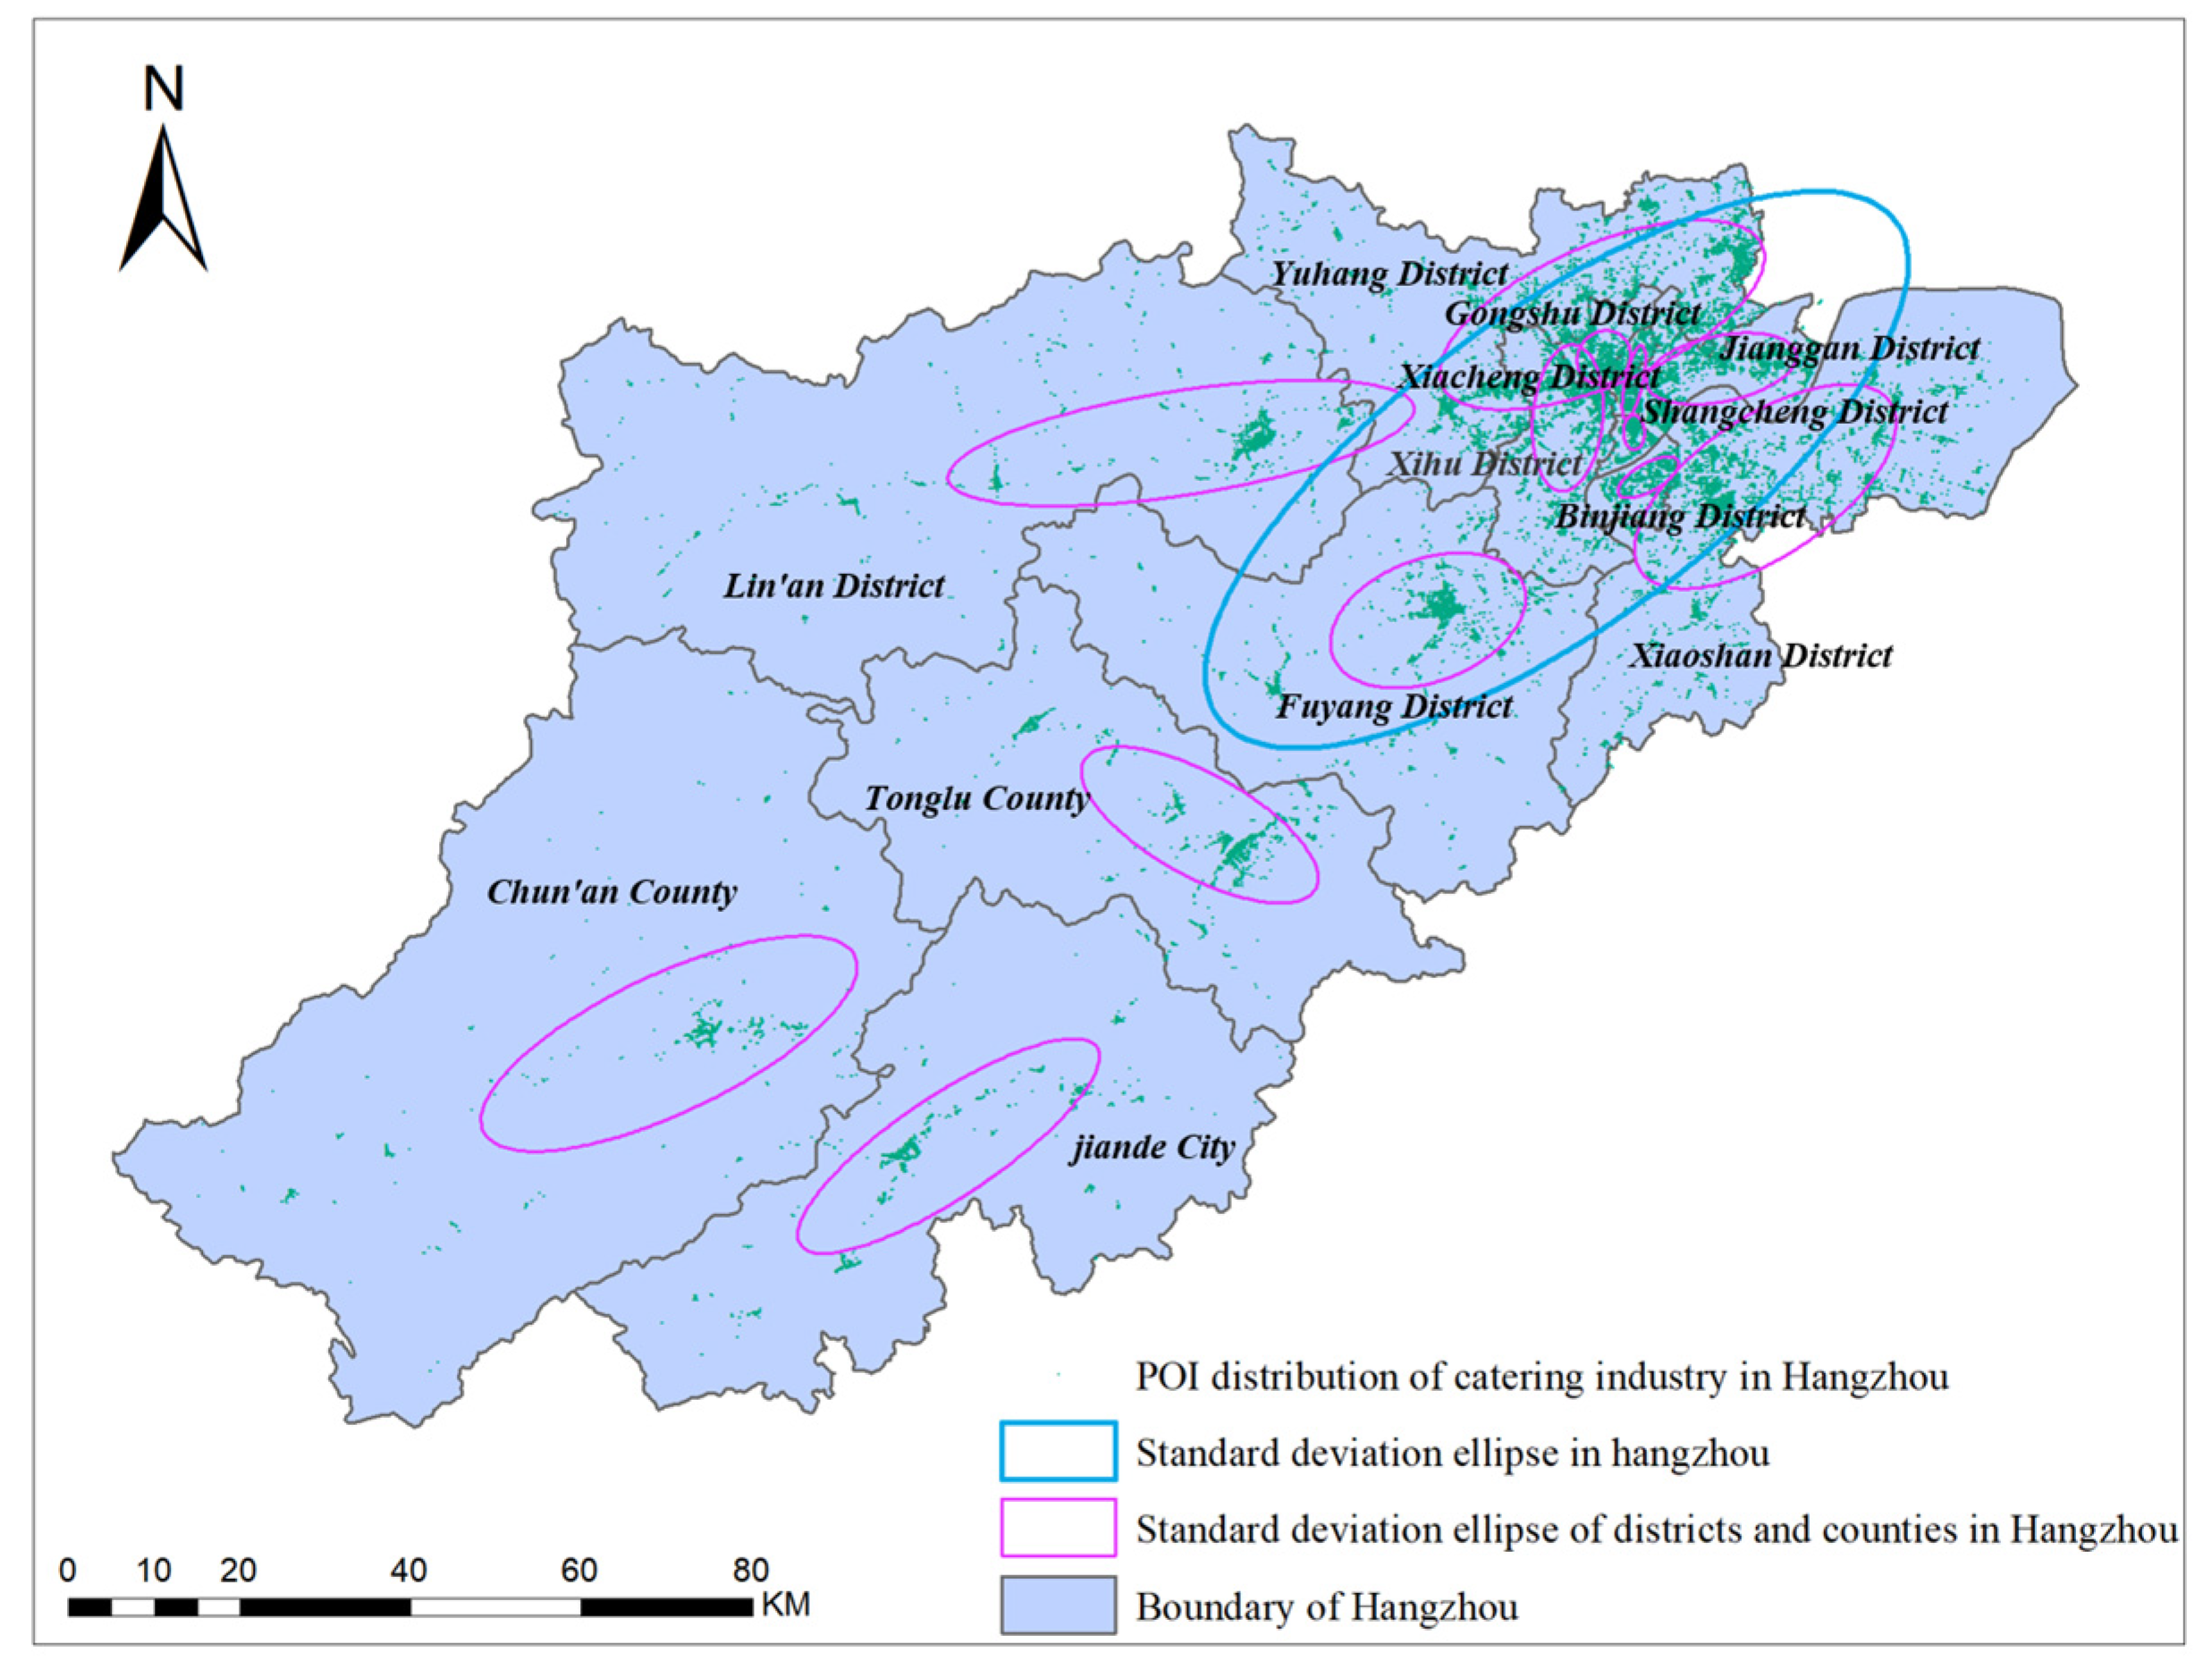
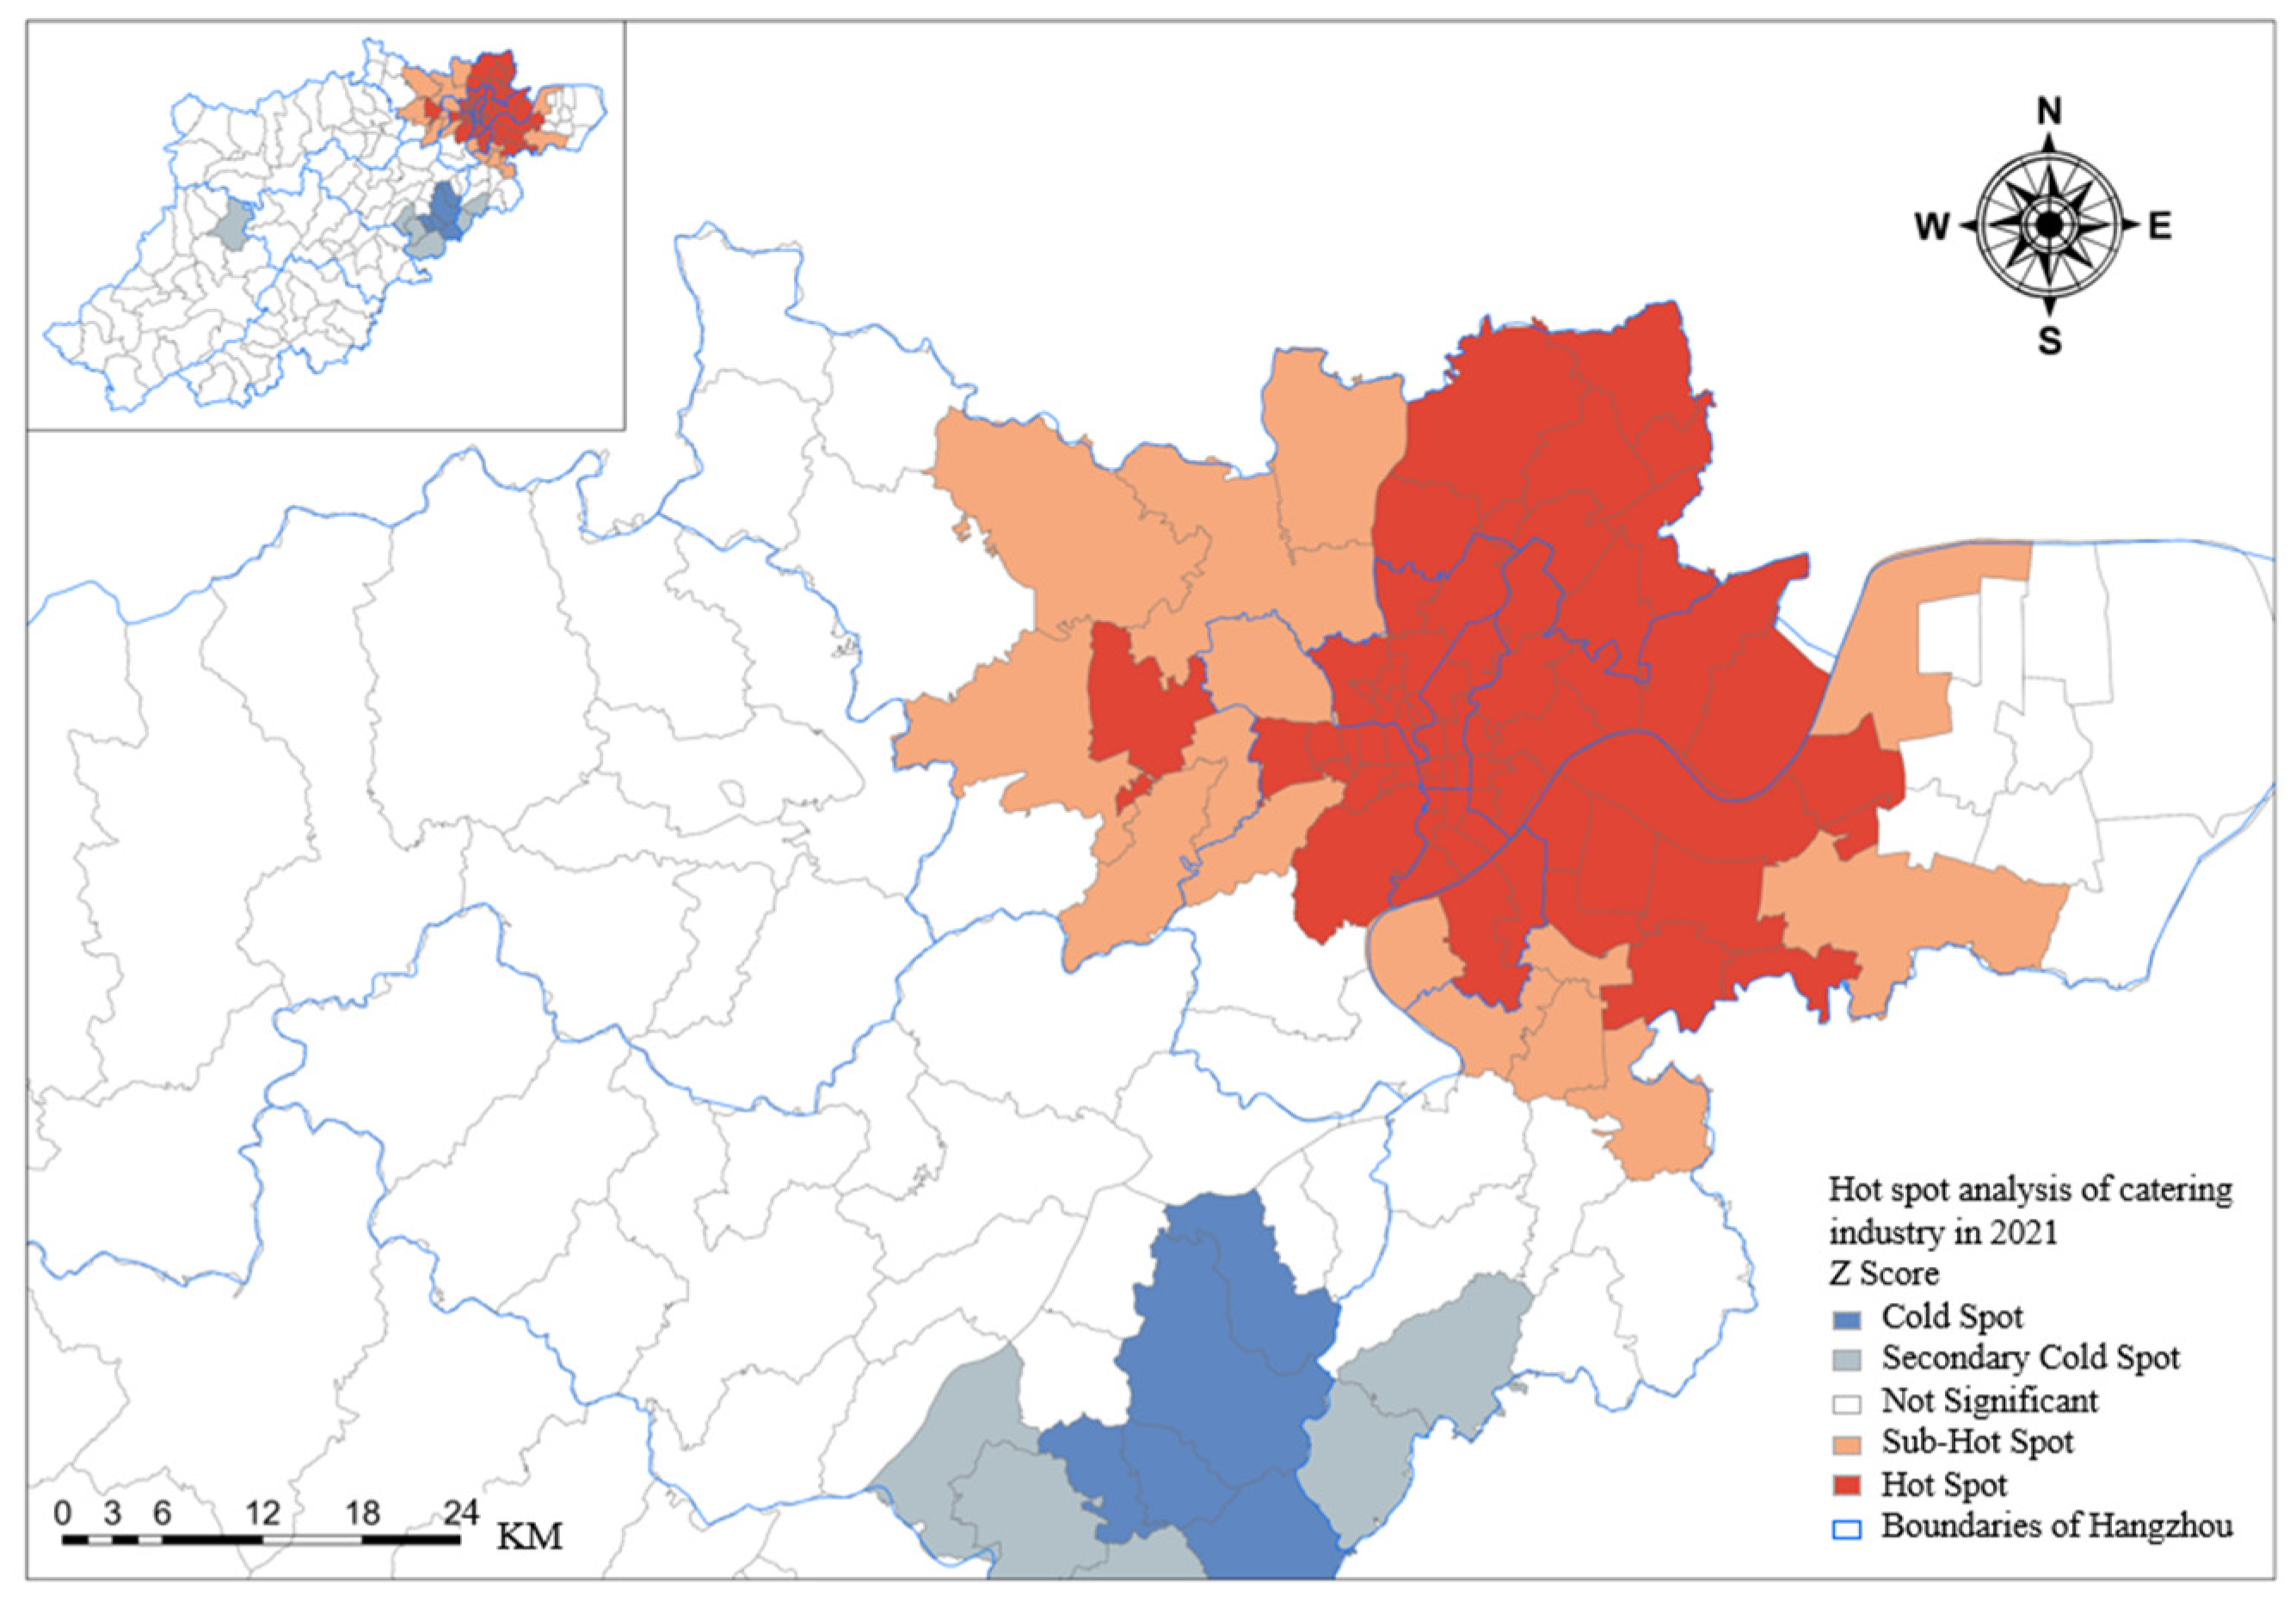
3.1. Distribution of the Overall Catering Industry in Hangzhou

3.1.1. Spatial Distribution of the Overall Catering Industry

We used the standard deviation ellipse method based on the standard deviation ellipses for Hangzhou City and each administrative division in 2021, as shown in Figure 3. The overall spatial pattern exhibited an ellipse direction of the standard deviation of the catering industry in Hangzhou, which was roughly the same as that of the administrative divisions, showing a northeast-southwest direction. The catering industry center of Hangzhou is not in the geographic center of the city but is located near the main urban area of the economic center. The standard deviation ellipses of the catering industry in other administrative divisions were nearly distributed in the direction of their respective administrative regions.
The catering industry in Hangzhou formed a pattern of immense aggregation and multi-center development in terms of its spatial distribution. Overall, the main city area’s catering service center exhibited a relatively distinct scale advantage and a contiguous distribution. The development of the catering service facilities outside the main urban area was relatively slow, and the catering service centers were small and scattered.

3.1.2. Clustering Analysis of the Overall Catering Industry

The distribution of the conspicuous hotspots in the catering industry in the main urban area was relatively clustered over a large area. Of the hotspots, the food distribution in Shangcheng District, Xiacheng District, Gongshu District, Binjiang District, and Xihu District was the densest, while these areas were surrounded by adjacent blocks with a high network density, specifically the gathering areas of high-density catering industry blocks from a statistical perspective. In 2021, the z-score of the hotspot analysis of the catering industry in Hangzhou was relatively uniform, thus indicating that the spatial distribution of the catering industry in Hangzhou was relatively uniform as well (Figure 4).

3.2. Spatial Distribution Characteristics of Typical Fast Food in Hangzhou

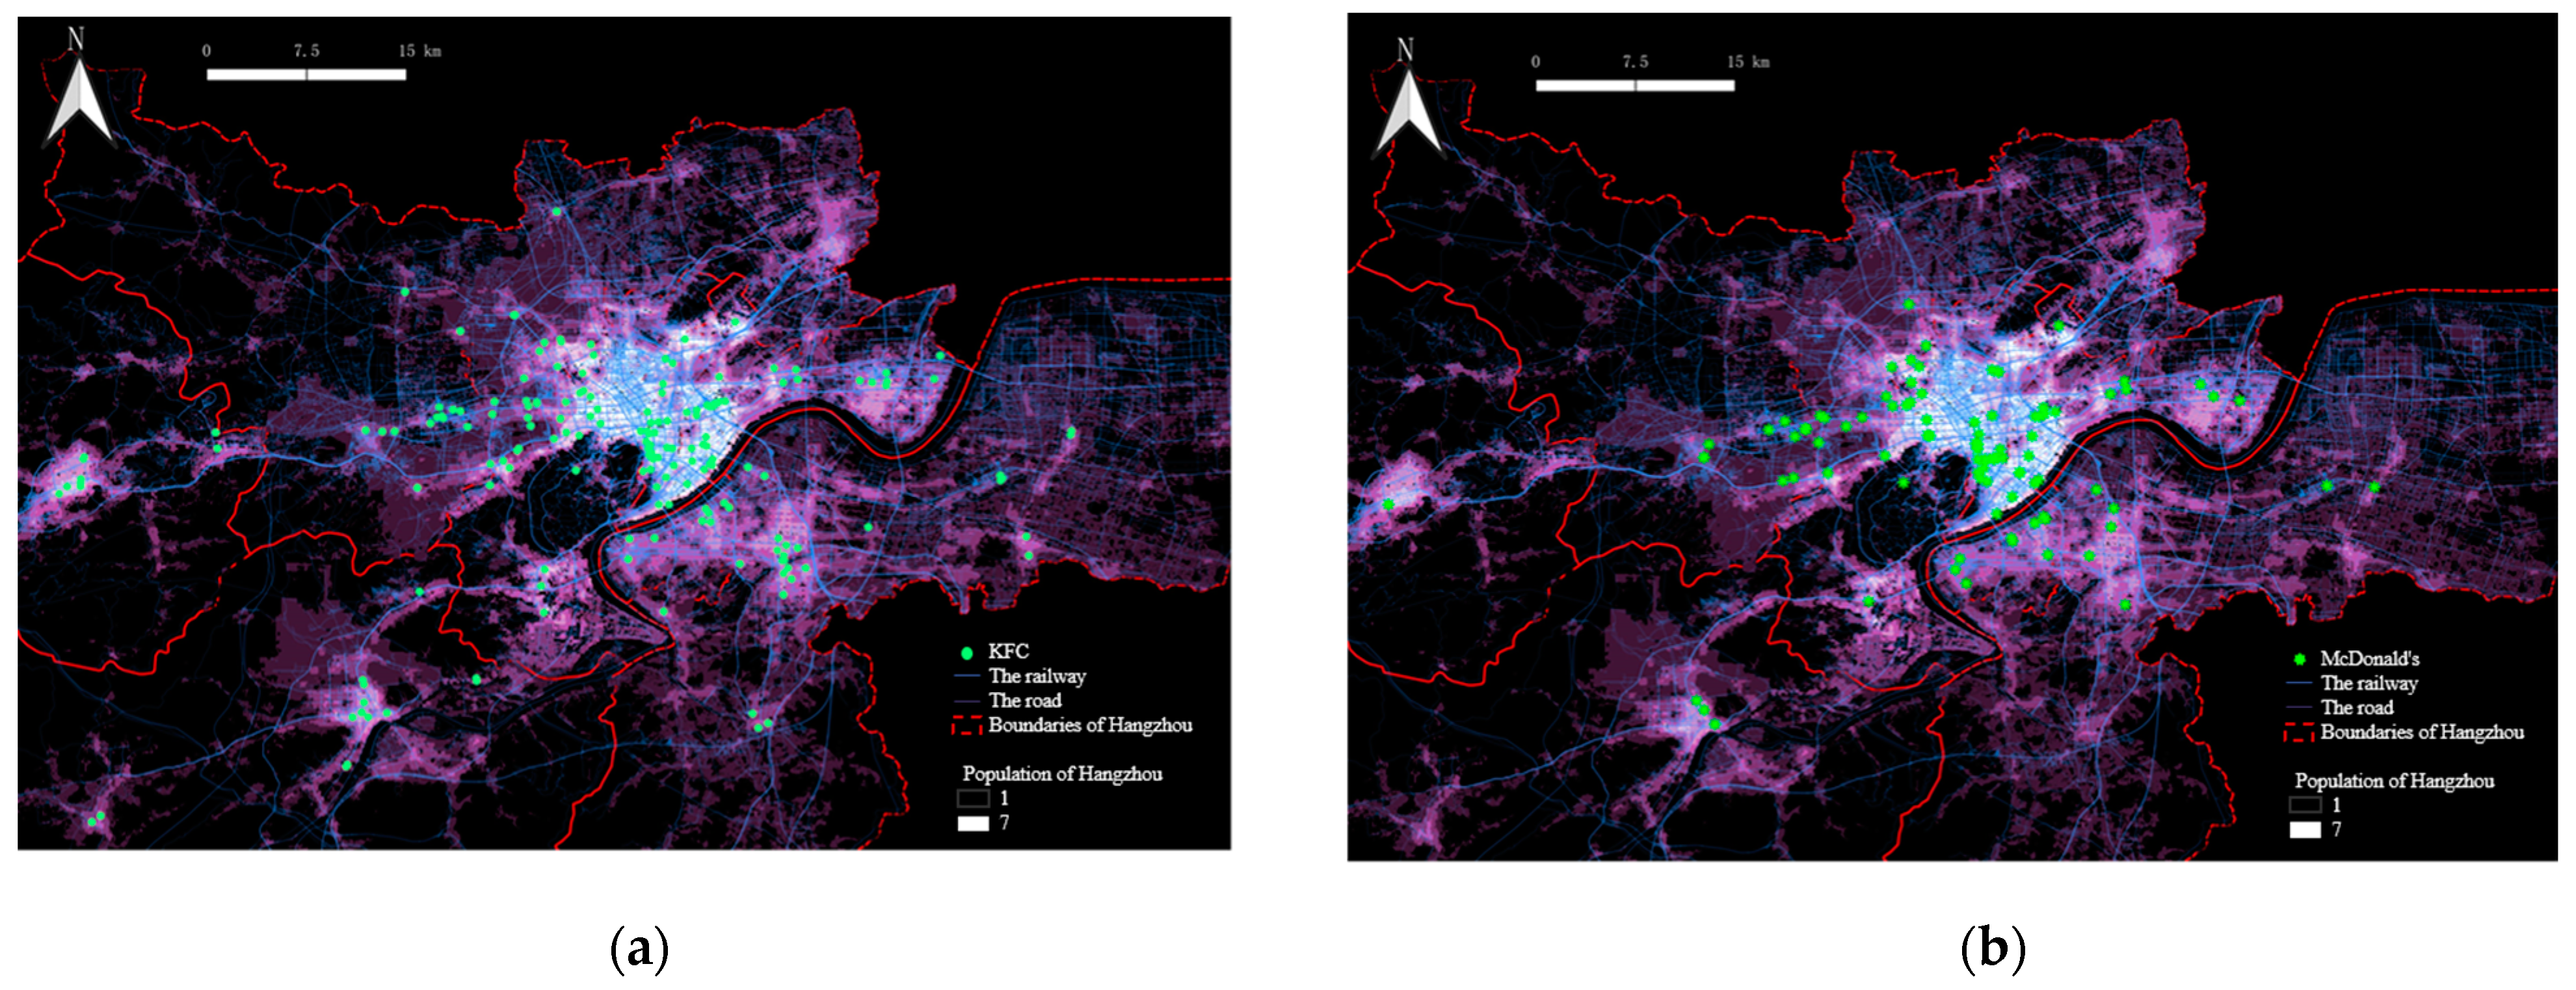
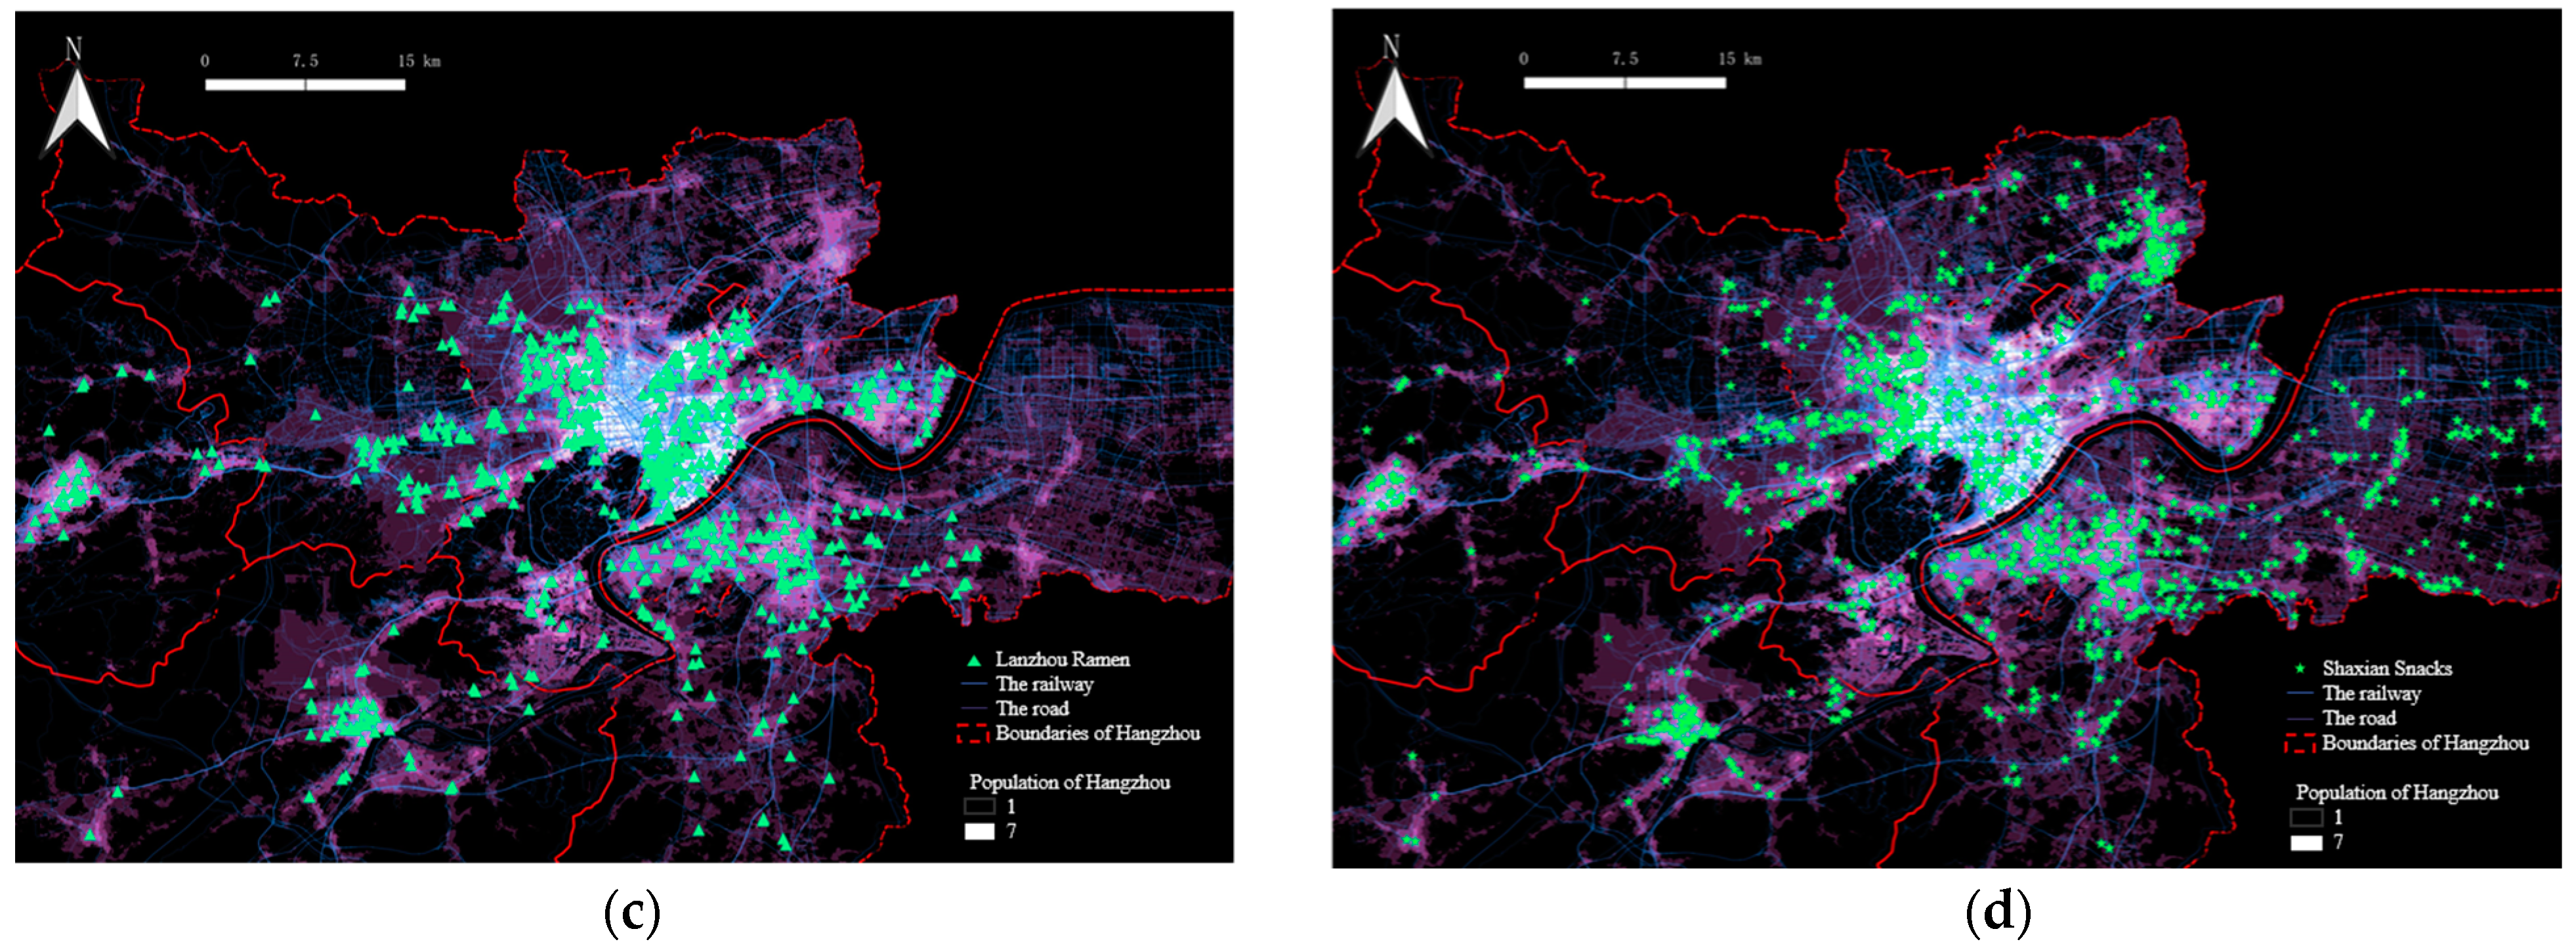
3.2.1. The Spatial Distribution of Four Kinds of Typical Fast Food

The WorldPop population data were further combined with the POI and OSM road network data to identify and evaluate the spatial distribution of the four types of fast food (Figure 5). As the four types of food were distributed in the main city area, we focused on the main city and found that the four types of food were distributed in the densely populated areas. Furthermore, KFC and McDonald’s exhibited spatial clustering patterns, most of which were located in downtown areas, whereas Lanzhou Ramen and Shaxian Snacks were widely distributed.
In total, 402 KFCs were found to be located in Hangzhou during the study period. Their locations were scattered, primarily in the main urban areas, where business activities are intensive and there are tourist attractions and nearby universities. The degree of spatial aggregation of the districts and counties outside the main city area was very low, while the layout was sparse. They were opened only near large shopping centers, highway service areas, high-speed railways, and railway stations. There were 206 McDonald’s, and the aggregates were more dispersed. High values were identified only within the main urban area, and they were clustered only near major shopping malls, supermarkets, and universities.
There were 1471 Lanzhou Ramen in Hangzhou. The scope of aggregation expanded in the main city. The number of Lanzhou Ramen in the Jianggan and Yuhang Districts was large, and the highest values were concentrated in the Gongshu and Xiacheng Districts. They were mainly distributed in stores near roads, universities, scenic spots, and high-speed railway stations, and the spatial distribution was scattered. In addition to the main city, higher values were discerned among schools, supermarkets, hotels, and railway stations. There were 2296 Shaxian Snacks in Hangzhou, and their spatial aggregation was more diffuse and dispersed than that of Lanzhou Ramen. They were distributed next to roads.

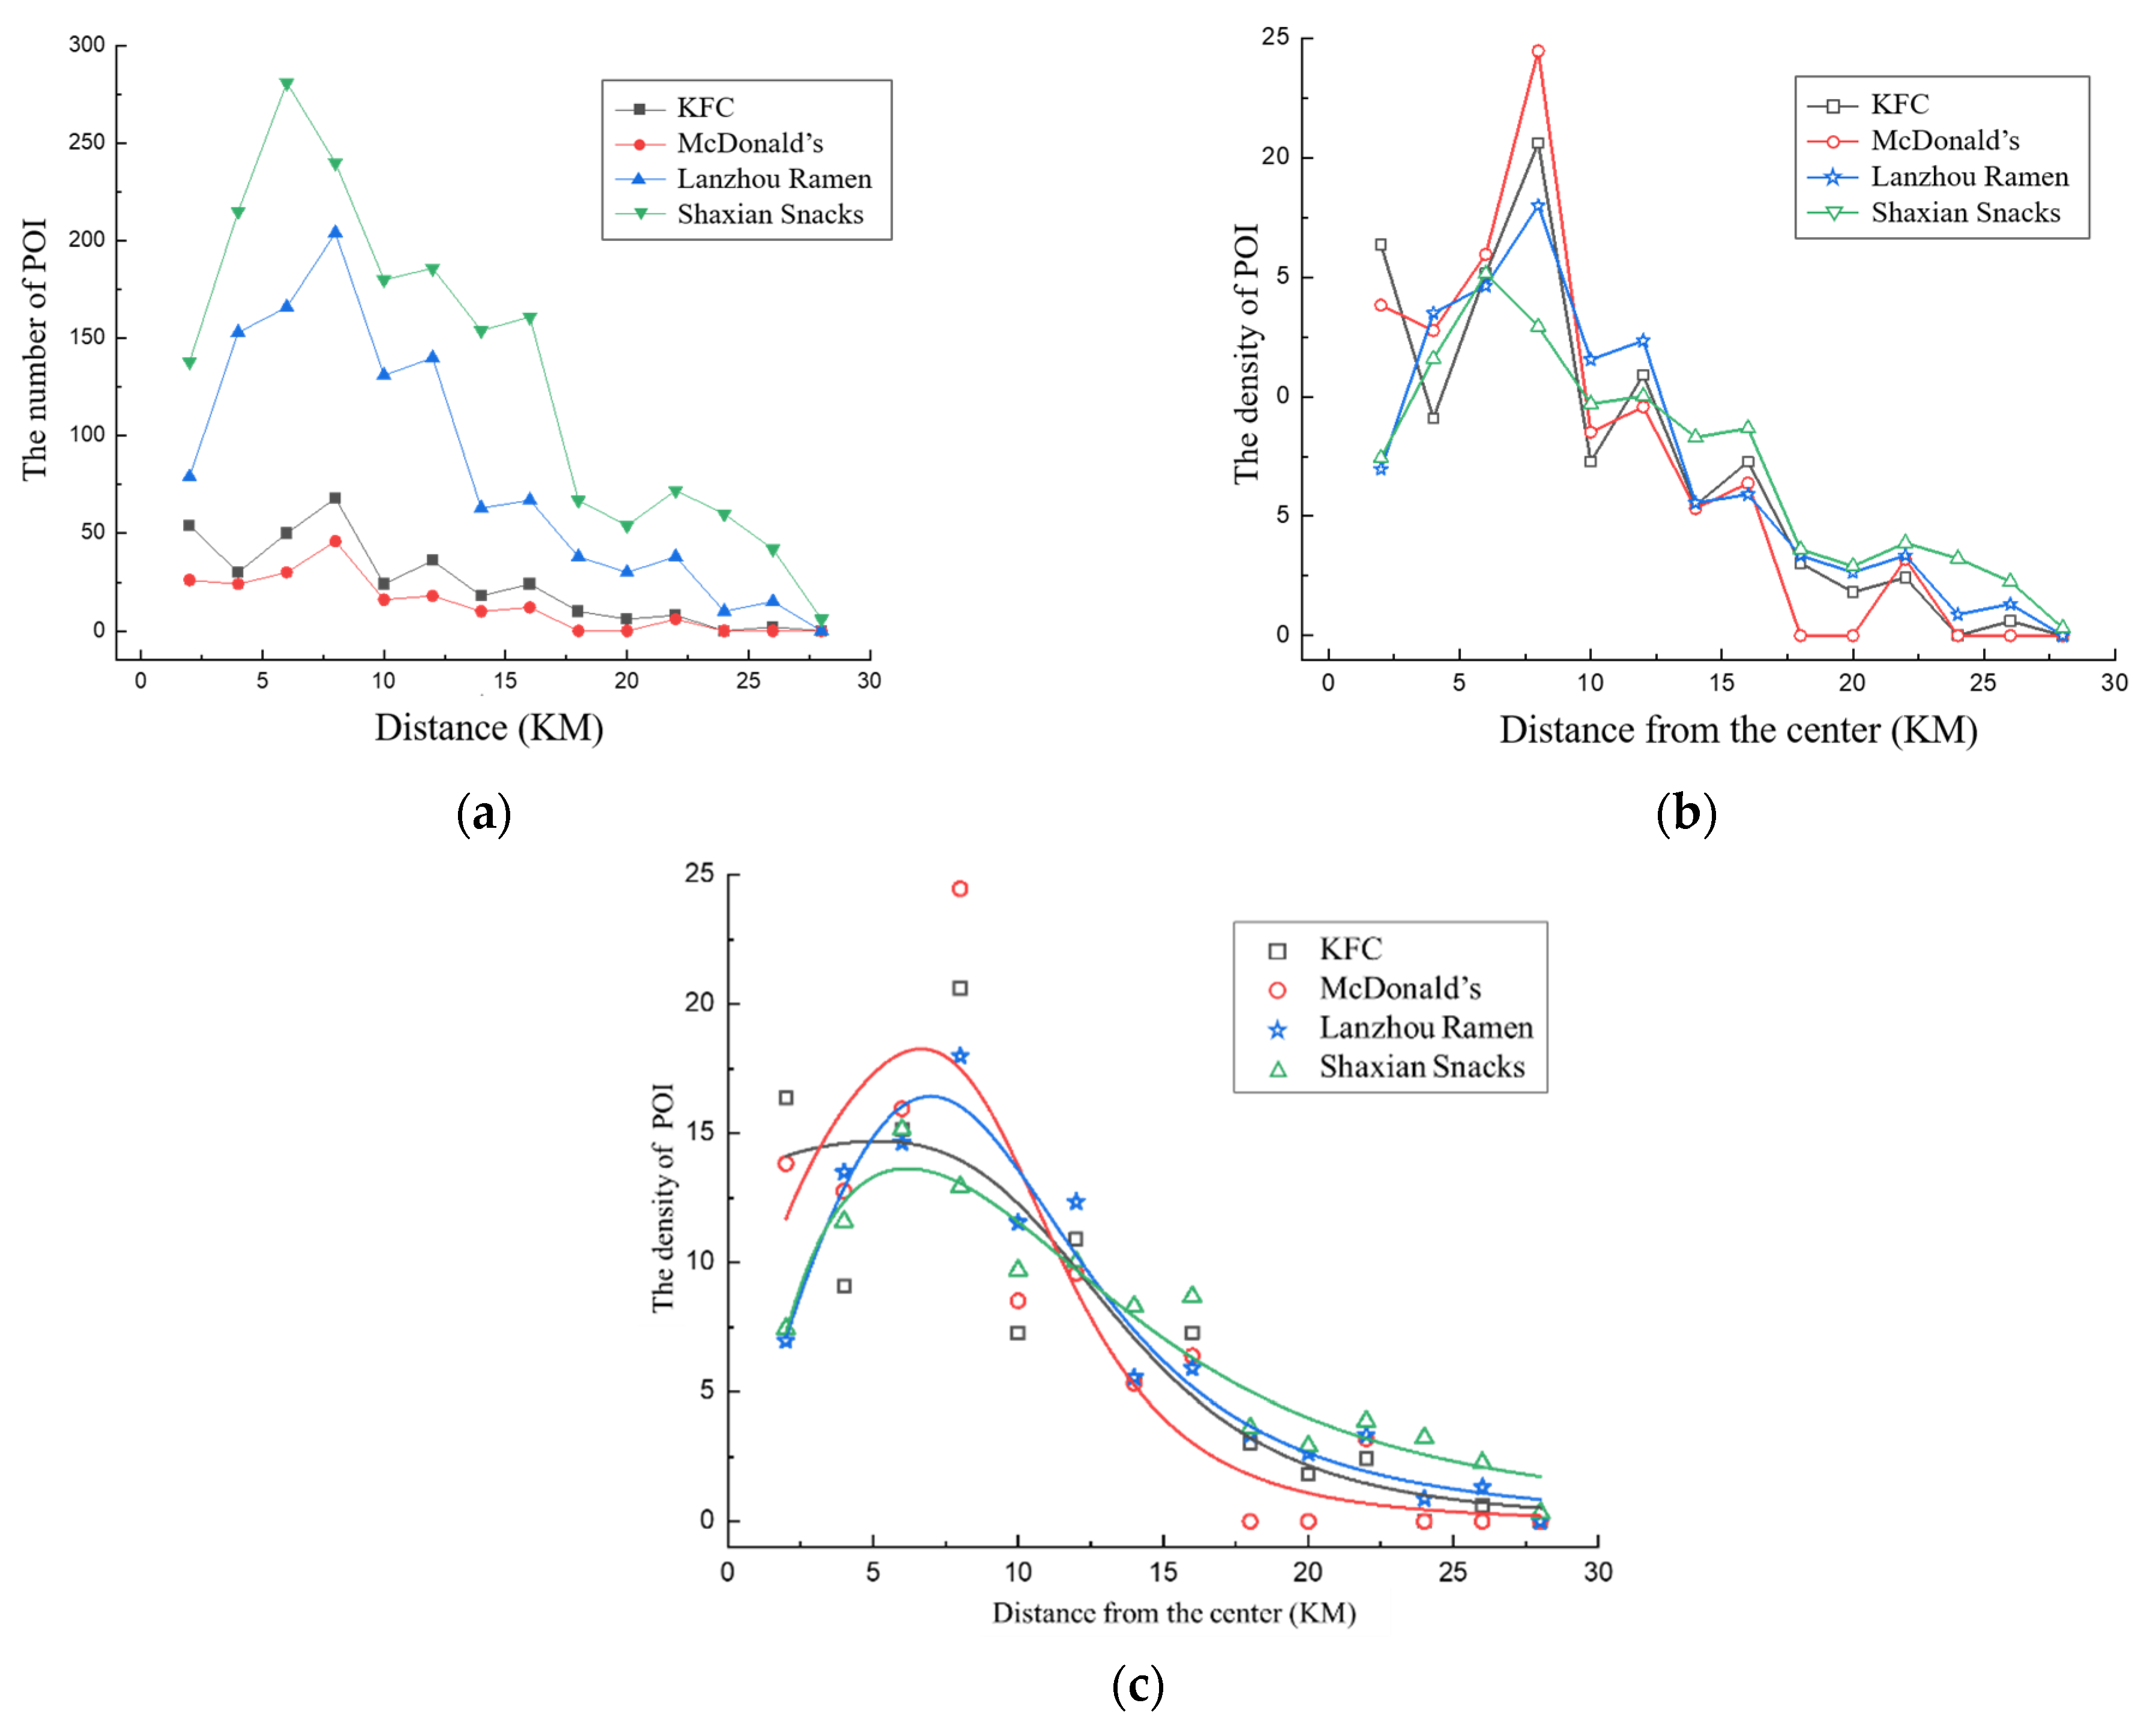
3.2.2. The “Core-Edge” Circle Structure Characteristics of Four Types of Fast Food

Hangzhou is a non-equilibrium, multi-center city. According to the “one main three deputy”, the center position was determined. The buffer was established at 2 km intervals, and the number and density of the four types of food POIs in each buffer were quantified (Figure 6). In 2021, the number of POIs for the four types of food first increased but then decreased from the center to the edge, and then gradually decreased. Of these, the number of the four types of food was the largest and ranged within 4–10 km.
There were more KFCs than McDonald’s from an abundance perspective, while Shaxian Snacks were significantly more abundant than Lanzhou Ramen, with distinct difference between them at 14–16 km and 24 km. The POI density first increased and then decreased with the increasing distance from the city center. The density near the city center was higher, while a certain density was maintained at the edge of the city. The density of Shaxian Snacks was the largest at around 6 km, and the density of the other three types reached a peak at around 8 km. The density fluctuation range of Shaxian Snacks was low and uniform, while the density fluctuation of McDonald’s was the strongest and uneven.
The fitting function was plotted according to the POI density in Figure 6c. As seen, the distribution of the POI density followed an inverse S-shaped law with the city center moving outward. The fitting function was formalized as:
y = P m [ 1 + ( K a x ) H a ] [ 1 + ( x K i ) H i ]
where y is the POI density and x is the distance from the city center. P m , K a , K i , H a , and H i are the fitting parameters, and P m is the maximum value of the POI density. K a , K i are the distances between the fastest point of the POI density increase or decrease, respectively, while H a and H i are the slope coefficients of the curve controlling the POI density equation, respectively. The function of the equation is to assign the parameter values that are generally similar to the trend of the target curve to the parameters and stop when the iteration converges or exceeds the maximum number of iterations. The fitting parameters are summarized in Table 2.
The fitting results for the number of Lanzhou Ramen and Shaxian Snacks were the best, with R 2 > 0.9. The fitting curve demonstrated that the density of the KFC POI uniformly changed over the range of 10 km. The densities of McDonald’s, Lanzhou Ramen, and Shaxian Snacks significantly increased in the range of 8 km. Then, they gradually decreased with increasing distance from the center, while the edge retained a certain density.
Compared with McDonald’s, the density of KFC was more uniform as the distance increased. The density of McDonald’s was higher than that of KFC, in the range of 10 km, while the density of KFC was larger, and the number of McDonald’s significantly decreased outside the range of 10 km. Compared with Lanzhou Ramen, the number of Shaxian Snacks exhibited weaker variability with the increasing distance. The density of Lanzhou Ramen was higher than that of Shaxian Snacks within 12 km, and the density of Shaxian Snacks was significantly higher than that of Lanzhou Ramen outside 12 km.

3.3. The Spatial Clustering and Mutual Attraction of Typical Fast Food in Hangzhou

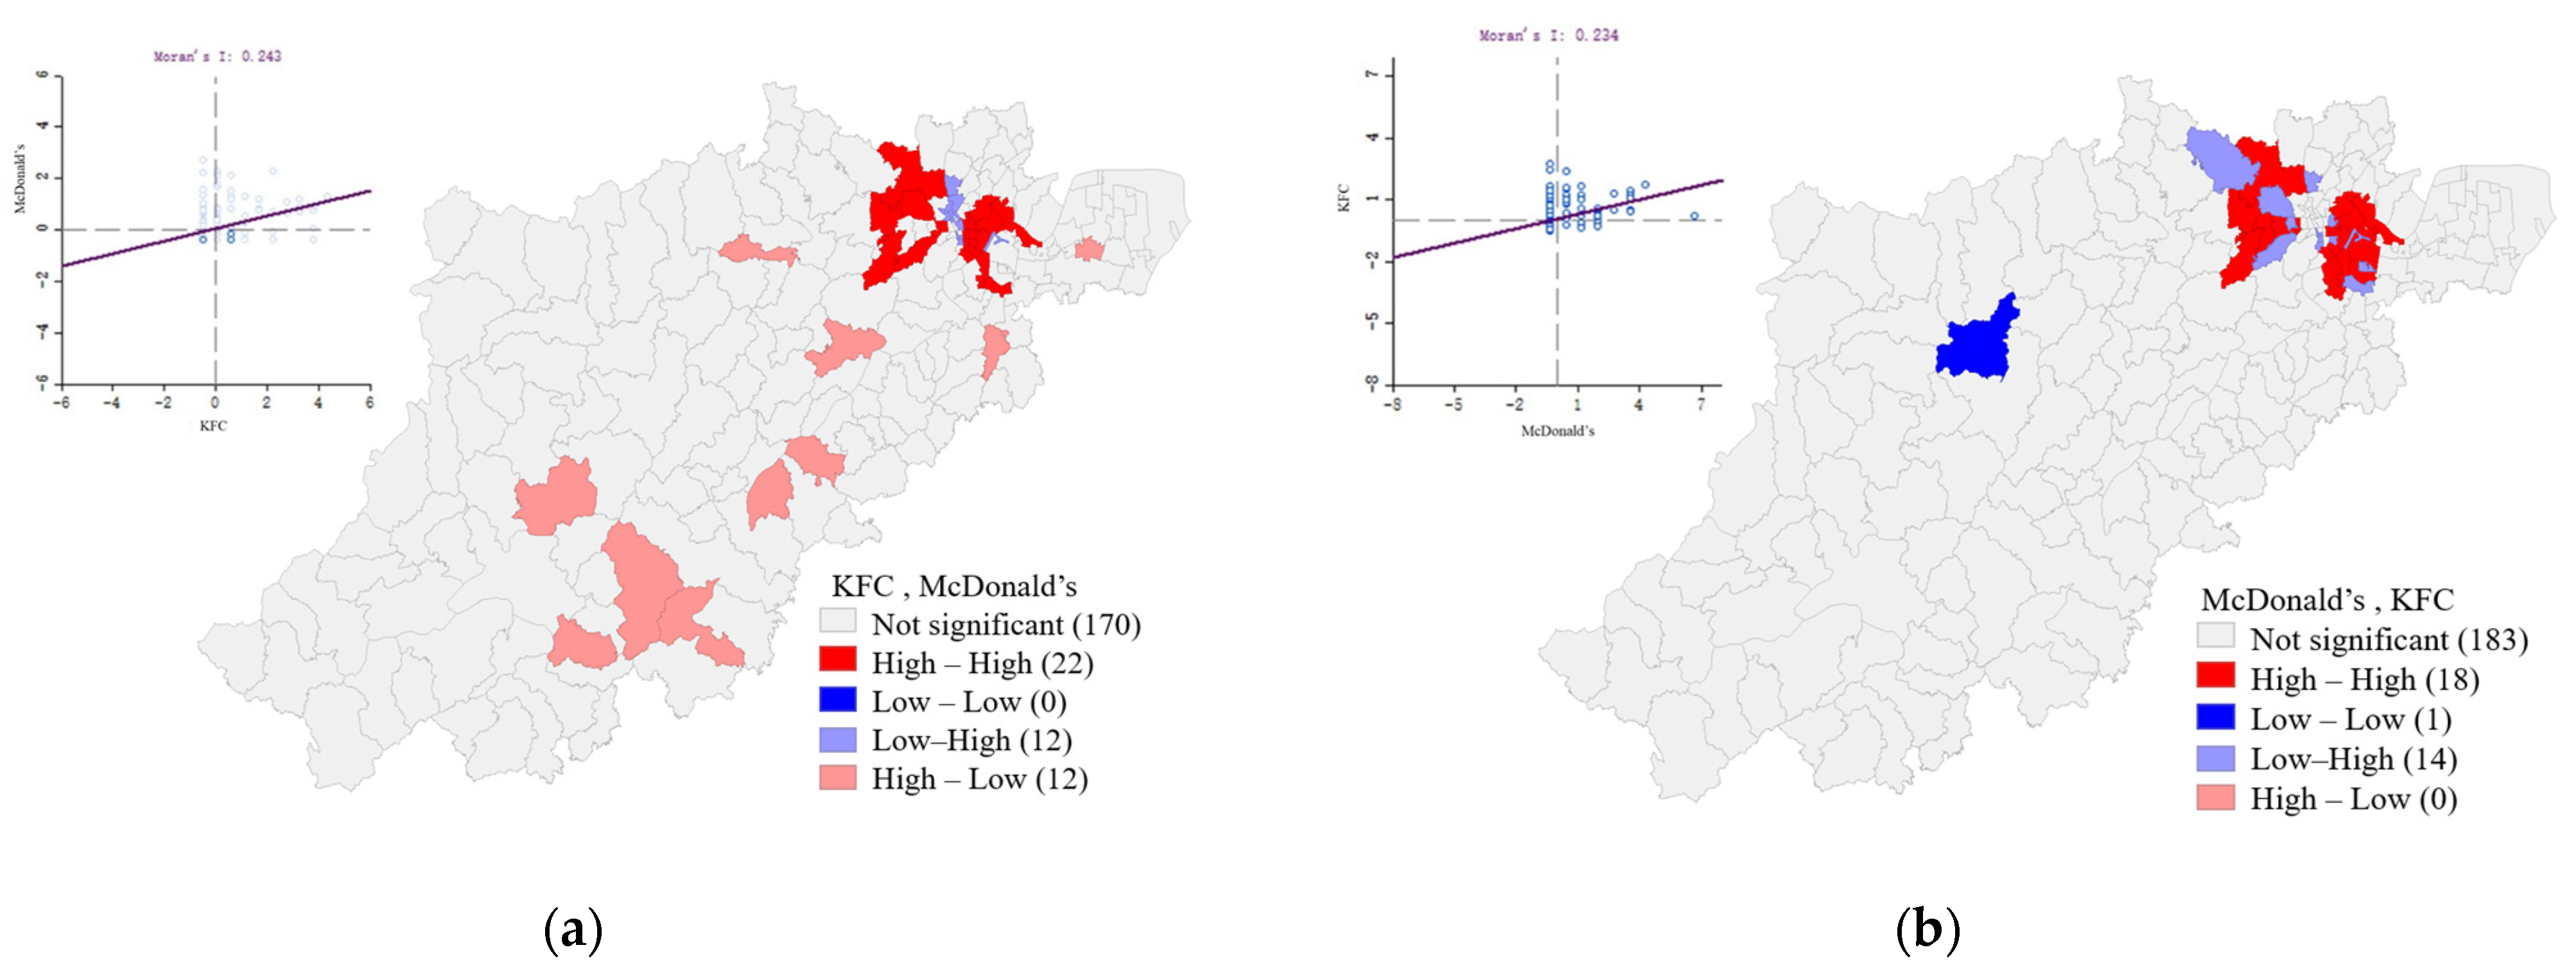
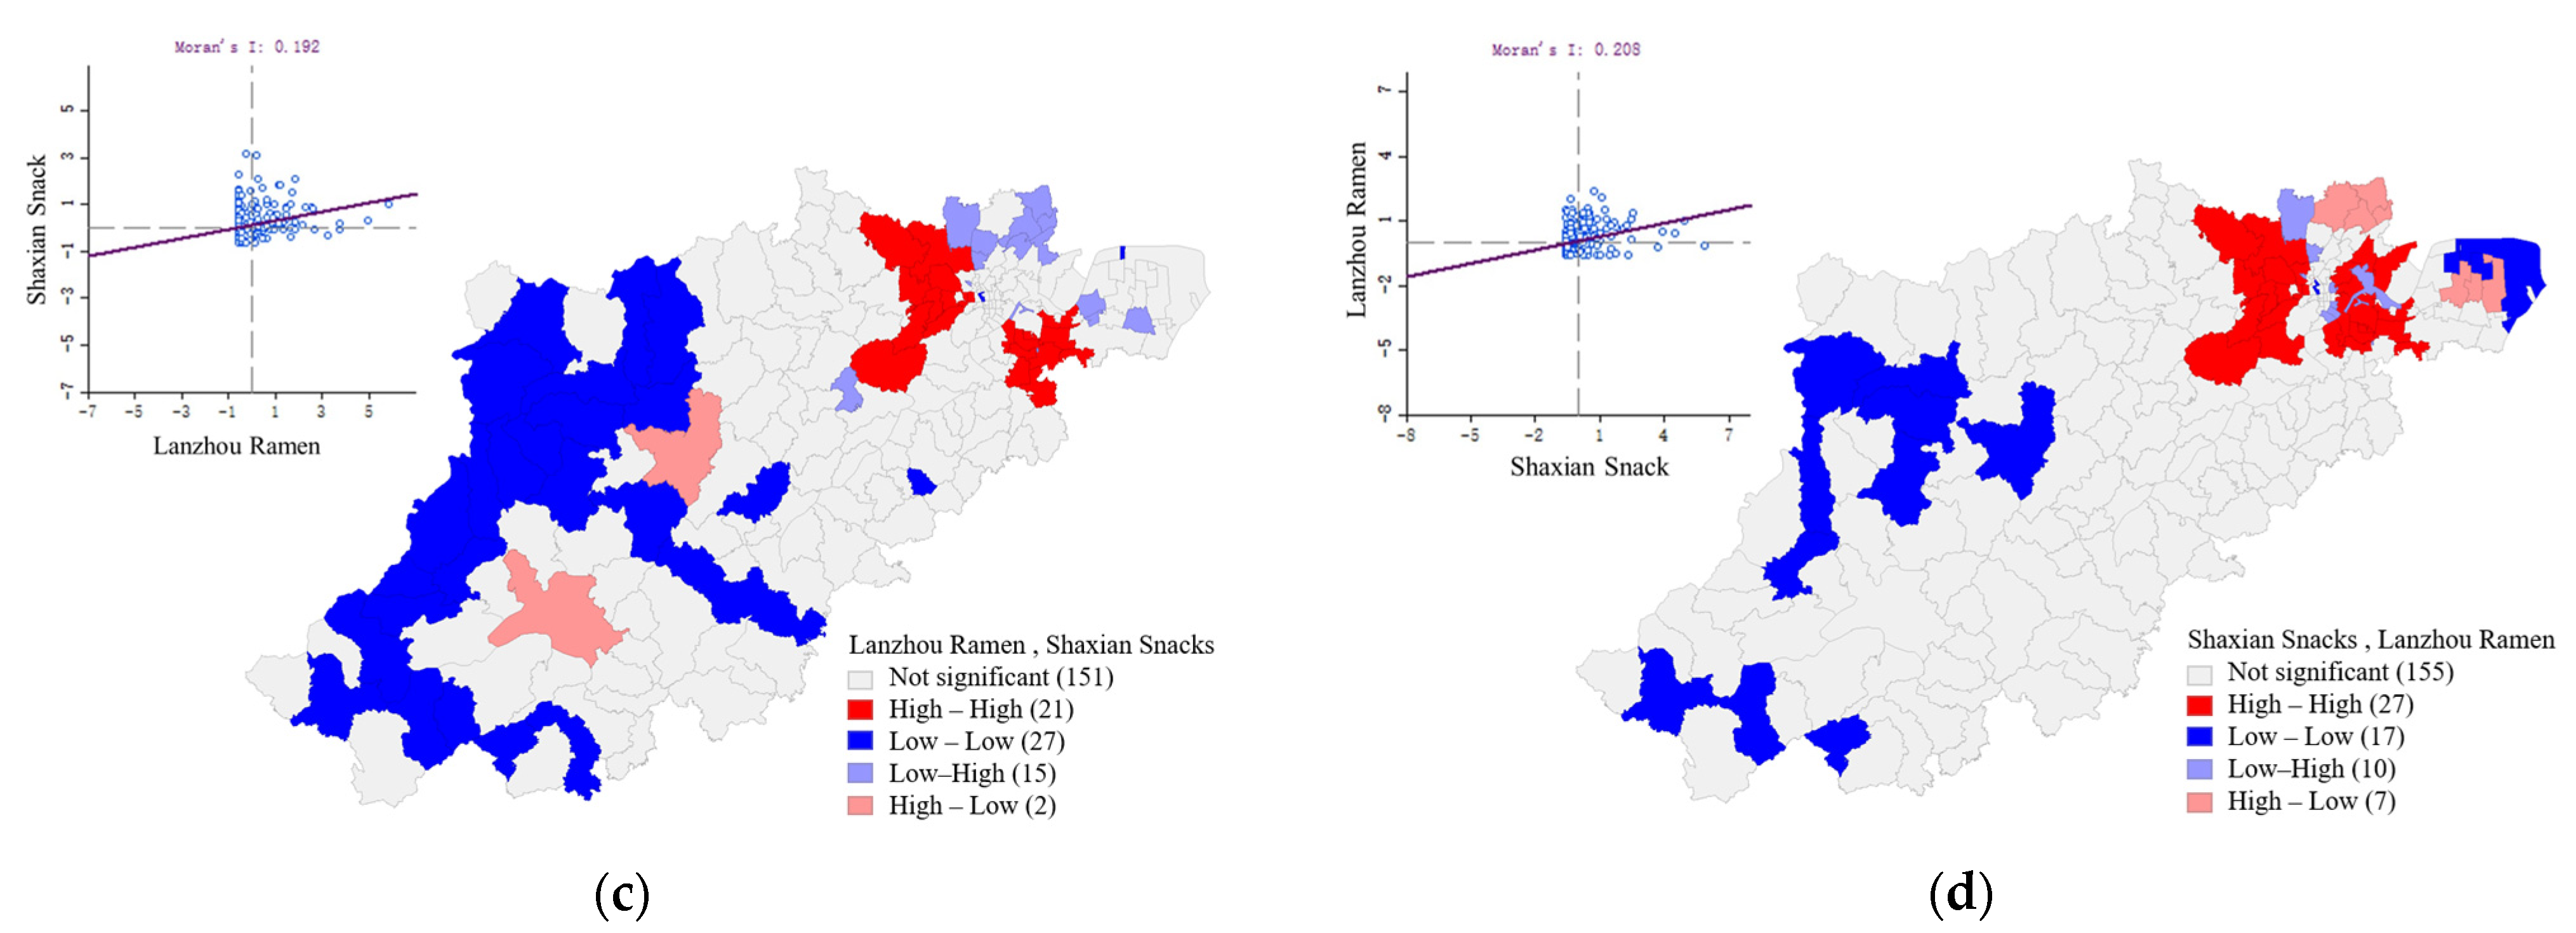
3.3.1. Bivariate Moran’s I Method

At the block scale, the degrees of local correlation between the two industries were similar. Namely, the high–high correlation between KFC and McDonald’s was mainly discerned in the Xihu and Xiaoshan Districts, while no low–low correlation blocks were identified. The high–high correlation between McDonald’s and KFC was mainly distributed in the Hangzhou, Binjiang, Shangcheng, central Xihu, western Jianggan, and northwest Xiaoshan Districts, while there were no high–low correlation blocks.
The high–high Lanzhou Ramen and Shaxian Snacks correlations were mainly distributed in the central part of Yuhang, northwest Xihu, and the central part of Xiaoshan District. Low–low correlations were mainly distributed in the west Lin’an District and northwest Chun’an County. Shaxian Snacks and Lanzhou Ramen had a high correlation distribution in central the Yuhang, West Xihu, and central Binjiang Districts. Low–low areas were in Fengshui Town, the southern Lin’an District, and eastern Xiaoshan District (Figure 7).

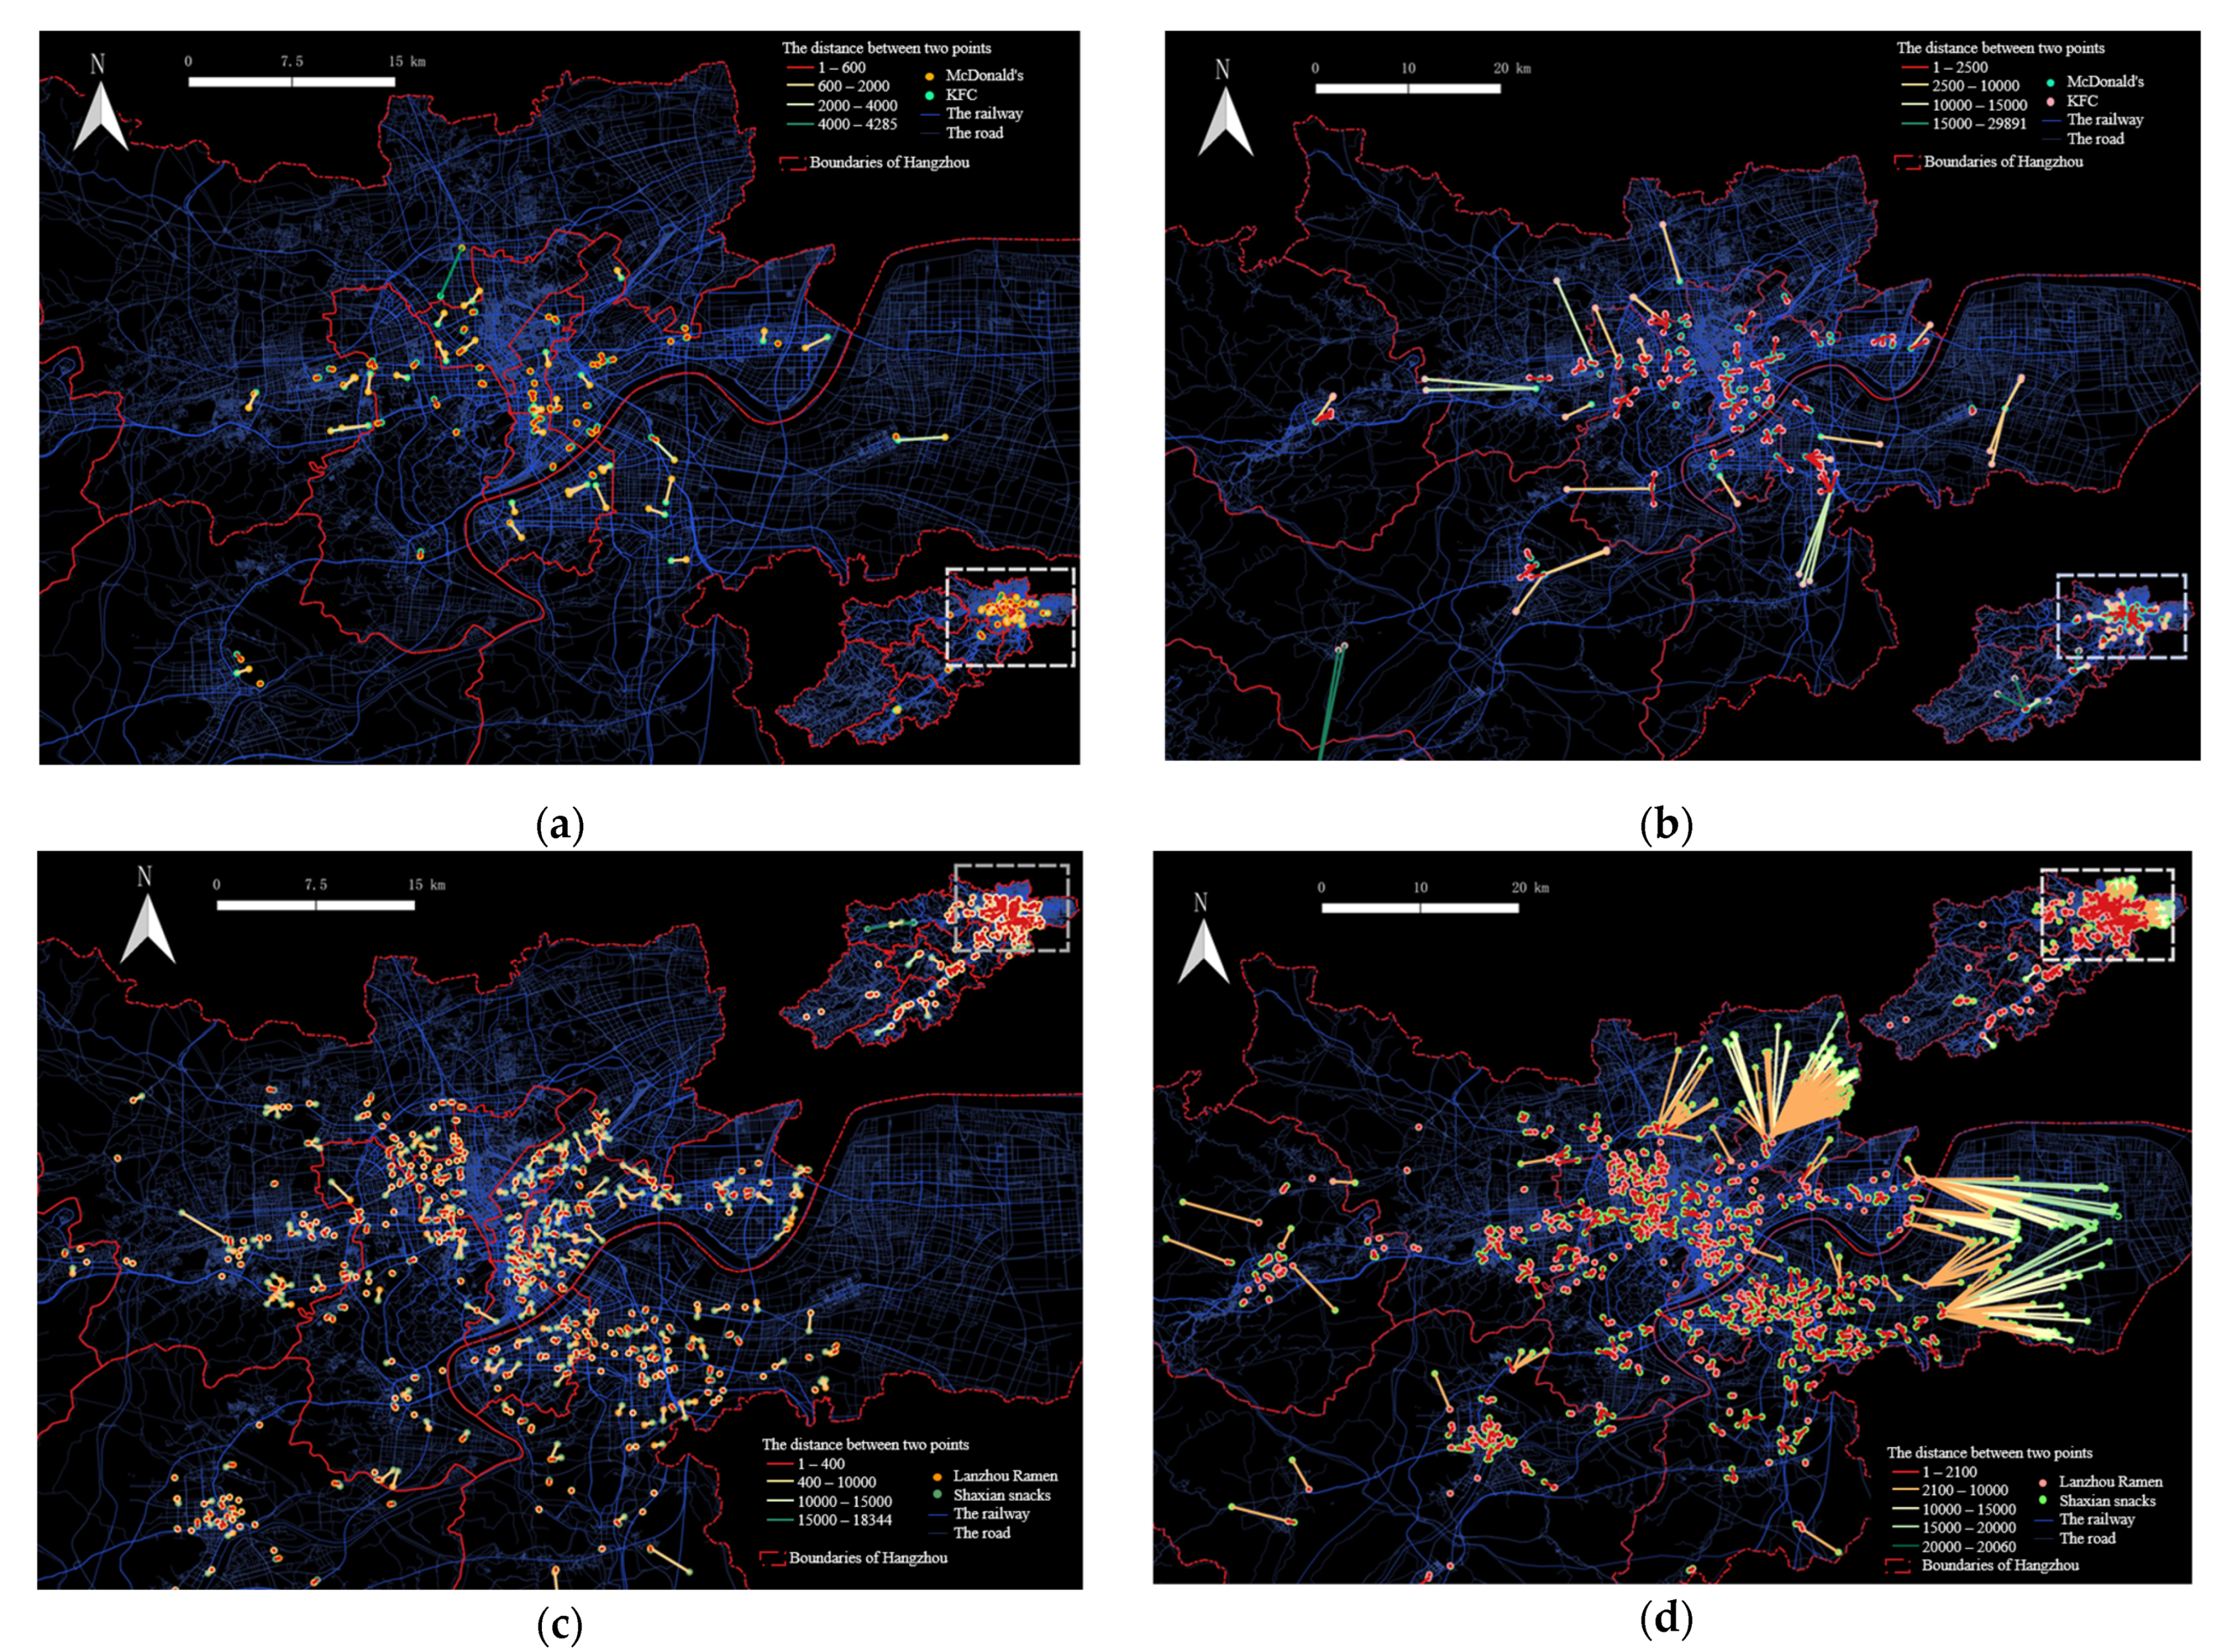
3.3.2. Geographical Proximity Analysis of the Four Kinds of Food

Using the “neighborhood unit” as the spatial scale, the geographical connection rate was calculated to be 99.4714, showing a strong geographical dependence. Thus, the geographical relationship between the KFC and McDonald’s block scale is very close, indicating that their spatial layout is consistent. The average distance of KFC from McDonald’s was 643 m, while the maximum was 4260 m and the minimum was 10 m. There were 132 KFCs whose distance was less than 640 m, and it was concluded that 64.1% of McDonald’s restaurants had a KFC within 640 m. The average distance of McDonald’s from KFC was 2500 m, while the maximum was 29,890 m and the minimum was 10 m. There were 328 McDonald’s whose distance was less than 2500 m, and it was concluded that 81.6% of the KFCs had a McDonald’s within 2500 m. As shown in Figure 8, most of the KFCs around McDonald’s were under 700 m, and most of the McDonald’s restaurants around KFCs were under 2500 m.
The geographical connection rate of the spatial distribution was 97.127. Therefore, the geographical relationship at the block scale was relatively close, indicating that the layout of the Lanzhou Ramen in Hangzhou was highly consistent with that of Shaxian Snacks. The average distance of Lanzhou Ramen from the Shaxian Snacks was 484 m, while the maximum was 18,342 m and the minimum was 1 m. There were 1008 Lanzhou Ramen with a distance of less than 400 m, and it was concluded that 68.5% of Shaxian Snacks had a Lanzhou Ramen within 400 m. The average distance of Shaxian Snacks from Lanzhou Ramen was 2162 m, while the maximum was 20,059 m and the minimum was 1 m. There were 1798 Shaxian Snacks with a distance of less than 2100 m, and it was concluded that 78.3% of Lanzhou Ramen restaurants had a Shaxian Snacks within 2100 m. Figure 8 shows that most of the Lanzhou Ramen restaurants around Shaxian Snacks were distributed within an area under 1000 m, and most of the Shaxian Snacks around Lanzhou Ramen were distributed within an area under 2500 m.

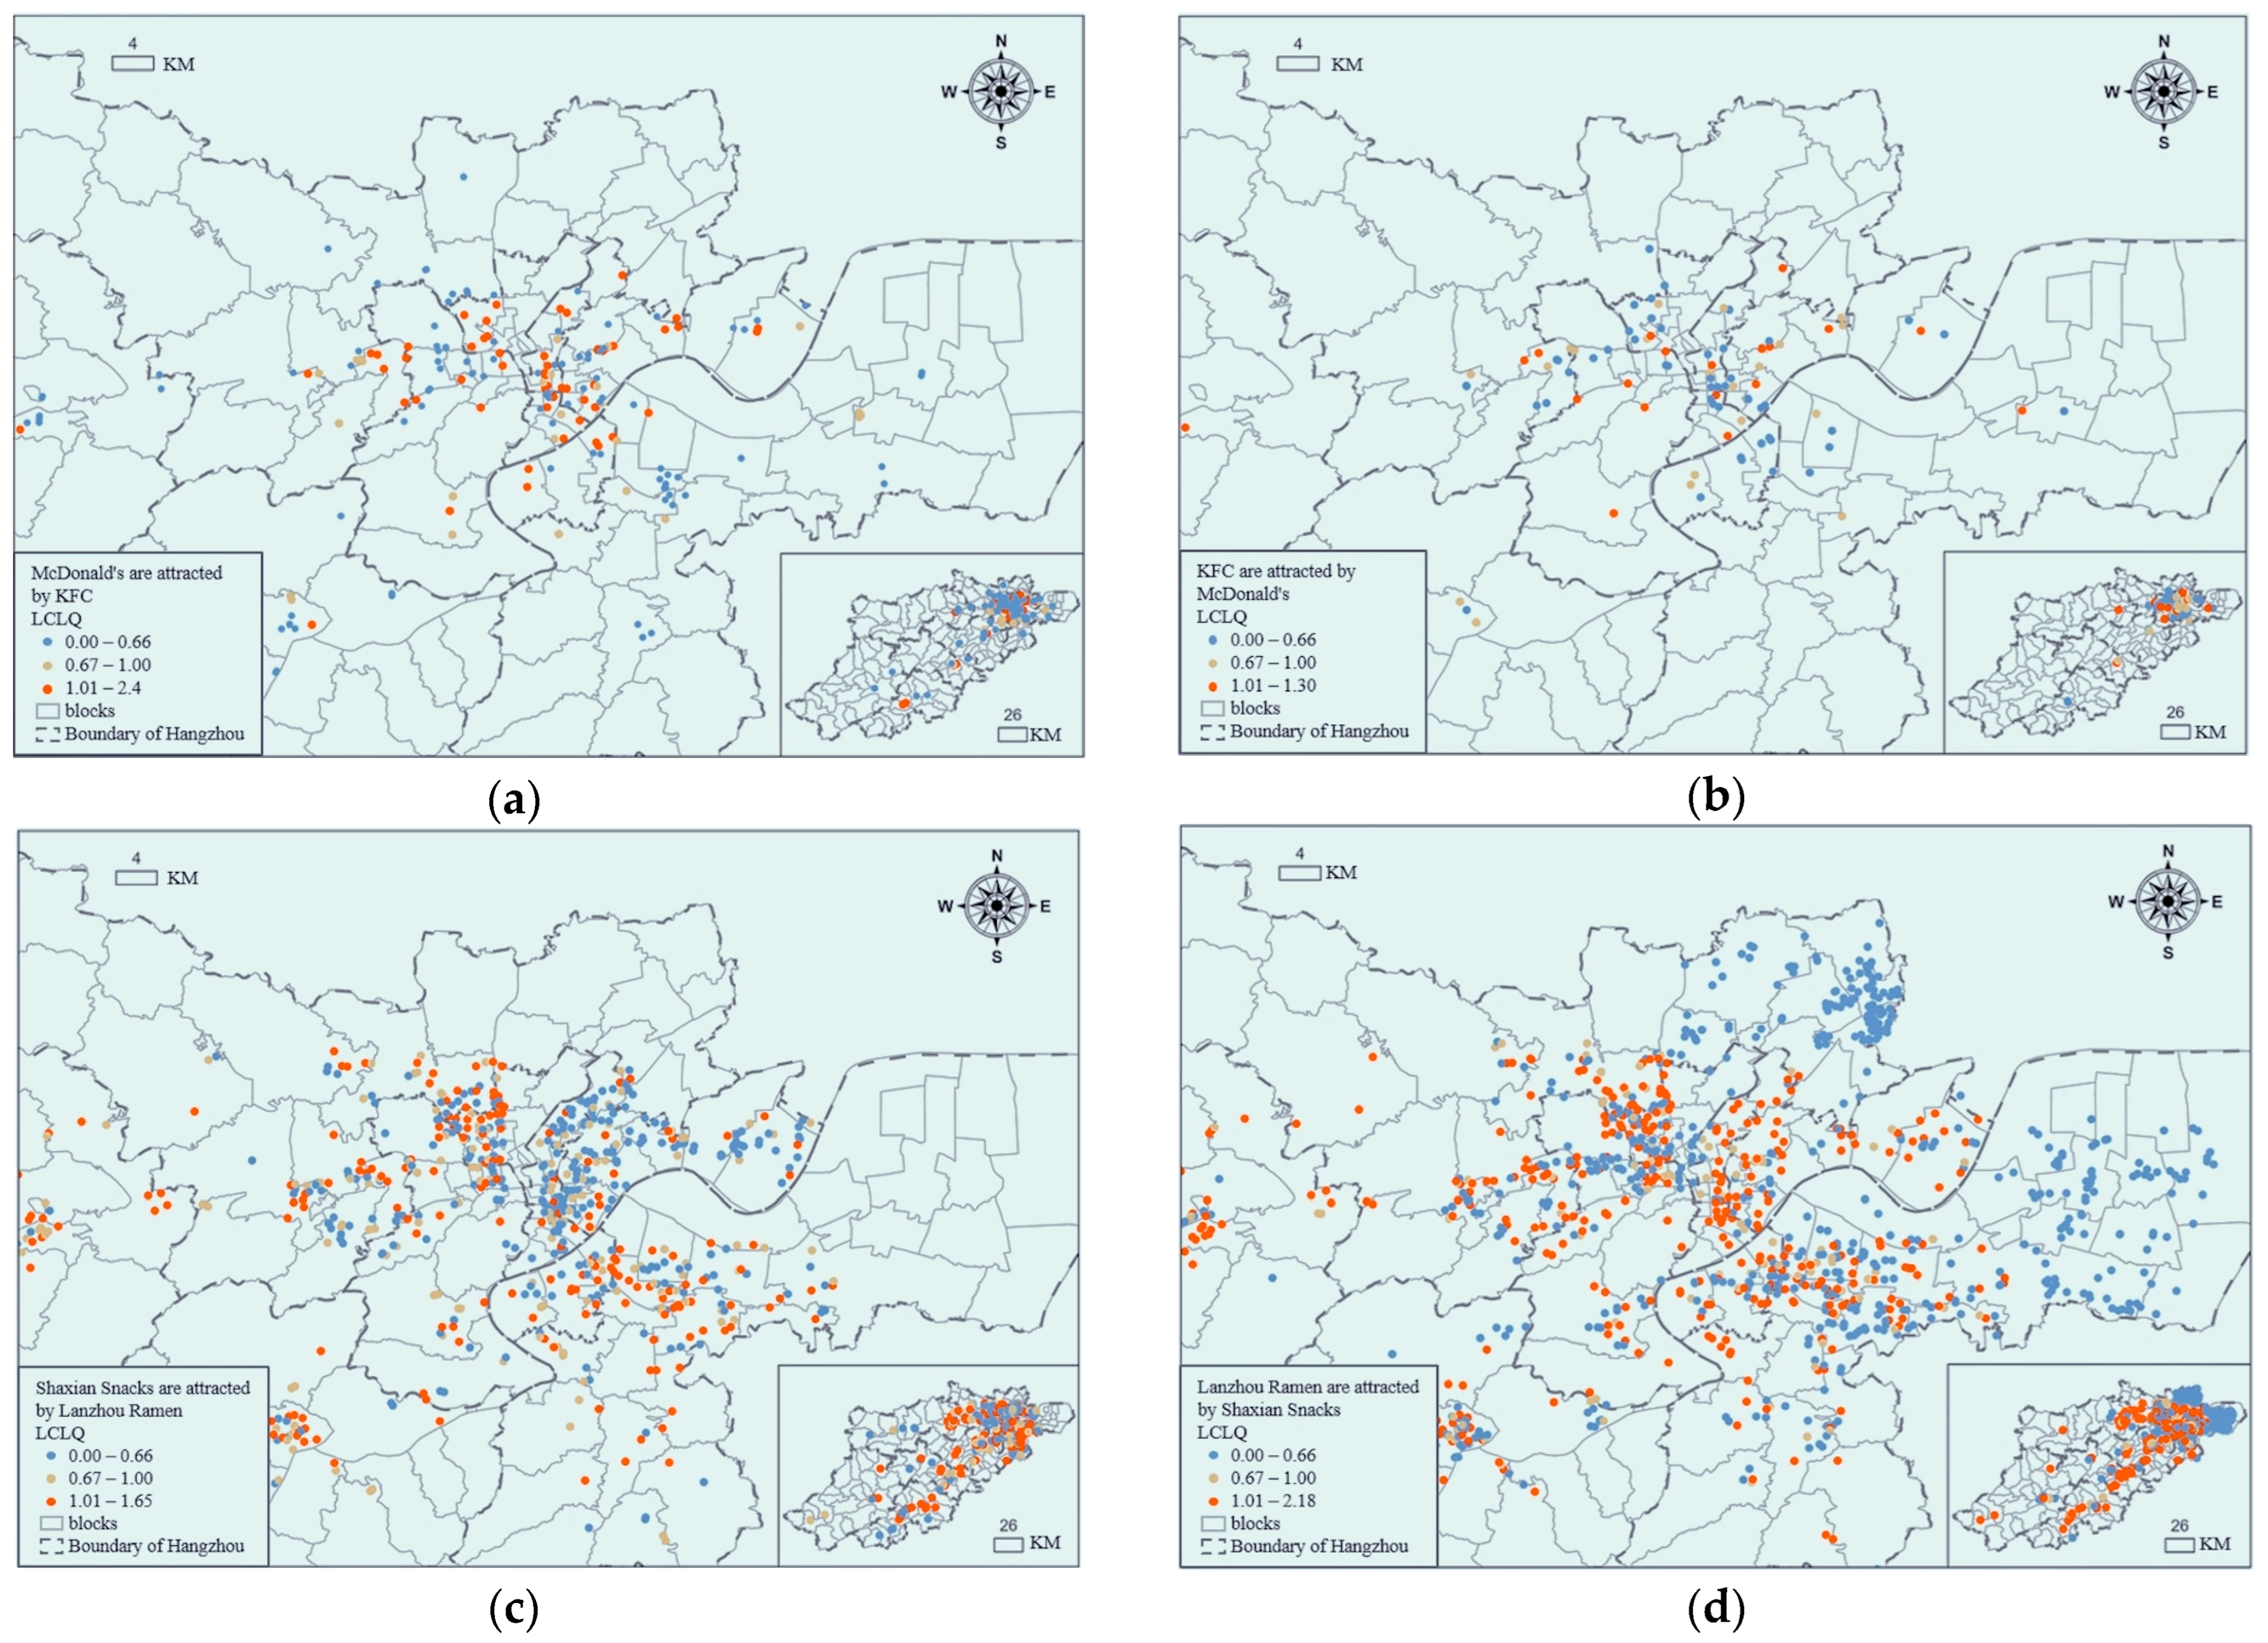
3.3.3. Collaborative Location Quotient Analysis of the Four Kinds of Food

Table 3 shows the GCLQ values for the four food types, whereas the collaborative location quotient value reflects the common location connection between the two. It was found that (1) the GCLQ of the four types of food was <1, indicating that the spatial distribution was relatively independent (p-value < 0.05), and the collaborative location quotient was statistically significant. (2) McDonald’s attractiveness to KFC was calculated to be 0.928448. KFC’s attractiveness to McDonald’s was 0.908902. The attractiveness of Shaxian Snacks to Lanzhou Ramen was 0.826835. The attractiveness of Lanzhou Ramen to Shaxian Snacks is 0.854509. The degree of McDonald’s attraction to KFC was greater than that of KFC’s attraction to McDonald’s, indicating that McDonald’s tends to be attached to KFC to some extent. The degree of attraction of Lanzhou Ramen to Shaxian Snacks was greater than that of Shaxian Snacks to Lanzhou Ramen, indicating that Lanzhou Ramen tends to be somewhat attached to Shaxian Snacks.
The local index of the collaborative location quotient was used to elucidate the spatial pattern of the spatial correlation between KFC and McDonald’s and between Lanzhou Ramen and Shaxian Snacks. Figure 9 shows the spatial pattern of the attraction intensity between KFC and McDonald’s and between Lanzhou Ramen and Shaxian Snacks.
As we can see, the spatial distribution of the mutual attraction intensity between KFC and McDonald’s was significant. As the distance from the main urban area increased, the mutual attraction ability of the two gradually decreased. The interdependence between them in the main urban area was greater than that outside the main urban area, and the outside of the main urban area exhibited independent distribution characteristics. In general, McDonald’s attraction to KFC was stronger than that of KFC to McDonald’s. McDonald’s, in the main urban area, is dependent on KFC.
The spatial difference in the attraction strength between Lanzhou Ramen and Shaxian Snacks was distinct. In commercial centers and main streets, Shaxian Snacks were strongly attracted to Lanzhou Ramen, while in alleys, Lanzhou Ramen was less attracted to Shaxian Snacks. In the eastern part of Xiaoshan District and the eastern part of Yuhang District, Shaxian Snacks were independent of the distribution of Lanzhou Ramen.

4. Discussion and Conclusions

The clustering phenomenon and spatial distribution characteristics of the catering industry stemmed from the dynamic development of the modern urban population. In this light, the analysis of these spatial structural characteristics can provide data-driven guidelines for the sustainable development of the city’s catering industry, thus also promoting the harmonious development and coordinated integration of the city and human beings. POI data were used in this study to analyze the distribution direction of the overall catering industry in Hangzhou. We combined the WorldPop population data and OSM road network data to identify and evaluate the spatial distribution of the four types of fast food. We established an inverse S-function and used the inverse S-function to fit the “core-edge” circle structure characteristics of the catering industry in Hangzhou and explore the spatial correlation, geographic association, and inter-spatial dependence of KFC and McDonald’s, on the one hand, and Lanzhou Ramen and Shaxian Snacks, on the other, in Hangzhou. We formulated the following conclusions based on the results:
(1) The northeast-to-southwest distribution of the catering industry in Hangzhou was identified. The center of the catering industry in Hangzhou was near the economic center of the main city rather than the center of the urban geography. The distribution of conspicuous hotspots in the catering industry in the main urban area exhibited clustered patterns over a large area.
(2) Four types of fast foods were distributed in the densely populated areas and exhibited an inverse S law, with the distance from the center first increasing and then decreasing. The number of the four typical fast foods was the highest within a distance of 4–10 km from the center. KFC and McDonald’s were mostly opened in the downtown area of the main urban area, while the density decreased significantly from the center to the edge. The distribution of Lanzhou Ramen and Shaxian Snacks was relatively extensive, and the density distribution from the center to the edge was relatively uniform.
(3) The spatial layouts of KFC, McDonald’s, Lanzhou Ramen, and Shaxian Snacks had a strong consistency, and the local correlations were similar. It was concluded that 81.6% of KFC had a McDonald’s within 2500 m, and 68.5% of Shaxian Snacks had a Lanzhou Ramen within 400 m. From the perspective of distance proximity, in Hangzhou, McDonald’s is near KFC, and Shaxian Snacks is near Lanzhou Ramen. McDonald’s attractiveness to KFC was 0.928448. KFC’s attractiveness to McDonald’s was 0.908902. The attractiveness of the Shaxian Snacks to Lanzhou Ramen was 0.826835. The attractiveness of Lanzhou Ramen to Shaxian Snacks was 0.854509. McDonald’s was dependent on KFC in the main urban area. Shaxian Snacks were strongly attracted to Lanzhou Ramen in commercial centers and streets. Shaxian Snacks were distributed independently in the eastern Xiaoshan and Yuhang Districts.
For practical applications, it is essential to estimate the spatiotemporal characteristics of the catering industry using big data and, thus, to elucidate the spatial variation characteristics of the catering industry’s layout. In this way, one can bolster the exchange and integration of the food culture, thus providing data-driven guidelines for site selection and urban planning and, ultimately, laying the theoretical foundations of this research field. However, there are some shortcomings and limitations of this research, such as the use of high-resolution remote sensing image data to improve the recognition accuracy or to build models, and the economic policy and other influencing factors could be analyzed to establish the catering service in the future. It is also possible to use multiple years of data for a comparative analysis across time and space. The related research methods can be further extended using machine learning techniques and game theory. These aspects can be improved in the future.

Author Contributions

Writing—original draft, visualization, writing—review and editing, Yan Zhou and Junli Li; methodology and software, Yan Zhou; data curation, Chen Wang, Yixue Liao, and Xuan Shen; funding acquisition, supervision, and conceptualization, Junli Li. All authors have read and agreed to the published version of the manuscript.

Funding

This research was funded by the Natural Science Foundation of Anhui Province (No. 2108085MD29), National Natural Science Foundation of China (No. 41571400), Offline Excellent Course of Anhui Province (No. 2021xxkc038), National College Student Entrepreneurship Project (No. 202110364081), and the College Student Entrepreneurship Project of Anhui Agricultural University (No. XJDC2021381).

Data Availability Statement

The data used to support the findings of this study are available from the corresponding author upon request via email.

Conflicts of Interest

The authors declare that they have no known competing financial interests or personal relationships that could have influenced the work reported in this study.

References

  1. Fang, J. The Distribution Characteristics and Clustering Mechanism of Korean Catering Service in Wudaokou District, Beijing. Econ. Geogr. 2014, 34, 106–113. [Google Scholar] [CrossRef]
  2. Zhang, F.; Zu, J.; Hu, M.; Zhu, D.; Kang, Y.; Gao, S.; Zhang, Y.; Huang, Z. Uncovering inconspicuous places using social media check-ins and street view images. Comput. Environ. Urban Syst. 2019, 81, 101478. [Google Scholar] [CrossRef]
  3. Psyllidis, A.; Gao, S.; Hu, Y.; Kim, E.-K.; McKenzie, G.; Purves, R.; Yuan, M.; Andris, C. Points of Interest (POI): A commentary on the state of the art, challenges, and prospects for the future. Comput. Urban Sci. 2022, 2, 20. [Google Scholar] [CrossRef] [PubMed]
  4. Wu, L.; Liu, L.; Tian, Y.; Xiao, C.; Liu, L. Spatial Pattern Analysis of Geographic Features Using Network K-Function Methods with a Case Study of Restaurant Distribution in Hong Kong Island. Geogr. Geo-Inf. Sci. 2013, 29, 7–11. [Google Scholar] [CrossRef]
  5. Putri, S.R.; Wijayanto, A.W.; Sakti, A.D. Developing Relative Spatial Poverty Index Using Integrated Remote Sensing and Geospatial Big Data Approach: A Case Study of East Java, Indonesia. ISPRS Int. J. Geo-Inf. 2022, 11, 275. [Google Scholar] [CrossRef]
  6. Andrade, R.; Alves, A.; Bento, C. POI Mining for Land Use Classification: A Case Study. ISPRS Int. J. Geo-Inf. 2020, 9, 493. [Google Scholar] [CrossRef]
  7. Cichosz, P. Urban Crime Risk Prediction Using Point of Interest Data. ISPRS Int. J. Geo-Inf. 2020, 9, 459. [Google Scholar] [CrossRef]
  8. Sheng, Q.; Li, M.; Zhang, X. Location Does Not Matters in Informational Age?: A Case Study on the Distribution of Restaurants Listed in Dazhong Dianping in Beijing. In Proceedings of the 11th International Symposium on Environmental Behavior Research, Guangzhou, China, 7–9 November 2014; pp. 1325–1335. [Google Scholar]
  9. Xu, Y.; Hu, L.; Gao, S.; Wang, M.; Ding, J.; Qiu, Y.; Zhang, F.; Du, Z.; Liu, R. Perception of urban population characteristics through dietary taste patterns based on takeout data. Cities 2022, 131, 103910. [Google Scholar] [CrossRef]
  10. Lai, J.; Lansley, G.; Haworth, J.; Cheng, T. A name-led approach to profile urban places based on geotagged Twitter data. Trans. GIS 2019, 24, 858–879. [Google Scholar] [CrossRef]
  11. Shabrina, Z.; Buyuklieva, B.; Ng, M.K.M. Short-Term Rental Platform in the Urban Tourism Context: A Geographically Weighted Regression (GWR) and a Multiscale GWR (MGWR) Approaches. Geogr. Anal. 2020, 53, 686–707. [Google Scholar] [CrossRef]
  12. Zhang, H.; Xu, S.; Liu, X.; Liu, C. Near “real-time” estimation of excess commuting from open-source data: Evidence from China’s megacities. J. Transp. Geogr. 2021, 91, 102929. [Google Scholar] [CrossRef]
  13. Meng, B.; Zhan, D.; Hao, L. The Influence of Residents’ Residential Behavior on the Separation of Work and Housing in Beijing. Urban Issues 2013, 10, 33–39. [Google Scholar] [CrossRef]
  14. Kang, Y.; Wu, K.; Gao, S.; Ignavier, N.; Rao, J.; Ye, S.; Zhang, F.; Fei, T. STICC: A multivariate spatial clustering method for repeated geographic pattern discovery with consideration of spatial contiguity. Int. J. Geogr. Inf. Sci. 2022, 36, 1–32. [Google Scholar] [CrossRef]
  15. Dam, A.; Gomez-Lievano, A.; Neffke, F.; Frenken, K. An information-theoretic approach to the analysis of location and colocation patterns. J. Reg. Sci. 2022, 1–41. [Google Scholar] [CrossRef]
  16. Xue, B.; Xiao, X.; Li, J. Identification method and empirical study of urban industrial spatial relationship based on POI big data: A case of Shenyang City, China. Geogr. Sustain. 2020, 1, 152–162. [Google Scholar] [CrossRef]
  17. Zhang, H.; Zhou, X.; Tang, G.; Xiong, L.; Dong, K. Mining spatial patterns of food culture in China using restaurant POI data. Trans. GIS 2020, 25, 579–601. [Google Scholar] [CrossRef]
  18. Qiu, L.; Shen, Y.; Ren, W. Industrial Relevancy and Spatial Distribution between Producer Services and Manufacturing in Beijing City. Acta Geogr. Sin. 2008, 63, 1299–1310. [Google Scholar]
  19. Yu, W.; Ai, T.; He, Y.; Shao, S. Spatial co-location pattern mining of facility points-of-interest improved by network neighborhood and distance decay effects. Int. J. Geogr. Inf. Sci. 2017, 31, 280–296. [Google Scholar] [CrossRef]
  20. Meng, B.; Gao, L.; Li, R. Spatial correlation analysis of residential and employment elements in Beijing based on collaborative location quotient. Acta Geogr. Sin. 2021, 76, 1380–1393. [Google Scholar]
  21. Li, Q.; Cui, C.; Liu, F.; Wu, Q.; Run, Y.; Han, Z. Multidimensional Urban Vitality on Streets: Spatial Patterns and Influence Factor Identification Using Multisource Urban Data. ISPRS Int. J. Geo-Inf. 2021, 11, 2. [Google Scholar] [CrossRef]
  22. Du, P. Analysis of Shenyang Food Space Pattern Based on POI Big Data. Geomat. Spat. Inf. Technol. 2021, 44, 130–134. [Google Scholar]
  23. Li, X. Recognition of Urban Polycentric Structure Based on Spatial Aggregation Characteristics of POI Elements: A Case of Zhengzhou City. Acta Sci. Nat. Univ. Pekin. 2020, 56, 692–702. [Google Scholar]
  24. Lu, C.; Pang, M.; Zhang, Y.; Li, H.; Lu, C.; Tang, X.; Cheng, W. Mapping Urban Spatial Structure Based on POI (Point of Interest) Data: A Case Study of the Central City of Lanzhou, China. ISPRS Int. J. Geo-Inf. 2020, 9, 92. [Google Scholar] [CrossRef] [Green Version]
  25. Chen, W.; Liu, L.; Liang, Y. Retail center recognition and spatial aggregating feature analysis of retail formats in Guangzhou based on POI data. Geogr. Res. 2016, 35, 703–716. [Google Scholar]
  26. Rogerson, P.A. Getis–Ord Statistic for Spatially. Geogr. Anal. 2015, 47, 20–33. [Google Scholar] [CrossRef]
  27. Xue, B.; Xiao, X.; Li, J.; Jiang, L.; Xie, X. POI-Based Analysis on Retail’s Spatial Hot Blocks at a City Level: A Case Study of Shenyang, China. Econ. Geogr. 2018, 38, 36–43. [Google Scholar]
  28. Chen, L.; Liu, Y.; Huang, K. Spatial Agglomeration Characteristics of Leisure Industry: Economic Geography Explanation of ‘Sensual Pleasure’[A]. The Economic Geography Committee of China Geography Association. The Summary Collection of the Academic Annual Meeting of the Economic Geography Committee of China Geography Association in 2019[C]. The Economic Geography Committee of China Geography Association: China Geography Associatio. 2019, pp. 200–201. Available online: https://kns.cnki.net/kcms/detail/detail.aspx?FileName=ZGDQ201906001191&DbName=CPFD2019 (accessed on 8 November 2022).
  29. Wang, J.; Zhang, X.; Hao, J.; Gao, Z. Square Function Research Using POI Data: A Case Study of Chengguan District, Lanzhou City. J. Geomat. 2021, 46, 103–106. [Google Scholar]
  30. Wu, T.; Tang, Z. Division and Identification of Urban Functional Areas based on POI-take Main Urban Area of Quanzhou as an Example. J. Liaoning Univ. (Nat. Sci. Ed.) 2021, 48, 28–37. [Google Scholar]
  31. Wang, X.; Chen, J.; Pei, T.; Song, C.; Liu, Y.; Shu, H.; Guo, S.; Chen, X. I-index for quantifying an urban location’s irreplaceability. Comput. Environ. Urban Syst. 2021, 90, 101711. [Google Scholar] [CrossRef]
  32. Huang, W.; Cui, L.; Chen, M.; Zhang, D.; Yao, Y. Estimating urban functional distributions with semantics preserved POI embedding. Int. J. Geogr. Inf. Sci. 2022, 36, 1905–1930. [Google Scholar] [CrossRef]
  33. Liu, W.; Liu, Q.; Deng, M.; Cai, J.; Yang, J. Discovery of statistically significant regional co-location patterns on urban road networks. Int. J. Geogr. Inf. Sci. 2022, 36, 749–772. [Google Scholar] [CrossRef]
  34. Jiao, L.; Dong, T. Inverse S-Shape Rule of Urban Land Density Distribution and Its Applications. J. Geomat. 2018, 43, 8–16. [Google Scholar] [CrossRef]
  35. Lan, T.; Yu, M.; Xu, Z.; Wu, Y. Temporal and Spatial Variation Characteristics of Catering Facilities Based on POI Data: A Case Study within 5th Ring Road in Beijing. Procedia Comput. Sci. 2018, 131, 1260–1268. [Google Scholar] [CrossRef]
  36. Belcastro, L.; Kechadi, M.T.; Marozzo, F.; Pastore, L.; Talia, D.; Trunfio, P. Parallel extraction of regions-of-interest from social media data. Concurr. Comput. Pract. Exper. 2021, 33, e5638. [Google Scholar] [CrossRef]
  37. Yang, J.; Yi, D.; Qiao, B.; Zhang, J. Spatio-Temporal Change Characteristics of Spatial-Interaction Networks: Case Study within the Sixth Ring Road of Beijing, China. ISPRS Int. J. Geo-Inf. 2019, 8, 273. [Google Scholar] [CrossRef] [Green Version]
  38. Qian, J.; Liu, Z.; Du, Y.; Liang, F.; Yi, J.; Ma, T.; Pei, T. Quantify city-level dynamic functions across China using social media and POIs data. Comput. Environ. Urban Syst. 2021, 85, 101552. [Google Scholar] [CrossRef]
  39. Shah, T.I.; Bell, S. Exploring the Intra-Urban Variations in the Relationship among Geographic Accessibility to PHC Services and Socio-demographic Factors. In Proceedings of the HealthGIS 2013—Second SIGSPATIAL International Workshop on the use of GIS in Public Health, Orlando, FL, USA, 5 November 2013. [Google Scholar]
  40. Wang, B.; Lei, Y.; Xue, D.; Liu, J.; Wei, C. Elaborating Spatiotemporal Associations Between the Built Environment and Urban Vibrancy: A Case of Guangzhou City, China. Chin. Geogr. Sci. 2022, 32, 480–492. [Google Scholar] [CrossRef]
  41. Environmental Systems Research Institute. A Quick Tour of Geoprocessing Tool References. [EB/OL]. Available online: https://desktop.arcgis.com/zh-cn/arcmap/10.3/main/tools/a-quick-tour-of-geoprocessing-tool-references.html (accessed on 11 July 2021).
  42. QGIS Desktop User Guide/Manual. [EB/OL]. Available online: https://docs.qgis.org/testing/en/docs/user_manual/processing_algs/qgis/vectoranalysis.html#id16 (accessed on 11 July 2021).
Figure 1. Study area.
Ijgi 11 00559 g001
Figure 2. Analysis flowcharts.
Ijgi 11 00559 g002
Figure 3. Standard deviation ellipse of Hangzhou city and its districts.
Ijgi 11 00559 g003
Figure 4. Analysis of hotspots.
Ijgi 11 00559 g004
Figure 5. Distribution of four kinds of food (KFC (a), McDonald’s (b), Lanzhou Ramen (c), Shaxian Snacks (d)).
Ijgi 11 00559 g005aIjgi 11 00559 g005b
Figure 6. Line chart (a) and density scatter diagram (b) of POIs of the four types of food. The inverse S-function fitting curve of the POI density of the four kinds of food (c).
Ijgi 11 00559 g006
Figure 7. The binary Moran index and bivariate LISA clustering map of KFC (a) and McDonald’s and (b) Lanzhou Ramen (c) and Shaxian Snacks (d).
Ijgi 11 00559 g007aIjgi 11 00559 g007b
Figure 8. KFC distance distribution around McDonald’s (a) and McDonald’s distance distribution around KFC (b). Distance distribution of Lanzhou Ramen around Shaxian Snacks (c) and Shaxian Snacks around Lanzhou Ramen (d).
Ijgi 11 00559 g008
Figure 9. GCLQs of McDonald’s attracted by KFC (a) and KFC attracted by McDonald’s (b), and Shaxian Snacks attracted by Lanzhou Ramen (c) and Lanzhou Ramen attracted by Shaxian Snacks (d).
Ijgi 11 00559 g009
Table 1. District of the study area and the number of POIs in the catering industry.
AreaTotal Area
(km2)
Number of POI
KFCLanzhou
Ramen
McDonald’sShaxian
Snacks
Food
Binjiang District72.222483201308915
Chun’an County4417.486180443234
Fuyang District1821.033095619610,568
Gongshu District69.251048161068533
Jiande City2314.1910595584844
Jianggan District200662243613623,574
Lin’an District3118.7718732907972
Shangcheng District26.06327624464431
Tonglu County1829.5912954786976
Xihu district309.41561642024014,316
Xiacheng District29.33329626407334
Xiaoshan District1417.83542201462624,748
Yuhang District1228.41522203250629,748
total16,853.5740214712062296155,193
Table 2. Parameters of the fitted POI density functions of the four kinds of food.
P m K a k i   H a   H i   R 2
KFC 30.505028.3115713.424120.104494.64260.79191
McDonald’s 50.9586813.922610.81510.623915.224350.8401
Lanzhou Ramen 41.561377.692610.730291.171923.827970.95093
Shaxian Snacks 17.478672.3821713.416451.880952.985410.93035
Table 3. GCLQs between the four types of food.
Elements of InterestAdjacent ElementsGCLQp-Value
KFCMcDonald’s0.9284480.04
McDonald’sKFC0.9089020.02
Lanzhou RamenShaxian Snacks0.8268350.02
Shaxian SnacksLanzhou Ramen0.8545090.02
Publisher’s Note: MDPI stays neutral with regard to jurisdictional claims in published maps and institutional affiliations.

