Article

An Evaluation of Urban Renewal Based on Inclusive Development Theory: The Case of Wuhan, China

1
School of Civil Engineering and Architecture, Wuhan University of Technology, Wuhan 430070, China
2
School of Urban Design, Wuhan University, Wuhan 430079, China
3
Wuhan Geomatics Institute, Wuhan 430022, China
*
Author to whom correspondence should be addressed.
ISPRS Int. J. Geo-Inf. 2022, 11(11), 563; https://doi.org/10.3390/ijgi11110563
Submission received: 18 August 2022 / Revised: 3 November 2022 / Accepted: 5 November 2022 / Published: 9 November 2022

Abstract

:
After decades of development, China’s urban renewal is facing the problems of inequality and intolerance, neglecting vulnerable groups and triggering gentrification. These problems are rarely quantified and draw limited public concerns. To promote an inclusive urban development, we proposed a framework for the inclusive evaluation of urban renewal spaces, thus increasing the understanding of inclusive urban renewal. An evaluation method based on the theory of inclusive development was proposed, and it includes two steps. First, the evaluation index system of inclusive development at the community scale was created, including 24 indicators from five aspects: cognitive well-being, vulnerable groups, affordable public service facilities, economic agency, and environmental factors. Second, a combination of the CRITIC-TOPSIS method and k-means algorithm was used to grade and classify the inclusive development of the community. In this study, multisource data were used to measure the inclusiveness of communities in the core area of Wuhan’s inner city. The results show that the renewed communities are more inclusive than the unrenewed communities; however, even in the more inclusive and renewed communities, a lack of protection for vulnerable groups and a certain level of gentrification still exists.

1. Introduction

China’s urbanization rate has reached 65% and has undergone years of urban development and renewal. The post-1980s economic reform focused mainly on solving housing tensions and repaying infrastructure debts and carried out the large-scale restructuring of urban functions and the renovation of old cities [1]. In the 1990s and 2000s, China entered a period of rapid urbanization, building major infrastructure, renewing old industrial bases, preserving historical districts, transforming urban villages, and vigorously developing the real estate and financial industries to promote “suppression of the second industry and development of the third industry” [2]. Since the early 2010s, China has planned for high-quality people-centered development, with a focus on integrated governance and community development to improve urban governance capacity and to solve urban problems through urban renewal initiatives [3]. Early urban renewal in China focused on economic benefits and land revenue, and there was an obvious “growth alliance” behavior, putting economic growth above social equity. The large-scale demolition and construction of real estate development have led to gentrification and various kinds of conflicts including urban unrest.
In Western countries, the goals of urban renewal have also changed over time. From the 1950s to the early 1960s, massive demolition and reconstruction were implemented for postwar restoration. For example, the Greenwood Act of 1954 in the United Kingdom was a government-led effort to renew construction. In the United States, developers actively participated in the reconstruction of inner cities, and those living in the area were forced to move out, facing a ruined future life [4,5]. From the 1960s to the late 1970s, neighborhood restoration began after extensive demolition and construction. Urban renewal in this period had been increasingly criticized. In The Death and Life of Great American Cities, Jane Jacobs satirizes urban renewal as the “Radiant Garden City Beautiful”. The living conditions of people living in the inner city have improved, but they are not essentially free from poverty [6,7]. In the 1980s and early 1990s, neighborhood development through public–private partnerships began to promote economic recovery mainly through urban renewal. For example, the United States implemented the Community Development Finance and Urban Development Finance programs, weakening the government’s leading role in urban redevelopment and encouraging developers to participate in investment [8]. Since the 1990s, the urban renewal process has involved multistakeholder engagement. Reflection on the previous urban renewal reveals that relying exclusively on market mechanisms cannot solve the fundamental problems of inner cities. To encourage and strengthen cooperation among the public and private sectors and the community, urban renewal must be comprehensive, economic, social, environmental, and other multi-objective redevelopments. Multiparty cooperation and participation are considered a more inclusive renewal model, which establishes a bottom–up renewal mechanism through which communities become the main actor of urban redevelopment [9].
While Western countries have been gradually exploring inclusive development, the lack of inclusiveness in China’s urban renewal has negative impacts on the social and physical environment. Values of such type of urban renewal with the excessive pursuit of economic benefits resulted in gentrification, social exclusion, and even the displacement of indigenous people and tenants of low socioeconomic status [10,11]. Thus, inclusive urban redevelopment can benefit communities in relatively disadvantaged and poor situations.
This paper explores inclusive development and urban renewal by using Wuhan city in China as a case. It constructs a community-scale inclusive development evaluation index system and uses the technique for order of preference by similarity to ideal solution (TOPSIS) and k-means algorithms to explore the inclusive development levels and characteristics of renewed and nonrenewed communities in urban centers. It formulates targeted regeneration strategies and implementation paths by combining the spatially inclusive differences in communities.
There are three innovative points in this paper. First, in terms of methodology, a combination of TOPSIS and k-means algorithms are used, and k-means algorithms characterize the TOPSIS method results, which is more comprehensive than a single method. Further studies on the evaluation of urban redevelopment can use this or a similar combination method. Second, in terms of practice, the TOPSIS evaluation results are useful for the social sector, which is conducive to public participation and urban governance. The results of the k-means cluster analysis are useful for planners and other urban development practitioners, which is conducive to the classification and redevelopment of differential urban centers, and this study simplifies the workload of urban redevelopment and improves the application of differential strategies. Third, in terms of the empirical study, the theory of inclusive development is introduced in the case study of Wuhan, and the evaluation, experience, and lessons in the case can inspire other studies on urban development in both China and other countries. This article found that urban renewal in Wuhan creates an effective way to promote inclusive urban development, but various levels of gentrification still exist in some communities after redevelopment.

2. Literature Review

2.1. Urban Renewal and Inclusive Development

Inclusive development is now widely used in urban renewal policies [12,13]. Inclusive development is a development that includes marginalized people, sectors, and countries in social, political, and economic processes to enhance human well-being, social and environmental sustainability, and empowerment [14]. The objectives of inclusive development emphasize poverty reduction, human capital development, equity, and empowerment strategies for social capital development, gender development, and social protection [15]. The inclusive development theory includes six aspects: (1) cognitive well-being, that is, the adoption of people’s knowledge, experience, and aspirations, where culture is seen as a dynamic system of norms, values, and rules developed by a particular community, built on their relationship with a particular natural and social environment [16]; (2) vulnerable groups, such as the poorest and marginalized in society [15]; (3) affordable basic public service facilities, usually community-driven accessible schools, clinics, roads, water, and sanitation facilities [17]; (4) environmental factors [18] such as local environmental inclusion that focuses on protecting local access to and ownership of resources and protecting local ecosystems [19] and requires an equitable distribution of rights, responsibilities, and risks [20]; (5) public participation (procedural justice) and resource sharing (distributive justice), which allow all people to participate in decision-making and share resources and prosperity [18,21]; and (6) economic agency, which, from the perspective of inclusive economics, is the ability to (satisfy) solve economic (scarcity) problems [22].
Inclusive development, by definition and in theory, can be considered to have four pillars: physical, social, economic, and environmental. Urban renewal aims to enhance the physical, social, economic, and environmental aspects of cities [23] and can be closely related to inclusive development. To enhance land value and environmental quality [24], correct urban decline and meet socioeconomic objectives [25], and strengthen existing social networks to increase the inclusion of vulnerable groups [26], urban renewal addresses the deterioration of urban functions, social exclusion in urban areas, and environmental pollution. Urban renewal following inclusive development enhances urban inclusiveness.
In Western countries, such as the United Kingdom after World War II, new partnerships emerged in urban renewal involving not only the public and private sectors, but also social organizations and communities in the 1990s [27]. In the 2000s, urban renewal began to focus on objectives including the physical environment, quality of life, social well-being, economic prospects, and governance [28] through sustainable community programs [29] based on social and democratic inclusion [30]. Meanwhile, the private sector, such as the Urban Development Corporation (UDC), worked with the government to develop, restore, and reuse historic buildings, build new housing, and improve infrastructure. The eight components of the Sustainable Communities Plan are good social services, volunteerism, equality for all, effective and inclusive participation, better housing supply and affordability, neighborhood, environmental and rural pressures, and low-income housing improvements [31]. In 1992, the United States began to stimulate the redevelopment of the nation’s central cities through the EZ Initiative and the Housing Opportunities for All (HOPE VI) program, considered to be a “new wave of urban renewal” and a “return to urban renewal” [32] that shifted poverty to the suburbs [33]. Small-scale community renewal, as advocated today, goes beyond material thinking to focus on people’s neighborhoods, places of worship, and historic sites, as well as their sense of place, belonging, and history [34].
When the People’s Republic of China was founded in 1949, the planned economy extended to early urban planning and renewal activities with prominent government-led characteristics. The objectives of urban renewal in this phase were to solve the problems of health, safety, and reasonable zoning, to pay off the historical debt of basic living facilities, and to solve the shortage of housing for urban workers [35]. The land reform and housing reform in the late 1980s gave rise to the booming development of real estate and the increasing market and social forces in urban renewal. The purpose of the renewal at this stage was to improve the living and traveling conditions of the residents and to solve the problems of housing and infrastructure deficiencies in the city [36]. In the 1990s, land use rights concessions and fiscal tax sharing were established, and the commercialization of land use and housing promoted large-scale urban renewal. At this stage, the purpose of renewal was mainly to transform key areas such as major infrastructure, old industrial bases, urban villages, and historical blocks, with a focus on economic growth more than social equity. Since economic growth comes at the expense of social development, such urbanization hardly reflects the concept of inclusive development, which emphasizes both economic efficiency and the sharing of the fruits of development [37,38]. In the 2010s, urban renewal began to face the environmental, social, and economic problems brought about by the large-scale urban renewal in the past and shifted to focus on people-oriented and quality improvement [39]. However, serious urban problems such as excessive urban development intensity, spatial gentrification, and the loss of historical and cultural heritage brought about by the past large-scale demolition and construction style of regeneration still have not disappeared. Urban regeneration under the concept of inclusive development can help promote integrated urban development and alleviate spatial inequalities.
Wuhan is the case study for this paper. Before the reform, Wuhan lacked funds, and the overall quality of the city’s environment was poor. In the reform period, urban renewal has gradually become an important element of urban construction. In the 1980s, Wuhan entered a period of transition from a planned economy to a market economy and began to implement a system of paid land concessions, which accelerated urban renewal. In the 1990s, Wuhan imposed macro-regulation on land supply, compressing land premiums and the areas offered for sale, and urban renewal slowed down. After 2000, Wuhan’s land reserve transaction system gradually improved, and urban renewal developed at a high speed. In 2010, Wuhan launched the “Wuhan City Master Plan (2010–2020)” which clarified that Wuhan’s urban development had entered a period of urban development transformation with equal emphasis on main city renewal and new city expansion, and urban renewal began to transform and upgrade. In the past, under the influence of market interests, there have been some problems and phenomena in the process of urban renewal in Wuhan, such as widespread demolition and construction, superficial city beautification, and gentrification, which have defeated the practice of inclusive redevelopment. In 2020, Wuhan established an urban renewal center, and urban renewal entered an important period of transformation [40] which may involve more inclusiveness.

2.2. Evaluation and Classification of Urban Space

The Evaluation of urban planning follows the path of evaluating the current performance, predicting the future, and then proposing corresponding solutions [41]. Research on spatial evaluation mainly constructs an index system and adopts a quantitative analysis method to make a comprehensive evaluation of space, and this evaluation method is also a method of multi-criteria or multi-objective decision making. The Goals Achievement Matrix (GAM) was first proposed by Hill and became the first multi-criteria evaluation (MCE) method [42]. It details and quantifies the indicators affecting the evaluation to produce a numerical index that reflects the relative utility of agent alternatives. This became a common feature of many MCE methods developed later, such as the analytic hierarchy process (AHP) [43], data envelopment analysis (DEA), multi-attribute utility theory (MAUT), fuzzy set theory (FST), and the technique for order of preference by similarity to ideal solution (TOPSIS). The number of MCE methods has grown over time. Computational complexity ranges from simple arithmetic to multiple mathematical functions, and the amount and type of data needed for computation gradually diversifies with the evaluation objectives. However, they all adopt different methods to determine the priority of goals or criteria and have the function of making a balance between feasible goals and conflictive goals. The TOPSIS method is a common multi-criteria decision-making method developed by Hwang and Yoon in 1981 [44]. Its rationale is to create positive and negative ideal solutions, considering how close the alternative is to the ideal solution [45]. Compared with the hierarchical analysis (AHP) and fuzzy integrated evaluation methods, TOPSIS can make full use of the information from the original data and can address the strengths and weaknesses of each object more accurately. It has been applied to many fields due to the easy understanding and interpretation of results. For example, the TOPSIS method is used to conduct a comprehensive evaluation of urban sustainable development by establishing a system of three types of indicators for economic, social, and ecological development using the entropy weighting method to assign weights and using gray correlation analysis to reduce the uncertainty in the evaluation process [46]. Based on the GIS model, TOPSIS and fuzzy modeling are combined to comprehensively evaluate the urban environmental carrying capacity [47]. The TOPSIS method has been used in conjunction with machine learning to create flood hazard maps and then to evaluate urban flood vulnerability based on socioeconomic and environmental factors [48]. By constructing a city low-carbon sustainability index system and building a TOPSIS and BP neural network (back propagation neural network) model, the low-carbon sustainability of different cities has been evaluated [49].
For multivariate statistical analysis methods in evaluating urban spaces, PCA (principal components analysis), FA (factor analysis), and CA (cluster analysis) are mainly used. PCA and FA are usually used to reduce the number of variables, eliminate covariance in variables, and reveal latent variables. CA is the classification of sample attributes according to similarity. In practice, PCA and FA are used to reduce the number of variables in the data, while CA is usually used to reduce the number of samples in the data. CA is more suitable for classifying urban spatial spaces and identifying spatial functions by combining big data such as human behavioral activities. A clustering algorithm is an unsupervised machine learning method that groups objects based on their natural similarity characteristics. Objects in the same group are more similar than objects belonging to other groups. The k-means algorithm is the best-known data clustering algorithm; it attempts to divide the samples into k groups of equal variances, minimizing a criterion called inertia or the sum of squares within a cluster. K-means aims to select the centroid that minimizes inertia or the criterion of the sum of squares within the clusters [50]. K-means clustering analysis has been applied in spatial classifications, such as using high-order decomposed crowdsourced location data, using k-means clustering to aggregate similar spatial units into a group and elucidating the spatial semantics of spatial clusters using point-of-interest (POI) data [51]. Cognitive structure identification of urban functional areas based on hierarchical semantic cognition is based on geographic cognition [52]. This method considers four semantic layers of visual features, object categories, spatial object patterns, and regional functions and their hierarchical relationships and classifies urban functional areas through high-resolution satellite images and point-of-interest data.

2.3. Evaluation of Urban Evaluation

Extensive public participation in the evaluation of urban inclusion can improve the credibility of inclusion evaluation methods. There are tensions between the evaluation process and evaluation results and between public participation and intellectual contexts, such as the language of professionals, which may lead to the exclusion and restriction of practical opportunities for the participation of disadvantaged groups and unequal power relations among stakeholders [52]. One way to present vulnerable people in an “authentic” way is to ensure that whatever media or format is used to communicate the results of the assessment includes the “story” of the disempowered (such as their account of events, situations, plans, and outcomes). Public participation shapes our moral values in trying to live a good life [53]. So, participatory assessment must address the issue of rights and include both the powerful and the powerless, and stakeholders should represent themselves as much as possible, rather than being represented by others, which is a great challenge for inclusive assessments [52].
In inclusive evaluation, evaluation indicators help policymakers understand the urban environment, but urban policies that address only one aspect may worsen the evaluation. Thus, for the assessment of urban capital stock inclusiveness, a multi-criteria decision analysis model and three inclusive per capita capital stock factors estimated by the inclusive wealth index (IWI) were used [54]. Inclusive urban heritage includes four interdependent elements: economic, social, cultural, and environmental, and the evaluation of the economic benefits of urban heritage-related restoration or renovation projects often uses an operational analysis network [55]. Among these elements, culture is considered to be intrinsically valuable in contributing to the stability and resilience of urban ecosystems [56]. Inclusive smart cities are considered to contain three dimensions: social, spatial, and economic; the social dimension focuses on elements of equity and participation, the spatial dimension emphasizes equitable access to services, and the economic dimension focuses on equal access to economic opportunities. An inclusive evaluation result is derived from calculating a composite score of indicators after standardizing the indicators [57].

3. Methodology

This study focuses on the spatial analysis of the core area of the inner city at the community scale and is based on the identification and portrait of the inner-city space. It adopts the analysis framework of “establishing criteria—constructing models—processing results” to comprehensively evaluate and classify the communities in the core area from the perspective of inclusive development and to develop regeneration implementation paths, accordingly (Figure 1).

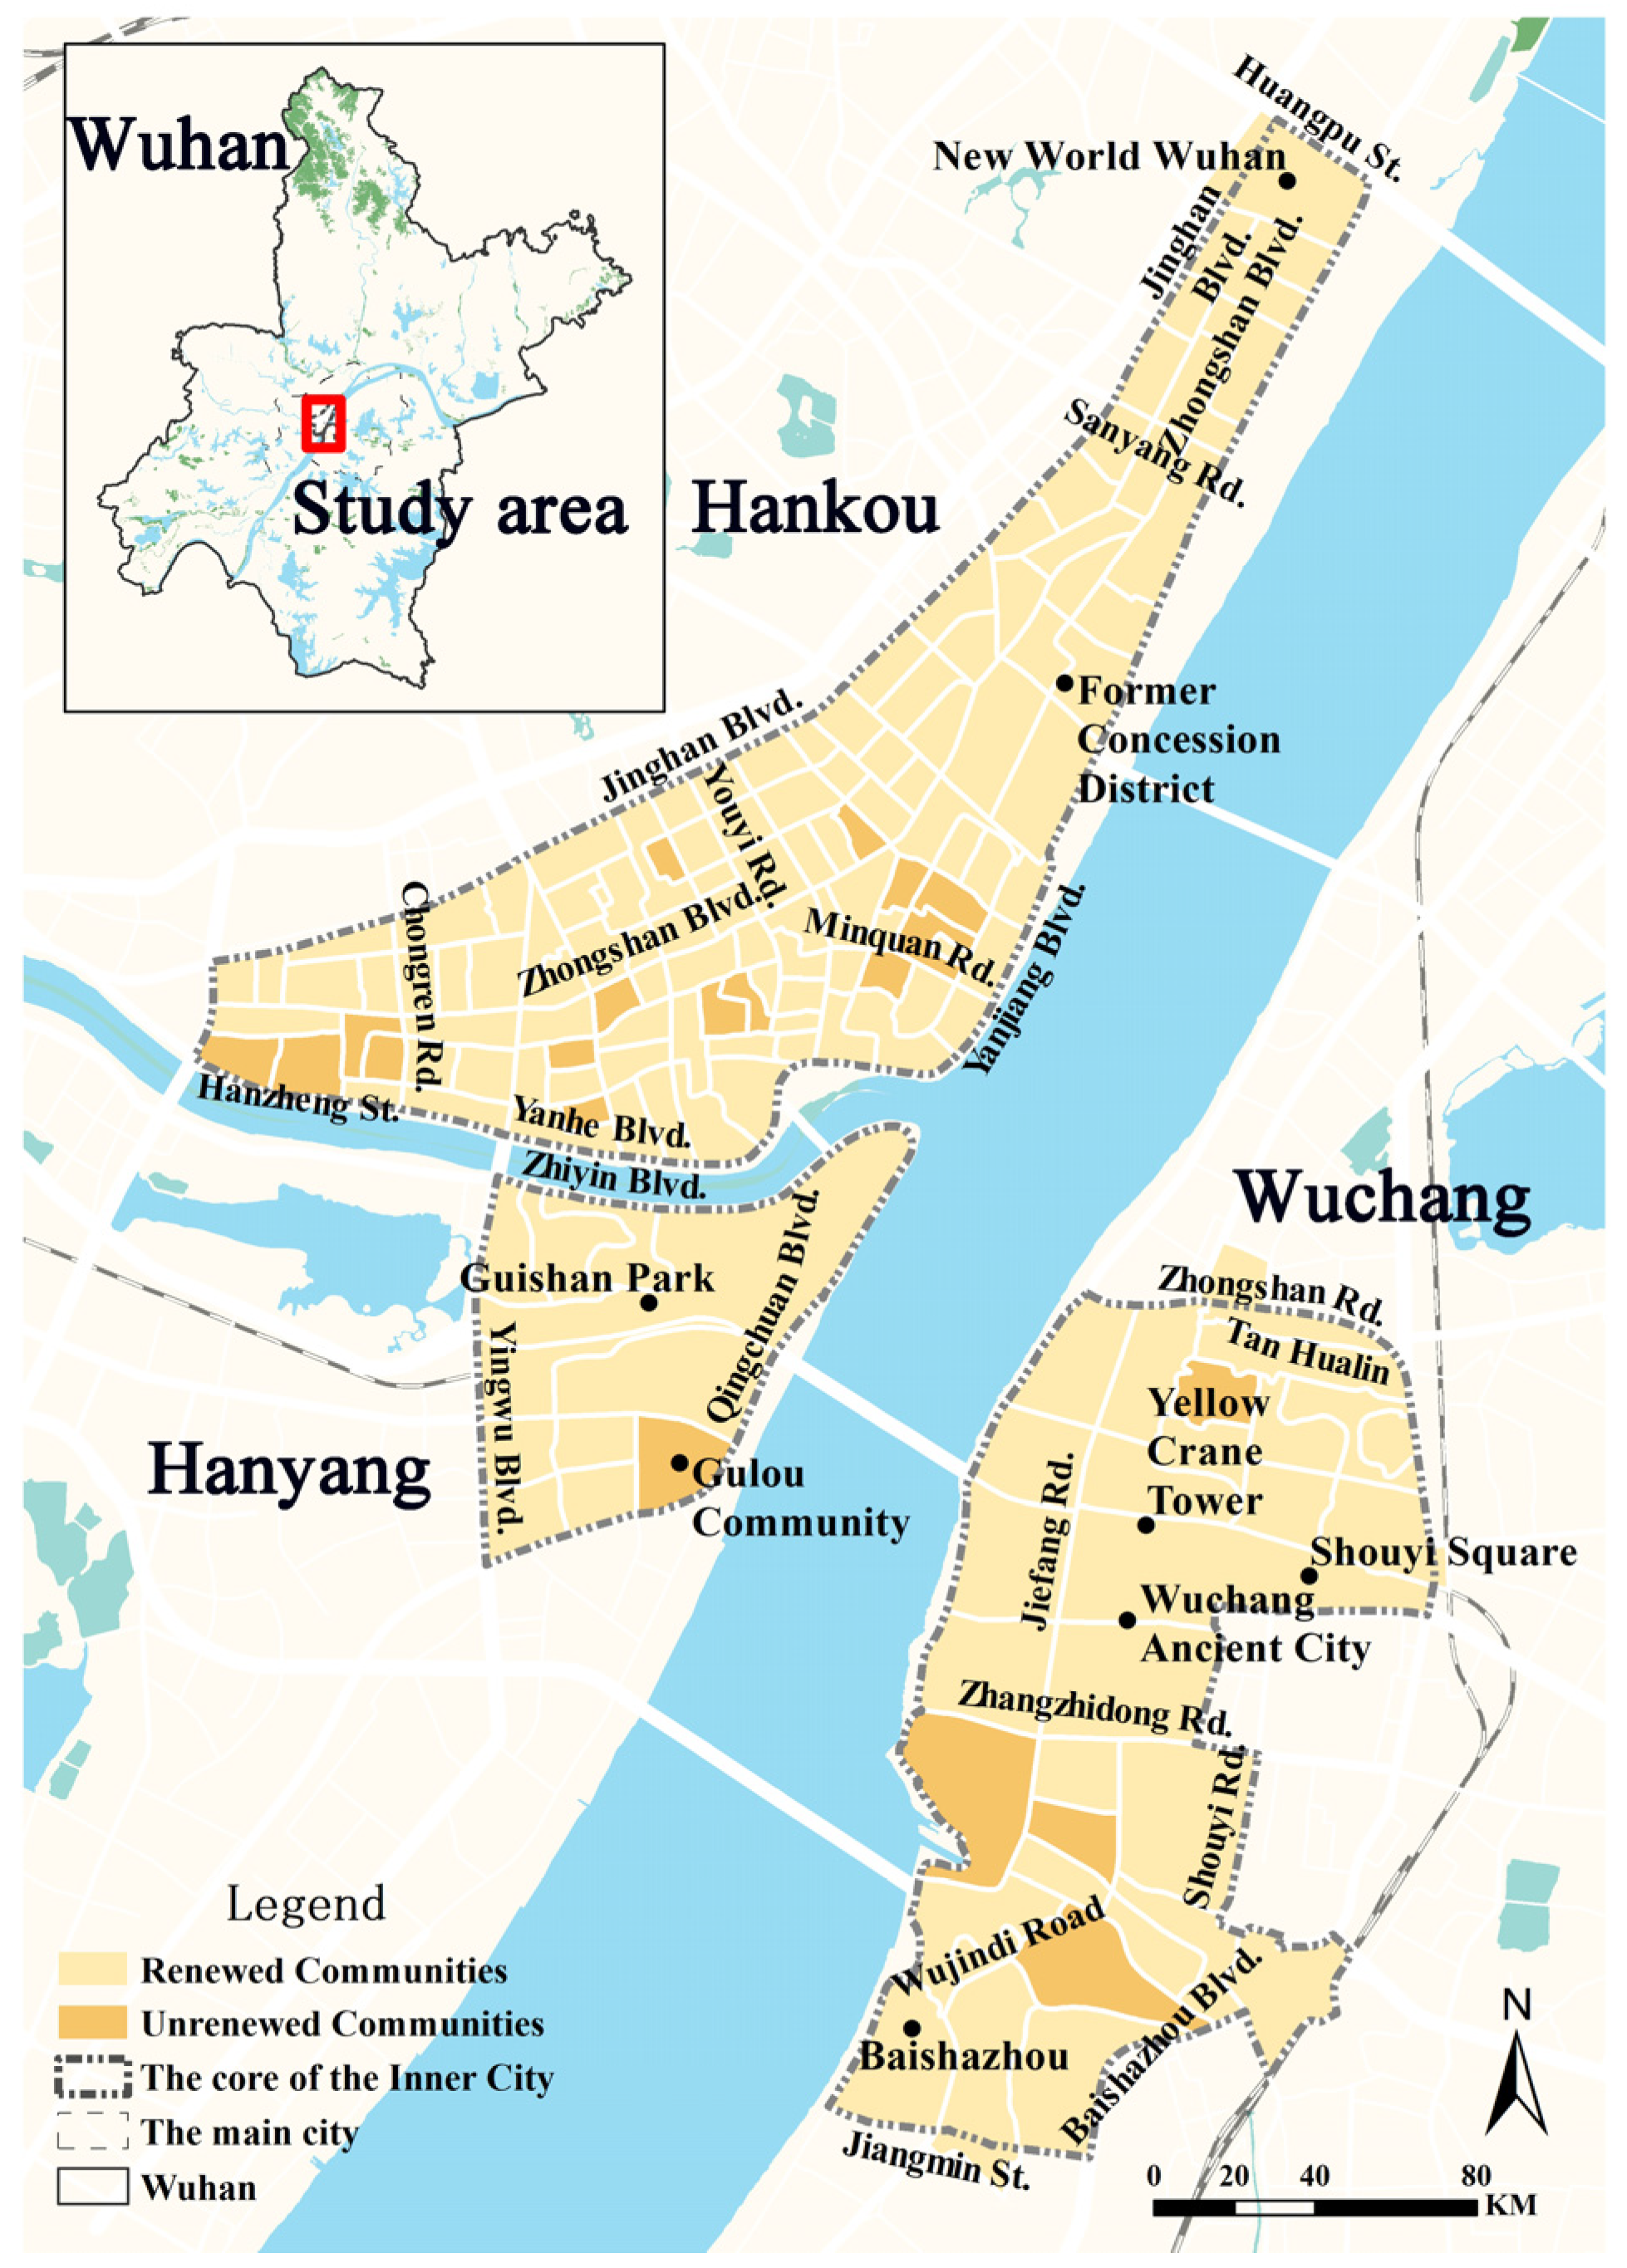
3.1. Study Area and Dataset

The research identifies the inner city of Wuhan and focuses on the core area of the inner city. This is because the core area is the major place of urban renewal in many Chinese cities including Wuhan, and the periphery of the urban area of Wuhan is still undergoing new urban development and urban sprawl. The core area of the inner city covers a total of 20.45 km2, includes 155 communities, and contains 3 main areas: (1) Hankou Jing Han Avenue and Yanhe Avenue, the Yanjiang Avenue enclosed area, mainly including Hanzheng Street, and the former concession district; (2) Wuchang Linjiang Avenue to Wujindi Road and the Zhongshan Road to Baishazhou Avenue enclosed area, mainly including Wuchang ancient city, Baishazhou two parts; and (3) the area surrounded by Hanyang Zhiyin Avenue, Qingchuan Avenue, and Yingwu Avenue, mainly Guishan Park (Figure 2). The core area of the inner city is spatially characterized by a mixture of old city and renewal areas and is located in the urban center, with obvious socio-spatial differences and contradictions. The 155 communities in the core area were classified, and the communities with more than 50% of their land area in the old city were classified as “unrenewed communities” according to the area of the old city in 2020. The communities with less than 50% of their land area in the old city were classified as “renewed communities” [58] (Figure 2).
The dataset includes the Wuhan City Geographic State Census and monitoring data, departmental industry statistics, and various big data. The cognitive well-being analysis used Baidu Huiyan data. The analysis of vulnerable groups used Baidu Huiyan, Public Security Bureau statistics, and two actual population data. The analysis of affordable basic public services mainly used data from the CMI, housing construction surveys, the current status of sites, industry-specific information, bus stops, rail stops, road networks, and POIs. The economic agency analysis mainly used data such as the Qixinbao and Baidu time-share populations. The environmental data included information on POIs, the scope of historical-style districts, outstanding historical buildings, urban air quality, and gardening surveys. Data on the actual populations reflect 2018 conditions, information on public service facilities and transportation facilities are 2019 data, and all of the others are 2020 data.

3.2. Evaluation Indicators

This paper constructs an evaluation index system for the inclusive development of urban renewal space based on the implementation of the inclusive development theory discussed above. Inclusive development evaluation indicators should have six dimensions: cognitive well-being, vulnerable groups, affordable public service facilities, public participation and resource sharing, economic agency, and environmental factors [14,15,16,17,18,19,20,21,22,23]. Since public participation and resource sharing include both process participation and result allocation of urban renewal, process participation often occurs in communities undergoing renewal. The communities in the core area of the inner city evaluated in this paper are in two states, renewed and unrenewed, and there are no communities in the process of renewal, so the evaluation index does not consider process participation. While outcome distribution refers to the distribution of physical, social, economic, and environmental resources, this paper uses a per capita indicator or a per thousand indicator to measure the equity of resource distribution. Referring to the indicators discussed in the literature [52,59], this paper constructed the indicator system and selected the following indicators to represent community inclusiveness.
Regarding the level of cognitive well-being development, the percentage of the highly educated population is the level of higher education of the population, reflecting people’s knowledge, experience, and ambition. The percentage of historical and scenic neighborhoods and the density of scenic spots reflect cultural factors within the community. In terms of vulnerable groups, low-income people, migrants, and elderly people were selected as the poorest and most marginalized groups in the community. In terms of affordable basic public service facilities, the degree of community-wide accessibility was used, and the accessibility of public service facilities, mainly including public activity venues, public transportation, education, medical care, culture, sports, and welfare institutions, was analyzed using the two-step floating catchment area method (2SFCA). The economic agency level was reflected by the unit price of housing rentals, the density of small and microenterprises, the share of the high-end service industry, the amount of visiting populations, and the density of job positions. Environmental factors include air quality, green space per capita, residential, and water area (Table 1).

3.3. Evaluation Model

Two models were selected for the evaluation of the inclusive development. Model 1 is the TOPSIS evaluation model, which scores communities comprehensively and classifies them into three levels, high, medium, and low, of inclusive development according to their ranking before and after renewal, and reflects the comprehensive characteristics expressed in various aspects of the community. Model 2 is the k-means cluster analysis model, which classifies communities according to the similarity of indicators and reflects the detailed characteristics of the communities. The evaluation results of the two models were pooled to reflect the global characteristics and individual differences in the communities.
This paper uses the TOPSIS model to calculate the composite score S of n communities in the inner-city core area under m indicators to evaluate and rank the inclusive development of the communities. The pre-study of this method lies in calculating the weight of each indicator [60], and the CRITIC method combines the correlation between indicators for objective weighting [61], which has a greater advantage compared with the subjective weighting method, which takes into account internal sensitivity and indicator conflicts [62]. The inclusive development indicators used in this paper do not contain subjective factors, so the method is applicable.
Step 1. The data for the TOPSIS decision matrix consists of 155 communities and 24 inclusion indicators.
Step 2. Indicator weights are calculated according to the CRITIC method: first, the data are normalized so that their units are uniform, and their values are between [0, 1]. In this study, the unit price of housing rentals and air quality are negative indicators, while all others are positive indicators. Positive indicators are preprocessed using Equation (1), and negative indicators are preprocessed using Equation (2).
y i j = x i j min x i max x i min x i
y i j = max x i x i j max x i min x i
i 1 , 2 , , 24 ,   j 1 , 2 , , 155
The variable x i j represents the value of the j th community in the i th indicator. The min x i is the minimum value among 155 communities in the i th indicator, and max x i is the maximum value among 155 communities in the i th indicator. The variable y i j is the value of   x i j   after normalization.
Then, the correlation coefficient and the amount of information are determined. The correlations between indicators r i j , conflicts T j , and the amount of information C j of a single indicator are expressed in Equations (3)–(5).
r i j = p = 1 n y p i y i ¯ y p j y j ¯ p = 1 n y p i y i ¯ 2 p = 1 n y p j y j ¯ 2
T j = i = 1 m 1 r i j
C j = δ j T j
δ j = 1 n p = 1 n y p j y j ¯ 2
In Equations (3)–(6), r i j is the correlation coefficient between indicators y i and y j , n is the number of communities evaluated, m is the number of indicators, y j ¯ is the mean value of indicators, and δ j is the standard deviation of the jth indicator. The smaller the r i j , the smaller the correlation between indicator j and the rest of the indicators; the larger the conflict T j of the indicators, the larger the amount of information contained C j , and the larger the importance of the indicators.
Finally, the weight coefficient is determined, and the expression is Equation (7):
W j = C j j = 1 m C j
where W j is the weight coefficient of the j th index.
Step 3 After obtaining the weight W j , it is assigned to the TOPSIS model matrix.
Step 4 the ideal and anti-ideal solutions are determined. The expression is Equation (8). In order to eliminate the influence of different data indicator magnitudes, it is necessary to normalize the already normalized matrix y i j to obtain the array Z i j weighted decision matrix by which the ideal solution Z + and the anti-ideal solution Z are obtained.
Z i j = y i j i = 1 n ( y i j ) 2 Z + = max Z 1 , max Z 2 , max Z m Z = min Z 1 , min Z 2 , min Z m
where Z 1 , Z 2 , , Z m are the column vectors of the matrix Z i j . The max Z m is the maximum value in the orientation quantity, and the min Z m is the minimum value in the orientation quantity.
Step 5 Then, the optimal and worst target distances are calculated using Equation (9) and Equation (10):
D i + = j = 1 m W j Z i j Z j + 2
D i = j = 1 m W j Z i j Z j 2
where Z j + is the jth value in the Z + vector, and D i + is the optimal target distance. Z j is the jth value in the Z vector, and D i is the worst target distance.
Step 6 the scores are calculated and sorted according to the optimal solution and the worst solution, and the expression is Equation (11):
S i = D i D i + D i +
Step 7 The final comprehensive score S i ranges from [0, 1]. The higher the comprehensive score of the community, the higher the level of inclusive development. According to the rankings of the inclusive development scores of the communities, they are divided into three levels, from high to low inclusive development on average: high, medium, and low.
Step 8 The k-means cluster analysis method was used to cluster the three grades of inclusive development: high, medium, and low. Each indicator of each community is regarded as a feature of the community and is combined with k-means clustering; communities with similar characteristics are classified into one category. Based on the elbow method to determine the value of k, the inflection point is at the xth place, so the number of clusters is x.
The TOPSIS method is improved by adding the step of k-means clustering. The advantages of the improved algorithm are two-fold. First, it clarifies the fuzzy evaluation results of TOPSIS. TOPSIS evaluation results are a composite score; the inclusive development grade is divided into three levels, higher, medium, and lower, and the evaluation results are fuzzy, lacking the interpretation of detailed community characteristics. The k-means clustering analysis clusters communities into higher, medium, and lower inclusive development levels. It retains the characteristic indicators at different inclusive development levels and can be used to interpret the high and low scores of the TOPSIS evaluation results. The combination of the two methods clarifies the fuzzy results of the TOPSIS evaluation through the k-means approach on the one hand, while retaining the advantages of the simple, easy to understand, and disseminating TOPSIS results. Second, TOPSIS evaluation combined with k-means clustering promotes public participation in urban renewal. The participants of the original urban renewal are mainly designers, planners, government agencies, and developers. Due to state regulations and the high professional information on urban renewal design, the threshold and difficulty of participation are high, and the public is largely excluded from the decision making in urban renewal. The TOPSIS evaluation results are a comprehensive score, which are simple to express, easy to understand, and oriented to the public and media, which facilitates the expression and dissemination of results and can increase public attention and promote public participation. K-means clustering retains different inclusive development levels of the community’s characteristic indicators, which is beneficial for professionals to develop targeted update strategies. The combination of the two methods promotes the joint participation of the public and professionals and improves the inclusiveness of urban renewal.

4. Results

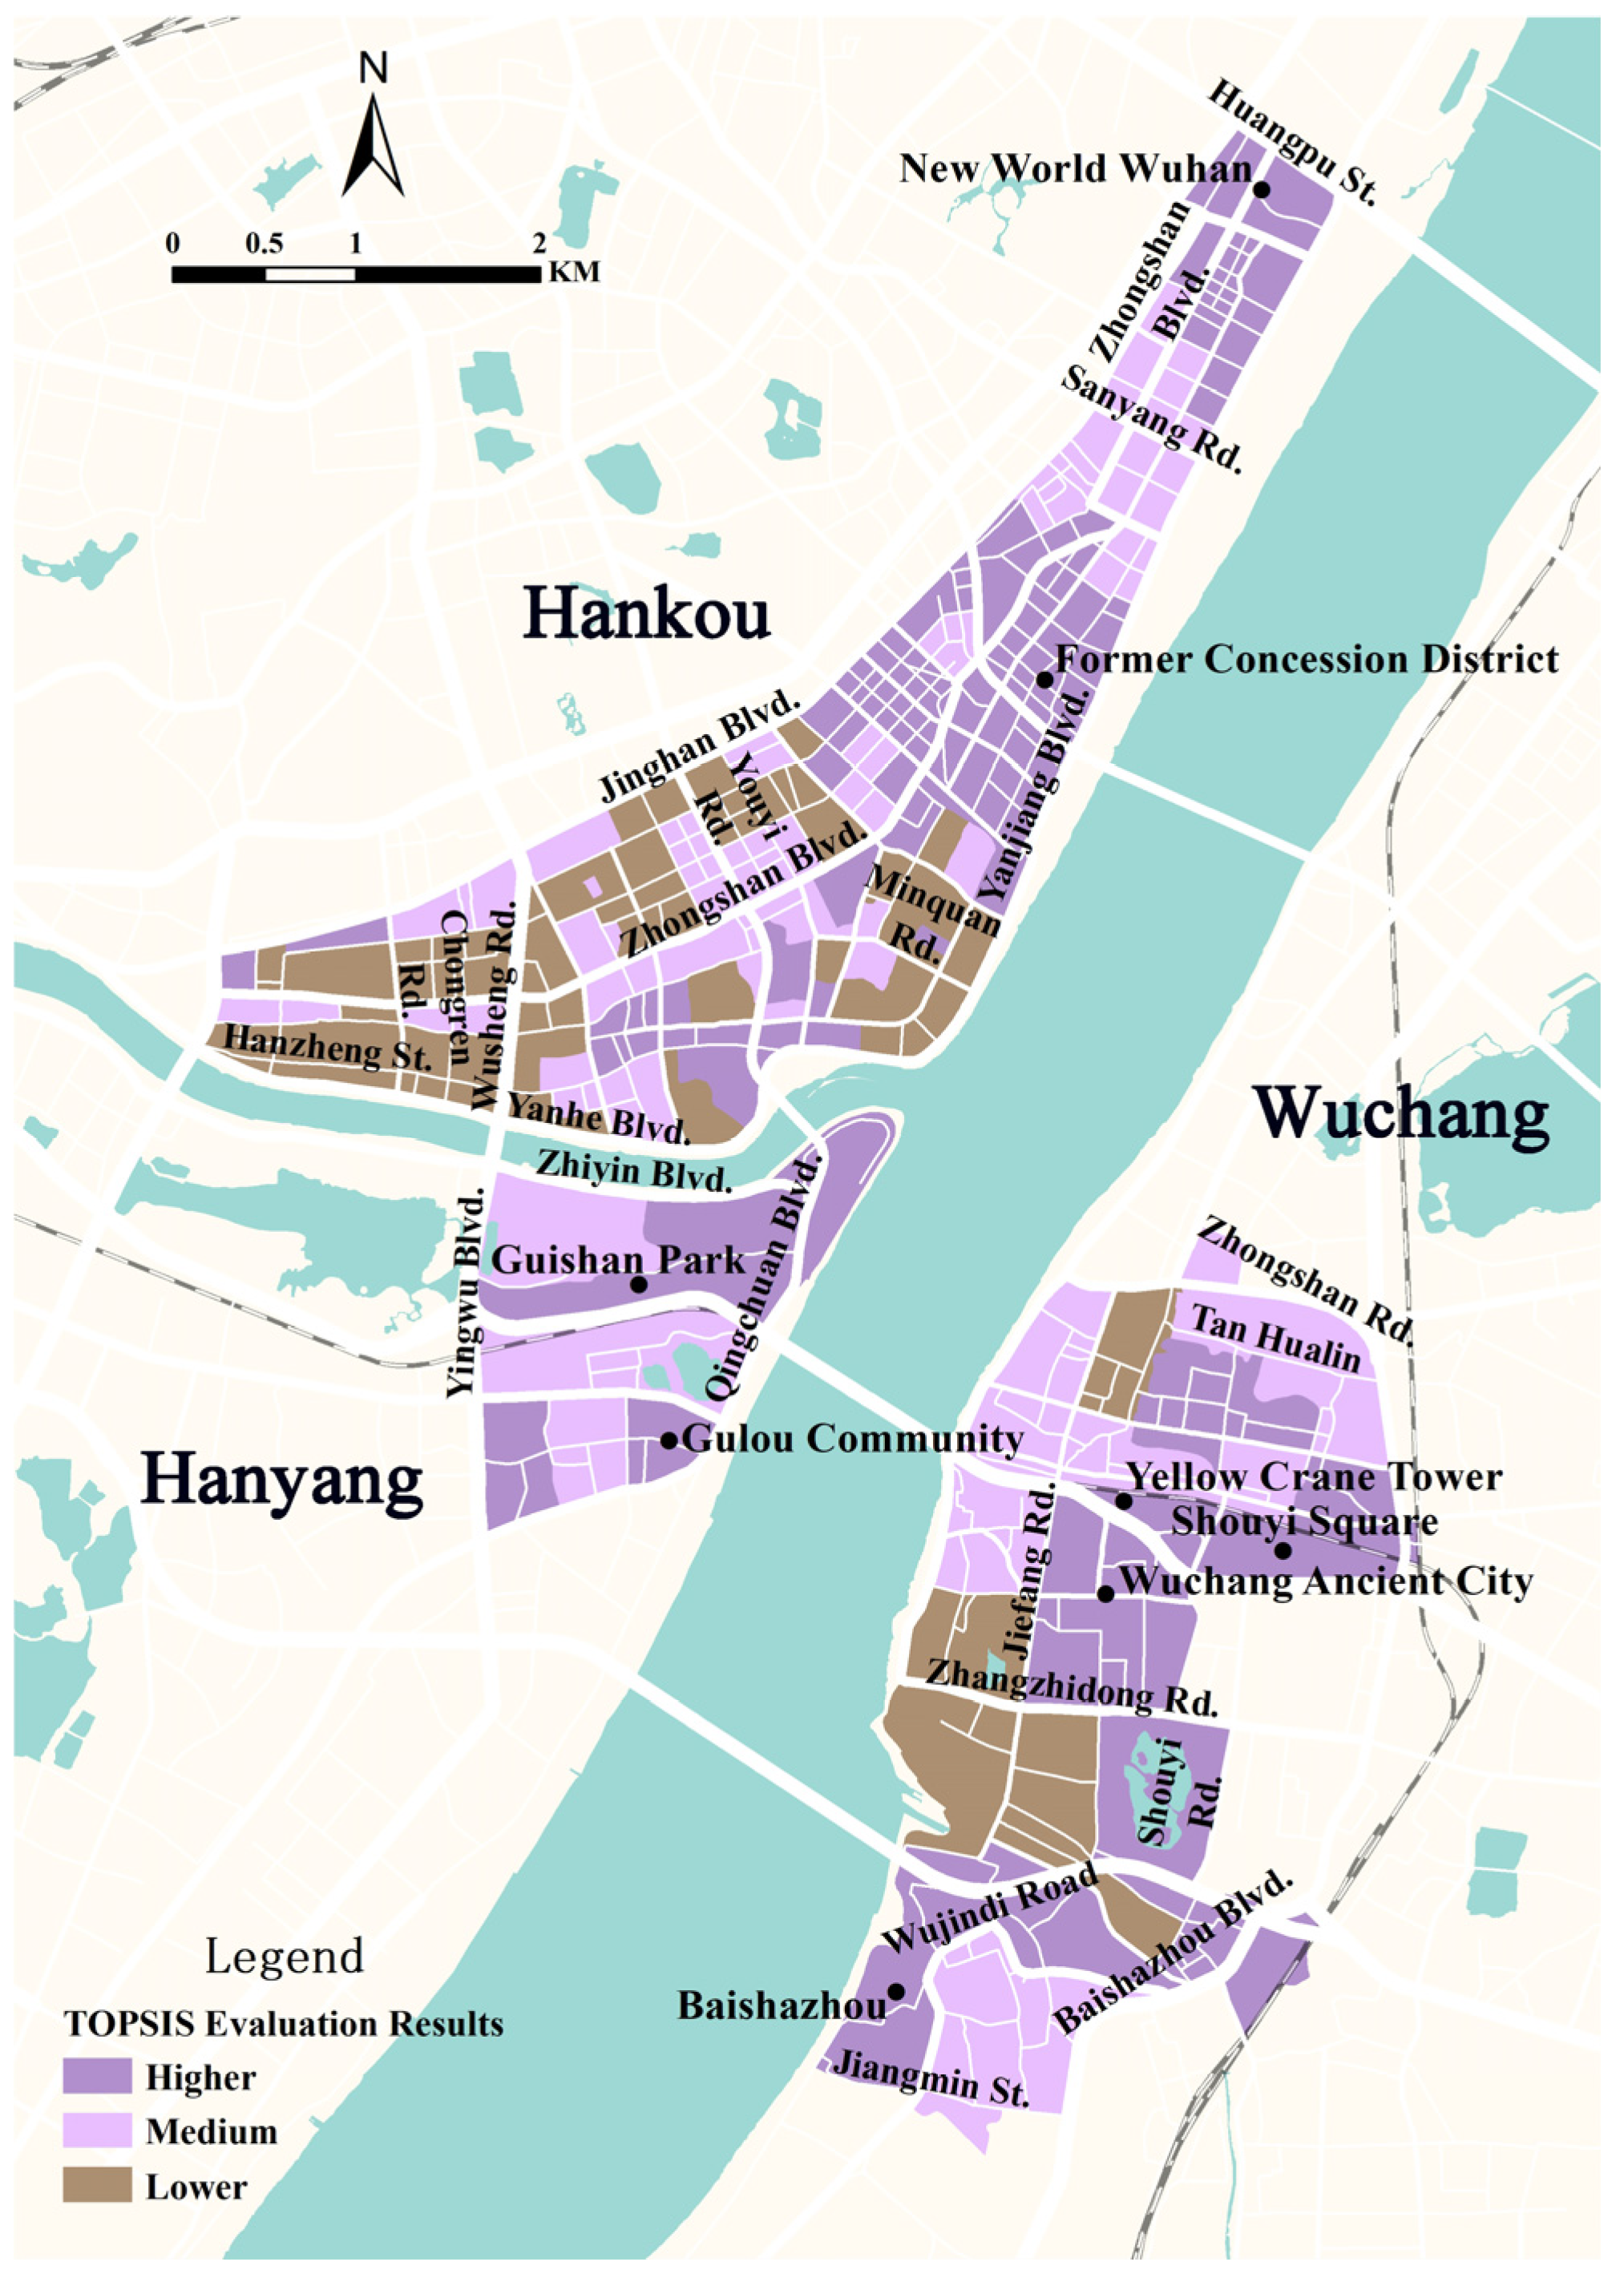
4.1. Results of TOPSIS

First, the weights of the evaluation indices were determined by the CRITIC method. The data of the indices are derived through the calculation equation, and the data are normalized according to Equations (1) and (2) and then substituted into Equations (3) and (4) to determine the correlation coefficients and the amount of information between the data. Finally, the index weights are derived according to Equation (5) (Table 2).
Combined with the evaluation results of the TOPSIS method, the distribution map of the inclusive development of communities in the core area of the old city was drawn (Figure 3) to visually reflect the level of inclusiveness in each community. The communities with a higher inclusive development are mainly located in New World Wuhan on the south side of Huangpu Street in Hankou; in many lane-type residential communities in the Former Concession District; in communities such as the Gulou community in Hanyang; in Shuyi of Wuchang; in some communities near Tan Hualin; and in Baishazhou. Communities with a lower inclusive development are mainly located in the communities on both sides of Minquan Road in Hankou and in the communities on both sides of Youyi Road. There are a large number of communities with a lower inclusive development in the Hanzheng Street area, especially the old residences on the west side of Chongren Road and in communities on both sides of Jiefang Road in Wuchang. Most of the communities with a higher inclusive development have been renewed, while most of the communities with a lower inclusive development are older communities that have not been renewed. Therefore, it is important to promote urban renewal in an orderly manner to build an inclusive city.

4.2. Results of K-Means

Cluster centers were used to classify communities with high inclusive development grades into two categories, those with medium inclusive development grades into four categories, and those with low inclusive development grades into two categories. Combining the mean value of the indicators of each category reflects the indicator characteristics of such communities and helps to develop renewal strategies later (Figure 4, Table 3).
Cluster 1 represents nine thriving communities with a high level of inclusive (re)development. Communities in this category have a higher perceived well-being, a larger population of elderly people, the most accessible public services, better economic agencies, and better environmental factors. However, these communities accommodate the lowest number of low-income people and migrants. The communities in this category are mainly located on the south side of Huangpu Street.
Cluster 2 represents 42 advantaged communities with a high level of inclusive (re)development. Communities in this category have a higher perceived well-being, accommodate more disadvantaged groups, have more accessible public services, better economic agencies, and better environmental factors. However, while these communities accommodate many migrants, they also have less water area per capita. These communities are mainly lane-type communities distributed in the Former Concession District in Hankou; the Gulou community in Hanyang; the communities around Tan Hualin in Wuchang; the communities in Shouyi; and the communities in Baishazhou.
Cluster 3 represents two diverse communities with a medium level of inclusive (re)development. Communities in this category accommodate the most migrants, have the most public activity space per capita, have the highest accessibility to welfare institutions, and have better environmental factors. However, the communities have the lowest perceived well-being, accessibility to most public services, and economic agencies. Due to the large size of these communities, accessibility to public services is generally low. Such communities are located on the Wuchang side of Wujindi Road.
Cluster 4 represents 20 growing communities with a medium level of inclusive (re)development. Communities in this category have an average perceived well-being, accommodate more disadvantaged groups, have better access to public service resources, and have the largest number of microenterprises. However, community environmental factors are poor, with the smallest amount of green space per capita, smaller living spaces per capita, and the smallest total community area. Such communities are mainly located in urban village-type communities on both sides of Zhongshan Boulevard in Hankou.
Cluster 5 represents 17 stable communities with a medium level of inclusive (re)development. Communities in this category have a better perceived well-being, better accessibility to public services, and better environmental conditions. However, these communities accommodate fewer low-income groups and migrants. Such communities are mainly located in old residential-type communities on both sides of Sanyang Road in Hankou.
Cluster 6 represents 13 vibrant communities with a medium level of inclusive (re)development. Communities in this category have a better perceived well-being, average public service accessibility, average economic agencies, and average environmental factors. However, these communities house fewer migrants and the lowest population of elderly people. There is a lack of community health service centers and kindergartens, and urban roads are of low density. These communities are mainly located in the Wuchang Yellow Crane Tower area and other old residential and urban village-type mixed communities.
Cluster 7 represents 38 deficient communities with a low inclusive development. Communities in this category have the best access to public transportation and good economic agencies. However, the perceived well-being and environmental factors within these communities are poor. Such communities are mainly located in old residential and lane-type communities on both sides of Minquan Road in Hankou; old residential-type communities on both sides of Youyi Road; and urban village-type communities on the west side of Chongren Road, which are located on the riverside and have the conspicuous characteristics of roadways perpendicular to the river surface.
Cluster 8 represents 14 declining communities with the lowest level of inclusive (re)development. Such communities accommodate a large number of vulnerable groups, and some have better access to public services. However, a low perceived community well-being is common, and economic agencies and environmental factors are poor. Such communities are mainly distributed on the sides of Zhang Zhidong Road in Wuchang and other old residential and mixed urban village-type communities.
Urban renewal from the perspective of inclusive development shifted from traditional large-scale demolition to small-scale, progressive, organic renewal at the community scale, and through the analysis of the inclusive development characteristics of the community, it integrates “retention, transformation, and removal” and develops a differentiated renewal approach. The prosperous communities and the dominant communities are more inclusive, so “retention” is the main renewal method. Prosperous communities accommodate more disadvantaged groups through government leasing or repurchasing of idle residences, conversion to affordable housing, and strict control of the housing rental market. The advantaged communities, through ecological restoration and renovation, use the development potential of historical, cultural, and ecological environment resources for conservation (re)development, highlighting the characteristics of the community style.
The diverse, growing, stable, and vibrant communities have medium inclusivity and some challenges, so “transformation” is the main renewal method. Diverse communities focus on upgrading infrastructure, improving the environment, perfecting public services, using marginal land to tap into street green space, increasing public space, and constructing more facilities. Growing communities continue to promote the university students’ settlement policy, attracting highly educated talented workers and combining the communities’ innovative and entrepreneurial atmospheres. They also create work and social spaces such as creator spaces and shared offices in conjunction with older communities and tap into idle land to create community green spaces. Stable communities reduce the shortcomings of public services, strengthen the construction of community education and medical facilities, provide affordable housing, and have become more inclusive of low-income people and migrants. Vibrant communities combine the construction of youth-friendly cities, focus on the survival and development needs of the youth population, and improve employment security and assistance mechanisms for young people. They also improve the service capacity of public facilities, control living and housing costs, and create a friendly working, living, and social environment for young people.
Deficient communities and declining communities have more problems with inclusiveness, so “removal” is the main renewal method. Deficient communities, through ecological restoration, improve the ecological environment, remove illegal structures in the community, create public activity sites, renew old residences with low land use efficiency into affordable housing, attract university students staying in Wuhan, and protect the housing conditions of low-income groups. The declining communities renew housing products by demolishing old buildings and constructing new ones to complement public service facilities and supply more market housing in key development areas.

5. Discussion and Conclusions

Based on the physical, social, economic, and environmental data of 155 communities in the core area of the old city of Wuhan, this paper uses the theory of inclusive development and creates an inclusive development evaluation index system from five aspects: cognitive well-being, disadvantaged groups, affordable basic public service facilities, economic agencies, and environmental factors. The CRITIC method is used to determine the index weights, and TOPSIS is used to develop a multi-attribute decision-making method to comprehensively evaluate the inclusive development of communities in the core area and to rank and classify the inclusive development into three levels: higher, medium, and lower. Then, the k-means algorithm was applied to classify the different levels of inclusively developed communities into eight categories. These categories are thriving communities, advantaged communities, diverse communities, growing communities, stable communities, vibrant communities, defective communities, and declining communities.
Most of the renewed communities in Wuhan have a higher level of inclusive development than the unrenewed communities. Communities with a better inclusive development tend to have a better cognitive well-being, more convenient public services, stronger economic agencies, and better environmental factors, but are still slightly less able to accommodate disadvantaged groups. This shows that communities with higher levels of renewal are more inclusive, but there is still a degree of gentrification in communities that are more inclusive overall. Therefore, during urban renewal, more attention should be given to protecting the interests of disadvantaged groups, the housing problems of disadvantaged groups, and the construction of social relations from the perspective of community governance, which will help inclusive (re)development.
Inclusive development in urban renewal can avoid large-scale demolition and construction, change development-oriented renewal to quality-enhancing renewal, and increase the inclusiveness of urban space. The optimized evaluation method explains the reasons for high and low TOPSIS scores with the characteristic indicators of k-means clustering, and the characteristics of TOPSIS scores are further detailed. At the same time, the threshold of public participation was reduced, and the evaluation results for professionals through other methods are simplified to the high and low scores of TOPSIS, which promotes public participation. This study provides a clearer understanding of the detailed differences in urban spatial inclusiveness than the algorithms in other articles [55,56,58], which simply apply multi-criteria decision models. A combination of TOPSIS and the k-means algorithm was adopted to evaluate urban renewal space not only to clarify the qualities of communities, but also to find the problems and dilemmas faced by urban renewal. The comprehensive spatial evaluation index system developed for inclusive urban renewal aims to provide an accurate and clear method to guide community governance and management in urban renewal at the community scale and to ensure stability and sustainability in physical, social, economic, and environmental aspects. Thus, this evaluation method promotes the knowledge and practice of inclusive urban (re)development.
This study still has some limitations for further research to consider. Regarding indicator selection, we selected the most representative indicators based on the available secondary data, and there are probably some indicators which available data cannot sufficiently represent. For example, industry statistics can partially characterize public service indicators, and future studies can collect more comprehensive data on education, housing, and public health through surveys collecting primary data. In addition, this study only examines Wuhan city, which is a megacity and can represent the condition of urban renewal in Central China to some degree. Future research can further evaluate the inclusive urban renewal of cities in China’s coastal areas to have a comprehensive evaluation of Chinese cities and find their different features of inclusive urban redevelopment.

Author Contributions

Wei Liu conceived and designed the experiments; Jie Yang performed the experiments and analyzed the data; Qi Cheng contributed materials/analysis tools; Jie Yang and Yue Gong authored and revised the paper. All authors have read and agreed to the published version of the manuscript.

Funding

This research was funded by the National Natural Science Foundation of China (grant No. 52078397).

Data Availability Statement

Not applicable.

Conflicts of Interest

The authors declare no conflict of interest.

References

  1. Xie, Y.; Costa, F.J. Urban planning in socialist China: Theory and practice. Cities 1993, 10, 103–114. [Google Scholar] [CrossRef]
  2. Yao, Z.; Jiang, C. Imitation, Reference, and Exploration—Development Path to Urban Renewal in China (1985–2017). J. Urban Hist. 2020, 46, 728–746. [Google Scholar] [CrossRef]
  3. Xinhua. National New Urbanization Plan (2014–2020). Available online: http://www.gov.cn/zhengce/2014-03/16/content_2640075.htm (accessed on 1 August 2020).
  4. Bauer, C. Redevelopment: A misfit in the fifties. In The Future of Cities and Urban Redevelopment; University of Chicago Press: Chicago, IL, USA, 1953; pp. 7–25. [Google Scholar]
  5. Gand, H.J. Failure of urban renewal: A critique and some proposals. Urban Renew. People Politics Plan. 1967, 1, 465–484. [Google Scholar]
  6. Gans, H.J. The Urban Villagers: Group and Class in the Life of Italian-Americans; Free Press: New York, NY, USA, 1982. [Google Scholar]
  7. Hartman, C.W. Relocation: Illusory promises and no relief. Va. Law Rev. 1971, 57, 745–817. [Google Scholar] [CrossRef]
  8. Carmon, N. Neighborhood regeneration: The state of the art. J. Plan. Educ. Res. 1997, 17, 131–144. [Google Scholar] [CrossRef]
  9. Hughes, J.; Carmichael, P. Building partnerships in urban regeneration: A case study from Belfast. Community Dev. J. 1998, 33, 205–225. [Google Scholar] [CrossRef]
  10. Atkinson, R. The hidden costs of gentrification: Displacement in central London. J. Hous. Built Environ. 2000, 15, 307–326. [Google Scholar] [CrossRef]
  11. Bacque, M.-H.; Fijalkow, Y.; Launay, L.; Vermeersch, S. Social Mix Policies in Paris: Discourses, Policies and Social Effects. Int. J. Urban Reg. Res. 2011, 35, 256–273. [Google Scholar] [CrossRef] [Green Version]
  12. Maculan, L.S.; Dal Moro, L. Strategies for inclusive urban renewal. In Sustainable Cities and Communities; Filho, W.L., Azul, A.M., Brandli, L., Ozuyar, P.G., Wall, T., Eds.; Springer: Berlin/Heidelberg, Germany, 2020; pp. 662–672. [Google Scholar] [CrossRef]
  13. Ferilli, G.; Sacco, P.L.; Blessi, G.T. Beyond the rhetoric of participation: New challenges and prospects for inclusive urban regeneration. City Cult. Soc. 2016, 7, 95–100. [Google Scholar] [CrossRef]
  14. Gupta, J.; Pouw, N.R.M.; Ros-Tonen, M.A.F. Towards an elaborated theory of inclusive development. Eur. J. Dev. Res. 2015, 27, 541–559. [Google Scholar] [CrossRef]
  15. Rauniyar, G.P.; Kanbur, R. Inclusive Development: Two Papers on Conceptualization, Application, and the ADB Perspective. Work. Pap. 2010, 72, 523–530. [Google Scholar]
  16. Gough, I.; McGregor, J.A. Wellbeing in Developing Countries: From Theory to Research; Cambridge University Press: Cambridge, UK, 2007. [Google Scholar]
  17. Mansuri, G.; Rao, V. Community-based and -driven development a critical review. World Bank Res. Obs. 2004, 19, 1–39. [Google Scholar] [CrossRef]
  18. Borel-Saladin, J.M.; Turok, I.N. The Green Economy: Incremental Change or Transformation? Environ. Policy Gov. 2013, 23, 209–220. [Google Scholar] [CrossRef]
  19. Fritz, D.; Miller, U.; Gude, A.; Pruisken, A.; Rischewski, D. Making poverty reduction inclusive: Experiences from Cambodia, Tanzania and Vietnam. J. Int. Dev. J. Dev. Stud. Assoc. 2009, 21, 673–684. [Google Scholar] [CrossRef]
  20. Gupta, J.; Vegelin, C. Sustainable development goals and inclusive development. Int. Environ. Agreem. Politics Law Econ. 2016, 16, 433–448. [Google Scholar] [CrossRef] [Green Version]
  21. Oosthoek, J.; Gills, B.K. (Eds.) The Globalization of Environmental Crisis; Routledge: London, UK, 2013. [Google Scholar]
  22. Pouw, N.; McGregor, A. An economics of wellbeing: What would economics look like if it were focused on human wellbeing? IDS Work. Pap. 2014, 2014, 436. [Google Scholar] [CrossRef]
  23. Roberts, P. The evolution, definition and purpose of urban regeneration. In Urban Regeneration: A Handbook; SAGE Publications: London, UK, 2000; Volume 1, pp. 9–36. [Google Scholar]
  24. Adams, D.; Hastings, E.M. Urban renewal in Hong Kong: Transition from development corporation to renewal authority. Land Use Policy. 2001, 18, 245–258. [Google Scholar] [CrossRef]
  25. Lee, G.K.L.; Chan, E.H.W. The analytic hierarchy process (AHP) approach for assessment of urban renewal proposals. Soc. Indic. Res. 2008, 89, 155–168. [Google Scholar] [CrossRef]
  26. Chan, E.H.W.; Yung, E.H.K. Is the development control legal framework conducive to a sustainable dense urban development in Hong Kong? Habitat Int. 2004, 28, 409–426. [Google Scholar] [CrossRef]
  27. Davoudi, S. City challenge: The three-way partnership. Plan. Pract. Res. 1995, 10, 333–344. [Google Scholar] [CrossRef]
  28. Tallon, A. Urban Regeneration in the UK; Routledge: New York, NY, USA, 2010. [Google Scholar]
  29. Raco, M. Securing sustainable communities: Citizenship, safety and sustainability in the new urban planning. Eur. Urban Reg. Stud. 2007, 14, 305–320. [Google Scholar] [CrossRef]
  30. Power, A. Sustainable Communities and Sustainable Development: A Review of the Sustainable Communities Plan; Sustainable Development Commission: London, UK, 2004. [Google Scholar]
  31. Goetz, E.G. Where have all the towers gone? The dismantling of public housing in US cities. J. Urban Aff. 2011, 33, 267–287. [Google Scholar] [CrossRef]
  32. LeRoux, K. Out of Reach: Place, Poverty, and the New American Welfare State. Public Manag. Rev. 2010, 12, 154–156. [Google Scholar] [CrossRef]
  33. Thurber, A. Keeping more than homes: A more than material framework for understanding and intervening in gentrifying neighbourhoods. In Urban Renewal, Community and Participation; Springer: Cham, Switzerland, 2018; pp. 25–43. [Google Scholar]
  34. Wang, Y.P. Public sector housing in urban China 1949–1988: The case of Xian. Hous. Stud. 1995, 10, 57–82. [Google Scholar] [CrossRef]
  35. Zhang, Y.; Fang, K. Is history repeating itself? From urban renewal in the United States to inner-city redevelopment in China. J. Plan. Educ. Res. 2004, 23, 286–298. [Google Scholar] [CrossRef]
  36. Kanbur, R.; Rauniyar, G. Conceptualizing inclusive development: With applications to rural infrastructure and development assistance. J. Asia Pac. Econ. 2010, 15, 437–454. [Google Scholar] [CrossRef]
  37. Spence, M.; Solow, R. The Growth Report: Strategies for Sustained Growth and Inclusive Development; Commission on Growth and Development Final Report: Washington, DC, USA, 2008. [Google Scholar]
  38. Ye, L.; Peng, X.; Aniche, L.Q.; Scholten, P.H.T.; Ensenado, E.M. Urban renewal as policy innovation in China: From growth stimulation to sustainable development. Public Adm. Dev. 2021, 41, 23–33. [Google Scholar] [CrossRef]
  39. Wang, L.; Li, Z.; Zhang, Z. City profile: Wuhan 2004–2020. Cities 2022, 123, 103585. [Google Scholar] [CrossRef]
  40. Zheng, H.W.; Shen, G.Q.; Hao, W. A review of recent studies on sustainable urban renewal. Habitat Int. 2014, 41, 272–279. [Google Scholar] [CrossRef] [Green Version]
  41. Hill, M. A goals-achievement matrix for evaluating alternative plans. J. Am. Inst. Plan. 1968, 34, 19–29. [Google Scholar] [CrossRef]
  42. Lee, S.W.; Xue, K. An integrated importance-performance analysis and modified analytic hierarchy process approach to sustainable city assessment. Environ. Sci. Pollut. Res. 2021, 28, 63346–63358. [Google Scholar] [CrossRef] [PubMed]
  43. Hwang, C.L.; Yoon, K. Methods for multiple attribute decision making. In Multiple Attribute Decision Making; Springer: Berlin/Heidelberg, Germany, 1981; pp. 58–191. [Google Scholar]
  44. Govindan, K.; Shankar, K.M.; Kannan, D. Sustainable material selection for construction industry–A hybrid multi criteria decision making approach. Renew. Sustain. Energy Rev. 2016, 55, 1274–1288. [Google Scholar] [CrossRef]
  45. Tang, J.; Zhu, H.-L.; Liu, Z.; Jia, F.; Zheng, X.-X. Urban sustainability evaluation under the modified TOPSIS based on grey relational analysis. Int. J. Environ. Res. Public Health 2019, 16, 256. [Google Scholar] [CrossRef] [Green Version]
  46. Irankhahi, M.; Jozi, S.A.; Farshchi, P.; Shariat, S.M.; Liaghati, H. Combination of GISFM and TOPSIS to evaluation of urban environment carrying capacity (case study: Shemiran City, Iran). Int. J. Environ. Sci. Technol. 2017, 14, 1317–1332. [Google Scholar] [CrossRef]
  47. Rafiei-Sardooi, E.; Azareh, A.; Choubin, B.; Mosavi, A.H.; Clague, J.J. Evaluating urban flood risk using hybrid method of TOPSIS and machine learning. Int. J. Disaster Risk Reduct. 2021, 66, 102614. [Google Scholar] [CrossRef]
  48. Zhang, W.; Zhang, X.; Liu, F.; Huang, Y.; Xie, Y. Evaluation of the urban low-carbon sustainable development capability based on the TOPSIS-BP neural network and grey relational analysis. Complexity 2020, 2020, 6616988. [Google Scholar] [CrossRef]
  49. Jain, A.K.; Murty, M.N.; Flynn, P.J. Data clustering: A review. ACM Comput. Surv. (CSUR) 1999, 31, 264–323. [Google Scholar] [CrossRef]
  50. Cai, L.; Xu, J.; Liu, J.; Ma, T.; Pei, T.; Zhou, C. Sensing multiple semantics of urban space from crowdsourcing positioning data. Cities 2019, 93, 31–42. [Google Scholar] [CrossRef]
  51. Zhang, X.; Du, S.; Wang, Q. Hierarchical semantic cognition for urban functional zones with VHR satellite images and POI data. ISPRS J. Photogramm. Remote Sens. 2017, 132, 170–184. [Google Scholar] [CrossRef]
  52. Ryan, K.; Greene, J.; Lincoln, Y.; Mathison, S.; Mertens, D.M.; Ryan, K. Advantages and challenges of using inclusive evaluation approaches in evaluation practice. Am. J. Eval. 1998, 19, 101–122. [Google Scholar] [CrossRef]
  53. Schwandt, T.A. Recapturing moral discourse in evaluation. Educ. Res. 1989, 18, 11–17. [Google Scholar] [CrossRef]
  54. Fujii, H.; Managi, S. An evaluation of inclusive capital stock for urban planning. In Wealth, Inclusive Growth and Sustainability; Routledge: London, UK, 2019; pp. 5–22. [Google Scholar]
  55. Dalmas, L.; Geronimi, V.; Noël, J.-F.; Sang, J.T.K. Economic evaluation of urban heritage: An inclusive approach under a sustainability perspective. J. Cult. Herit. 2015, 16, 681–687. [Google Scholar] [CrossRef]
  56. Girard, L.F.; Nijkamp, P.; Artuso, L. Le Valutazioni per lo Sviluppo Sostenibile Della città e del Territorio; FrancoAngeli: Milan, Italy, 1997. [Google Scholar]
  57. Waghmare, M.; Singhal, S. Monitoring and evaluation framework for inclusive smart cities in India. Dev. Pract. 2022, 32, 144–162. [Google Scholar] [CrossRef]
  58. Liu, W.; Yang, J.; Xu, T.; Luo, M.; Cheng, Q. Research on spatial recognition and resource description of Wuhan inner city based on multi-source data. Mod. Urban Res. 2021, pp. 90–98+110. Available online: https://kns.cnki.net/kcms/detail/detail.aspx?dbcode=CJFD&dbname=CJFDLAST2021&filename=XDCS202110015&uniplatform=NZKPT&v=KU3X7Vxd1o3R5Q7a-ahNy_NRRd57vBX7w-arJotjLFRMF9bgYNJPD9GdB7XpKyTx (accessed on 17 August 2022).
  59. Olson, D.L. Comparison of weights in TOPSIS models. Math. Comput. Model. 2004, 40, 721–727. [Google Scholar] [CrossRef]
  60. Chan, P.; Lee, M.H. Prioritizing sustainable city indicators for Cambodia. Urban Sci. 2019, 3, 104. [Google Scholar] [CrossRef] [Green Version]
  61. Diakoulaki, D.; Mavrotas, G.; Papayannakis, L. Determining objective weights in multiple criteria problems: The critic method. Comput. Oper. Res. 1995, 22, 763–770. [Google Scholar] [CrossRef]
  62. Xu, C.; Ke, Y.; Li, Y.; Chu, H.; Wu, Y. Data-driven configuration optimization of an off-grid wind/PV/hydrogen system based on modified NSGA-II and CRITIC-TOPSIS. Energy Convers. Manag. 2020, 215, 112892. [Google Scholar] [CrossRef]
Figure 1. Flowchart of the proposed framework.
Ijgi 11 00563 g001
Figure 2. The core area of the inner city of Wuhan.
Ijgi 11 00563 g002
Figure 3. TOPSIS evaluation results.
Ijgi 11 00563 g003
Figure 4. K-means clustering results.
Ijgi 11 00563 g004
Table 1. Urban renewal evaluation indicators.
Research ContentEvaluation IndicatorsCalculation EquationMain DataData Source
Cognitive well-beingProportion of highly educated populationNumber of undergraduates and above/community populationBaidu HuiyanBig data, https://huiyan.baidu.com/, accessed on 1 August 2020.
Proportion of historic districtsArea of historic districts/community areasHistoric district boundary linesCultural Tourism Bureau, Wuhan
Scenic spot densityTotal number of scenic spots/community areasPOIBig data, https://lbs.amap.com/, accessed on 1 August 2020.
Vulnerable groupsLow-income groupPopulation below 2499/community populationBaidu HuiyanBig data, https://huiyan.baidu.com/, accessed on 1 August 2020.
Migrant populationStreet-level floating population of the Public Security BureauPublic security bureau demographicsPublic Security Bureau Statistics
Aging populationPopulation over 60/community populationActual PopulationStatistics on the actual population of the community
Affordable basic public servicesPublic venues per capitaArea of public activity venues/community populationCurrent status of urban landPlanning Bureau, Wuhan
Bus Stations300 m buffer area/community areaBus stationsThe Traffic Bureau, Wuhan
Rail transit stations800 m buffer area/community areaRail transit stationsWuhan Metro Group, Wuhan
Urban road densityCity road length/community areaRoad network dataGeomatics Institute, Wuhan
KindergartensCommunity 15 min walk accessibilityDepartmental industry statisticsEducation Bureau, Wuhan
Community health centersCommunity 15 min walk accessibilityDepartmental industry statisticsThe Health and Wellness Commission, Wuhan
Sports facilities500 m buffer area coverage/community areaPOIBig data, https://lbs.amap.com/, accessed on 1 August 2020.
Cultural facilities500 m buffer area coverage/community areaPOIBig data, https://lbs.amap.com/, accessed on 1 August 2020.
Welfare agenciesCommunity 15 min walk accessibilityDepartmental industry statisticsCivil Affairs Bureau, Wuhan
Economic agencyHouse rental unit pricesSummary of unit prices of residential quarters with rental data in the community/number of residential quartersChina Real Estate Index System (CREIS) dataBig data, https://creis.fang.com/4.0/, accessed on 1 August 2020.
Small and microenterprise densityNumber of companies with a registered capital of less than 30,000/community areaQixinbaoBig data, https://www.qixin.com/, accessed on 1 August 2020.
Proportion of high-end service industryNumber of high-end service enterprises in the community/total number of enterprisesQixinbaoBig data, https://www.qixin.com/, accessed on 1 August 2020.
Visitor populationUser portrait spatial distribution hierarchical divisionBaidu time-sharing populationBig data, https://huiyan.baidu.com/, accessed on 1 August 2020.
Job densityNumber of workers/community areaBaidu time-sharing populationBig data, https://huiyan.baidu.com/, accessed on 1 August 2020.
Environmental factorAir qualityThe AQI value of the community center point from the nearest monitoring pointUrban air quality testingThematic survey data, http://hbj.wuhan.gov.cn/hjsj/kqzlssfb/index.shtml, accessed on 1 August 2020.
Green area per capitaGreen area/total populationLandscaping Surveythe Forestry Bureau, Wuhan
Per capita living areaLiving area/populationHomebuilding SurveyGeomatics Institute, Wuhan
Per capita water areaWater area/total populationUrban land dataPlanning Bureau, Wuhan
Table 2. Urban renewal spatially inclusive development indicator system.
Research ContentEvaluation IndicatorsIndex Weight
Cognitive well-beingProportion of highly educated population0.027
Proportion of historic districts0.061
Scenic spot density0.065
Vulnerable groupsLow-income group0.008
Floating population0.046
Aging population0.018
Affordable basic public servicesPublic venues per capita0.068
Bus stations0.007
Rail transit stations0.029
Urban road density0.030
Kindergartens0.054
Community health centers0.061
Sports facilities0.013
Cultural facilities0.020
Welfare agencies0.066
Economic agenciesHouse rental unit price0.041
Small and microenterprise density0.049
Proportion of high-end service industry0.032
Visitor population0.042
Job density0.045
Environmental factorsAir quality0.005
Green area per capita0.072
Living area per capita0.065
Water area per capita0.073
Table 3. Cluster center index means.
Research ContentEvaluation IndicatorsC1
Thriving
Communities
C2
Advantaged
Communities
C3
Diverse
Communities
C4
Growing
Communities
C5
Stable
Communities
C6
Vibrant
Communities
C7
Defective
Communities
C8
Declining
Communities
Cognitive well-beingProportion of highly educated population19.23512.82012.4908.70619.39413.69711.42513.408
Proportion of historic districts58.05142.5960.00014.31522.35733.1080.7256.871
Scenic spot density13.28431.0310.0008.36815.12813.5412.6612.838
Vulnerable groupsLow-income groups56.57363.66359.56168.70657.12862.87665.29364.201
Floating population832013,92530,25017,302856610,754939720,962
Aging population25.54124.51422.81427.91126.28320.00924.96725.434
Affordable basic public servicesPublic venues per capita22.60831.83934.0756.68915.91719.2517.04114.328
Bus stations0.9920.9640.4051.0000.9640.9500.9910.988
Rail transit stations0.8890.7300.0000.9180.9330.6240.9080.658
Urban road density11.98710.7247.85910.25713.8297.0829.4156.673
Kindergartens0.1140.0290.0380.0160.0220.0320.0170.019
Community health centers0.0020.0000.0000.0010.0000.0000.0010.000
Sports facilities0.9990.9550.3240.9920.9950.8270.9990.931
Cultural facilities0.9370.8640.3150.8400.9920.9420.9670.699
Welfare agencies0.0090.0040.0110.0010.0030.0050.0020.004
Economic agenciesHouse rental unit price30.52124.41221.29218.28033.32317.83421.15414.285
Small and microenterprise density1201.4663414.530425.5053569.7821952.0981363.0082400.5551475.822
Proportion of high-end service industry19.53116.22713.2228.42525.01020.54017.41912.683
Visitor population157,014.444133,378.76240,293.50084,306.800123,818.11896,178.15473,098.60569,679.643
Job density1.7983.7940.8773.9152.8661.3512.5001.315
Environmental factorsAir quality70.33361.61965.00062.60062.05964.23162.50064.786
Green area per capita9.4108.2048.4670.3924.8004.8140.7991.451
Living area per capita39.20754.84851.48627.01044.46229.02025.74524.730
Water area per capita2.2180.0660.0000.0000.0000.8270.0000.094
Community areas215,851.353174,468.029400,001.05659,356.896128,179.498231,560.49970,001.819154,203.156
Number of communities94222017133814
Publisher’s Note: MDPI stays neutral with regard to jurisdictional claims in published maps and institutional affiliations.

