Comparison of Physicochemical Properties of Bee Pollen with Other Bee Products


 ,
,  and
and 
Abstract
1. Introduction
2. Materials and Methods
2.1. Samples
2.2. Chemicals and Reagents
2.3. The pH Measurement
2.4. Electrical Conductivity
2.5. Refractometry
2.6. Evaluation of Oxidation-Reduction Potential
2.7. Ultraviolet-Visible Scanning Spectrophotometry
2.8. Spectrophotometric Evaluation
2.9. Microelements Analysis in Bee Products
2.10. Statistical Analysis
3. Results and Discussion
3.1. Physicochemical Properties of Bee Pollen and Other Bee Products
3.2. Spectrophotometric Analysis of Bee Pollen and Other Bee Products
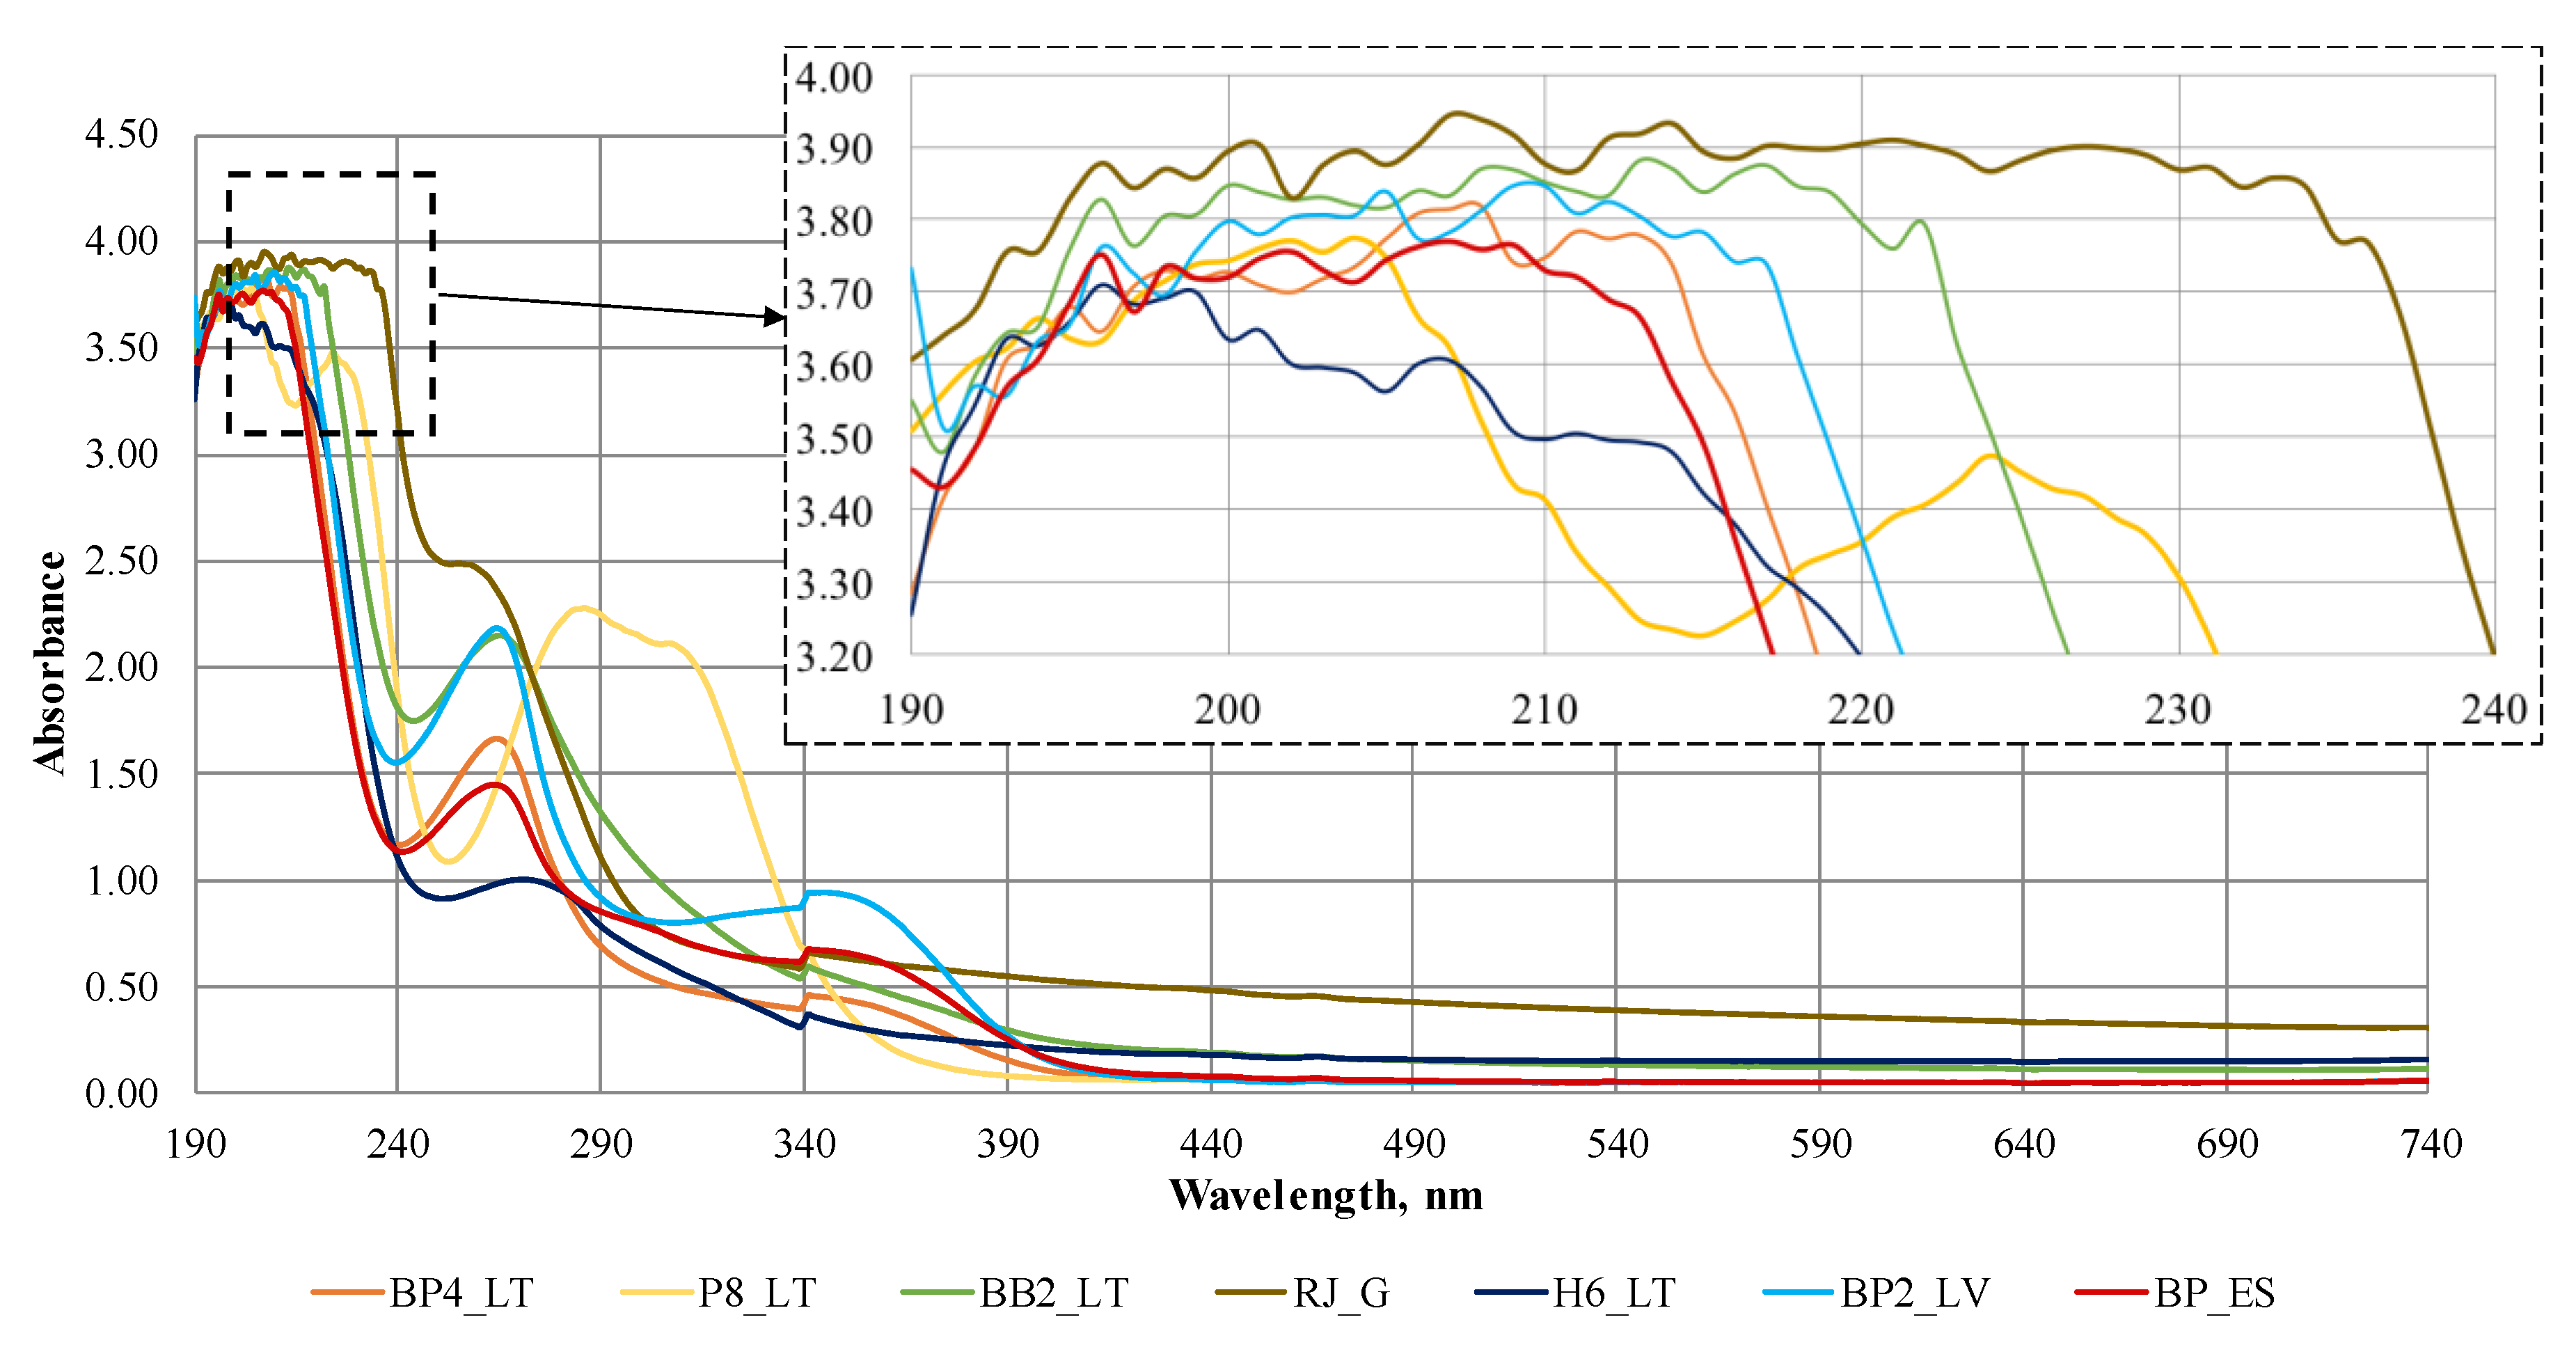
3.3. Ultraviolet-Visible Scanning Spectrometry
3.4. Mineral Content in the Tested Samples
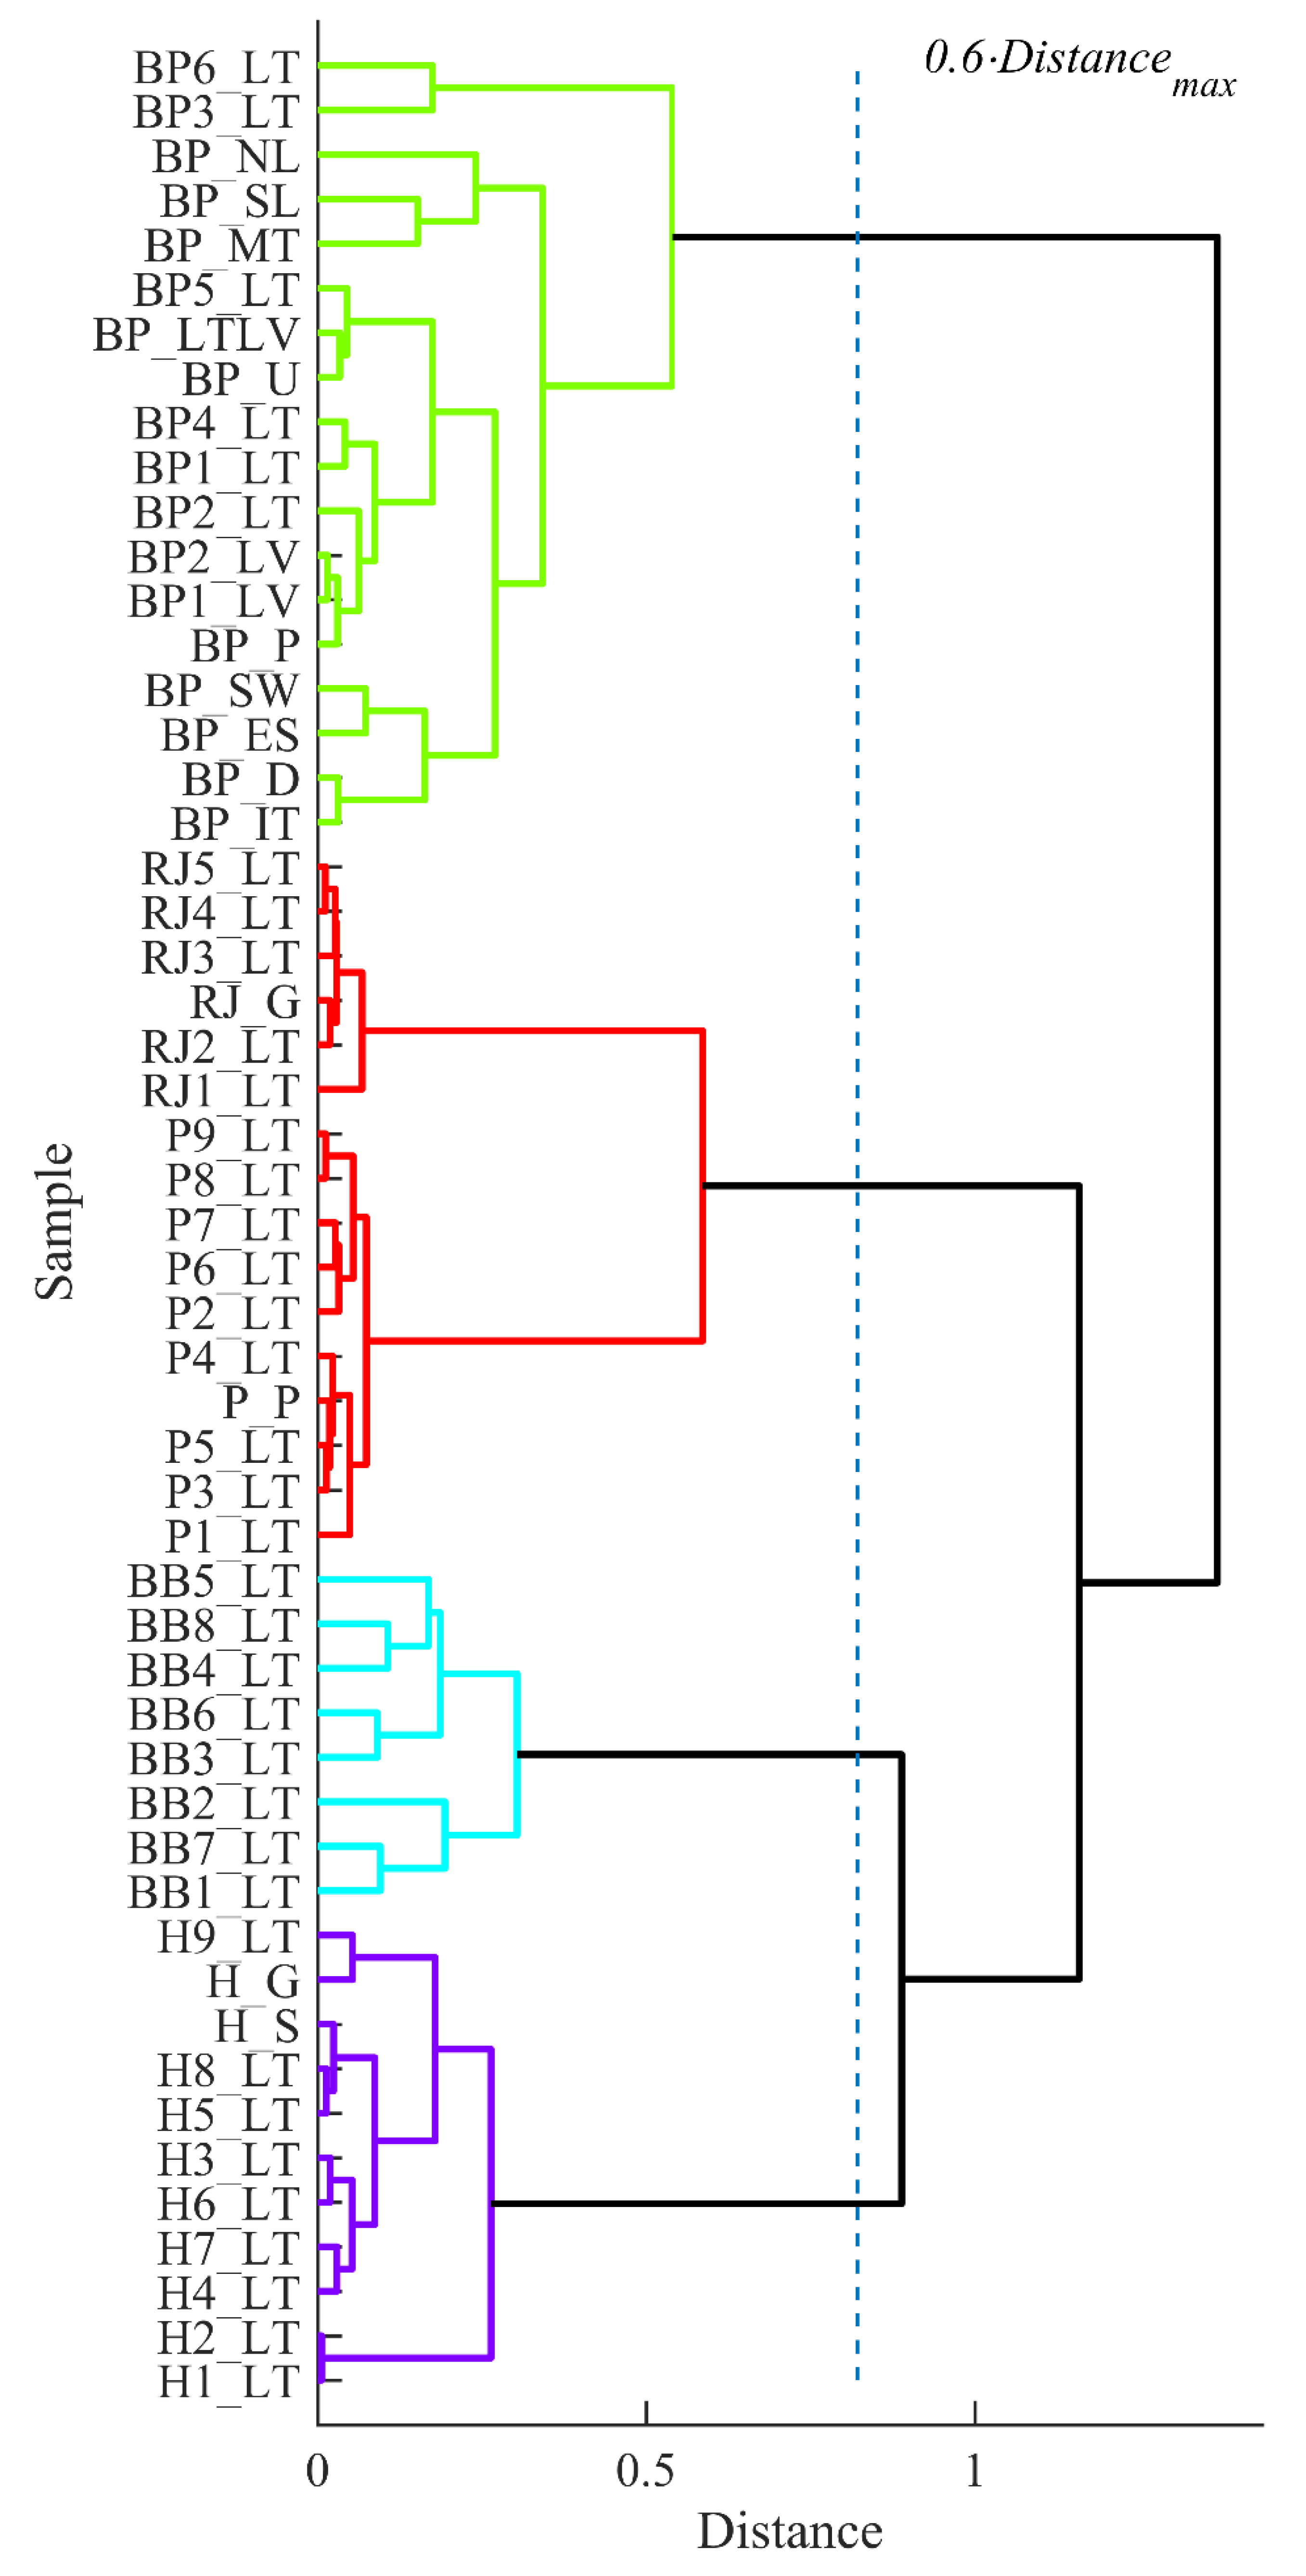
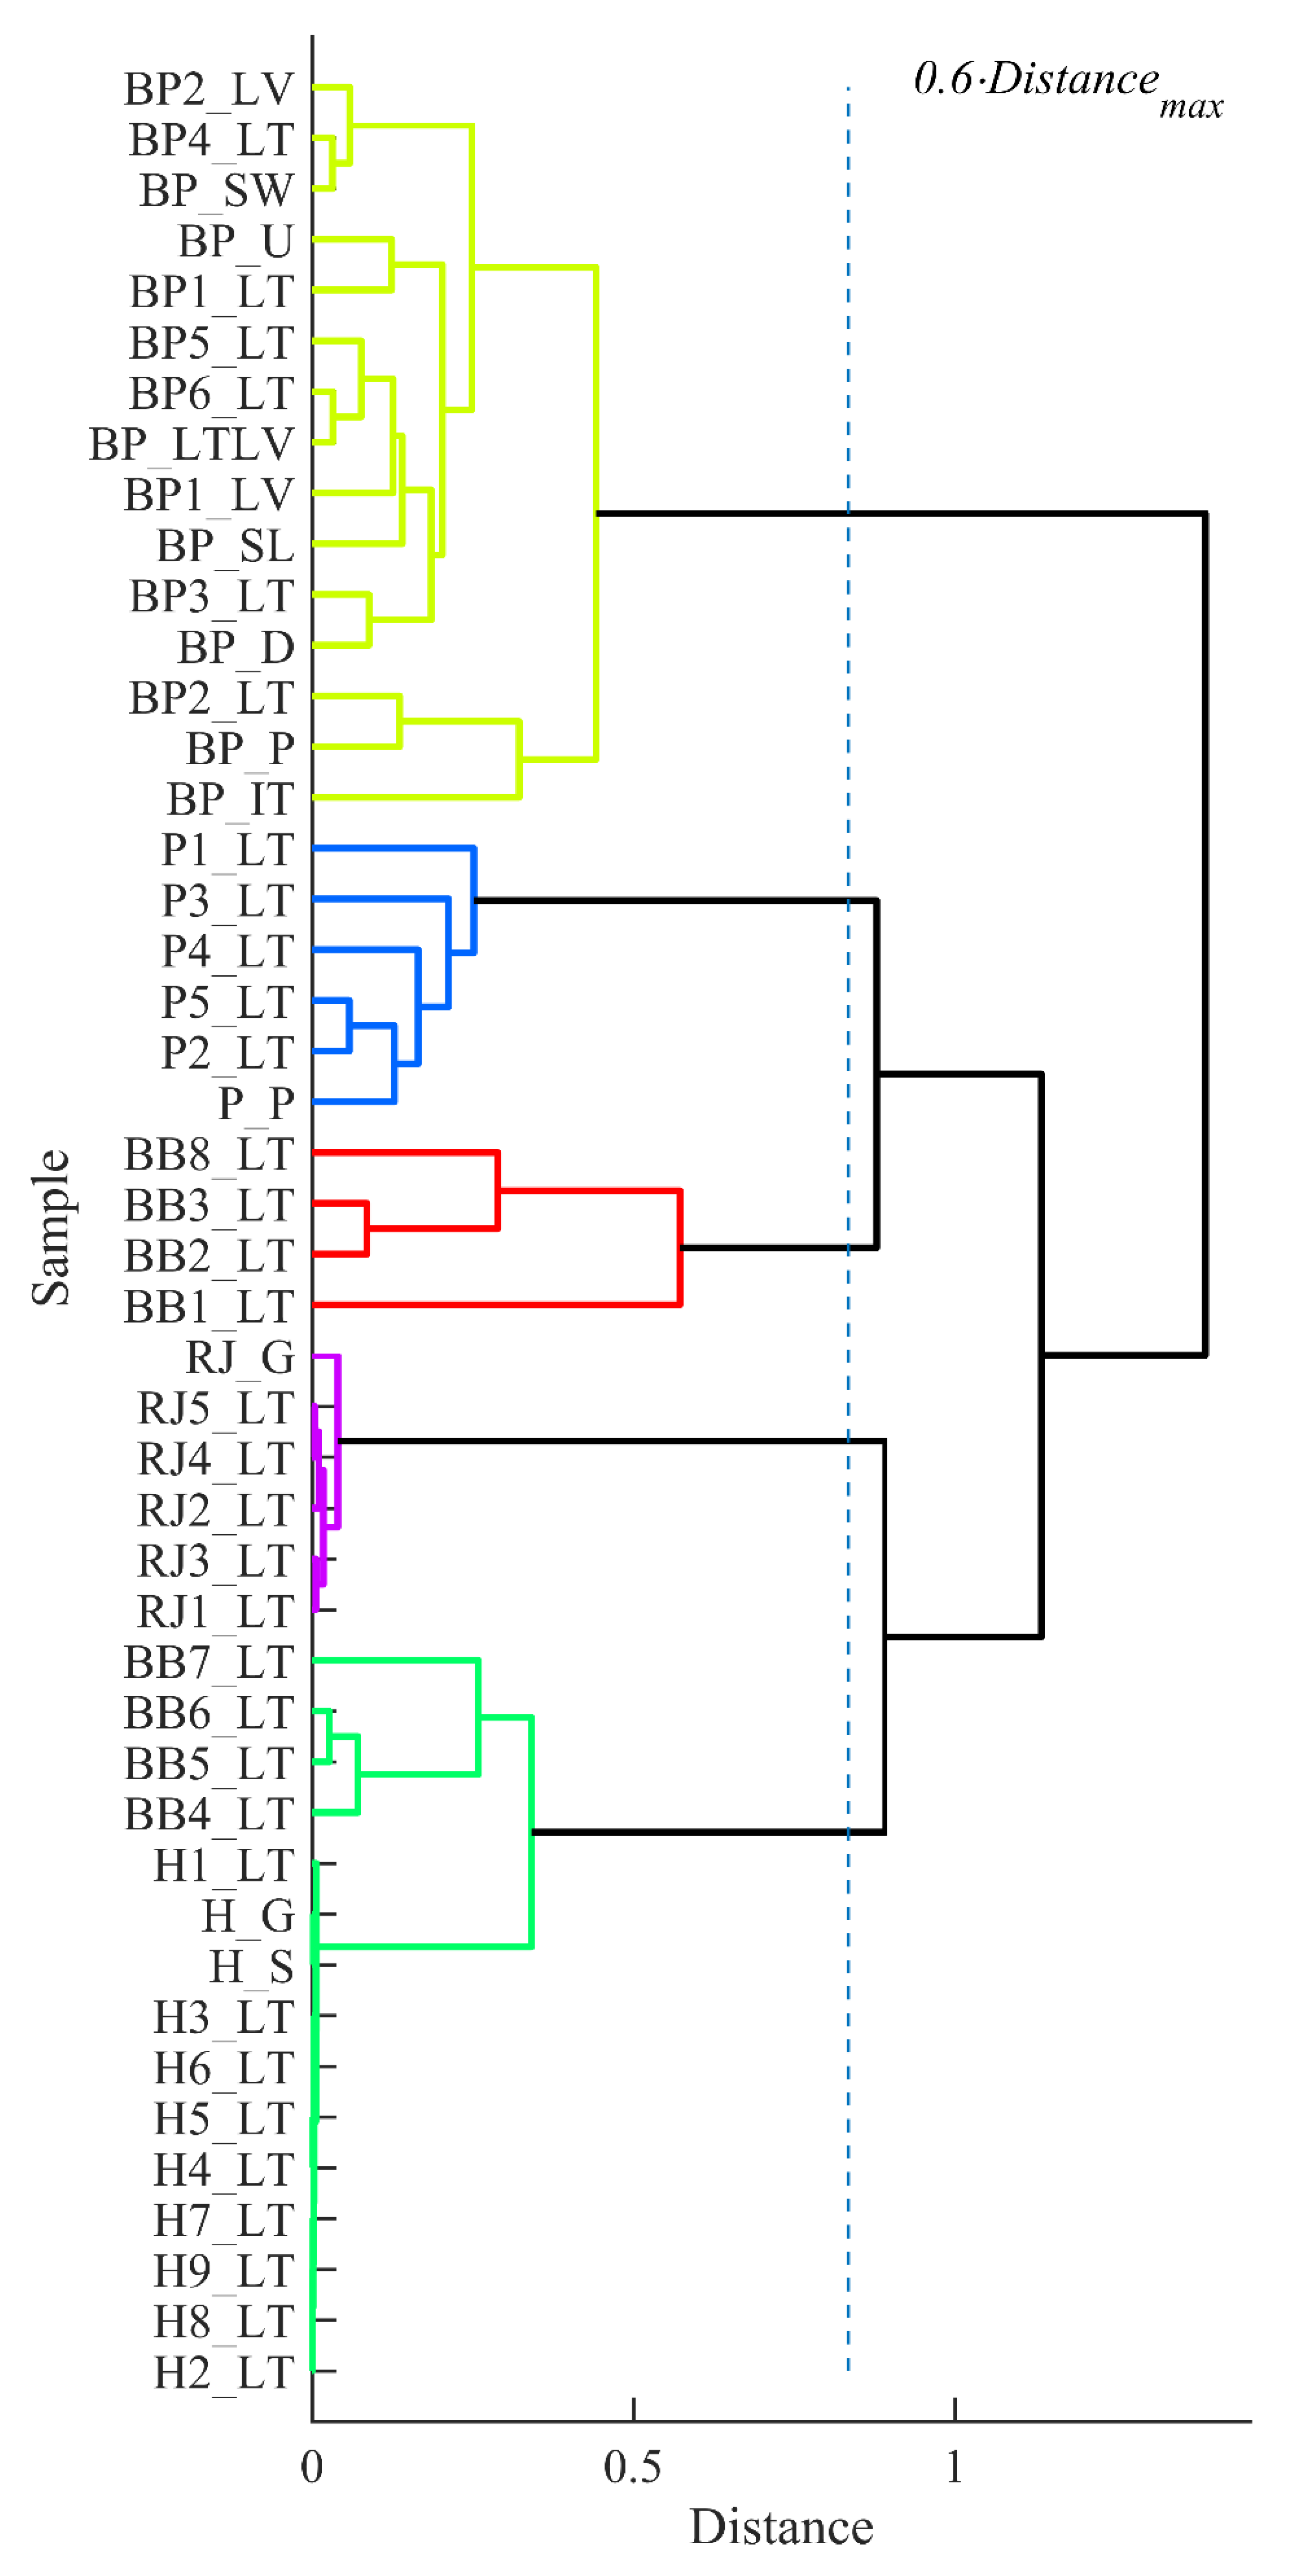
3.5. Clustering Analysis of the Data
4. Conclusions
Author Contributions
Funding
Acknowledgments
Conflicts of Interest
References
- Bobis, O.; Marghitas, L.A.; Dezmirean, D.; Morar, O.; Bonta, V.; Chirila, F. Quality parameters and nutritional value of different commercial bee products. Bull. Uasvm Anim. Sci. Biotechnol. 2010, 67, 91–96. [Google Scholar]
- Bogdanov, S. Functional and biological properties of the bee products: A review. Bee Prod. Sci. 2011, 1–12. Available online: http://www.bee-hexagon.net (accessed on 29 July 2019).
- Yucel, B.; Topal, E.; Kosoglu, M. Bee products as functional food. In Superfood and Functional Food–An Overview of Their Processing and Utilization; IntechOpen: London, UK, 2017; pp. 16–33. [Google Scholar]
- Campos, M.G.R.; Bogdanov, S.; de Almeida-Muradian, L.B.; Szczesna, T.; Mancebo, Y.; Frigerio, C.; Ferreira, F. Pollen composition and standardisation of analytical methods. J. Apic. Res. Bee World 2008, 47, 156–163. [Google Scholar]
- Denisow, B.; Denisow-Pietrzyk, M. Biological and therapeutic properties of bee pollen. A review. J. Sci. Food Agric. 2016, 96, 4303–4309. [Google Scholar] [CrossRef] [PubMed]
- Linskens, H.F. Pollen as Food for Humans and Animals and as Medicine; Fertilization in Higher Plants; Springer: Berlin/Heidelberg, Germany, 1999; pp. 397–403. [Google Scholar]
- Koroglu, A. Bee pollen and its pharmacological properties. Commun. Fac. Sci. Univ. Ank. Ser. C 2018, 27, 93–97. [Google Scholar]
- Lachman, J.; Hejtmankova, A.; Sykora, J.; Karban, J.; Orsak, M.; Rygerova, B. Contents of major phenolic and flavonoid antioxidants in selected Czech honey. Czech J. Food Sci. 2010, 28, 412–426. [Google Scholar] [CrossRef]
- Pasupuleti, V.R.; Sammugam, L.; Ramesh, N.; Gan, S.H. Honey, propolis and royal jelly: A comprehensive review of their biological actions and health benefits. Oxidative Med. Cell. Longev. 2017, 2017, 1259510. [Google Scholar] [CrossRef]
- Habryka, C.; Kruczek, M.; Drygas, B. Bee products used in apitherapy. World Sci. News 2016, 48, 254–258. [Google Scholar]
- Barene, I.; Daberte, I.; Siksna, S. Investigation of bee bread and development of its dosage forms. Med. Teor. Prakt. 2015, 21, 16–22. [Google Scholar] [CrossRef]
- Kieliszek, M.; Piwowarek, K.; Kot, A.M.; Blazejak, S.; Chlebowska-Smigiel, A.; Wolska, I. Pollen and bee bread as new health-oriented products: A review. Trends Food Sci. Technol. 2018, 71, 170–180. [Google Scholar] [CrossRef]
- Ivanisova, E.; Kacaniova, M.; Francakova, H.; Petrova, J.; Hutkova, J.; Brovarskyi, V.; Velychko, S.; Adamchuk, L.; Schubertová, Z.; Musilová, J. Bee bread perspective source of bioactive compounds for future. Potravin. Sci. J. Food Ind. 2015, 9, 592–598. [Google Scholar]
- Bakova, V.; de Castro, S.; Marcucci, M. Propolis: Recent advances in chemistry and plant origin. In Apidologie; Springer: Berlin, Germany, 2000; Volume 31, pp. 3–15. [Google Scholar]
- Wagh, V.D. Propolis: A wonder bees product and its pharmacological potentials. Adv. Pharmacol. Sci. 2013, 2013, 308249. [Google Scholar] [CrossRef] [PubMed]
- Ristivojevic, P.; Trifkovic, J.; Andric, F.; Milojkovic-Opsenica, D. Poplar-type propolis: Chemical composition, botanical origin and biological activity. Nat. Prod. Commun. 2015, 10, 1869–1876. [Google Scholar] [CrossRef] [PubMed]
- Ramnath, S.; Venkataramegowda, S.; Singh, C. Chemical composition of bee propolis collected from different regions in India by GCMS analysis. Int. J. Pharmacogn. Phytochem. 2015, 30, 1319–1328. [Google Scholar]
- Sharaf El-Din, H.A.; Nour, M.E.; Abd Al-Fattah, M.A. Some factor affecting royal jelly production from honeybee colonies at Giza region. Bull. Entomol. Soc. Egypt 2010, 87, 201–210. [Google Scholar]
- Barnutiu, L.I.; Marghitas, L.A.; Dezmirean, D.S.; Mihai, C.M.; Bobis, O. Chemical composition and antimicrobial activity of royal jelly–review. Sci. Pap. Anim. Sci. Biotechnol. 2011, 44, 67–71. [Google Scholar]
- Kocot, J.; Kielczykowska, M.; Luchowska-Kocot, D.; Kurzepa, J.; Musik, I. Antioxidant potential of propolis, bee pollen and royal jelly: Possible medical application. Oxidative Med. Cell. Longev. 2018, 2018, 7074209. [Google Scholar] [CrossRef]
- Dias, L.G.; Pereira, A.P.; Estevinho, L.M. Comparative study of different Portuguese samples of propolis: Pollinic, sensorial, physicochemical, microbiological characterization and antibacterial activity. Food Chem. Toxicol. 2012, 50, 4246–4253. [Google Scholar] [CrossRef]
- Pal, R.S.; Kumar, V.A.; Arora, S.; Sharma, A.K.; Kumar, V.; Agrawal, S. Physicochemical and antioxidant properties of kiwifruit as a function of cultivar and fruit harvested month. Braz. Arch. Biol. Technol. 2015, 58, 262–271. [Google Scholar] [CrossRef]
- Mello, L.D.; Quadros, G.P. Correlation between antioxidant activity and total phenolic content with physicochemical parameters of blended extracts of Camellia sinensis. Acta Sci. 2014, 36, 97–103. [Google Scholar] [CrossRef]
- Alwazeer, D.; Sally, D.H.A.M. Presumptive relationship between oxidoreduction potential and both antibacterial and antioxidant activities of herbs and spices: Oxidoreduction potential as a companion tool for measuring the antioxidant activity. Not. Bot. Horti Agrobot. Cluj-Napoca 2019, 47, 506–514. [Google Scholar] [CrossRef]
- Tomazzoli, M.M.; Pai Neto, R.D.; Moresco, R.; Westphal, L.; Zeggio, A.R.S.; Specht, L.; Costa, C.; Rocha, M.; Maraschin, M. Discrimination of Brazilian propolis according to the seasoning using chemometrics and machine learning based on UV-Vis scanning data. J. Integr. Bioinform. 2015, 12, 279–293. [Google Scholar] [CrossRef] [PubMed]
- Kaškonienė, V.; Kaškonas, P.; Maruška, A. Volatile compounds composition and antioxidant activity of bee pollen collected in Lithuania. Chem. Pap. 2015, 69, 291–299. [Google Scholar] [CrossRef]
- Feas, X.; Vazquez-Tato, M.P.; Estevinho, L.; Seijas, J.A.; Iglesias, A. Organic bee pollen: Botanical origin, nutritional value, bioactive compounds, antioxidant activity and microbiological quality. Molecules 2012, 17, 8359–8377. [Google Scholar] [CrossRef] [PubMed]
- Duarte, A.W.F.; dos Santos Vasconcelos, M.R.; Oda-Souza, M.; de Oliveira, F.F.; Lopez, A.M.Q. Honey and bee pollen produced by Meliponini (Apidae) in Alagoas, Brazil: Multivariate analysis of physicochemical and antioxidant profiles. Food Sci. Technol. 2018, 38, 493–503. [Google Scholar] [CrossRef]
- Ummulkhair, O.M.; Bolanle, A.E. Physicochemical assessment of commercial honey from EDO state, Nigeria. J. Appl. Sci. Eng. Res. 2015, 4, 151–160. [Google Scholar]
- Bogdanov, S. Royal jelly, bee brood: Composition, health, medicine: A review. Bee Prod. Sci. 2017, 1–41. Available online: http://www.bee-hexagon.net (accessed on 29 July 2019).
- Balkanska, R.; Zhelyazkova, I.; Ignatova, M. Physicochemical quality characteristics of royal jelly from three regions of Bulgaria. Agric. Sci. Technol. 2012, 4, 302–305. [Google Scholar]
- Zhang, C.; Tateishi, N.; Tanabe, K. Pollen density on the stigma affects endogenous gibberellin metabolism, seed and fruit set, and fruit quality in Pyrus pyrifolia. J. Exp. Bot. 2010, 61, 4291–4302. [Google Scholar] [CrossRef]
- Ayvaz, H. Quality control of honey using new generation infrared spectrometers. Turk. J. Agric. Food Sci. Technol. 2017, 5, 326–334. [Google Scholar] [CrossRef][Green Version]
- Sesta, G.; Lusco, L. Refractometric determination of water content in royal jelly. In Apidologie; Springer: Berlin, Germany, 2008; Volume 39, pp. 225–232. [Google Scholar]
- Lee, S.-Y.; Kim, E.-O.; Seo, H.-J.; Kim, M.-Y.; Kim, J.-D. Development of new method for antioxidant capacity with ORP-pH system. Biotechnol. Bioprocess Eng. 2004, 9, 514–518. [Google Scholar] [CrossRef]
- Chirila, E.; Oancea, E.; Oancea, I.A. Physico-chemical characterisation of sea buckthorn extracts for cosmetic use. Ovidius Univ. Ann. Chem. 2014, 25, 75–80. [Google Scholar] [CrossRef]
- Zuluaga, C.M.; Serrato, J.C.; Quicazan, M.C. Chemical, nutritional and bioactive characterization of Columbian bee bread. Chem. Eng. Trans. 2015, 43, 175–180. [Google Scholar]
- Boulanouar, B.; Mounir, H.; Ahmed, B.; Abdelaziz, G. Total phenolic, flavonoid contents and antioxidant activities of honey and propolis collected from region of Laghouat (South of Algeria). Int. J. Pharmacogn. Chin. Med. 2017, 1, 000110. [Google Scholar]
- Pratami, D.K.; Munim, A.; Sundowo, A.; Sahlan, M. Phytochemical profile and antioxidant activity of propolis ethanolic extract from Tetragonula bee. Pharmacogn. J. 2018, 10, 128–135. [Google Scholar] [CrossRef]
- Dos Santos Vasconcelos, M.R.; Fernandes Duarte, A.W.; Gomes, E.P.; da Silva, S.C.; Queijeiro Lopez, A.M. Physicochemical composition and antioxidant potential of bee pollen from different botanical sources in Alagoas, Brazil. Cienc. Agrotecnol. 2017, 41, 447–458. [Google Scholar] [CrossRef]
- Mosić, M.; Trifković, J.; Vovk, I.; Gašić, U.; Tešić, Ž.; Šikoparija, B.; Milojković-Opsenica, D. Phenolic composition influences the health-promoting potential of bee-pollen. Biomolecules 2019, 9, 783. [Google Scholar] [CrossRef]
- Araújo, J.S.; Chambó, E.D.; de Carvalho Costa, M.A.P.; da Silva, S.M.P.C.; de Carvalho, C.A.L.; Estevinho, L.M. Chemical composition and biological activities of mono- and heterofloral bee pollen of different geographical origins. Int. J. Mol. Sci. 2017, 18, 921. [Google Scholar] [CrossRef]
- Čeksteryte, V.; Kurtinaitienė, B.; Venskutonis, P.R.; Pukalskas, A.; Kazernavičiūtė, R.; Balžekas, J. Evaluation of antioxidant activity and flavonoid composition in differently preserved bee products. Czech J. Food Sci. 2016, 34, 133–142. [Google Scholar] [CrossRef]
- Hernandez Zarate, M.S.; Abraham Juarez, M.R.; Ceron Garcia, A.; Ozuna Lopez, C.; Gutierrez Chavez, A.J.; Nezahualcoyotl, S.G.J.D.; Fidel, A.R. Flavonoids, phenolic content and antioxidant activity of propolis from various areas of Guanajuato, Mexico. Food Sci. Technol. 2018, 38, 210–215. [Google Scholar] [CrossRef]
- Bundit, T.; Anothai, T.; Pattaramart, P.; Roongpet, T.; Chuleeporn, S. Comparison of antioxidant content of Thai honeys to Manuka honey. Malays. J. Nutr. 2016, 22, 413–420. [Google Scholar]
- Pratama, M.R.F.; Mulyani, E.; Suratno, S. Profile of thin-layer chromatography and UV-Vis spectrophotometry of Akar Kuning stem extract (Arcangelisia flava). Borneo J. Pharm. 2018, 1, 61–65. [Google Scholar] [CrossRef]
- Santos-Buelga, C.; García-Viguera, C.; Tomás-Barberán, F.A. Online Identification of Flavonoids by HPLC Coupled to Diode Array Detection; Methods in Polyphenol Analysis; Santos-Buelga, C., Williamson, G., Eds.; The Royal Society of Chemistry: Cambridge, UK, 2003; pp. 92–127. [Google Scholar]
- Kostić, A.Ž.; Pešić, M.B.; Mosić, M.D.; Dojčinović, B.P.; Natić, M.M.; Trifković, J.Đ. Mineral content of bee pollen from Serbia. Arch. Ind. Hyg. Toxicol. 2015, 66, 251–258. [Google Scholar]
- Huwait, E.A.; Kumosani, T.A.; Moselhy, S.S.; Mosaoa, R.M.; Yaghmoor, S.S. Relationship between soil cobalt and vitamin B12 levels in the liver of livestock in Saudi Arabia: Role of competing elements in soils. Afr. Health Sci. 2015, 15, 993–998. [Google Scholar] [CrossRef] [PubMed]


| Name | Bee Product | Location | Country | Collection Period | GPS Coordinates |
|---|---|---|---|---|---|
| 1 | 2 | 3 | 4 | 5 | 6 |
| BP_IT | Bee pollen | Bibbiena region | Italy | 2018 | 43°42′N 11°49′E |
| BP_D | Alsgarde region | Denmark | Aug 2018 | 56°04′N 12°32′E | |
| BP_SW | Hagfors region | Sweden | Aug 2018 | 60°02′N 13°39′E | |
| BP_SL | Trnava region | Slovakia | Jun 2018 | 48°22′N 17°35′E | |
| BP_P | Bialystok | Poland | Jul 2018 | 53°08′N 23°08′E | |
| BP_ES | Valencia region | Spain | May 2018 | 39°28’N 0°22’W | |
| BP_MT | Northern region, Mellieha | Republic of Malta | Aug 2018 | 35°57′N 14°21′E | |
| BP_NL | South Holland, Gouda | The Netherlands | Aug 2018 | 52°0′N 4°42′E | |
| BP1_LT | Šiauliai region, Kuršėnai | Lithuania | Aug 2018 | 55°59’N 22°55’E | |
| BP2_LT | Zarasai | Lithuania | 2018 | 55°43’N 26°15’E | |
| BP3_LT | Prienai | Lithuania | 2018 | 54°37’N 23°56’E | |
| BP4_LT | Kaunas | Lithuania | 2018 | 54°53’N 23°53’E | |
| BP5_LT | Radviliškis | Lithuania | Jul 2018 | 55°49’N 23°31’E | |
| BP6_LT | Biržai and Panevėžys region mix | Lithuania | 2018 | 55°44’N 24°22’E | |
| BP1_LV | Saldus region | Latvia | Jun 201 | 56°40′N 22°12′E | |
| BP2_LV | Alūksne region | Latvia | Jul 2018 | 57°23′N 27°6′E | |
| BP_U | Volyn region | Ukraine | 2018 | 50°44′N 25°21′E | |
| BP_LTLV | Mix of Lithuanian and Latvian | 2018 | |||
| BB1_LT | Beebread | Kaunas region | Lithuania | 2018 | 54°55’N 23°57’E |
| BB2_LT | Kaišiadorys region | Lithuania | 2018 | 54°52’N 24°26’E | |
| BB3_LT | Šilutė region | Lithuania | 2018 | 55°21’N 21°28’E | |
| BB4_LT | Pasvalys region | Lithuania | 2018 | 56°04’N 24°23’E | |
| BB5_LT | Vilnius region | Lithuania | 2018 | 54°43’N 25°22’E | |
| BB6_LT | Skuodas region | Lithuania | 2018 | 56°16’N 21°31’E | |
| BB7_LT | Pakruojis region | Lithuania | 2018 | 55°58’N 23°52’E | |
| BB8_LT | Prienai region | Lithuania | 2018 | 54°37’N 23°56’E | |
| 1 | 2 | 3 | 4 | 5 | 6 |
| H2_LT | Honey | Vilkaviškis region, Švitrūnai | Lithuania | Jul 2018 | 54°38′N 22°52′E |
| H3_LT | Vilkaviškis region, Pilviškiai | Lithuania | Jun 2018 | 54°43′N 23°13′E | |
| H4_LT | Panevėžys | Lithuania | Aug 2018 | 55°43’N 24°21’E | |
| H5_LT | Prienai | Lithuania | Jul 2018 | 54°37’N 23°56’E | |
| H_S | Sicilia (Sulla coronaria honey) | Italy | 2018 | 37°49’N 15°16’E | |
| H_G | Crete | Greece | 2018 | 35°12′N 24°54′E | |
| H6_LT | Anykščiai region | Lithuania | Jul 2018 | 55°31’N 25°06’E | |
| H7_LT | Vilnius region | Lithuania | Jul 2018 | 54°41’N 25°16’E | |
| H8_LT | Rokiškis | Lithuania | Jul 2018 | 55°58’N 25°34’E | |
| H9_LT | Varėna | Lithuania | Jul 2018 | 54°13’N 24°34’E | |
| P_P | Propolis | Bialystok | Poland | 2018 | 53°7’N 23°10’E |
| P1_LT | Mažeikiai region | Lithuania | 2018 | 56°19’N 22°19’E | |
| P2_LT | Vilnius region | Lithuania | 2018 | 54°49’N 25°19’E | |
| P3_LT | Ignalina | Lithuania | 2018 | 55°21’N 26°10’E | |
| P4_LT | Marijampolė region | Lithuania | 2018 | 54°45’N 23°15’E | |
| P5_LT | Panevėžys and Šiauliai mix | Lithuania | 2018 | 55°48’N 23°57’E | |
| P6_LT | Šakių region, Pervazninkai | Lithuania | 2018 | 55°02′N 22°43′E | |
| P7_LT | Pasvalio region, Ustukiai | Lithuania | 2018 | 56°04′N 24°21′E | |
| P8_LT | Šalčininkų region, Didžiuliai | Lithuania | 2018 | 54°15′N 25°37′E | |
| P9_LT | Kretingos region, Baubliai | Lithuania | 2018 | 55°49′N 21°24′E | |
| BB1_LT | Beebread | Kaunas region | Lithuania | 2018 | 54°55’N 23°57’E |
| BB2_LT | Kaišiadorys region | Lithuania | 2018 | 54°52’N 24°26’E | |
| BB3_LT | Šilutė region | Lithuania | 2018 | 55°21’N 21°28’E | |
| BB4_LT | Pasvalys region | Lithuania | 2018 | 56°04’N 24°23’E | |
| BB5_LT | Vilnius region | Lithuania | 2018 | 54°43’N 25°22’E | |
| BB6_LT | Skuodas region | Lithuania | 2018 | 56°16’N 21°31’E | |
| BB7_LT | Pakruojis region | Lithuania | 2018 | 55°58’N 23°52’E | |
| BB8_LT | Prienai region | Lithuania | 2018 | 54°37’N 23°56’E | |
| RJ_G | Royal jelly | Bradenburg region | Germany | 2017 | 52°24’N 12°32’E |
| RJ1_LT | Kupiškis region, Lukonys | Lithuania | Jun 25, 2018 | 55°47’N 24°46’E | |
| RJ2_LT | Kupiškis region, Lukonys | Lithuania | Aug 2, 2018 | 55°47’N 24°46’E | |
| RJ3_LT | Pakruojis region, Oniūnai | Lithuania | Jul 16, 2018 | 55°50’N 24°49’E | |
| RJ4_LT | Pakruojis region, Oniūnai | Lithuania | Aug 10, 2018 | 55°50’N 24°49’E | |
| RJ5_LT | Pakruojis region, Oniūnai | Lithuania | Aug 13, 2018 | 55°50’N 24°49’E |
| Sample | Sample Code | pH | Conductivity, µS/cm | ORP, mV | Brix, % | RI | NaCl, % |
|---|---|---|---|---|---|---|---|
| 1 | 2 | 3 | 4 | 5 | 6 | 7 | 8 |
| Bee pollen | BP_IT | 4.32 | 744.6 | 100.20 | 31.84 | 1.343 | 6.34 |
| BP_D | 4.40 | 757.0 | 85.42 | 27.36 | 1.343 | 6.26 | |
| BP_SW | 4.57 | 786.0 | 195.92 | 29.68 | 1.343 | 7.08 | |
| BP_SL | 4.53 | 836.4 | 94.17 | 25.84 | 1.344 | 6.66 | |
| BP_P | 5.05 | 577.4 | 103.84 | 25.52 | 1.344 | 8.84 | |
| BP1_LT | 4.90 | 573.6 | 187.30 | 24.08 | 1.343 | 9.24 | |
| BP2_LT | 4.91 | 546.0 | 107.72 | 24.64 | 1.343 | 10.36 | |
| BP3_LT | 4.96 | 476.6 | 155.08 | 22.56 | 1.344 | 10.94 | |
| BP4_LT | 5.22 | 456.6 | 157.88 | 30.80 | 1.343 | 10.14 | |
| BP5_LT | 5.09 | 699.4 | 124.99 | 28.16 | 1.343 | 10.46 | |
| BP6_LT | 4.63 | 444.2 | 69.10 | 24.64 | 1.344 | 10.68 | |
| BP1_LV | 5.02 | 689.0 | 100.05 | 28.56 | 1.344 | 10.76 | |
| BP2_LV | 4.98 | 667.4 | 106.81 | 26.16 | 1.345 | 10.00 | |
| BP_U | 5.00 | 645.2 | 123.58 | 29.44 | 1.344 | 11.24 | |
| BP_LTLV | 4.80 | 622.4 | 152.60 | 27.36 | 1.344 | 11.36 | |
| BP_ES | 4.34 | 731.0 | 162.83 | 28.24 | 1.343 | 5.66 | |
| BP_MT | 4.30 | 800.8 | 71.88 | 28.32 | 1.341 | 5.96 | |
| BP_NL | 4.43 | 455.0 | 122.44 | 25.44 | 1.343 | 6.94 | |
| SDa | 0.005 | 0.67 | 0.58 | 0.046 | 0.001 | 0.045 | |
| Descriptive statistics | Meanb (LT) | 4.95 | 533 | 114 | 28.0 | 1.343 | 10.30 |
| SD (LT)c | 0.20 | 96 | 30 | 2.2 | 0.001 | 0.59 | |
| Mean (all samples) | 4.75 | 639 | 123 | 27.2 | 1.343 | 8.8 | |
| SD (all samples)c | 0.31 | 127 | 37 | 2.5 | 0.001 | 2.1 | |
| Mind (all samples) | 4.30 | 444.2 | 69.10 | 22.56 | 1.341 | 5.66 | |
| Maxe (all samples) | 5.22 | 836.4 | 195.92 | 31.84 | 1.345 | 11.36 | |
| Beebread | BB1_LT | 4.12 | 229.8 | 77.23 | 18.48 | 1.344 | 5.84 |
| BB2_LT | 4.11 | 281.6 | 95.40 | 20.00 | 1.344 | 6.84 | |
| BB3_LT | 4.44 | 294.0 | 85.56 | 20.08 | 1.342 | 5.24 | |
| BB4_LT | 4.32 | 251.0 | 95.74 | 19.84 | 1.342 | 6.24 | |
| BB5_LT | 4.37 | 312.6 | 96.26 | 18.64 | 1.343 | 6.04 | |
| BB6_LT | 4.33 | 276.0 | 100.45 | 19.92 | 1.344 | 6.34 | |
| BB7_LT | 4.23 | 206.8 | 99.17 | 17.44 | 1.343 | 6.24 | |
| BB8_LT | 4.28 | 257.8 | 92.78 | 17.36 | 1.344 | 6.40 | |
| SD | 0.005 | 0.86 | 0.59 | 0.045 | 0.001 | 0.05 | |
| Descriptive statistics | Mean (all samples) | 4.28 | 264 | 92.8 | 19.0 | 1.343 | 6.15 |
| SD (all samples) | 0.12 | 35 | 7.8 | 1.2 | 0.001 | 0.47 | |
| Min (all samples) | 4.11 | 206.8 | 77.23 | 17.36 | 1.342 | 5.24 | |
| Max (all samples) | 4.44 | 312.6 | 100.45 | 20.08 | 1.344 | 6.84 | |
| 1 | 2 | 3 | 4 | 5 | 6 | 7 | 8 |
| Honey | H1_LT | 4.30 | 146.6 | 77.67 | 16.88 | 1.347 | 1.94 |
| H2_LT | 4.26 | 142.8 | 69.26 | 17.04 | 1.349 | 2.08 | |
| H3_LT | 3.81 | 155.8 | 106.98 | 16.96 | 1.349 | 2.14 | |
| H4_LT | 4.24 | 166.6 | 97.60 | 18.00 | 1.351 | 2.24 | |
| H5_LT | 4.17 | 158.8 | 107.91 | 17.12 | 1.350 | 2.36 | |
| H_IT | 4.30 | 181.6 | 100.70 | 17.44 | 1.351 | 2.28 | |
| H_G | 4.68 | 164.0 | 83.23 | 18.16 | 1.353 | 2.54 | |
| H6_LT | 3.72 | 162.6 | 99.55 | 17.52 | 1.350 | 2.24 | |
| H7_LT | 4.00 | 198.8 | 85.22 | 17.04 | 1.352 | 2.14 | |
| H8_LT | 4.12 | 179.4 | 87.09 | 18.24 | 1.351 | 2.42 | |
| H9_LT | 4.74 | 182.6 | 102.20 | 16.96 | 1.351 | 2.58 | |
| SD | 0.007 | 0.86 | 0.51 | 0.045 | 0.001 | 0.06 | |
| Descriptive statistics | Mean (LT) | 4.15 | 166 | 93 | 17.31 | 1.350 | 2.23 |
| SD (LT) | 0.30 | 18 | 14 | 0.50 | 0.001 | 0.20 | |
| Mean (all samples) | 4.21 | 167 | 93 | 17.40 | 1.350 | 2.26 | |
| SD (all samples) | 0.31 | 17 | 13 | 0.52 | 0.001 | 0.20 | |
| Min (all samples) | 3.72 | 142.8 | 69.26 | 16.88 | 1.348 | 1.94 | |
| Max (all samples) | 4.74 | 198.8 | 107.91 | 18.24 | 1.353 | 2.58 | |
| Propolis | P_P | 4.19 | 327.8 | 162.10 | 13.84 | 1.337 | 5.84 |
| P1_LT | 3.96 | 354.2 | 188.36 | 9.04 | 1.343 | 6.26 | |
| P2_LT | 4.06 | 256.4 | 104.14 | 8.96 | 1.336 | 6.34 | |
| P3_LT | 4.21 | 244.6 | 189.96 | 12.16 | 1.336 | 6.94 | |
| P4_LT | 3.95 | 388.6 | 161.74 | 10.88 | 1.338 | 6.60 | |
| P5_LT | 4.17 | 439.8 | 136.39 | 10.32 | 1.336 | 6.66 | |
| P6_LT | 4.02 | 401.0 | 107.77 | 10.64 | 1.337 | 6.28 | |
| P7_LT | 4.00 | 323.0 | 108.83 | 10.16 | 1.336 | 6.22 | |
| P8_LT | 3.98 | 366.8 | 93.93 | 12.40 | 1.337 | 5.94 | |
| P9_LT | 4.07 | 254.6 | 82.20 | 12.16 | 1.337 | 6.66 | |
| SD | 0.005 | 0.53 | 0.56 | 0.045 | 0.001 | 0.06 | |
| Descriptive statistics | Mean (LT) | 4.04 | 337 | 130 | 10.8 | 1.337 | 6.43 |
| SD (LT) | 0.09 | 71 | 41 | 1.3 | 0.001 | 0.30 | |
| Mean (all samples) | 4.06 | 336 | 134 | 11.1 | 1.337 | 6.37 | |
| SD (all samples) | 0.10 | 67 | 40 | 1.6 | 0.001 | 0.34 | |
| Min (all samples) | 3.95 | 244.6 | 82.20 | 8.96 | 1.336 | 5.84 | |
| Max (all samples) | 4.21 | 439.8 | 189.96 | 13.84 | 1.338 | 6.94 | |
| Royal jelly | RJ_G | 4.04 | 263.4 | 98.16 | 13.36 | 1.339 | 3.48 |
| RJ1_LT | 4.00 | 223.2 | 86.49 | 13.76 | 1.338 | 2.94 | |
| RJ2_LT | 3.57 | 230.2 | 83.48 | 12.24 | 1.337 | 3.46 | |
| RJ3_LT | 3.94 | 269.0 | 104.43 | 13.51 | 1.338 | 2.96 | |
| RJ4_LT | 3.95 | 222.8 | 94.27 | 14.56 | 1.339 | 3.44 | |
| RJ5_LT | 4.06 | 271.0 | 102.48 | 16.16 | 1.339 | 3.60 | |
| SD | 0.005 | 0.68 | 0.49 | 0.048 | 0.001 | 0.05 | |
| Descriptive statistics | Mean (LT) | 3.90 | 243 | 94.2 | 14.1 | 1.338 | 3.28 |
| SD (LT) | 0.19 | 25 | 9.3 | 1. 5 | 0.001 | 0.31 | |
| Mean (all samples) | 3.93 | 247 | 94.9 | 13.9 | 1.338 | 3.31 | |
| SD (all samples) | 0.18 | 24 | 8.5 | 1.3 | 0.001 | 0.29 | |
| Min (all samples) | 3.57 | 222.8 | 83.48 | 12.24 | 1.337 | 2.94 | |
| Max (all samples) | 4.06 | 271.0 | 104.43 | 16.16 | 1.339 | 3.60 |
| Sample | Total Phenolic Compounds Content, mg RUE/10 g | Total Flavonoid Content, mg RUE/10 g | Radical Scavenging Activity, mg RUE/10 g | |
|---|---|---|---|---|
| 1 | 2 | 3 | 4 | 5 |
| Bee pollen | BP_IT | 48.28 | 24.12 | 25.08 |
| BP_D | 49.27 | 25.17 | 21.77 | |
| BP_SW | 50.93 | 45.38 | 36.55 | |
| BP_SL | 43.56 | 34.51 | 21.73 | |
| BP_P | 49.00 | 40.06 | 27.48 | |
| BP1_LT | 50.68 | 42.93 | 30.69 | |
| BP2_LT | 50.85 | 29.26 | 27.76 | |
| BP3_LT | 44.70 | 10.68 | 16.27 | |
| BP4_LT | 55.04 | 46.85 | 27.20 | |
| BP5_LT | 33.14 | 21.29 | 23.06 | |
| BP6_LT | 41.66 | 10.82 | 16.29 | |
| BP1_LV | 51.12 | 42.51 | 33.43 | |
| BP2_LV | 53.84 | 48.31 | 39.40 | |
| BP_U | 39.03 | 22.21 | 17.69 | |
| BP_LTLV | 39.73 | 27.43 | 20.47 | |
| BP_ES | 53.29 | 30.68 | 39.40 | |
| BP_MT | 51.50 | 30.08 | 22.81 | |
| BP_NL | 44.43 | 38.39 | 34.29 | |
| SDa | 0.40 | 0.16 | 0.30 | |
| Descriptive statistics | Meanb (LT) | 46.0 | 27 | 23.5 |
| SD (LT)c | 7.9 | 15 | 6.1 | |
| Mean (all samples) | 47.2 | 32 | 26.7 | |
| SD (all samples)c | 6.0 | 12 | 7.5 | |
| Mind (all samples) | 33.14 | 10.68 | 16.27 | |
| Maxe (all samples) | 55.04 | 48.31 | 39.40 | |
| Beebread | BB1_LT | 21.85 | 10.33 | 20.14 |
| BB2_LT | 22.16 | 15.67 | 22.66 | |
| BB3_LT | 21.01 | 10.91 | 27.40 | |
| BB4_LT | 19.94 | 12.49 | 21.78 | |
| BB5_LT | 21.75 | 7.88 | 21.88 | |
| BB6_LT | 19.63 | 9.10 | 27.22 | |
| BB7_LT | 20.59 | 10.49 | 17.23 | |
| BB8_LT | 20.65 | 12.53 | 24.39 | |
| SD | 0.21 | 0.10 | 0.41 | |
| Descriptive statistics | Mean (LT) | 20.95 | 11.2 | 22.8 |
| SD (LT) | 0.92 | 2.4 | 3.5 | |
| Min (all samples) | 19.63 | 7.88 | 17.23 | |
| Max (all samples) | 22.16 | 15.67 | 27.40 | |
| Honey | H1_LT | 4.07 | 2.26 | 3.86 |
| H2_LT | 3.46 | 1.06 | 4.47 | |
| H3_LT | 3.68 | 1.98 | 2.22 | |
| H4_LT | 9.15 | 2.80 | 5.51 | |
| H5_LT | 7.03 | 5.22 | 3.77 | |
| H_IT | 3.43 | 0.91 | 2.73 | |
| H_G | 3.61 | 0.62 | 4.42 | |
| H6_LT | 10.18 | 3.99 | 8.26 | |
| H7_LT | 2.95 | 0.28 | 2.58 | |
| H8_LT | 7.58 | 2.29 | 3.03 | |
| H9_LT | 10.12 | 8.36 | 3.85 | |
| SD | 0.37 | 0.15 | 0.09 | |
| 1 | 2 | 3 | 4 | 5 |
| Descriptive statistics | Mean (LT) | 6.1 | 3.1 | 4.20 |
| SD (LT) | 3.1 | 2.4 | 1.74 | |
| Mean (all samples) | 5.6 | 3.6 | 4.06 | |
| SD (all samples) | 3.0 | 3.2 | 1.69 | |
| Min (all samples) | 2.95 | 0.28 | 2.17 | |
| Max (all samples) | 10.18 | 10.27 | 8.46 | |
| Propolis | P_P | 87.12 | 10.01 | 28.62 |
| P1_LT | 77.74 | 3.24 | 39.64 | |
| P2_LT | 68.03 | 5.92 | 25.37 | |
| P3_LT | 87.01 | 5.79 | 29.80 | |
| P4_LT | 92.74 | 9.67 | 31.78 | |
| P5_LT | 92.84 | 7.98 | 31.29 | |
| P6_LT | 80.81 | 6.58 | 19.69 | |
| P7_LT | 91.51 | 10.68 | 23.18 | |
| P8_LT | 99.85 | 9.26 | 22.10 | |
| P9_LT | 94.38 | 14.39 | 18.79 | |
| SD | 0.27 | 0.13 | 0.22 | |
| Descriptive statistics | Mean (LT) | 87.2 | 8.1 | 26.9 |
| SD (LT) | 9.9 | 3.3 | 6.8 | |
| Mean (all samples) | 87.2 | 8.4 | 27.0 | |
| SD (all samples) | 9.4 | 3.2 | 6.4 | |
| Min (all samples) | 68.03 | 3.24 | 18.79 | |
| Max (all samples) | 99.85 | 14.39 | 39.64 | |
| Royal jelly | RJ_G | 22.49 | 13.20 | 7.05 |
| RJ1_LT | 20.11 | 12.61 | 8.06 | |
| RJ2_LT | 16.44 | 10.34 | 5.16 | |
| RJ3_LT | 22.27 | 17.19 | 6.41 | |
| RJ4_LT | 23.14 | 16.31 | 7.61 | |
| RJ5_LT | 20.06 | 15.81 | 6.05 | |
| SD | 0.27 | 0.17 | 0.06 | |
| Descriptive statistics | Mean (LT) | 20.4 | 14.5 | 6.7 |
| SD (LT) | 2.6 | 2.9 | 1.2 | |
| Mean (all samples) | 20.8 | 14.2 | 6.7 | |
| SD (all samples) | 2.5 | 2.6 | 1.1 | |
| Min (all samples) | 16.44 | 10.34 | 5.16 | |
| Max (all samples) | 23.14 | 17.19 | 8.06 |
| Sample | Sample Code | P | K | Ca | Mg | Fe | Na | Mn | Zn | Cu | Sr | Cr | Co | Cd | Ba | Pb | Total Sum |
|---|---|---|---|---|---|---|---|---|---|---|---|---|---|---|---|---|---|
| 1 | 2 | 3 | 4 | 5 | 6 | 7 | 8 | 9 | 10 | 11 | 12 | 13 | 14 | 15 | 16 | 17 | 18 |
| Bee pollen | BP1_LT | 3543 | 3124 | 2455 | 721.1 | 56.8 | 37.9 | 26.4 | 21.5 | 1.59 | 5.37 | Nda | 0.026 | 0.072 | 0.775 | 0.269 | 9993 |
| BP2_LT | 4375 | 3305 | 1203 | 633.5 | 46.1 | 46.1 | 30.7 | 27.8 | Nd | 0.73 | Nd | 0.100 | 0.349 | 0.650 | 0.237 | 9669 | |
| BP3_LT | 3986 | 2941 | 1844 | 642.8 | 53.2 | 44.7 | 23.0 | 25.1 | 5.90 | 1.44 | Nd | 0.016 | 0.034 | 0.798 | 0.309 | 9569 | |
| BP4_LT | 4039 | 2995 | 1719 | 715.7 | 52.3 | 41.0 | 26.5 | 22.8 | 1.88 | 0.89 | Nd | 0.011 | 0.105 | 1.05 | 0.381 | 9615 | |
| BP5_LT | 4456 | 3444 | 1760 | 927.0 | 66.9 | 34.3 | 18.5 | 23.7 | Nd | 2.09 | Nd | 0.039 | 0.007 | 1.06 | 0.248 | 10735 | |
| BP6_LT | 4266 | 3474 | 1830 | 995.4 | 50.0 | 41.0 | 26.4 | 20.3 | Nd | 2.21 | Nd | Nd | 0.014 | 0.951 | 0.253 | 10707 | |
| BP_LTLV | 4192 | 3494 | 1821 | 1004 | 56.4 | 38.9 | 26.4 | 20.8 | 0.55 | 2.05 | Nd | 0.017 | 0.039 | 0.928 | 0.148 | 10657 | |
| BP1_LV | 4032 | 3423 | 1885 | 644.1 | 63.1 | 31.3 | 27.0 | 23.5 | 0.44 | 1.71 | Nd | 0.040 | 0.082 | 0.956 | 0.277 | 10132 | |
| BP2_LV | 3218 | 3013 | 1576 | 915 | 57.0 | 37.9 | 31.6 | 24.7 | 0.48 | 0.92 | Nd | 0.018 | 0.141 | 0.896 | 0.197 | 8875 | |
| BP_IT | 2865 | 2766 | 1506 | 796.6 | 64.2 | 99.8 | 33.5 | 25.5 | 2.70 | 1.73 | Nd | 0.080 | 0.025 | 1.59 | 0.227 | 8164 | |
| BP_D | 3746 | 2947 | 1932 | 746.9 | 45.7 | 46.3 | 18.1 | 22.3 | 4.28 | 1.04 | Nd | Nd | 0.037 | 0.431 | 0.138 | 9510 | |
| BP_SW | 3460 | 2748 | 1768 | 837.7 | 53.5 | 37.7 | 29.6 | 23.3 | 1.41 | 0.99 | Nd | Nd | 0.112 | 0.903 | 0.249 | 8960 | |
| BP_SL | 2820 | 2400 | 997 | 644.1 | 76.2 | 39.0 | 18.2 | 28.7 | 2.31 | 1.67 | Nd | 0.022 | 0.065 | 0.946 | 0.211 | 7028 | |
| BP_P | 4841 | 3750 | 1487 | 881 | 53.6 | 24.5 | 66.3 | 31.7 | nd | 1.93 | Nd | 0.097 | 0.223 | 1.108 | 0.341 | 11139 | |
| BP_U | 3028 | 2682 | 1668 | 731.8 | 51.9 | 26.4 | 15.4 | 22.1 | 5.49 | 2.23 | Nd | 0.023 | 0.018 | 2.01 | 0.215 | 8235 | |
| SDb | 22 | 11 | 8.9 | 5.9 | 0.45 | 1.8 | 0.30 | 0.24 | 0.15 | 0.071 | 0.004 | 0.006 | 0.034 | 0.013 | 28 | ||
| Descriptive statistics | Meanc (LT) | 3976 | 3131 | 1674 | 778 | 56.5 | 38.3 | 30 | 25.0 | 1.5 | 1.9 | 0.035 | 0.11 | 0.91 | 0.278 | 9713 | |
| SD (LT)d | 591 | 397 | 401 | 131 | 9.0 | 6.3 | 14 | 3.6 | 1.8 | 1.4 | 0.037 | 0.11 | 0.15 | 0.053 | 1175 | ||
| Mean (all samples) | 3791 | 3100 | 1697 | 789 | 56.5 | 42 | 28 | 24.3 | 1.8 | 1.8 | 0.033 | 0.088 | 1.00 | 0.247 | 9532 | ||
| SD (all samples)d | 602 | 365 | 326 | 127 | 8.0 | 17 | 12 | 3.1 | 2.0 | 1.1 | 0.033 | 0.091 | 0.37 | 0.065 | 1104 | ||
| Mine (all samples) | 2805 | 2395 | 996 | 625 | 45.04 | 23.84 | 15.34 | 20.04 | 0.00 | 0.64 | 0.000 | 0.006 | 0.40 | 0.117 | 7009 | ||
| Maxf (all samples) | 4845 | 3759 | 2475 | 1009 | 76.40 | 100.26 | 66.49 | 31.99 | 6.05 | 5.63 | 0.105 | 0.370 | 2.02 | 0.391 | 11155 | ||
| 1 | 2 | 3 | 4 | 5 | 6 | 7 | 8 | 9 | 10 | 11 | 12 | 13 | 14 | 15 | 16 | 17 | 18 |
| Beebread | BB1_LT | 3349 | 1489 | 612 | 316.3 | 67.7 | 25.5 | 28.4 | 26.7 | 10.4 | Nd | 0.48 | Nd | 0.040 | 8.17 | 0.243 | 5933 |
| BB2_LT | 2968 | 457 | 501 | 342.2 | 59.7 | 31.7 | 35.6 | 28.9 | 16.7 | Nd | 0.76 | Nd | 0.055 | Nd | 0.433 | 4442 | |
| BB3_LT | 2812 | 547 | 567 | 314 | 72.9 | 32.3 | 20.7 | 21.8 | 10.6 | Nd | 0.77 | Nd | 0.033 | Nd | 0.309 | 4399 | |
| BB4_LT | 1900 | 1154 | 597 | 316 | 41.4 | 27.7 | 7.2 | 17.4 | 7.3 | Nd | 0.35 | Nd | 0.016 | Nd | 0.235 | 4068 | |
| BB5_LT | 1796 | 946 | 548.7 | 409.1 | 48.2 | 24.2 | 10.8 | 13.5 | 6.6 | Nd | 0.47 | Nd | 0.018 | Nd | 0.147 | 3803 | |
| BB6_LT | 1615 | 933 | 566.1 | 343 | 53.9 | 24.6 | 11.0 | 13.9 | 5.6 | Nd | 0.43 | Nd | 0.018 | Nd | 0.150 | 3567 | |
| BB7_LT | 1363 | 2171 | 504.0 | 374.5 | 25.1 | 24.6 | 9.3 | 11.5 | 4.8 | Nd | 0.20 | Nd | 0.014 | Nd | 0.096 | 4488 | |
| BB8_LT | 2318 | 1434 | 572 | 342.1 | 40.5 | 33.0 | 29.1 | 42.7 | 8.2 | Nd | 0.33 | Nd | 0.033 | Nd | 0.192 | 4820 | |
| SD | 121 | 66 | 8.7 | 7.9 | 2.9 | 1.7 | 1.4 | 1.1 | 1.1 | 0.041 | 0.003 | 1.1 | 0.020 | 140 | |||
| Descriptive statistics | Mean (all samples) | 2265 | 1142 | 558 | 345 | 51 | 28.0 | 19 | 22 | 8.8 | 0.5 | 0.028 | 1.0 | 0.23 | 4440 | ||
| SD (all samples) | 692 | 536 | 39 | 33 | 15 | 4.0 | 11 | 10 | 3.8 | 0.2 | 0.014 | 2.8 | 0.10 | 707 | |||
| min (all samples) | 1270 | 430 | 493 | 300 | 22.92 | 22.68 | 6.72 | 10.78 | 4.40 | 0.187 | 0.012 | 0.00 | 0.081 | 3490 | |||
| max (all samples) | 3432 | 2288 | 619 | 416 | 77.64 | 34.34 | 39.38 | 43.70 | 19.42 | 0.849 | 0.061 | 9.18 | 0.468 | 6091 | |||
| Royal jelly | RJ1_LT | 1760 | 2438 | 215 | 446 | 9.33 | 203 | Nd | 18.3 | 8.92 | Nd | 0.22 | Nd | 0.002 | Nd | 0.278 | 5098 |
| RJ2_LT | 1743 | 2434 | 269 | 502 | 6.80 | 270 | Nd | 19.7 | 9.25 | Nd | 0.21 | Nd | 0.003 | Nd | 0.452 | 5255 | |
| RJ3_LT | 1805 | 2212 | 132.5 | 434 | 8.64 | 212.9 | Nd | 19.7 | 7.78 | Nd | 0.22 | Nd | 0.001 | Nd | 0.205 | 4833 | |
| RJ4_LT | 1558 | 2188 | 141.0 | 387 | 8.93 | 207.6 | Nd | 18.1 | 7.51 | Nd | 0.23 | Nd | 0.002 | Nd | 0.368 | 4517 | |
| RJ5_LT | 1759 | 2322 | 220 | 436 | 7.74 | 246 | Nd | 18.6 | 9.81 | Nd | 0.27 | Nd | 0.002 | Nd | 0.290 | 5020 | |
| RJ_G | 2246 | 3130 | 215.2 | 581 | 12.41 | 268.0 | Nd | 24.1 | 11.10 | Nd | 0.28 | Nd | 0.002 | Nd | 0.418 | 6488 | |
| SD | 45 | 22 | 8.6 | 14 | 0.49 | 8.1 | 0.56 | 0.38 | 0.015 | 0.000 | 0.036 | 84 | |||||
| Descriptive statistics | Mean (LT) | 1725 | 2319 | 195 | 441 | 8.29 | 228 | 18.89 | 8.65 | 0.228 | 0.002 | 0.318 | 4945 | ||||
| SD (LT) | 101 | 112 | 54 | 41 | 1.05 | 28 | 0.91 | 0.95 | 0.025 | 0.001 | 0.096 | 277 | |||||
| Mean (all samples) | 1812 | 2454 | 199 | 464 | 9.0 | 235 | 19.8 | 9.06 | 0.237 | 0.002 | 0.335 | 5202 | |||||
| SD (all samples) | 220 | 327 | 50 | 65 | 1.9 | 30 | 2.1 | 1.30 | 0.032 | 0.001 | 0.095 | 643 | |||||
| min (all samples) | 1538.2 | 2165.4 | 127.1 | 381.6 | 6.31 | 194.2 | 17.33 | 7.24 | 0.209 | 0.001 | 0.189 | 4507 | |||||
| max (all samples) | 2266.0 | 3147.2 | 279.7 | 596.9 | 13.07 | 277.6 | 24.54 | 11.78 | 0.308 | 0.004 | 0.480 | 6530 | |||||
| 1 | 2 | 3 | 4 | 5 | 6 | 7 | 8 | 9 | 10 | 11 | 12 | 13 | 14 | 15 | 16 | 17 | 18 |
| Honey | H1_LT | 109.3 | 556 | 52.2 | 27.2 | 1.24 | 13.2 | Nd | 1.63 | 1.84 | Nd | 0.18 | Nd | Nd | Nd | 0.257 | 763 |
| H2_LT | 31.2 | 87.0 | 23.2 | 9.0 | 0.58 | 14.1 | Nd | 1.71 | 1.15 | Nd | 0.22 | Nd | Nd | Nd | 0.235 | 168 | |
| H3_LT | 79.2 | 120.7 | 31.2 | 15.4 | 1.58 | 12.8 | 1.08 | 1.63 | 2.03 | Nd | 0.54 | Nd | Nd | Nd | 0.138 | 2665 | |
| H4_LT | 57.3 | 271.3 | 25.6 | 11.4 | 1.24 | 10.9 | 0.77 | 2.89 | 1.70 | Nd | 0.24 | Nd | Nd | Nd | 0.217 | 383 | |
| H5_LT | 47.4 | 338.7 | 27.6 | 12.6 | 1.29 | 8.29 | Nd | 1.85 | 1.16 | Nd | 0.36 | Nd | Nd | Nd | 0.233 | 439 | |
| H6_LT | 126.1 | 82.2 | 19.6 | 13.2 | 1.09 | 11.7 | Nd | 5.15 | 1.72 | Nd | 0.47 | Nd | Nd | Nd | 0.218 | 261 | |
| H7_LT | 81.0 | 34.6 | 28.3 | 12.8 | 1.63 | 11.9 | 0.17 | 1.87 | 1.08 | Nd | 0.63 | Nd | Nd | Nd | 0.075 | 174 | |
| H8_LT | 102.9 | 125.8 | 25.3 | 12.7 | 1.36 | 11.4 | Nd | 1.08 | 1.10 | Nd | 0.29 | Nd | Nd | Nd | 0.192 | 282 | |
| H9_LT | 98.9 | 66.9 | 34.5 | 11.8 | 0.77 | 10.5 | Nd | 2.43 | 1.03 | Nd | 0.28 | Nd | Nd | Nd | 0.234 | 227 | |
| H_S | 39.7 | 168.8 | 26.1 | 8.17 | 0.43 | 19.6 | Nd | 2.03 | 1.98 | Nd | 0.11 | Nd | Nd | Nd | 0.171 | 267 | |
| H_G | 22.9 | 160.3 | 19.1 | 7.79 | 1.02 | 29.8 | Nd | 2.18 | 2.51 | Nd | 0.15 | Nd | Nd | Nd | 0.219 | 246 | |
| SD | 2.9 | 4.3 | 1.5 | 0.53 | 0.09 | 0.75 | 0.06 | 0.15 | 0.13 | 0.017 | 0.023 | 7.0 | |||||
| Descriptive statistics | Mean (LT) | 82 | 187 | 29.7 | 14.0 | 1.20 | 11.6 | 0.23 | 2.3 | 1.42 | 0.36 | 0.200 | 329 | ||||
| SD (LT) | 30 | 164 | 9.2 | 5.0 | 0.34 | 1.8 | 0.40 | 1.2 | 0.39 | 0.15 | 0.059 | 178 | |||||
| Mean (all samples) | 72 | 183 | 28.4 | 12.9 | 1.11 | 14.0 | 0.18 | 2.22 | 1.57 | 0.32 | 0.199 | 316 | |||||
| SD (all samples) | 34 | 148 | 8.9 | 5.1 | 0.38 | 5.8 | 0.37 | 1.05 | 0.50 | 0.16 | 0.056 | 163 | |||||
| min (all samples) | 21.4 | 34.6 | 17.9 | 7.2 | 0.379 | 7.28 | 0.000 | 1.04 | 0.99 | 0.090 | 0.069 | 165 | |||||
| max (all samples) | 130.6 | 565.2 | 54.0 | 28.2 | 1.720 | 30.63 | 1.161 | 5.29 | 2.93 | 0.655 | 0.292 | 780 | |||||
| Propolis | P1_LT | 512 | 495 | 542 | 96.4 | 301.4 | 155.1 | 25.1 | 40.1 | 11.50 | Nd | 4.35 | Nd | 0.026 | 3.02 | 3.49 | 2190 |
| P2_LT | 369 | 429 | 248 | 69.1 | 274.3 | 41.9 | 24.2 | 38.7 | 6.85 | Nd | 12.13 | Nd | 0.037 | 8.13 | 7.24 | 1528 | |
| P3_LT | 375 | 252 | 235 | 31.0 | 252.5 | 36.1 | 16.5 | 102.1 | 2.36 | Nd | 5.39 | Nd | 0.012 | 9.59 | 9.49 | 1326 | |
| P4_LT | 358 | 545 | 476 | 98.4 | 304.5 | 124.5 | 15.0 | 31.9 | 3.01 | Nd | 4.73 | Nd | 0.040 | 9.29 | 5.84 | 1976 | |
| P5_LT | 393 | 360 | 405 | 83.4 | 234.2 | 26.9 | 23.3 | 40.8 | 14.31 | Nd | 11.13 | Nd | 0.041 | 10.20 | 5.31 | 1607 | |
| P_P | 244 | 242 | 254 | 69.3 | 245 | 28.2 | 28.8 | 52.4 | 8.53 | Nd | 4.32 | Nd | 0.072 | 8.61 | 4.60 | 1190 | |
| SD | 11 | 11 | 15 | 5.0 | 7.6 | 2.4 | 1.6 | 2.7 | 0.48 | 0.36 | 0.003 | 0.55 | 0.19 | 34 | |||
| Descriptive statistics | Mean (LT) | 401 | 416 | 381 | 76 | 273 | 76 | 20.8 | 50.7 | 7.6 | 7.5 | 0.032 | 8.1 | 6.3 | 1726 | ||
| SD (LT) | 60 | 108 | 127 | 26 | 29 | 54 | 4.6 | 26.9 | 4.9 | 3.5 | 0.013 | 2.8 | 2.1 | 326 | |||
| Mean (all samples) | 375 | 387 | 360 | 75 | 269 | 69 | 22.2 | 51 | 7.8 | 7.0 | 0.039 | 8.1 | 6.0 | 1636 | |||
| SD (all samples) | 81 | 118 | 125 | 24 | 29 | 53 | 5.2 | 24 | 4.4 | 3.4 | 0.019 | 2.5 | 2.0 | 360 | |||
| min (all samples) | 233.7 | 235.2 | 216.5 | 27.2 | 226.4 | 24.61 | 14.39 | 30.06 | 2.18 | 3.88 | 0.010 | 2.87 | 3.21 | 1168 | |||
| max (all samples) | 517.7 | 557.7 | 552.1 | 104.0 | 309.2 | 158.10 | 31.26 | 107.50 | 14.72 | 12.19 | 0.075 | 10.77 | 9.69 | 2203 |
© 2019 by the authors. Licensee MDPI, Basel, Switzerland. This article is an open access article distributed under the terms and conditions of the Creative Commons Attribution (CC BY) license (http://creativecommons.org/licenses/by/4.0/).
Share and Cite
Adaškevičiūtė, V.; Kaškonienė, V.; Kaškonas, P.; Barčauskaitė, K.; Maruška, A. Comparison of Physicochemical Properties of Bee Pollen with Other Bee Products. Biomolecules 2019, 9, 819. https://doi.org/10.3390/biom9120819
Adaškevičiūtė V, Kaškonienė V, Kaškonas P, Barčauskaitė K, Maruška A. Comparison of Physicochemical Properties of Bee Pollen with Other Bee Products. Biomolecules. 2019; 9(12):819. https://doi.org/10.3390/biom9120819
Chicago/Turabian StyleAdaškevičiūtė, Vaida, Vilma Kaškonienė, Paulius Kaškonas, Karolina Barčauskaitė, and Audrius Maruška. 2019. "Comparison of Physicochemical Properties of Bee Pollen with Other Bee Products" Biomolecules 9, no. 12: 819. https://doi.org/10.3390/biom9120819
APA StyleAdaškevičiūtė, V., Kaškonienė, V., Kaškonas, P., Barčauskaitė, K., & Maruška, A. (2019). Comparison of Physicochemical Properties of Bee Pollen with Other Bee Products. Biomolecules, 9(12), 819. https://doi.org/10.3390/biom9120819