Article

Iron X-ray Transmission at Temperature Near 150 eV Using the National Ignition Facility: First Measurements and Paths to Uncertainty Reduction

by
Robert Heeter
1,*,
Ted Perry
2,
Heather Johns
2,
Kathy Opachich
3,
Maryum Ahmed
1,
Jim Emig
1,
Joe Holder
1,
Carlos Iglesias
1,
Duane Liedahl
1,
Richard London
1,
Madison Martin
1,
Nathaniel Thompson
1,
Brian Wilson
1,
Tom Archuleta
2,
Tana Cardenas
2,
Evan Dodd
2,
Melissa Douglas
2,
Kirk Flippo
2,
Christopher Fontes
2,
John Kline
2,
Lynn Kot
2,
Natalia Krasheninnikova
2,
Manolo Sherrill
2,
Todd Urbatsch
2,
Eric Huffman
3,
James King
3,
Russell Knight
3,
James Bailey
4 and
Gregory Rochau
4
add Show full author list remove Hide full author list
1
Lawrence Livermore National Laboratory (LLNL), 7000 East Avenue, Livermore, CA 94550, USA
2
Los Alamos National Laboratory (LANL), Bikini Atoll Road, Los Alamos, NM 87545, USA
3
Nevada National Security Site (NNSS), 161 S. Vasco Avenue, Livermore, CA 94550, USA
4
Sandia National Laboratories (Sandia), 1515 Eubank SE, Albuquerque, NM 87185, USA
*
Author to whom correspondence should be addressed.
Atoms 2018, 6(4), 57; https://doi.org/10.3390/atoms6040057
Submission received: 29 August 2018 / Revised: 11 October 2018 / Accepted: 13 October 2018 / Published: 26 October 2018
(This article belongs to the Special Issue Atomic and Molecular Opacity Data for Astrophysics)

Abstract

:
Discrepancies exist between theoretical and experimental opacity data for iron, at temperatures 180–195 eV and electron densities near 3 × 10²²/cm3, relevant to the solar radiative-convective boundary. Another discrepancy, between theory and helioseismic measurements of the boundary’s location, would be ameliorated if the experimental opacity is correct. To address these issues, this paper details the first results from new experiments under development at the National Ignition Facility (NIF), using a different method to replicate the prior experimental conditions. In the NIF experiments, 64 laser beams indirectly heat a plastic-tamped rectangular iron-magnesium sample inside a gold cavity. Another 64 beams implode a spherical plastic shell to produce a continuum X-ray flash which backlights the hot sample. An X-ray spectrometer records the transmitted X-rays, the unattenuated X-rays passing around the sample, and the sample’s self-emission. From these data, X-ray transmission spectra are inferred, showing Mg K-shell and Fe L-shell X-ray transitions from plasma at a temperature of ~150 eV and electron density of ~8 × 10²¹/cm3. These conditions are similar to prior Z measurements which agree better with theory. The NIF transmission data show statistical uncertainties of 2–10%, but various systematic uncertainties must be addressed before pursuing quantitative comparisons. The paths to reduction of the largest uncertainties are discussed. Once the uncertainty is reduced, future NIF experiments will probe higher temperatures (170–200 eV) to address the ongoing disagreement between theory and Z data.

Graphical Abstract

1. Introduction

In recent years, opacity experiments carried out at Sandia National Laboratories’ Z facility have studied X-ray propagation through high-energy-density plasmas at temperature, density, and ionization conditions relevant to the radiative-convective boundary of the Sun [1,2]. An initial set of Z experiments using iron plasmas at a temperature of 156 eV and electron density of 7 × 10²¹/cm3 were in good agreement with current theory [1], as are more recent experiments at 165 eV [2]. However, the most recent, higher temperature (180–195 eV), and higher electron density (3–4 × 10²²/cm3) experimental results at Z diverge significantly from theory [2]. Specifically, the Z measurements show higher continuum opacity than predicted, and different line shapes and strengths as well. Several years’ research by various teams into possible systematic errors in the experiment or inadequate approximations in various opacity theories have not resolved the disagreement. To address this divergence, an entirely different opacity experimental ‘platform’ has been developed [3,4] on the National Ignition Facility (NIF) laser system [5,6]. The current goal of the NIF campaign is to independently replicate the Z measurements at 156 eV, including quantification of the uncertainties, to validate the NIF platform. The next goal is then to repeat the Z measurements at 180–195 eV to discriminate between the Z data and various models. The purpose of this paper is to document the initial implementation of the NIF experiment, present the first transmission data, and illustrate current limitations of the experiment on the path to validating the platform. This paper specifically presents data from a single NIF shot, comprising the first complete NIF X-ray transmission measurement, and begins the challenging task of assessing the experimental uncertainties. This paper assesses and quantifies the primary sources of statistical uncertainty. It also identifies various sources of systematic uncertainty and identifies paths to quantify and eventually reduce them in future NIF experiments.

1.1. Structure of the Paper

The remainder of Section 1 introduces the experiment and the current measurements. Section 2 presents the principal results, including current understanding of plasma composition, density, temperature, and transmission spectra. Section 3 discusses the results in context of other work. Section 4 details the method used to produce the transmission spectra. Section 5 reviews and quantifies sources of statistical uncertainty. Section 6 begins the essential process of identifying and quantifying sources of systematic uncertainty. Section 7 draws summarizes and discusses future work.

1.2. Introduction to the NIF Opacity Experiment

Figure 1 (left) illustrates the experimental approach used at NIF [3,4]. Opacity experiments have many detailed requirements [7,8], but the heart of the measurement is a fully calibrated X-ray transmission spectrum obtained through a uniform sample with known composition, areal density, electron density, and temperature. The center of the NIF experiment is a ‘McFee–Apollo’ shaped gold hohlraum [4,9,10] containing a 12-micron thick plastic foil on the midplane, as illustrated in Figure 1 (right). Embedded in the 4 mm diameter parylene-N plastic foil is a rectangular 1.0 × 2.0 mm patch of co-deposited iron and magnesium [10]. The experiment uses 64 beams of NIF to heat the hohlraum: 32 from above, 32 from below, all incident at ~45° to the hohlraum axis. The beams use the pulse shapes shown in Figure 2, delivering a total of 225 kJ of 3ω laser light. The lasers propagate into the pocketed outer rings of the hohlraum end-cavities, heating the interior walls and causing X-rays to be re-emitted. The X-rays heat the walls and then indirectly heat the sample.
Note that in Figure 2, the laser drive is higher from the bottom, to balance out X-ray losses through the larger lower laser entrance hole of the slightly conical hohlraum. The hohlraum interior is tapered along a cone with 3° half-angle. This ensures that the spectrometer cannot see the hot gold walls, whose X-ray emission would add undesirable backgrounds to the spectra [9]. Five separate hohlraum designs were tested before the McFee–Apollo concept succeeded in providing sufficiently low X-ray backgrounds for axial absorption spectroscopy of the sample. Further details about the hohlraum design, fabrication, and modeling are available [4,9,10].
To create a bright, point-like short-duration backlighter, a 2 mm diameter, 20-micron thick polystyrene (CH) spherical shell is separately imploded by another 64 NIF beams incident at 23° and 30° to the target axis. This hollow capsule backlighter is positioned 31 mm below the sample, as shown at bottom of Figure 1 (left). The pulse for these beams starts 1.5 ns after the hohlraum drive begins and delivers a total of 200 kJ of laser energy over 2.5 ns. Stagnation of the imploding shell material at the center of the shell produces a ~350 ps duration flash of X-rays, in a broad continuum with a total X-ray yield of around 14 kJ [11]. Plastic is chosen as the sole material in the backlighter to ensure a smooth continuum with no spectral line structure for X-ray energies >600 eV.
The backlighter X-ray flash passes through a 750 × 1200-micron rectangular slot in a silicon-copper-silicon layered collimator, and then transits the hohlraum by passing either through or around the rectangular sample [3]. The resulting backlighter and absorption spectra are projected into the NIF opacity spectrometer (OpSpec), an open-aperture time-integrated crystal spectrometer [12,13] pointed downward from the upper pole of the NIF target chamber. Inside OpSpec the X-rays propagate through three aluminized-plastic X-ray filters, Bragg-diffract off one of two convex rubidium acid phthalate (RbAP) crystals, then propagate past three more aluminized-plastic filters before being absorbed by one of two adjacent Fuji BAS-TR X-ray imaging plates [12,13]. After recent improvements [13] the spectrometer recently delivered the first analyzable transmission data [14].
The shot reported here extends the prior NIF shots [14] by increasing the peak hohlraum laser by 25%, to better approach the conditions of the prior Z experiments [1]. In 2-D LASNEX simulations of these targets, the sample is heated to 150–160 eV by the hohlraum X-ray drive. In addition, this shot improves the sample characterization measurements. The X-ray transmission analysis, including uncertainty assessment, has also been refined compared to the prior work.

1.3. Introduction to the Measurements on NIF Shot N171214-001

This type of opacity experiment requires the accurate measurement of X-ray transmission through a sample of known areal density at known density and temperature [3,7,8]. The areal density is measured prior to shot as detailed in Section 2. For temperature and density, both NIF and Z use the magnesium present in the sample. Temperature in the 150–200 eV regime may be inferred from the strengths of the Lyman transitions in H-like Mg ions relative to the dominant transitions in He-like Mg ions, while density may be inferred from Stark broadening of the Mg He-gamma and -delta lines [8,15]. However, a systematic error in either measurement would skew the comparison of the transmission data with theory, so more constraints are desired. On NIF, two additional measurements are used which are independent of the X-ray transmission measurement. Eventually these are expected to cross-check the Mg K-shell diagnostics used on the Z experiments.
First, as shown in Figure 1 (right), the target has been modified from the prior experiment [4,14] so that it is now possible to directly view the hohlraum radiation temperature near the sample. To support this measurement, which was performed for the first time on this shot, shields have been added to block the diagnostic (DANTE-2) from detecting emission from the plasma in and near the laser entrance cavities. This measurement is independent of K-shell spectroscopy, but it depends on radiation-hydrodynamic models of the measured radiation flux emitted through the viewing hole, versus the flux at the nearby sample.
Second, as shown in Figure 3, the midplane viewing slot (the same one as viewed by DANTE-2), together with a second slot on the opposite side, provides a clear line of sight for a gated X-ray imager to measure the expansion of the heated iron-magnesium sample over time. From the measured initial areal density, and the measured expansion, the plasma density at the time of the measurement can be inferred; this is also discussed in Section 2. This expansion method is currently the primary density measurement on NIF; a detailed analysis of the Stark broadening at NIF will subsequently be benchmarked against the expansion measurement.
The X-ray transmission measurement itself is produced using point-projection X-ray spectroscopy as illustrated in Figure 1 (left), following previous design and implementation work [3,7]. Specific details of the opacity spectrometer (OpSpec) setup for shot N171214-001 are given below, but in brief the underlying symmetry of the experimental platform enables OpSpec to record two sets of spectra per shot, one per image plate, with each side of the spectrometer observing half of the sample in transmission, together with the backlighter spectrum passing around the sample on one side [3,12,13]. The two image plate detectors each record spectra from ~1000 to 2000 eV in one dimension, spatially resolving the spectra from the sample absorption (region U), backlighter (region V), sample self-emission (region E), and various instrument backgrounds in the other dimension. After correcting for the backgrounds, which is non-trivial as discussed in Section 4, the X-ray transmission, T, can be extracted from the data using the formula T = (U − E)/(V − E).
The U-V-E notation follows [3] and is illustrated in Figure 4, which shows a survey rendering of the two image plates from NIF shot N171214-001. The images reproduce the configuration of the two image plates in the actual spectrometer, including the 2 mm gap between the plates. On the middle plot in Figure 4, the regions U, V, and E are labeled and outlined with dashed bands. A similar method was used on the upper plot, but for clarity the bands are not marked. The absorption of the sample is clearly visible as a prominent reduction in signal down the middle of both images. The lower image in Figure 4 enlarges the most prominent absorption features and provides a higher-contrast grayscale. In the upper and middle images, the signal drop-off near x = 65 mm is the X-ray attenuation from the K-edge of the aluminum layers in the X-ray filters. The OpSpec filter stack on this shot included six layers containing a total of 0.9 microns of Al, 1.4 microns of polyimide and 1.4 microns of Mylar.

2. Results

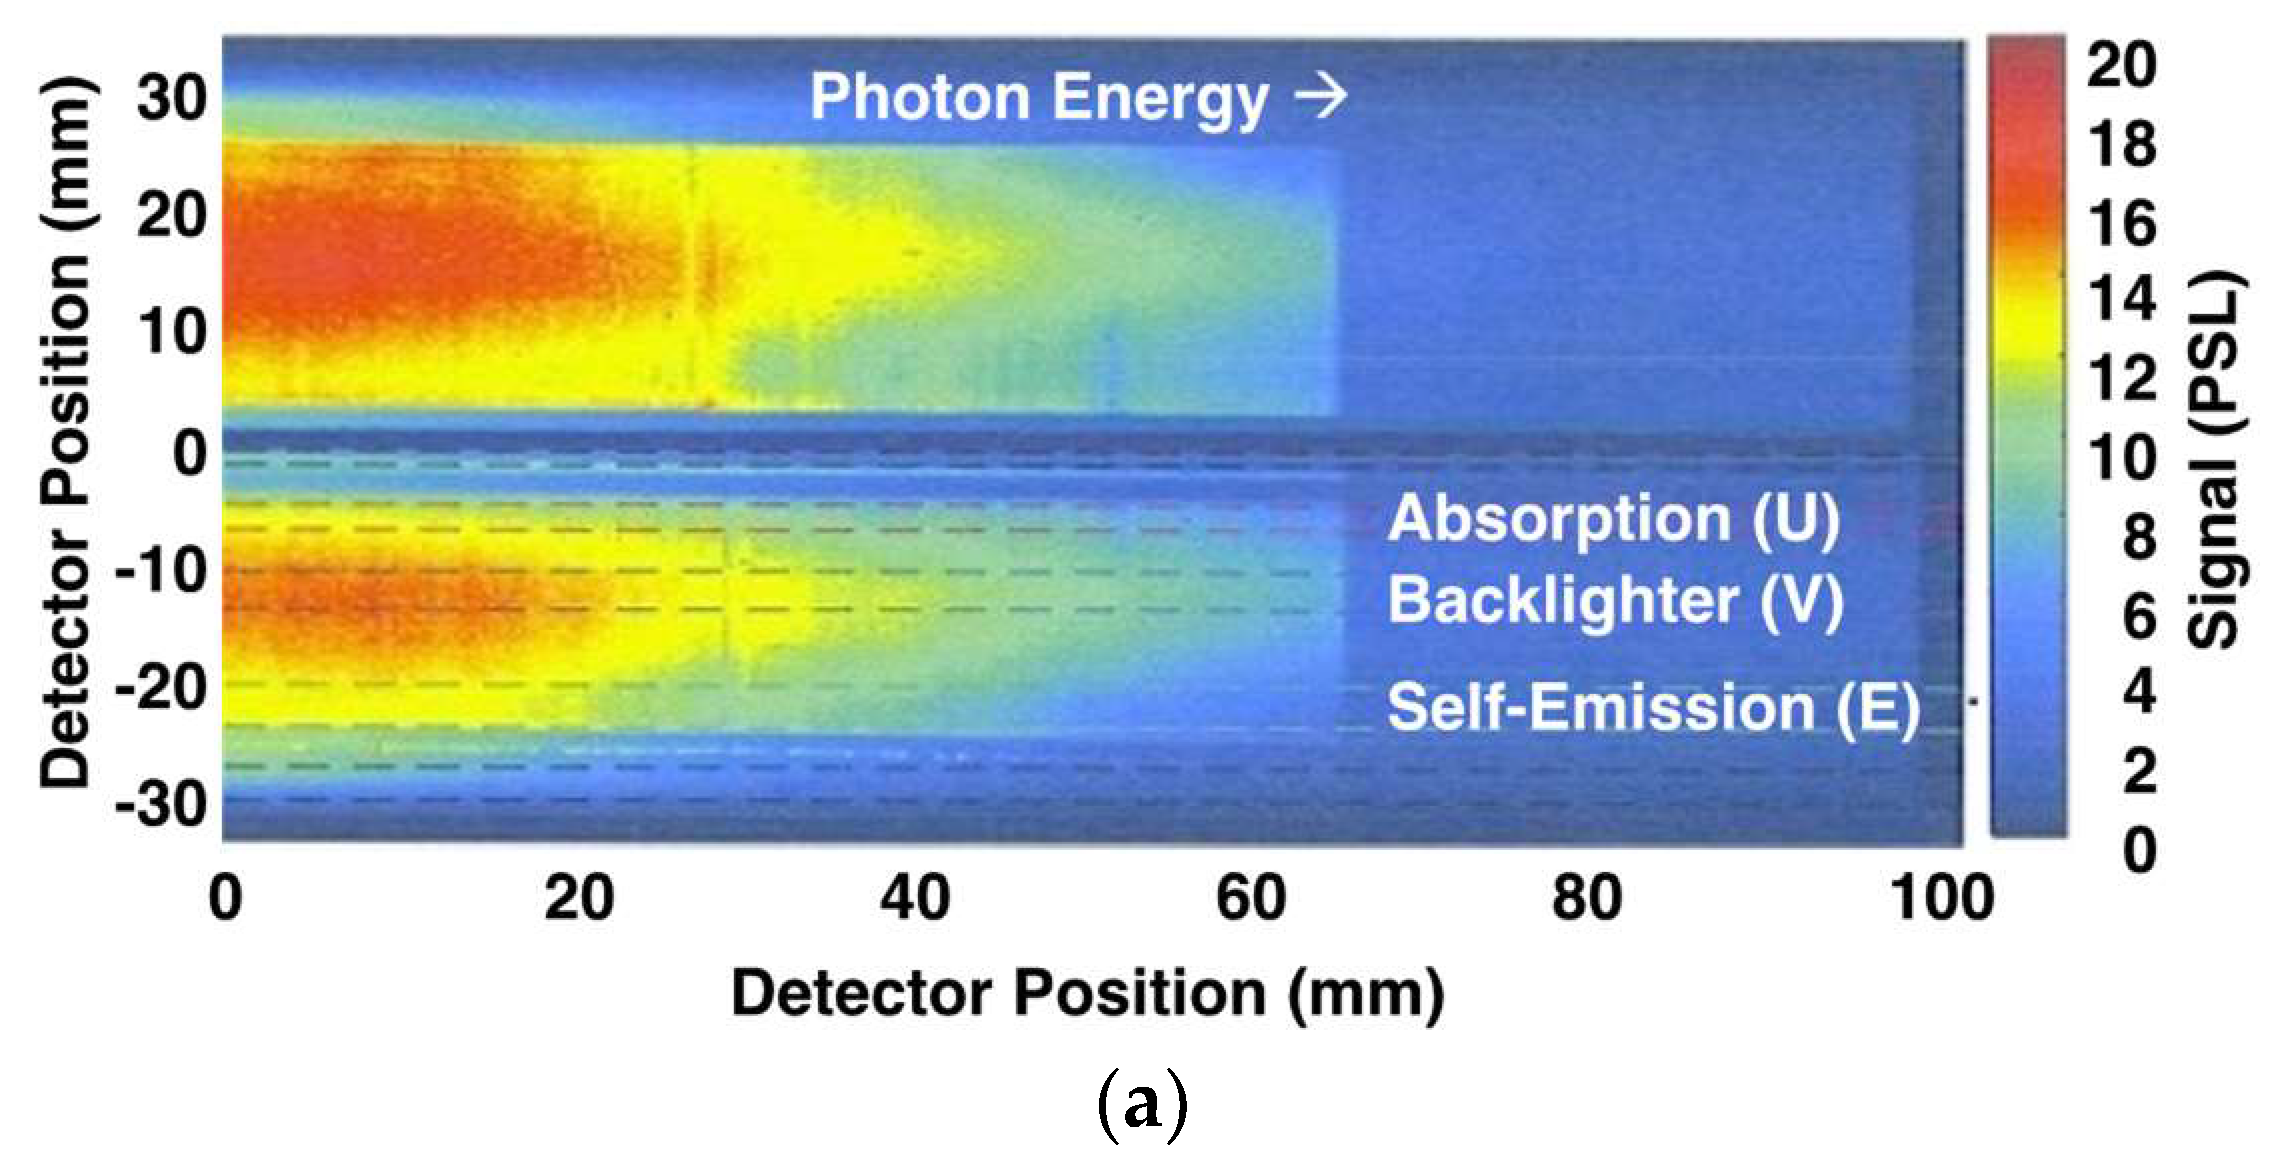
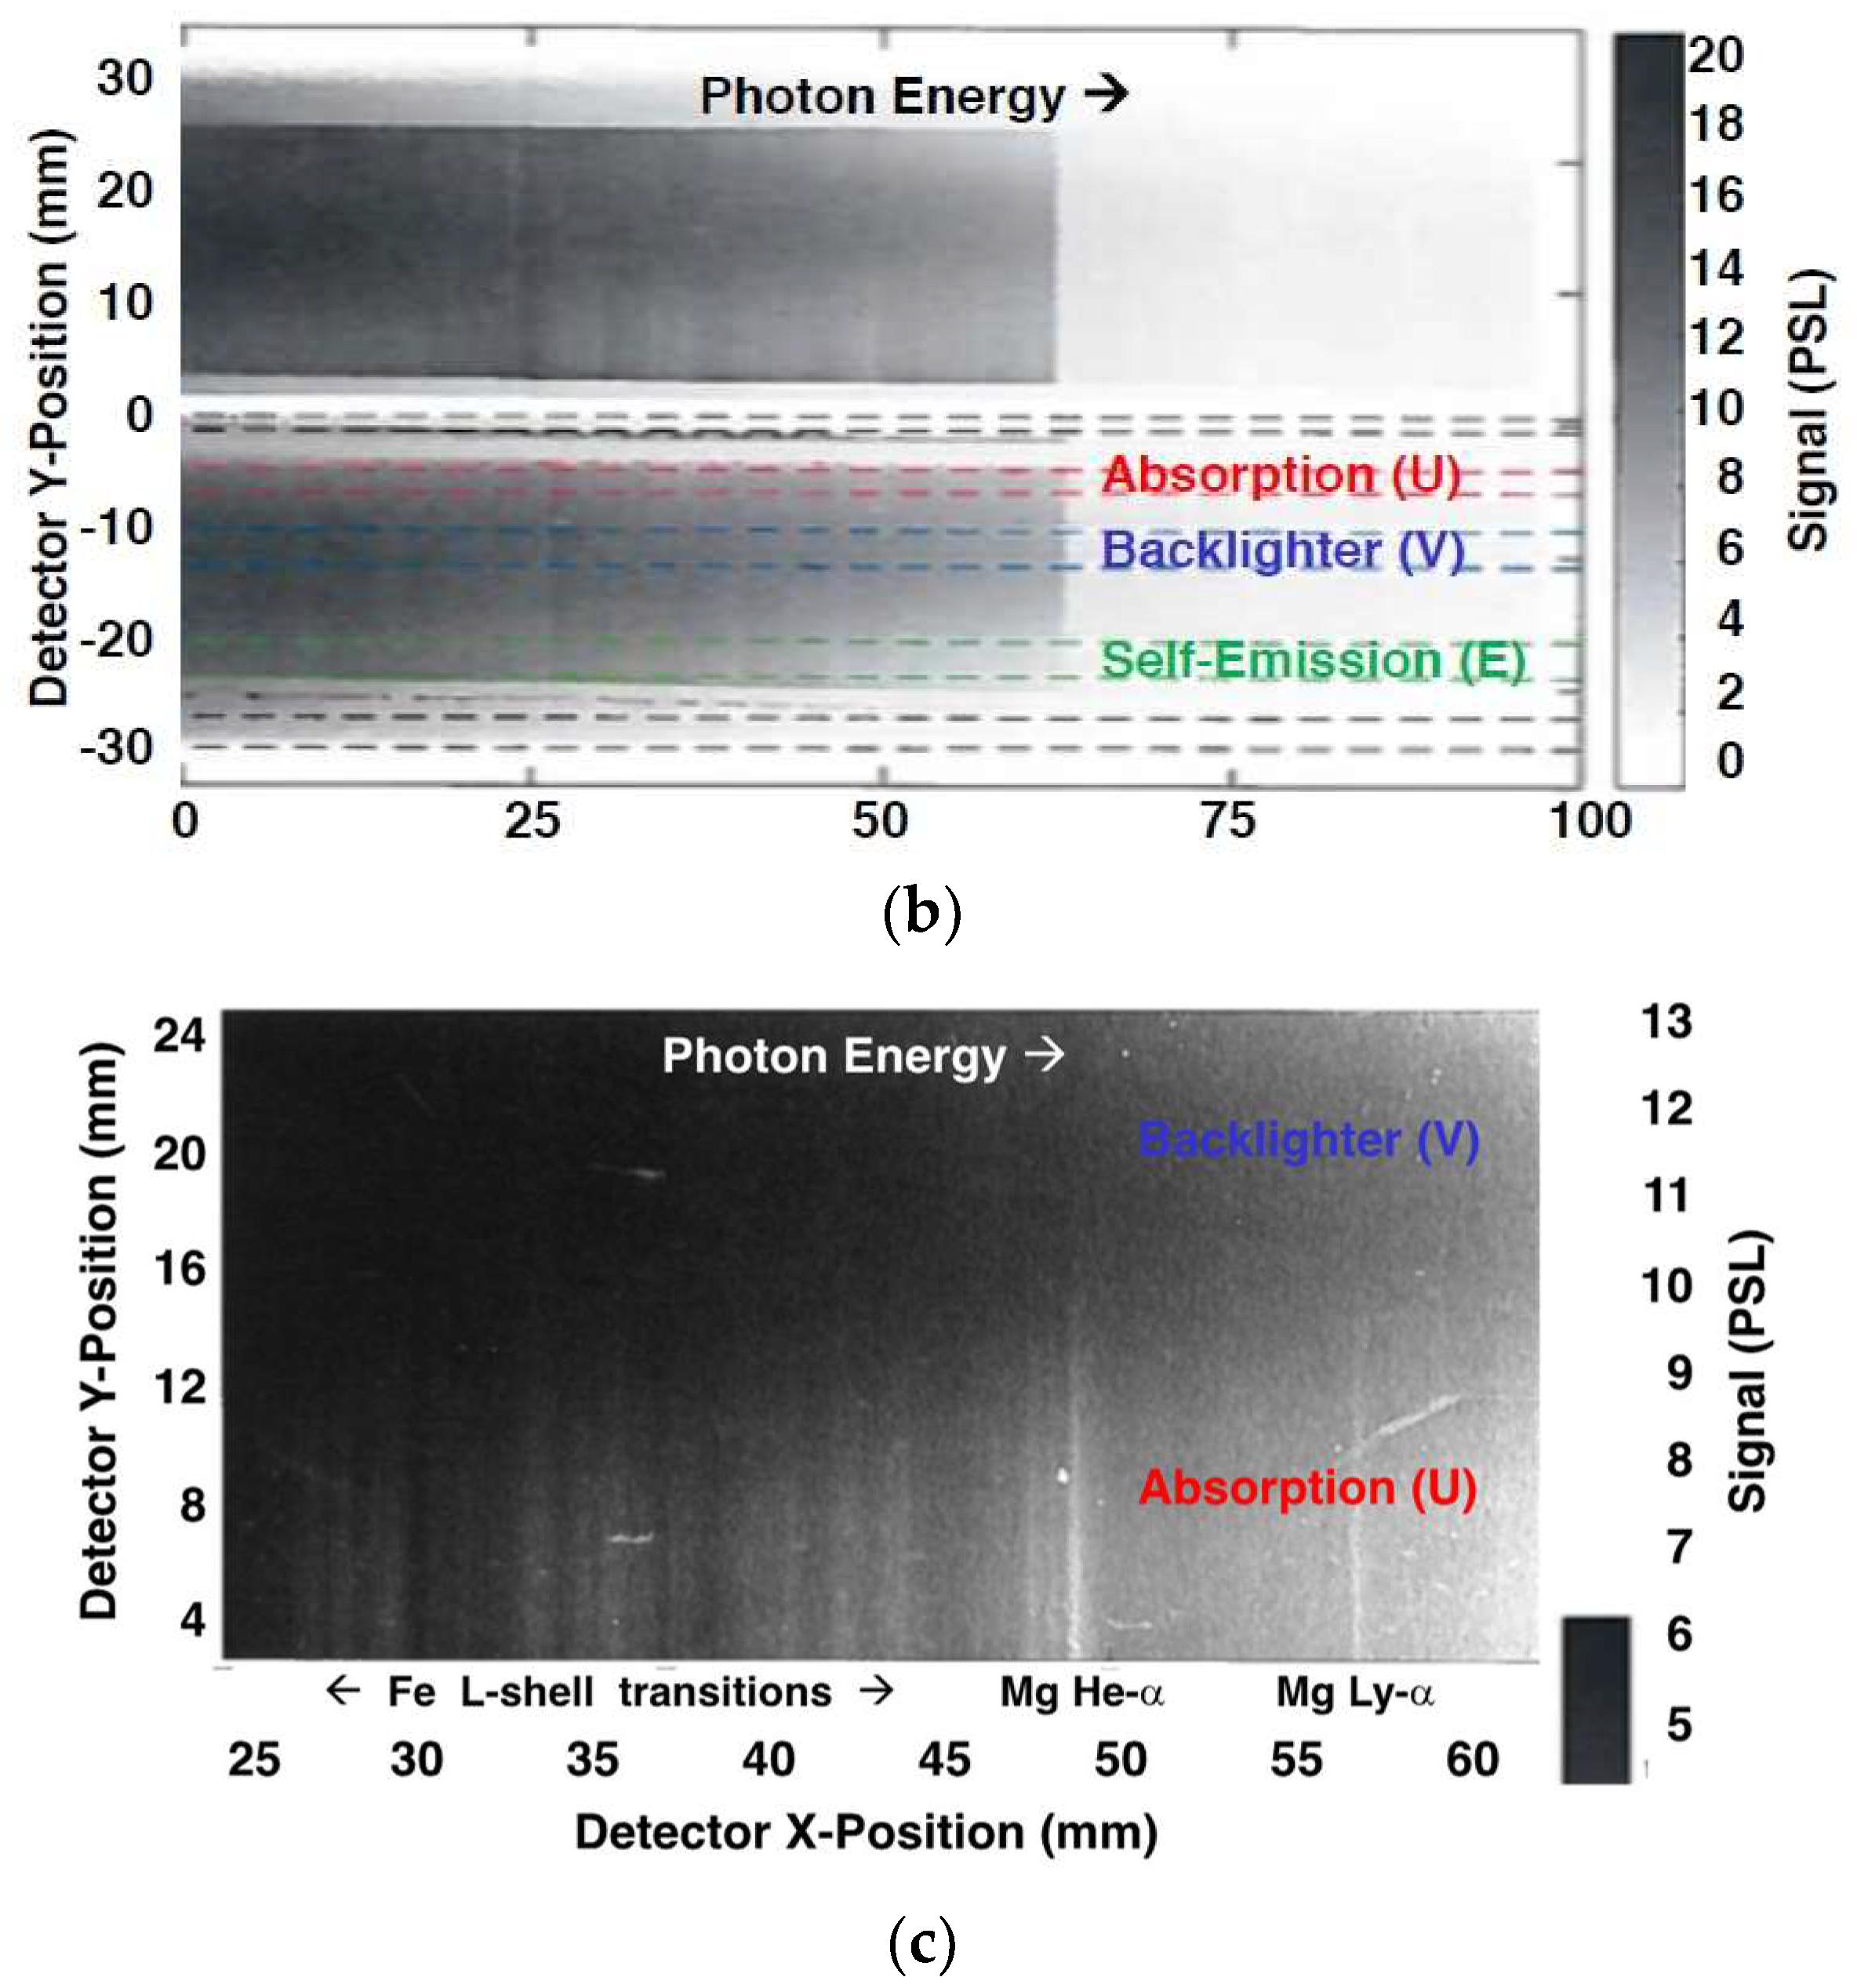
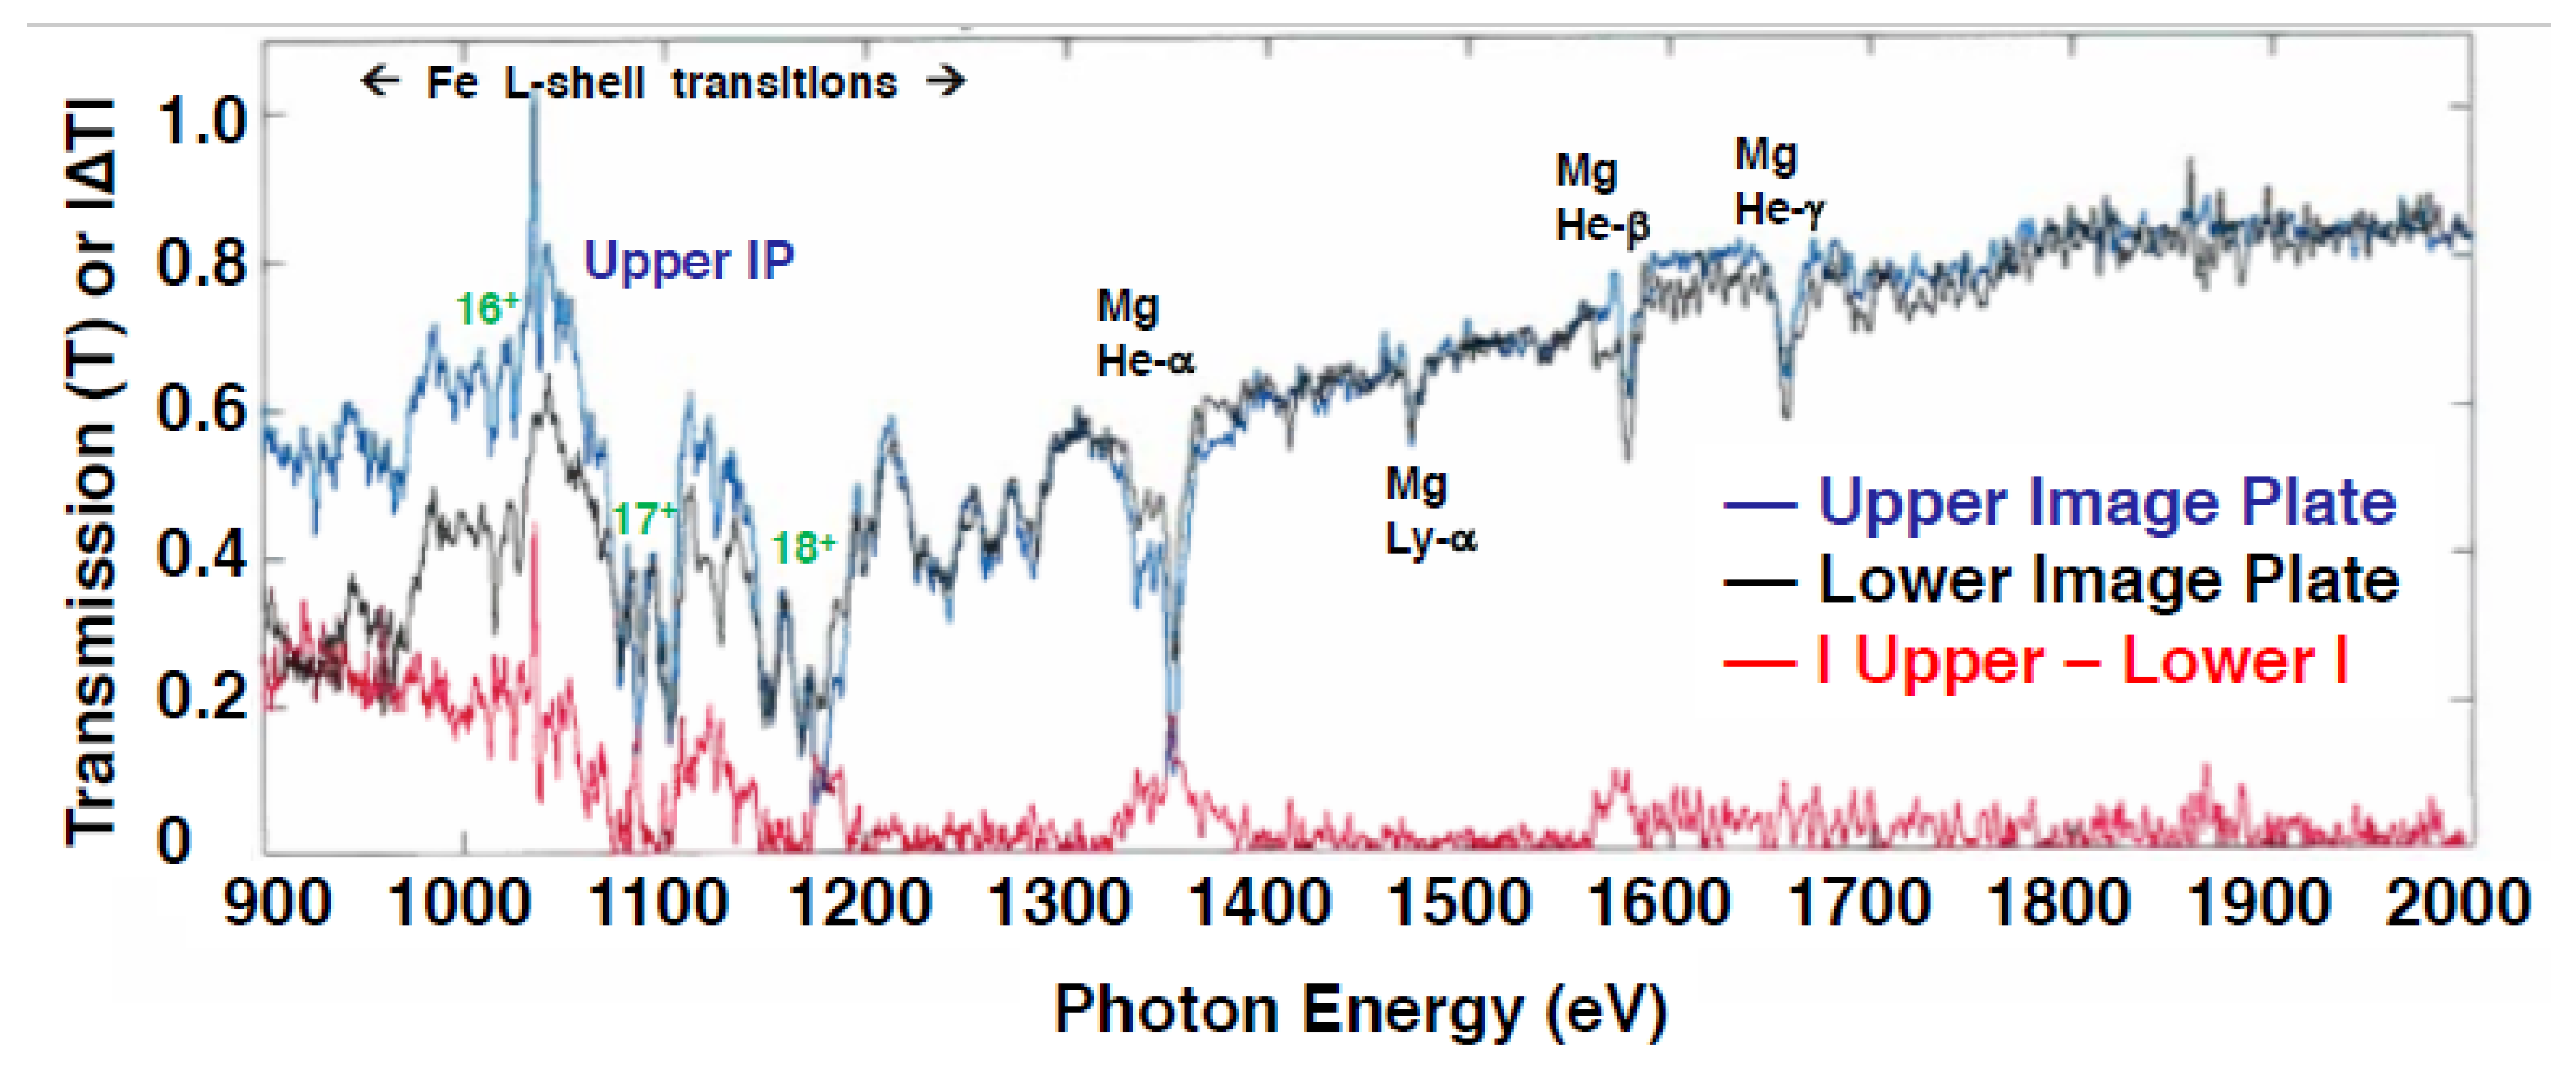
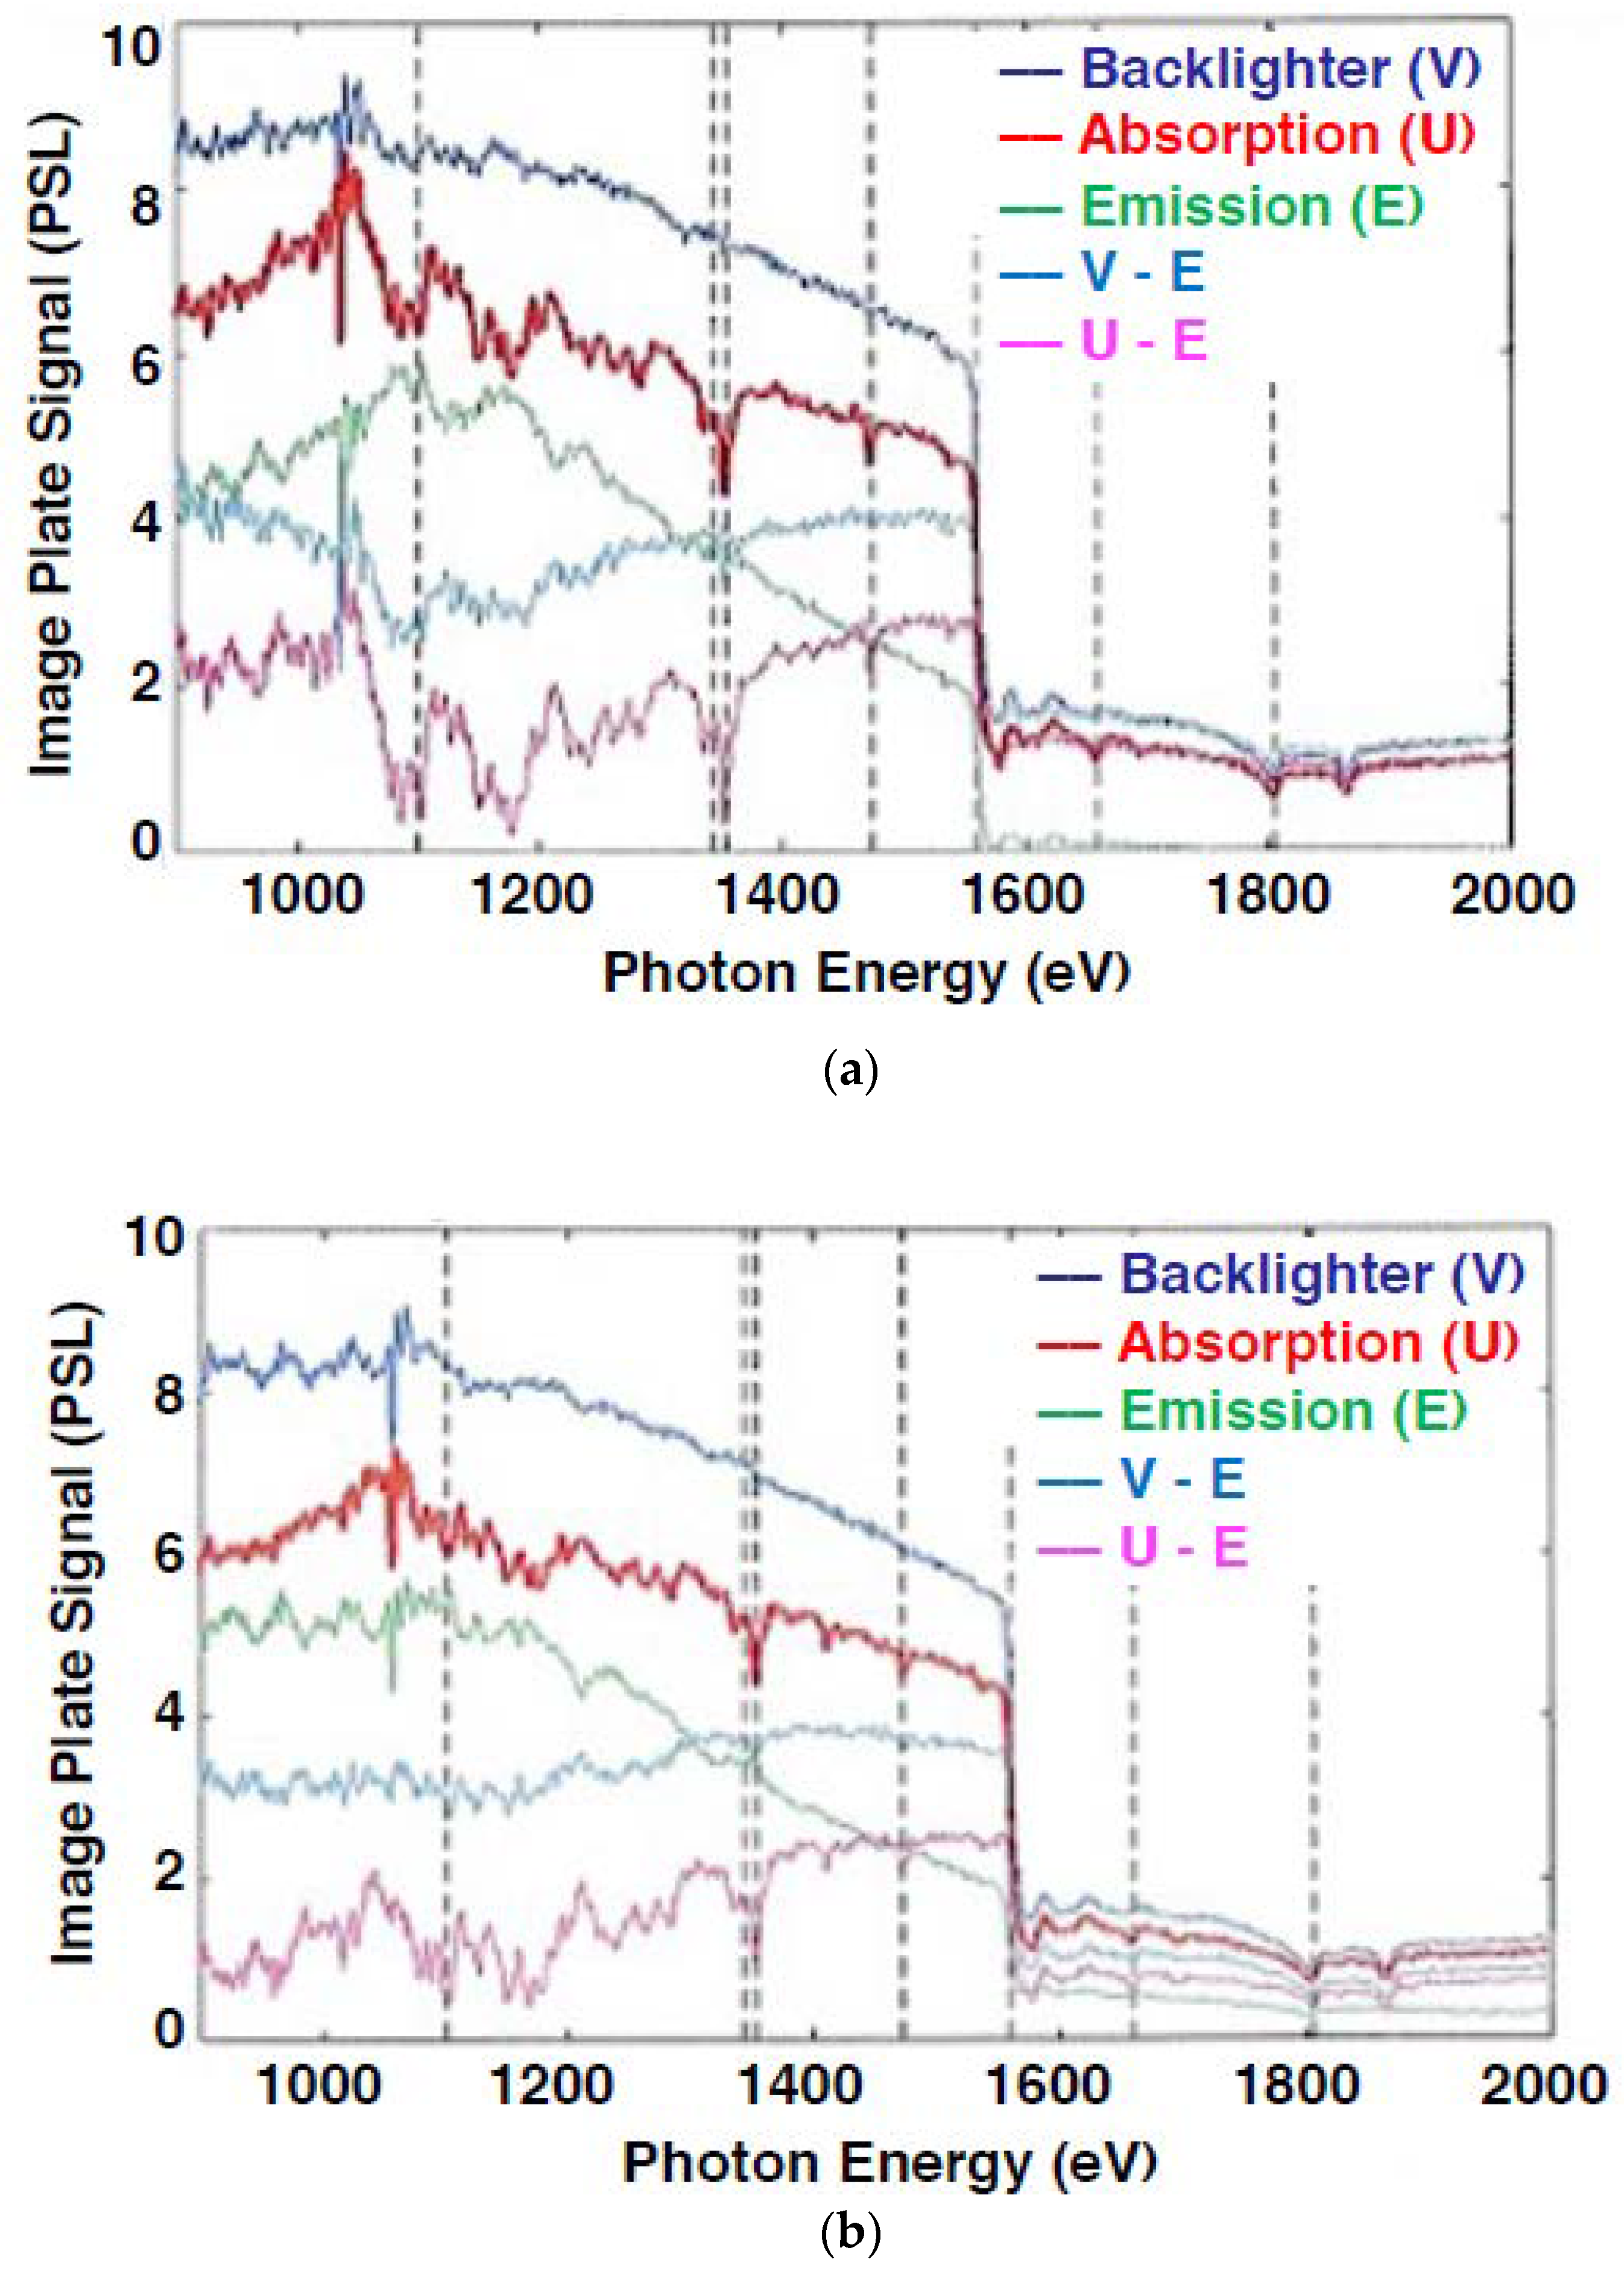
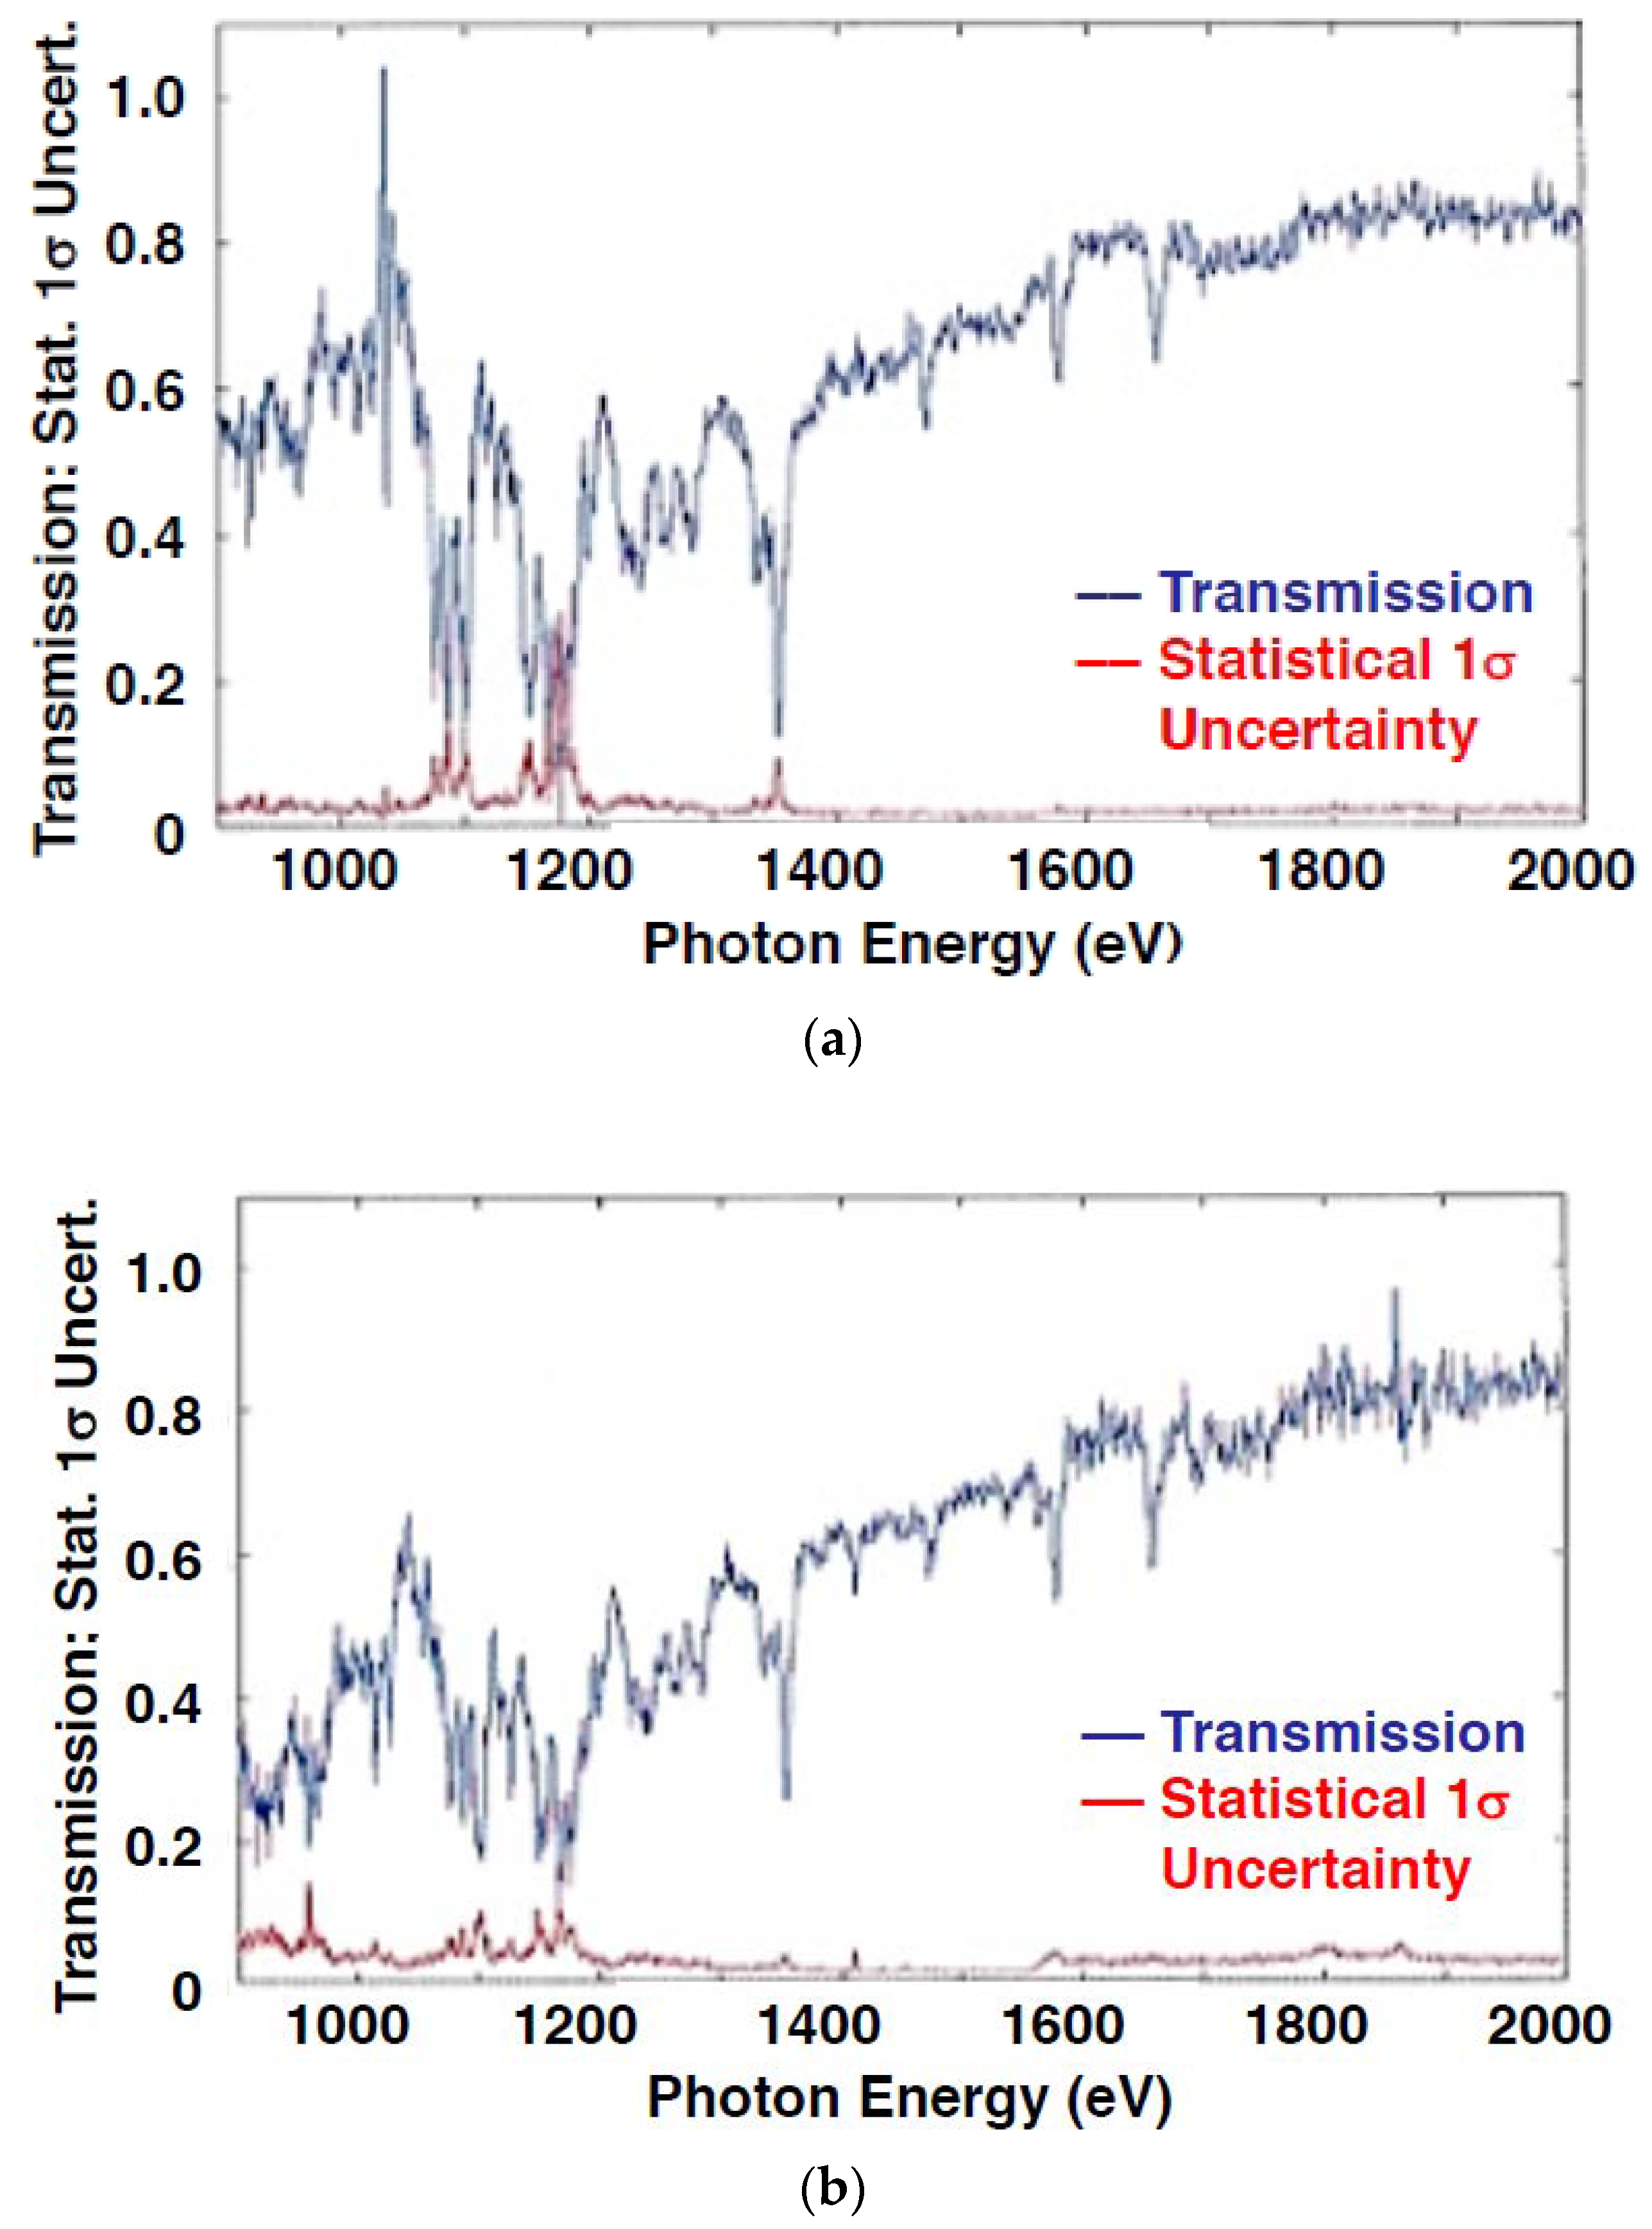
2.1. X-ray Transmission Spectra

The measured X-ray transmission is shown in Figure 5. Details of the analysis are provided in Section 4, but basically the transmission is separately inferred from the two halves of the image, with approximate corrections of estimated backgrounds and other sources of systematic uncertainty. These initial NIF data show promise for future comparisons with the Z data and theory. The primary magnesium K-shell lines are visible, as well as a large swathe of the iron L-shell. The depth in the temperature-sensitive Mg Ly-alpha line, relative to the He-like Mg features, indicates conditions near 150 eV according to prior work [1,8,15]. In the iron spectrum, transition arrays with principal quantum numbers n = 2 to 4 and n = 2 to 5 from neon-, fluorine-, and oxygen-like iron are clearly visible, indicating a mean ionization state near Fe17+.
Meanwhile, the variation between the upper and lower image plate spectra in Figure 5 helps to visualize the present best-estimate systematic uncertainty bounds on the NIF data. In Figure 5, the red trace plots the absolute difference between the transmission spectra, which is consistent with the systematic uncertainty estimate described in Section 4: ∆T of around ±0.02 to 0.05 in the quasi-continuum (E > 1300 eV), ±0.05 to 0.1 in the Mg lines, and then increasing to ±0.2 for the iron features at lower energies (E < 1300 eV), where the background correction is largest and also most uncertain. Because many systematic uncertainty contributions have not been quantified, this is only an estimate.
The two transmission spectra in Figure 5 used the same methodology but required different levels of background subtraction due to an unexpected asymmetry in the measured background on the two image plates. Further details are provided in Figure 6 and also in Section 6. The large systematic variation between two plausible analyses, particularly for X-rays < 1200 eV, shows that much work remains. Upcoming experiments are measuring the instrument backgrounds explicitly and will result in tighter constraints on the analysis methodology.
On the other hand, the overall general agreement between the two datasets at X-ray energies above 1200 eV provides encouragement that sample conditions are reasonably symmetric. Also, the similarity between this shot and the earlier work [13] suggests that reproducible measurements with low uncertainty should be possible. An upcoming experiment will repeat this measurement with a thicker sample to check whether the data follow the Beer–Lambert scaling, T(υ) = e−ρLκ(υ) with ρ = sample density, L = thickness (pathlength), and κ = opacity. Should the transmission scale correctly it will help confirm that systematic uncertainties are understood and enable the first NIF opacity measurement in the iron bound-free continuum region.

2.2. Plasma Conditions

For the X-ray transmission results to be compared with opacity models, detailed knowledge is required of the temperature, mass density, and areal density of the plasma being probed. These measurements must be accurately synchronized to the time of the transmission measurement. Temperature and mass density will in future work be inferred from the Mg K-shell features in the transmission spectrum, after the systematic uncertainties are reduced, but for now all three parameters are independently measured in the NIF platform.
The areal density of the opacity sample is measured pre-shot using a combination of two methods: Rutherford Backscatter (RBS), and X-ray transmission (cold opacity) methods at photon energies above and below the iron K-edge. The RBS method is absolute but can only be applied to ‘witness’ samples, which are produced in the same coating process as the primary samples but are spatially separated and of larger size. The RBS technique provides information on the areal density of both the iron and the magnesium and is sometimes able to infer oxygen contamination levels. For the shot studied here, N171214-001, the RBS data indicate a sample composition of 2.07 × 10¹⁸ atoms/cm2 of Fe and 1.42 × 10¹⁸ atoms/cm2 of Mg. The RBS data are currently believed to be accurate to ±10%, and the witness-to-sample variance within a coating procedure is also estimated at ±10%, for a combined, current best-estimate uncertainty of ±14%. These uncertainties are expected to decrease by a factor of 2–3 when ongoing work to quantify the RBS uncertainties is completed.
The X-ray transmission methods [18] are believed to be potentially more accurate (±5% or less) for iron, and they can be applied directly to the as-shot samples, but they can only infer magnesium and oxygen areal densities indirectly. The application of these methods to the NIF samples is still under development, but initial results are available for the initial shot studied here, N171214-001. The sample was measured prior to target assembly by near-monochromatic X-ray transmission imaging at three X-ray energies: 2291, 5410, and 8037 eV. The X-ray data at 2291 eV in particular is inconsistent with the nominal RBS composition; the X-ray data require a slightly lower total areal density, but they also set a minimum areal density of 2.0 × 10¹⁸ atoms/cm2 of Fe and 1.28 × 10¹⁸ atoms/cm2 of Mg. The maximum areal densities consistent with all the X-ray data are 2.12 × 10¹⁸ atoms/cm2 of Fe and 1.51 × 10¹⁸ atoms/cm2 of Mg (but not both together). These values are all within the current estimated uncertainty of the RBS data. The X-ray data carry an additional systematic uncertainty of perhaps ±5% (for Fe) to 20% (for Mg) due to uncertainty in the cold opacity tables (for iron), the inability of these X-rays to distinguish between Mg and potential oxygen impurities, possible nonlinearity in the detection system, etc. Pending further analysis of the X-ray data, the RBS data are used in subsequent analysis.
Sample temperature in the NIF experiment can be evaluated in two ways. Figure 1 (right) showed the diagnostic view of an absolutely calibrated X-ray flux diagnostic (DANTE-2) [19,20,21,22], which measured an effective brightness temperature of around 140–150 eV during the time of the X-ray transmission measurement (4.3 ns) for the NIF shot discussed in this paper. The X-ray transmission measurement time itself is measured separately, after time-of-flight corrections, from the capsule backlighter’s X-ray flash observed using the other flux diagnostic (DANTE-1). The wall temperature of 140–150 eV is consistent with a sample temperature of 150–160 eV, based on separate pre-shot radiation hydrodynamics simulations [9]. The sample is slightly hotter than the nearby wall because the sample has a more direct view of the laser-heated end cavity walls. The temperature range of 150–160 eV matches that of the Sandia Z experiments published in 2007 [1]. A more thorough evaluation of the NIF sample temperature is possible, by evaluation of the Mg K-shell features in the transmission spectra. The Mg Lyman-alpha line, relative to the He-like lines, is very sensitive to temperature at these conditions [8], and the strength of this feature in the NIF data also suggests temperatures near 150 eV. However, a rigorous analysis requires, in addition to a precise (low-noise) transmission measurement (this work), both reduction of systematic uncertainties (an accurate transmission) and a thorough analysis accounting for the spectrometer resolving power; this is an area for future work.
The sample electron density at the time of the X-ray transmission measurement is inferred in the NIF experiment from the edge-on gated X-ray images shown in Figure 3. The data are unsaturated. Starting from the pre-shot measured areal density, the in situ plasma mass density can be obtained by dividing out the expansion width of the sample, which is measured directly from the images after accounting for the instrument geometry, diffraction effects, and the parallax variation between the different pinholes. A complete description of the methodology and its application to all current shots, with comparison to rad-hydro models of the sample evolution, is being prepared for separate publication. On this shot, the analysis concludes that the sample expanded to 59 ± 3 microns at the time of the transmission measurement, which is also the time of the bottom-left image in Figure 3. From the sample composition reported above, this expansion implies an overall electron density of 8.4 × 10²¹ electrons/cm3 (±14%) at the time of the measurement, assuming a mean charge state of He-like Mg (as observed) and F-like iron. This density is the same as the earlier Z experiments [1,2] to within the mutual uncertainties (~20%).

3. Discussion

Opacity measurements previously made at the Sandia Z facility are now being replicated using NIF. Both facilities produce transmission spectra from samples at temperatures ~150 eV and electron densities of 7–8 × 10²¹/cm3. Over the X-ray energy range from 900–2000 eV the initial NIF data from iron-magnesium samples show several n = 2 to 4 and n = 2 to 5 transition arrays for L-shell iron (Ne-, F-, and O-like) and the alpha, beta, gamma and delta lines of helium-like magnesium as well as the alpha line for hydrogenic magnesium. The same set of transitions were previously observed at Z [1].
The NIF experiment is designed to achieve the same plasma conditions as the experiment on Z, but it uses a significantly different heating method. The NIF heating source is nearly isotropic and separate from the backlighter [3], whereas on Z the imploding pinch-driven hohlraum is used both to heat the sample from one side and also to backlight it [1,2,8,15,23]. The NIF platform also uses somewhat different diagnostic techniques, including measurements of plasma conditions which are independent of the spectra. The NIF platform offers potential advantages in achieving LTE conditions through near-4π radiative heating of the sample. The NIF experiment can also independently vary the plasma conditions at the time of the measurement. Density is controlled by varying tamper thickness, drive pulse shape, and backlighter timing, and it is measured by expansion imaging and, in the future, Stark broadening of the He-like Mg lines. Temperature is controlled by varying drive energy, peak power, and potentially backlighter timing, and it is measured by the DANTE-2 spectral flux diagnostic and, in the future, line ratios of the H- and He-like Mg K-shell transitions.
However, all of these differences also imply a different array of potential systematic uncertainties than those seen on the Z experiments. This can be a strength as well as a weakness. Should the Z experiments prove incorrect, it will be a result of a subtle systematic error which has not yet been adequately quantified. In designing and fielding the NIF experiments, it is also essential to identify, minimize, and correct for potentially significant sources of systematic error, both to ensure that the NIF results are accurate, and possibly also to better assess the accuracy of the results from Z. To the extent that both platforms share similar systematics, both could be wrong for the same reasons, but an insight from the NIF platform could be directly applied to refine the Z results and vice versa. However, with different systematics, it is possible that both experiments could be wrong for different reasons. Either way, by broadening the hunt for systematic errors, it is possible that the NIF effort might trigger an insight to further improve the Z results.
To discriminate between the opacity models and the Z experiments, an overall accuracy level of 10% is required for the opacity, which in turn requires X-ray transmissions accurate to an absolute level of ±0.02 [3]. Attention has been paid to achieving the required statistical uncertainty level [3,11,13], and the results in Section 4 demonstrate this for much of the spectrum. However, other parts of the spectrum need further improvement, and additional shots are needed to confirm reproducibility of the statistical data quality. However, statistics is not the whole story: extremely careful work is also required to ensure that systematic uncertainties do not cause additional transmission uncertainties beyond the ±0.02 requirement. This is currently a main focus of the research.
At this early stage in the NIF measurements, any differences between the Z and NIF data for iron are most likely due to systematics in the NIF experiment. The potential for variations in background subtraction methods to impact transmission results is highlighted in Figure 5, which provides a broad estimate for current systematic error levels in the NIF spectra. Ongoing work to quantify and correct principal systematic error sources is described below in Section 6.

4. Methods: Processing of the Transmission Spectra

The spectrograms recorded on shot N171214-001 (Figure 4) were processed into transmission spectra by computing band-averaged lineouts including statistical noise levels, subtracting a diffuse X-ray background correction from each lineout, and then computing the transmission and associated statistical uncertainty. Each of these steps is discussed below.

4.1. Lineouts

The image plates (IP-TR) were scanned using the NIF’s IP scanner with 25-micron pixels. The digital images were converted to linear units based on photo-stimulated luminescence (PSL) using standard techniques [24], yielding the image presented in Figure 4. For soft X-rays the PSL signal is proportional to deposited energy (eV/μm2), but the scaling factors in the literature vary by a factor of two [17,23]. Also, the raw data include contributions from background sources with photon energy different from the primary signal, so PSL levels cannot be converted to absolute X-ray levels (photons/eV/μm2) until all backgrounds are quantified and subtracted.
Three separate lineout regions, each 2–5 mm (80–200 pixels) wide, are shown in Figure 4 for the sample umbral absorption (U), backlighter-viewing (V), and self-emission (E) spectral zones. The terms U, V, and E follow the experimental design work [3]. Two additional 1–2 mm (40–80 pixel) “off crystal” diffuse-scattered background bands are also studied, from the portions of the image above and below the spectra dispersed by the crystal. The signal observed in the off-crystal background regions ranges from 1 to 8 PSL on the lower image, and 1–12 PSL on the upper image. The off-crystal background in the upper image is larger due to contributions from the alternative crystal plane background detailed in Section 6.2.
Within the bands U, V, and E, the data at each X-ray energy consist of 80–200 individual spatially resolved pixels which should ideally record identical values. These pixels are averaged together to form the lineout, and additionally the standard deviation of the individual pixel values is computed to provide statistics. In addition to the spatial averaging, the data are smoothed in the spectral direction via a three-pixel ‘boxcar’ moving average. The spatial resolution of Image Plate-TR with the NIF scanner has been measured in this work to be around 100 microns, so the 3 × 25 micron smoothing does not have much effect on the signal but helps to further reduce the noise.

4.2. Background Subtraction

The 2-D shape of the scattered background ‘on crystal’ is not yet accurately known, but an approximate model exists for the dominant, diffuse scattering contribution [13]. The model assumes that an arbitrary fraction of the incoming flux reaching the crystal is scattered isotropically and computes the relative contribution landing on each pixel of the detector. In the spatially resolved direction, the modeled background is nonuniform because of solid-angle effects and instrument structure. So relative to the absorption band (U), the modeled background is somewhat larger for the backlighter band (V) and somewhat lower for the self-emission band (E). However, in the spectrally-resolved direction the modeled background is roughly the same shape for all three bands. In this work, the background is modeled using the ‘universal’ shape obtained off-crystal and scaled by a band-specific ‘background scaling factor’. Future experiments will measure the shape directly, but for now an approximate estimate of the background scaling factors is performed using the 1559.6 eV aluminum K-edge. Since this appears to be a novel approach, it is explained further.
The spectrometer filters cause attenuation of the desired first-order-diffracted ‘signal’ X-rays at energies above the Al K-edge (denoted U+, V+, and E+ for the three spectral bands), relative to those below the edge (U, V, E). In Figure 4a,b, this is the source of the strong drop-off at x = 65mm. The useful constraint is that because the filter itself is highly uniform in thickness, all bands experience the same filter attenuation. So the ratios of the signals above the edge, normalized to signals below the edge, must be the same for all three bands: U+/U = V+/V = E+/E = Constant. The Rb L-edge also reduces the first-order crystal reflectivity, near 1800–1810 eV, and this ‘Rb L-edge dip’ must also be the same for all three lineouts, although it is weaker and the spectra there have more relative noise.
Note that the backgrounds (everything other than the first-order diffraction ‘signal’) do not contribute to the drop-off at the edge. The backgrounds include both high and low-energy photons, some of which are attenuated by the aluminum, but that happens everywhere across the filter. There is nothing special about the x = 65 mm location except for the first-order diffracted rays.
The Al K-edge and Rb L-edge dip act as fiducials to constrain two of the background scaling factors relative to the third. The third scaling factor is in turn constrained by the fact that the transmission through the sample cannot be influenced by the X-ray filters or crystal in the spectrometer, so the Al K-edge and Rb L-edge reflectivity dip should not be present in the final X-ray transmission. For X-ray energies near the Al K-edge, this procedure constrains the transmission to within a few percent, as illustrated in Figure 5. At other energies, there is a known flaw in assuming the background shape is the same in the U, V, and E regions as in the off-crystal perimeter regions where it is measured. The off-crystal background at lower photon energies is partly contaminated by diffraction from alternative crystal planes, and at lower photon energies there is also an increasing contribution from second-order diffraction (relative to first order) which is not measured in the off-crystal background. Further work to quantify and correct these background issues is needed.
Figure 6 plots the background-corrected lineouts V, U, and E as the blue, red and green traces, and then the derived emission-corrected terms (V-E) and (U-E) are plotted as the cyan and magenta traces, respectively. The two image plates show similar signal levels except for the self-emission background, which is contaminated to different extents by diffraction from alternative crystal planes; this issue is discussed below in Section 6. This contamination also affects the off-crystal background and leads to a systematic difference in the background subtraction applied to the upper and lower image plates on this shot. This is the largest contributor to the differences seen in Figure 5 between the upper and lower IP transmission results.

4.3. Transmission and Statistical Uncertainty

The transmission results for the upper and lower images are separately plotted in Figure 7, together with the 1σ statistical uncertainty. The statistical uncertainty used here is that derived entirely from the standard deviation of the spatially separated pixels used to generate each photon energy point in the individual lineouts; there is no averaging of data from multiple shots or detectors. The individual transmission data show generally low statistical uncertainty (∆Tstat). On the higher energy side of the spectrum, and particularly where the transmission is smooth (quasi-continuum), the uncertainty typically meets the requirement (|∆Tstat| ≤ 0.02) needed to be able to infer the underlying opacity to ±10% (for 0.2 < T < 0.6) [3]. At lower energy, where the spectra are rapidly varying as a result of absorption and emission features as well as nonuniform backgrounds, the uncertainty tends to be larger. This could be reduced by higher-resolution, more precise spectral alignment and elimination of the nonuniform backgrounds.
This section detailed the transmission analysis proper. But because the difference between the Z data and theory necessarily reflects a systematic error in one or the other, experimental uncertainties in the NIF measurements must also be treated in some detail. At NIF there are three sources of statistical uncertainty, detailed in Section 5, and a variety of potential sources of systematic uncertainty, the largest of which are detailed in Section 6.

5. Sources of Statistical Uncertainty

The X-ray photons arriving at the image plate detector excite metastable states in a phosphor medium, which in turn are digitized using an optical readout system that first uses a scanning laser to trigger release of the metastable states via photo-stimulated luminescence (PSL) and then records the luminescence using a calibrated photomultiplier tube. The digitized data are mathematically converted back to linear units (PSL per pixel) following prior work [24]. The data therefore include statistical fluctuations in (1) the incident photon fluence (photons per pixel); (2) the uniformity of response of the phosphor medium; and (3) the photomultiplier digitization (noise). These are discussed in turn and summarized in Table 1, where column 3 provides the pixel-to-pixel 1σ variation and column 4 provides the 1σ variation in the final transmission spectra after the pixel-averaging process described above in Section 4. In addition to these statistical fluctuations, the scanned image plate data may include blemishes (e.g., scratches, dust), which are covered in Section 6 as systematic uncertainty sources since they are nonuniform, often identifiable, and amenable to correction.
Regarding the photon statistics, the backlighter is bright enough [11] and the OpSpec sensitive enough [12] to deliver roughly 10,000 photons per 25 × 25 micron pixel on the image plate, resulting in single-pixel statistical fluence variations on the order of 1% or less.
Given the instrument photometrics, and using the lineout averaging process described in Section 4, which averages 100 s of spatially adjacent pixels with nearly identical photon energy, one could hope for photon statistical variation of 0.1% or less. This is somewhat compromised by noise added in the IP fade process prior to scanning (typically 6–24 h post-exposure), and to a lesser extent by the partial attenuation of the X-rays by the spectrometer filters. A greater contribution comes from the photon statistics of the various backgrounds, which are currently larger than the signal itself. These effects might be expected to produce noise levels of 0.2–0.3%, but the data show much higher levels, ~1% statistical noise for each lineout in the quasi-continuum, and more where signal levels are weak, or the spectrum is rapidly varying.
To further understand the source of the statistical variation across the spectra, the digitization noise in the scanner has been assessed by repeatedly scanning the same image plate multiple times, renormalizing subsequent images to correct for the overall fade induced by the scanning process, and looking at the variation in response on succeeding scans. The key observation is that even “noise” features in the data are reproduced by succeeding scans, indicating that digitization noise is not the limiting factor. Since photometric noise is not thought to be the limiting factor for most of the spectrum, the current working hypothesis is that the recording medium itself might have “graininess” (nonuniformity of response) at a level of 3–10%, possibly pixel-to-pixel but certainly within the 3-by-(80–200)-pixel regions used to generate each point in the lineouts. This is in addition to any variation in the actual X-ray spectrum. A brief survey of relevant literature turns up little mention of the “flat field” spatial variability of IP response, but some published data (for a different type of IP exposed at much higher X-ray energies) showed similar statistical variation [25]. Reference [25] contains data on the standard deviation among IP-MS and IP-SR pixels uniformly exposed with X-rays from 8–80 keV. The error bars on Figure 4 reflect the standard deviation of measurements over a 1 cm2 area, and they show uncertainty levels ~10% of the signal. Additional data is needed since this may set a fundamental limit on the accuracy of measurements with image plates.
To improve on this statistical limitation, X-ray film is thought to be a superior alternative, but it is more technically difficult to field reliably in a single-instrument experiment. A development effort is underway to reliably record data with X-ray film on NIF.
Table 1 summarizes these three sources of statistical error.

6. Sources of Systematic Uncertainty

Systematic error can affect every aspect of a transmission measurement. The experimental design study [3] explicitly assumed a small-volume, short-duration backlighter and well-aligned collimator, which together project a near-ideal absorption image of the sample onto the crystal spectrometer. It explicitly considered sample and hohlraum self-emission as an expected background, assuming such background would be uniform. In addition, the design study implicitly assumed an ideal X-ray spectrometer, one whose measured data arises only from the incoming diffracted X-rays. In actual measurements, systematic errors arise because most such simplifying assumptions are not perfectly met. A complete quantification of all sources of systematic error is beyond the scope of the present work, but progress has been made at understanding and mitigating the principal sources. The current status is described below and summarized in Table 2.
In this experiment, the three largest known systematic uncertainties come from backgrounds caused by the non-ideal diffracting crystal in the spectrometer. First, scattering and fluorescence create diffuse re-emission inside OpSpec. When the OpSpec is fielded without one of the crystal mounts, the background on the corresponding image plate is reduced dramatically, indicating that the bulk of the diffuse background comes directly from the crystal and/or mount. Secondary scattering events may also play a role. Second, for a broadband backlighter as used here, higher-order diffraction takes place from the primary crystal plane, via the Bragg condition nλ = 2d sinθ, for n = 2 to 10 or more. Finally, the crystal lattice structure includes alternate planes, inclined at an angle relative to the primary plane but capable of satisfying the Bragg condition and diffracting entirely separate spectra onto the detector [26]. The NIF opacity spectrometer uses a 70 × 180 mm detector which is positioned only 50–100 mm from the crystal, so it subtends a large angle from the crystal, and it can intercept diffracted X-rays leaving the crystal from alternate crystal planes at varying angles. Whenever these backgrounds are not precisely subtracted from the absorption and backlighter spectra, a systematic error is introduced into the inferred transmission.
The choice of image plate as the detector is a liability here, since for soft X-rays the image plate signal is proportional to deposited photon energy [17,18]. Higher-energy photons, either scattered or diffracted, produce proportionately more background than the lower-energy first order diffracted photons that provide the transmission signal of interest. Films with relatively thin emulsion layers might perform better by transmitting, not absorbing the higher-energy photons.

6.1. Diffuse Scattering and Fluorescence

Diffuse X-ray re-emission from scattering and fluorescence is expected from any crystal and its substrate. The initial transmission measurements using the NIF opacity spectrometer showed a strong diffuse background arising from X-ray scattering from the crystal and crystal substrate, which originally comprised 80–90% of the total counts in the detector. This background is large in the broadband convex crystal geometry since each portion of the detector “sees” most if not all of the exposed crystal, and the nearby crystal subtends a large solid angle at the detector.
Over the course of three succeeding shot days in 2017, this background was reduced by thickening the collimator, tailoring the backlighter drive pulse to reduce the hard X-ray output, and switching from aluminum to optical-grade plastic crystal substrates [13]. The remaining background is spatially nonuniform, and a portion of it is recorded on the perimeter image plate, outside the region illuminated by Bragg-diffraction from the crystal (i.e., ‘off the crystal’). The full background is approximated by a geometric finite-element view-factor model which calculates the relative fluence onto each pixel of the detector, assuming isotropic scattering (or re-emission) of the X-rays reaching each part of the crystal from the backlighter [13]. This background model may be normalized to the data measured ‘off the crystal’, and then subtracted from the entire data image. This approach yielded the first transmission results [14], but it is vulnerable to residual systematic errors from variation between the geometric model and the actual background. The accuracy of the subtraction can be verified at higher energy by looking at intrinsic spectral fiducials, such as the K-edge of aluminum (in the spectrometer’s X-ray filters) or the Rb L-edge dip in the reflectivity of the RbAP crystal: in both cases there’s no reason for the underlying transmission to vary suddenly, and an accurate background subtraction is required to obtain a smooth transmission variation across the fiducials. However, such fiducials are not yet available for X-rays below 1.56 keV, so the accuracy of the background subtraction degrades at lower photon energies. Future shots are planned with new filters to provide a combination of the Mg K-edge, Ge L-edge, and/or Zn L-edge as fiducials between 900 and 1350 eV. Furthermore, the actual diffuse background shape is being measured on a dedicated calibration shot, where the crystals are removed from the substrates, but the scattering geometry is not modified. The fluorescence and scattering yields from the substrate are less than from the somewhat higher-Z crystal material, but the geometric shape should be identical and can be scaled to match the shape observed on the perimeter of the data shots. Together, these should result in improved background subtraction methods. A further step is to drastically reduce the diffuse scattering visible at the detector by switching to a concave elliptical crystal geometry with a crossover slit, similar in concept to the OZSPEC instrument [27,28] but without the gated detector. The crossover slit reduces by a factor of 5–10 the fraction of the crystal (and substrate) seen by any given detector pixel, which should reduce the scattered background proportionately.

6.2. Diffraction from Alternative Crystal Planes

In the current understanding of the background sources, the next-largest contribution after diffuse scattering/fluorescence is thought to be the diffraction from alternative crystal planes (ACPs) in various orders. In OpSpec, diffraction from two distinct classes of ACPs is routinely observed upon close inspection of the data below 1.3 keV, for both KAP and RbAP crystals. The cleanest evidence of two sets of ACPs came from an earlier shot than analyzed here, in which one OpSpec crystal had a serendipitous structural defect; the image showed two distinct replications of this defect at the ends of the suspected ACP diffracted signals. One class of ACPs is co-aligned with the primary dispersion plane of the instrument and is thus referred to as ‘co-planar’. The other class diffracts at an angle above/below the primary plane, but still falls onto the large-area detector media, so it is referred to as ‘out-of-plane’. Importantly, no ACP replications were seen above 1.3 keV in the primary dispersion geometry, showing that the data above 1.3 keV is free of significant ACP contamination.
The out-of-plane ACP signals are thought to be from the {01l} family of planes, for l ≥ 3 [29] and appear primarily within the self-emission and backlighter regions in the spectrum. They do not appear to compromise the absorption band in the data. This angled ACP diffraction is known to comprise relatively high-energy X-rays (E > 5 keV) because on a test shot the angled diffraction penetrated through a filter material opaque to X-rays below 5 keV. This is consistent with the 8.061 Å 2d spacing of the (013) plane. This background could perhaps be reduced by modifying the backlighter spectrum to reduce the higher-energy X-ray tail, or by using a detector that is relatively insensitive to X-ray energies >5 keV.
The co-planar ACPs diffract in the same plane as the primary (001) Bragg diffraction, but with different Bragg angles and therefore different propagation directions off the crystal. In the data they are offset towards the lower-energy portion of the spectrum. The co-planar ACPs produce weaker diffraction signals, but are more pernicious since these signals are typically indistinguishable from the primary data below 1.2 keV.
Together these background signals contribute an estimated typical transmission uncertainty of approximately ∆T = ±0.1 in the affected spectral region (below 1200–1300 eV). The ACP diffraction can be re-oriented by changing how the crystal is cleaved, and in other work the (013) plane diffracted in the co-planar direction [28]. However, given the lattice structure and the large solid angle affected, re-orientation may not be sufficient to decontaminate the entire OpSpec spectrum. Since the common element of all the alternative-crystal plane signals is that they do not propagate along the same Bragg-diffraction path as the primary data, they should be blocked by the crossover slit being built for the concave elliptical crystal mount described in Section 6.1 above, which only accepts (001) Bragg-scattered light propagating to the second focus of the ellipse.

6.3. Higher-Order Bragg Diffraction from the Primary (001) Plane

The third largest expected source of systematic error is thought to be the higher-order Bragg diffraction from the primary (001) plane in the spectrometer. The X-ray emission spectrum from the capsule extends to photon energies >4 keV [11], so diffraction from orders n = 2 through at least 4 must be considered. For the softer portion of the spectrum (E < 1.3 keV), signal attenuation from the filters (and the relatively low sensitivity of IP-TR) also reduces the primary signal relative to the higher-order diffraction. Since the sample transmission is high for higher order light (E > 1.7 keV), both the absorption (U) and backlighter (V) spectra should receive near-equal contributions from higher-order diffraction. However, the self-emission (E) from the much cooler sample drops rapidly above 1.5 keV and therefore the lower-energy emission data should not contain higher-order contributions. From the relation T = (U − E)/(V − E), the higher-order diffraction appearing in U and V (but not E) will artificially increase the computed T, introducing a systematic error.
An analytical calculation uses the limited available data for higher-order reflectivity of RbAP, the known filter transmission, and the measured relative brightness of the backlighter spectrum at a given energy E versus the second-order levels at 2E, i.e., the spectral ratio V(2E)/V(E). At present, this calculation suggests that higher order contributions comprise 2% of the signal at 1500 eV, but at lower energies the higher-order contribution increases to as much as 10% of the first order signal at 900–1000 eV. At the 10% level, the apparent transmission T is shifted upward relative to the true transmission by 0.02 to 0.08, depending on the transmission level. For example, at true T = 0.8, a measurement would show T = 0.82 (+0.02); for true T = 0.1, a measurement would show T = 0.18 (+0.08). The higher-order effect is smaller than the other two error sources, and has not yet been corrected in the analysis, but is large enough to impair quantitative analysis until it is corrected. Future work will incorporate more detailed crystal reflectivity data for the specific crystal curvatures in the spectrometer at a larger range of energies, and additional data on the backlighter output spectrum. Fortunately, an estimate of the background that is accurate to 10% of the background will be sufficient to constrain the systematic uncertainty to |∆T| < 0.01.

6.4. Potential Additional Sources of Systematic Error

In addition to the above systematic errors arising from the non-ideal nature of the spectrometer crystals, further work must consider potential systematic errors arising from other sources. For example, the backlighter has finite duration and emits (albeit more weakly) both before and after the core X-ray flash. At some level, this imposes both early-time and late-time transmission contributions on the data. The backlighter also has a laser-heated halo plasma around the core X-ray flash, which contributes somewhat to the total emission, creating penumbral effects when passing the collimator and the sample. The penubrae are generally avoided in the analysis, but design improvements to minimize the size of the penumbrae will allow more of the detector to be used for the analysis, further reducing statistical error as well. Improved collimation can also better prevent the detector from seeing the early-time run-in X-rays prior to the core flash.
Additional systematic errors may arise from non-ideal performance of the collimator or hohlraum, nonuniformity across the sample or tamper, warping of the spectrometer crystals, nonuniformity or warping of the filters, undetected light leaks in the detector, microscopic dust on the detector, and so on. Individually, these ‘non-crystal’ systematic errors are expected to be much smaller than those arising from the crystal, but collectively they contribute to the uncertainty. These must be quantified before the experiment can achieve the desired accuracy of ∆T < 0.02.

7. Summary and Future Directions

The ongoing discrepancy between the Z data and theory [2] creates a need to reproduce the Z measurements on a different facility. To address this, a platform to deliver X-ray transmission spectroscopy of hot, dense plasmas is under development using the National Ignition Facility. Following development shots [4], a set of transmission data were obtained on shot N171214-001 from iron-magnesium samples of measured thickness, heated to a temperature of ~150 eV and an electron density of 8.4 × 10²¹/cm3. These plasma conditions were measured using methods independent of X-ray spectroscopy. The X-ray transmission spectra show transitions from iron L-shell and magnesium K-shell ions. Similar charge states were reported on Z experiments at similar conditions [1].
The discrepancy between theory and Z data at higher temperatures and densities highlights the need to quantify and minimize all uncertainties. The NIF transmission spectra show statistical noise levels below ±0.02 in absolute transmission in key regions. This would be sufficient to support opacity measurements with accuracy |∆κ/κ| < 10% [3]. However, as detailed in Section 6, systematic errors ranging from ±0.05 to ~0.2 in transmission are known or may exist, given current data and methods.
Some of the systematic uncertainties are common to the Z and NIF platforms, while others are unique to NIF. A detailed comparison of the NIF and Z data must account for differences in spectrometer resolving power, plasma areal density, sample composition and, most importantly, residual systematic uncertainties. Each possible error must be quantified, minimized, and/or corrected to achieve the optimal experimental accuracy and establish the overall uncertainty. To reduce these uncertainties, a variety of refinements are in progress, including improvements in the backlighter, target, and spectrometer. Future work is expected to include quantification and reduction of the systematic errors using improved instrument and backlighter configurations [13]. Future experiments are planned to specifically measure individual backgrounds, and then to measure X-ray transmission with different sample areal densities. For the latter, deviations from the Beer–Lambert transmission scaling T = exp(−ρLκ) at several distinct values of ρL will help quantify residual uncertainties. The transmission scaling can be extended to include both null samples (unity-transmission test) and samples with very high opacity (zero-transmission test).
Furthermore, the NIF laser is capable of delivering 2–3 times more power and total energy than used on these initial shots, which is expected to extend the operating temperature of these experiments to 180–195 eV, the regime where the Z data and theory diverge. Once the systematic errors are fully quantified and minimized, NIF experiments at higher temperature will replicate the controversial Z measurements and deliver valuable information to help constrain the X-ray opacities used in solar and stellar models. As this work progresses, it is expected that NIF will begin to produce transmission data with sufficiently low uncertainties to resolve the discrepancy between Z data and theory at temperatures above 185 eV.

Author Contributions

In a dynamic collaborative project, it is not possible to concisely state everyone’s full contribution, so what follows is an approximate summary. Names are provided alphabetically for each aspect. R.H. and T.P. conceived and designed the experimental approach, with assistance from J.B. and G.R. and advice and input from M.D., C.F., C.I., J.K., M.S., T.U. and B.W. E.D., C.F., R.H. and T.P. developed the hohlraums and pulse shapes; D.L. and K.O. developed the capsule backlighter. M.M. simulated the sample evolution with support from E.D. and R.L. establishing the correct measurement time. R.H. and N.K. established the uncertainty budget and identified sources of uncertainty. T.C. led the Los Alamos, Lawrence Livermore, and General Atomics Target Fabrication teams to prepare the targets. H.J. led the pre-shot sample thickness measurements. R.H., H.J., K.O., and T.P. led the experiments with support from L.K. and analyzed the non-spectrometer data. M.A., T.A., J.E., K.F., R.H., E.H., J.K., R.K., K.O. and N.T. implemented the spectrometers; J.H. supervised processing and quality assessment of the spectrometer data; R.H. analyzed the spectral data with input from T.P. and H.J.; R.H. wrote the paper and takes responsibility for any errors herein.

Funding

The authors have been supported by the U.S. Department of Energy, National Nuclear Security Administration, Office of Defense Programs, with the LLNL authors supported under contract no. DE-AC52-07NA27344, the LANL authors under Contract No. DE-AC52-06NA25396, the NNSS authors under contract no. DE-NA0003624 and the Sandia authors under contract DE-NA0003525.

Acknowledgments

The U.S. Government retains and the publisher, by accepting the article for publication, acknowledges that the U.S. Government retains a non-exclusive, paid-up, irrevocable, worldwide license to publish or reproduce the published form of this manuscript, or allow others to do so, for United States Government purposes. The U.S. Department of Energy will provide public access to these results of federally sponsored research in accordance with the DOE Public Access Plan (http://energy.gov/downloads/doe-public-access-plan). The views expressed in the article do not necessarily represent the views of the U.S. Department of Energy or the United States Government. DOE/NV/03624-0095.

Conflicts of Interest

The authors declare no conflict of interest. The funding sponsors had no role in the design of the study; in the collection, analyses, or interpretation of data; in the writing of the manuscript, or in the decision to publish the results.

References

  1. Bailey, J.; Rochau, G.; Iglesias, C.; Abdallah, J.; MacFarlane, J.; Golovkin, I.; Wang, P.; Mancini, R.; Lake, P.; Moore, T.; et al. Iron-plasma transmission measurements at temperatures above 150 eV. Phys. Rev. Lett. 2007, 99, 265002. [Google Scholar] [CrossRef] [PubMed]
  2. Bailey, J.; Nagayama, T.; Loisel, G.; Rochau, G.; Blancard, C.; Colgan, J.; Cosse, P.; Faussurier, G.; Fontes, C.; Gilleron, F.; et al. A higher-than-predicted measurement of iron opacity at solar interior temperatures. Nature 2015, 517, 56–59. [Google Scholar] [CrossRef] [PubMed]
  3. Heeter, R.; Bailey, J.; Craxton, R.; DeVolder, B.; Dodd, E.; Garcia, E.; Huffman, E.; Iglesias, C.; King, J.; Kline, J.; et al. Conceptual design of initial opacity experiments on the national ignition facility. J. Plasma Phys. 2017, 83, 595830103. [Google Scholar] [CrossRef]
  4. Perry, T.; Heeter, R.; Opachich, Y.; Ross, P.; Kline, J.; Flippo, K.; Sherrill, M.; Dodd, E.; DeVolder, B.; Cardenas, T.; et al. Replicating the Z iron opacity experiments on the NIF. High Energy Density Phys. 2017, 23, 223–227. [Google Scholar] [CrossRef]
  5. Moses, E.; Wuest, C. The national ignition facility: Laser performance and first experiments. Fusion Sci. Technol. 2005, 47, 314–322. [Google Scholar] [CrossRef]
  6. Haynam, C.; Wegner, P.; Auerbach, J.; Bowers, M.; Dixit, S.; Erbert, G.; Heestand, G.; Henesian, M.; Hermann, M.; Jancaitis, K.; et al. National ignition facility laser performance status. Appl. Opt. 2007, 46, 3276–3303. [Google Scholar] [CrossRef] [PubMed]
  7. Perry, T.; Budil, K.; Cauble, R.; Ward, R.; Bach, D.; Iglesias, C.; Wilson, B.; Nash, J.; Smith, C.; Foster, J.; et al. Quantitative measurement of mid-z opacities. J. Quant. Spectrosc. Radiat. Transf. 1995, 54, 317–324. [Google Scholar] [CrossRef]
  8. Bailey, J.; Rochau, G.; Mancini, R.; Iglesias, C.; MacFarlane, J.; Golovkin, I.; Blancard, C.; Cosse, P.; Faussurier, G. Experimental investigation of opacity models for stellar interior, inertial fusion, and high energy density plasmas. Phys. Plasmas 2009, 16, 058101. [Google Scholar] [CrossRef]
  9. Dodd, E.S.; DeVolder, B.G.; Martin, M.E.; Krasheninnikova, N.S.; Tregillis, I.L.; Perry, T.S.; Heeter, R.F.; Opachich, Y.P.; Moore, A.S.; Kline, J.L.; et al. Hohlraum modeling for opacity experiments on the National Ignition Facility. Phys. Plasmas 2018, 25, 063301. [Google Scholar] [CrossRef] [Green Version]
  10. Cardenas, T.; Schmidt, D.; Dodd, E.; Perry, T.; Capelli, D.; Quintana, J.; Oertel, J.; Peterson, D.; Giraldez, E.; Heeter, R. Design and fabrication of opacity targets for the national ignition facility. Fusion Sci. Technol. 2017, 73, 458–466. [Google Scholar] [CrossRef]
  11. Opachich, Y.; Heeter, R.; Barrios, M.; Garcia, E.; Craxton, R.; King, J.; Liedahl, A.; McKenty, P.; Schneider, M.; May, M.; et al. Capsule implosions for continuum X-ray backlighting of opacity samples at the national ignition facility. Phys. Plasmas 2017, 24, 063301. [Google Scholar] [CrossRef] [PubMed]
  12. Ross, P.; Heeter, R.; Ahmed, M.; Dodd, E.; Huffman, E.; Liedahl, D.; King, J.; Opachich, Y.; Schneider, M.; Perry, T. Design of the opacity spectrometer for opacity measurements at the national ignition facility. Rev. Sci. Instrum. 2016, 87, 11D623. [Google Scholar] [CrossRef] [PubMed]
  13. King, J.A.; Opachich, Y.P.; Huffman, E.J.; Knight, R.; Heeter, R.F.; Ahmed, M.F.; Liedahl, D.A.; Schneider, M.B.; Thompson, N.B.; Johns, H.M.; et al. Implementation of a 1–2 keV Point-Projection X-ray Spectrometer on the National Ignition Facility. Rev. Sci. Instrum. 2018, 89, 10F101. [Google Scholar] [CrossRef]
  14. Perry, T.; Heeter, R.; Opachich, Y.; King, J.; Dodd, E.; DeVolder, B.; Sherrill, M.; Wilson, B.; Iglesias, C.; Kline, J.; et al. Update on the Iron Opacity Experiments on the NIF. Workshop Astrophys. Opacities 2018, 515, 115–122. [Google Scholar]
  15. Nagayama, T.; Bailey, J.; Loisel, G.; Hansen, S.; Rochau, G.; Mancini, R.; MacFarlane, J.; Golovkin, I. Control and diagnosis of temperature, density, and uniformity in X-ray heated iron/magnesium samples for opacity measurements. Phys. Plasmas 2014, 21, 056502. [Google Scholar] [CrossRef]
  16. Meadowcroft, A.L.; Bentley, C.D.; Stott, E.N. Evaluation of the sensitivity and fading characteristics of an image plate system for X-ray diagnostics. Rev. Sci. Instrum. 2008, 79, 113102. [Google Scholar] [CrossRef] [PubMed]
  17. Haugh, M.; Lee, J.; Romano, E.; Schneider, M.; Bell, P.; Grim, G. Calibrating image plate sensitivity in the 700 to 5000 eV spectral energy range. Proc. SPIE 2013, 8850, 885007. [Google Scholar]
  18. Lanier, N.; Hamilton, C.; Taccetti, J. A monochromatic x-ray imaging system for characterizing low-density foams. Rev. Sci. Instrum. 2012, 83, 10E521. [Google Scholar] [CrossRef] [PubMed]
  19. Beeman, B.; Moore, A.; Wargo, A.; Bell, P.; Widmann, W.; Clancy, T.; Barbosa, F.; Prat, B.; Allouche, V.; Koch, J.; et al. Recording system upgrade for the dante X-ray diagnostic on the national ignition facility. Proc. SPIE 2017, 10390, 1039005. [Google Scholar]
  20. Kline, J.; Widmann, K.; Warrick, A.; Olson, R.; Thomas, C.; Moore, A.; Suter, L.; Landen, O.; Callahan, D.; Azevedo, S.; et al. The first measurements of soft X-ray flux from ignition scale hohlraums at the national ignition facility using dante (invited). Rev. Sci. Instrum. 2010, 81, 10E321. [Google Scholar] [CrossRef] [PubMed]
  21. Dewald, E.L.; Campbell, K.M.; Turner, R.E.; Holder, J.P.; Landen, O.L.; Glenzer, S.H.; Kauffman, R.L.; Suter, L.J.; Landon, M.; Rhodes, M.; et al. Dante soft X-ray power diagnostic for national ignition facility. Rev. Sci. Instrum. 2004, 75, 3759–3761. [Google Scholar] [CrossRef]
  22. Kornblum, H.N.; Kauffman, R.L.; Smith, J.A. Measurement of 0.1–3-kev X-rays from laser plasmas. Rev. Sci. Instrum. 1986, 57, 2179–2181. [Google Scholar] [CrossRef]
  23. Nagayama, T.; Bailey, J.; Loisel, G.; Rochau, G.; MacFarlane, J.; Golovkin, I. Numerical investigations of potential systematic uncertainties in iron opacity measurements at solar interior temperatures. Phys. Rev. E 2017, 95, 063206. [Google Scholar] [CrossRef] [PubMed]
  24. Williams, G.J.; Maddox, B.R.; Chen, H.; Kojima, S.; Millecchia, M. Calibration and equivalency analysis of image plate scanners. Rev. Sci. Instrum. 2014, 85, 11E604. [Google Scholar] [CrossRef] [PubMed]
  25. Maddox, B.; Park, H.; Remington, B.; Izumi, N.; Chen, S.; Chen, C.; Kimminau, G.; Ali, Z.; Haugh, M.; Ma, Q. High-energy X-ray backlighter spectrum measurements using calibrated image plates. Rev. Sci. Instrum. 2011, 82, 023111. [Google Scholar] [CrossRef] [PubMed]
  26. Burkhalter, P.G.; Brown, D.B.; Gersten, M. A high-resolution X-ray diagnostic technique using simultaneous diffraction from several planes of acid phthalate crystals. J. Appl. Phys. 1981, 52, 4379–4386. [Google Scholar] [CrossRef]
  27. Anderson, S.; Heeter, R.; Booth, R.; Emig, J.; Fulkerson, S.; McCarville, T.; Norman, D.; Young, B. Broadband high-resolution elliptical crystal X-ray spectrometer for high energy density physics experiments. Rev. Sci. Instrum. 2006, 77, 063115. [Google Scholar] [CrossRef]
  28. Heeter, R.; Anderson, S.; Booth, R.; Brown, G.; Emig, J.; Fulkerson, S.; McCarville, T.; Norman, D.; Schneider, M.; Young, B. Ozspec-2: An improved broadband high-resolution elliptical crystal X-ray spectrometer for high-energy density physics experiments (invited). Rev. Sci. Instrum. 2008, 79, 10E303. [Google Scholar] [CrossRef] [PubMed]
  29. Loisel, G.P.; Lake, P.W.; Nielsen-Weber, L.B.; Wu, M.; Dunham, G.S.; Bailey, J.E.; Rochau, G.A. A compact multi-crystal-plane broad-band (0.5–17 keV) spectrometer. Rev. Sci. Instrum. 2018, 89, 10F117. [Google Scholar] [CrossRef]
Figure 1. Overview of the NIF Opacity experiment. (Left) Target configuration including capsule backlighter, collimator and hohlraum. The capsule backlighter is 12 mm below the collimator and 31 mm below the sample in the center of the hohlraum. (Right) Perspective of the DANTE-2 radiation flux measurement, viewing emission from the hohlraum interior through the 1 mm square aperture to left of hohlraum midplane. The position of the sample is also highlighted. Grid scale is 1 mm; hohlraum is 4–7 mm in diameter and 12 mm long with walls 0.03 mm thick.
Atoms 06 00057 g001
Figure 2. Laser pulse shapes used to drive the hohlraum from the OpSpec side (blue trace, 32 beams) and the backlighter side (red trace, 32 beams). The drive from the backlighter side is larger because the hohlraum diameter is larger on that side, by design.
Atoms 06 00057 g002
Figure 3. Time-resolved sample expansion measured from edge-on gated pinhole imager. (a) Diagnostic perspective with 1 mm grid; hohlraum has no internal features other than the planar foil sample. (b) X-ray images of emission within the 1 × 1 mm slots, filtered with 25 microns of Be, transmitting photon energies >~1000 eV, acquired at 4.3 ± 0.05 ns and 4.8 ± 0.05 ns with a gate width of 0.05–0.08 ns. Upper and middle images at each time are from adjacent pinholes gated 0.08 ns apart in time and with a slight difference in viewing angle (parallax); lower pinholes not shown. The horizontal line across each image is the sample self-emission.
Atoms 06 00057 g003
Figure 4. The top plot (a) in color and the middle plot (b) in grayscale show the same data: point-projection X-ray spectrogram from the both upper and lower channels of the NIF opacity spectrometer on shot N171214-001, including the 2 mm physical gap between the channels. The bottom plot (c) provides an enlargement of the backlighter (V) and Absorption (U) regions from the upper channel of (b), with a higher-contrast grayscale used to highlight the most prominent iron L-shell and magnesium K-shell features. In (a,b), dashed lines illustrate the bands used to extract lineouts of absorption (red, U), backlighter (blue, V), self-emission background (green, E) and diffuse background (black, two places, G) from the lower channel. Signal is reported in photo-stimulated luminescence units (PSL) from the image plate detectors. For X-rays below 2 keV, the PSL signal has been found to be proportional to fluence in eV/μm2 [16,17].
Atoms 06 00057 g004aAtoms 06 00057 g004b
Figure 5. Comparison of transmission spectra inferred from the upper (blue) and lower (black) image plates (Figure 3) using distinct background subtraction methods; also plotted is the absolute difference between the two methods (red trace at bottom of plot). Key spectral features are labeled, including four prominent Mg K-shell transitions (marked Mg He-α, -β, -γ, and Ly-α, and three sets of 2p-4d transitions in Ne-, F-, and O-like Fe (marked 16+, 17+, 18+, respectively). Differences in transmission at lower photon energy are primarily due to the different approaches to subtracting highly uncertain instrument backgrounds.
Atoms 06 00057 g005
Figure 6. Lineouts from (a) upper channel and (b) lower channel of OpSpec on shot N171214-001, after subtracting the diffuse background. Lineouts V, U, and E correspond to regions in Figure 4. Vertical dashed lines mark key features, from left to right: Fe L-shell feature at 1100 eV, Mg He-α doublet at 1343 and 1352 eV, Mg Ly-α at 1472 eV, Al filter K-edge at 1559.6 (spectral fiducial), Mg He-γ feature at 1658 eV, and the Rb L-edge drop in crystal reflectivity at 1804 eV (spectral fiducial). Many Fe L-shell features are visible between 900 and 1300 eV as noted in Figure 5; however, the sharpest feature in this band, at ~1050 eV, is the result of a mechanical glitch in the scanner.
Atoms 06 00057 g006
Figure 7. Transmission levels inferred from (a) the upper channel and (b) the lower channel of the opacity spectrometer on shot N171214-001. Statistical 1σ uncertainty bounds are also shown, both as magenta bars (spaced every 20 points) and as the red traces. Principal X-ray features were labeled in Figure 5. The sharp spike in (a) near 1050 eV is the effect of the scanner glitch in Figure 6. Systematic uncertainty bounds are not shown here but are discussed in the text.
Atoms 06 00057 g007
Table 1. Statistical uncertainty sources in transmission spectra, with the 1σ magnitudes given both pixel-to-pixel on the image, and in the final transmission analysis from Section 4.
SourceMeasured FromUncertainty (Pixel-to-Pixel)Uncertainty (Transmission)
Photon statisticsPhotometric calculation1%0.1–0.3%
IP uniformityPixel-to-pixel variation at constant hυ~3–10%~1–4%
Digitization noiseScan to scan variation of spectra <3%<1%
Table 2. Principal sources of systematic error and estimated magnitude in transmission spectra.
SourceQuantified byEst. Uncertainty (Transmission)
Uncertainty in subtraction of diffuse scattering/fluorescence backgroundVarying subtraction method within plausible bounds0.02 (E > 1.4 keV) to 0.2 (E < 1.2 keV)
Alternate crystal planesObservation of step-ups in data, particularly off-crystal perimeter data Texture from ends of crystal with known defects0.1 for E < 1.3 keV
Higher-order diffraction for (001)Approximate calculation using data on RbAP reflectivity, filter transmission and backlighter spectral shape0.02 for T = 0.8, 0.08 for T = 0.1
Other error sourcesNot yet quantifiedUnknown, but expect <0.05

