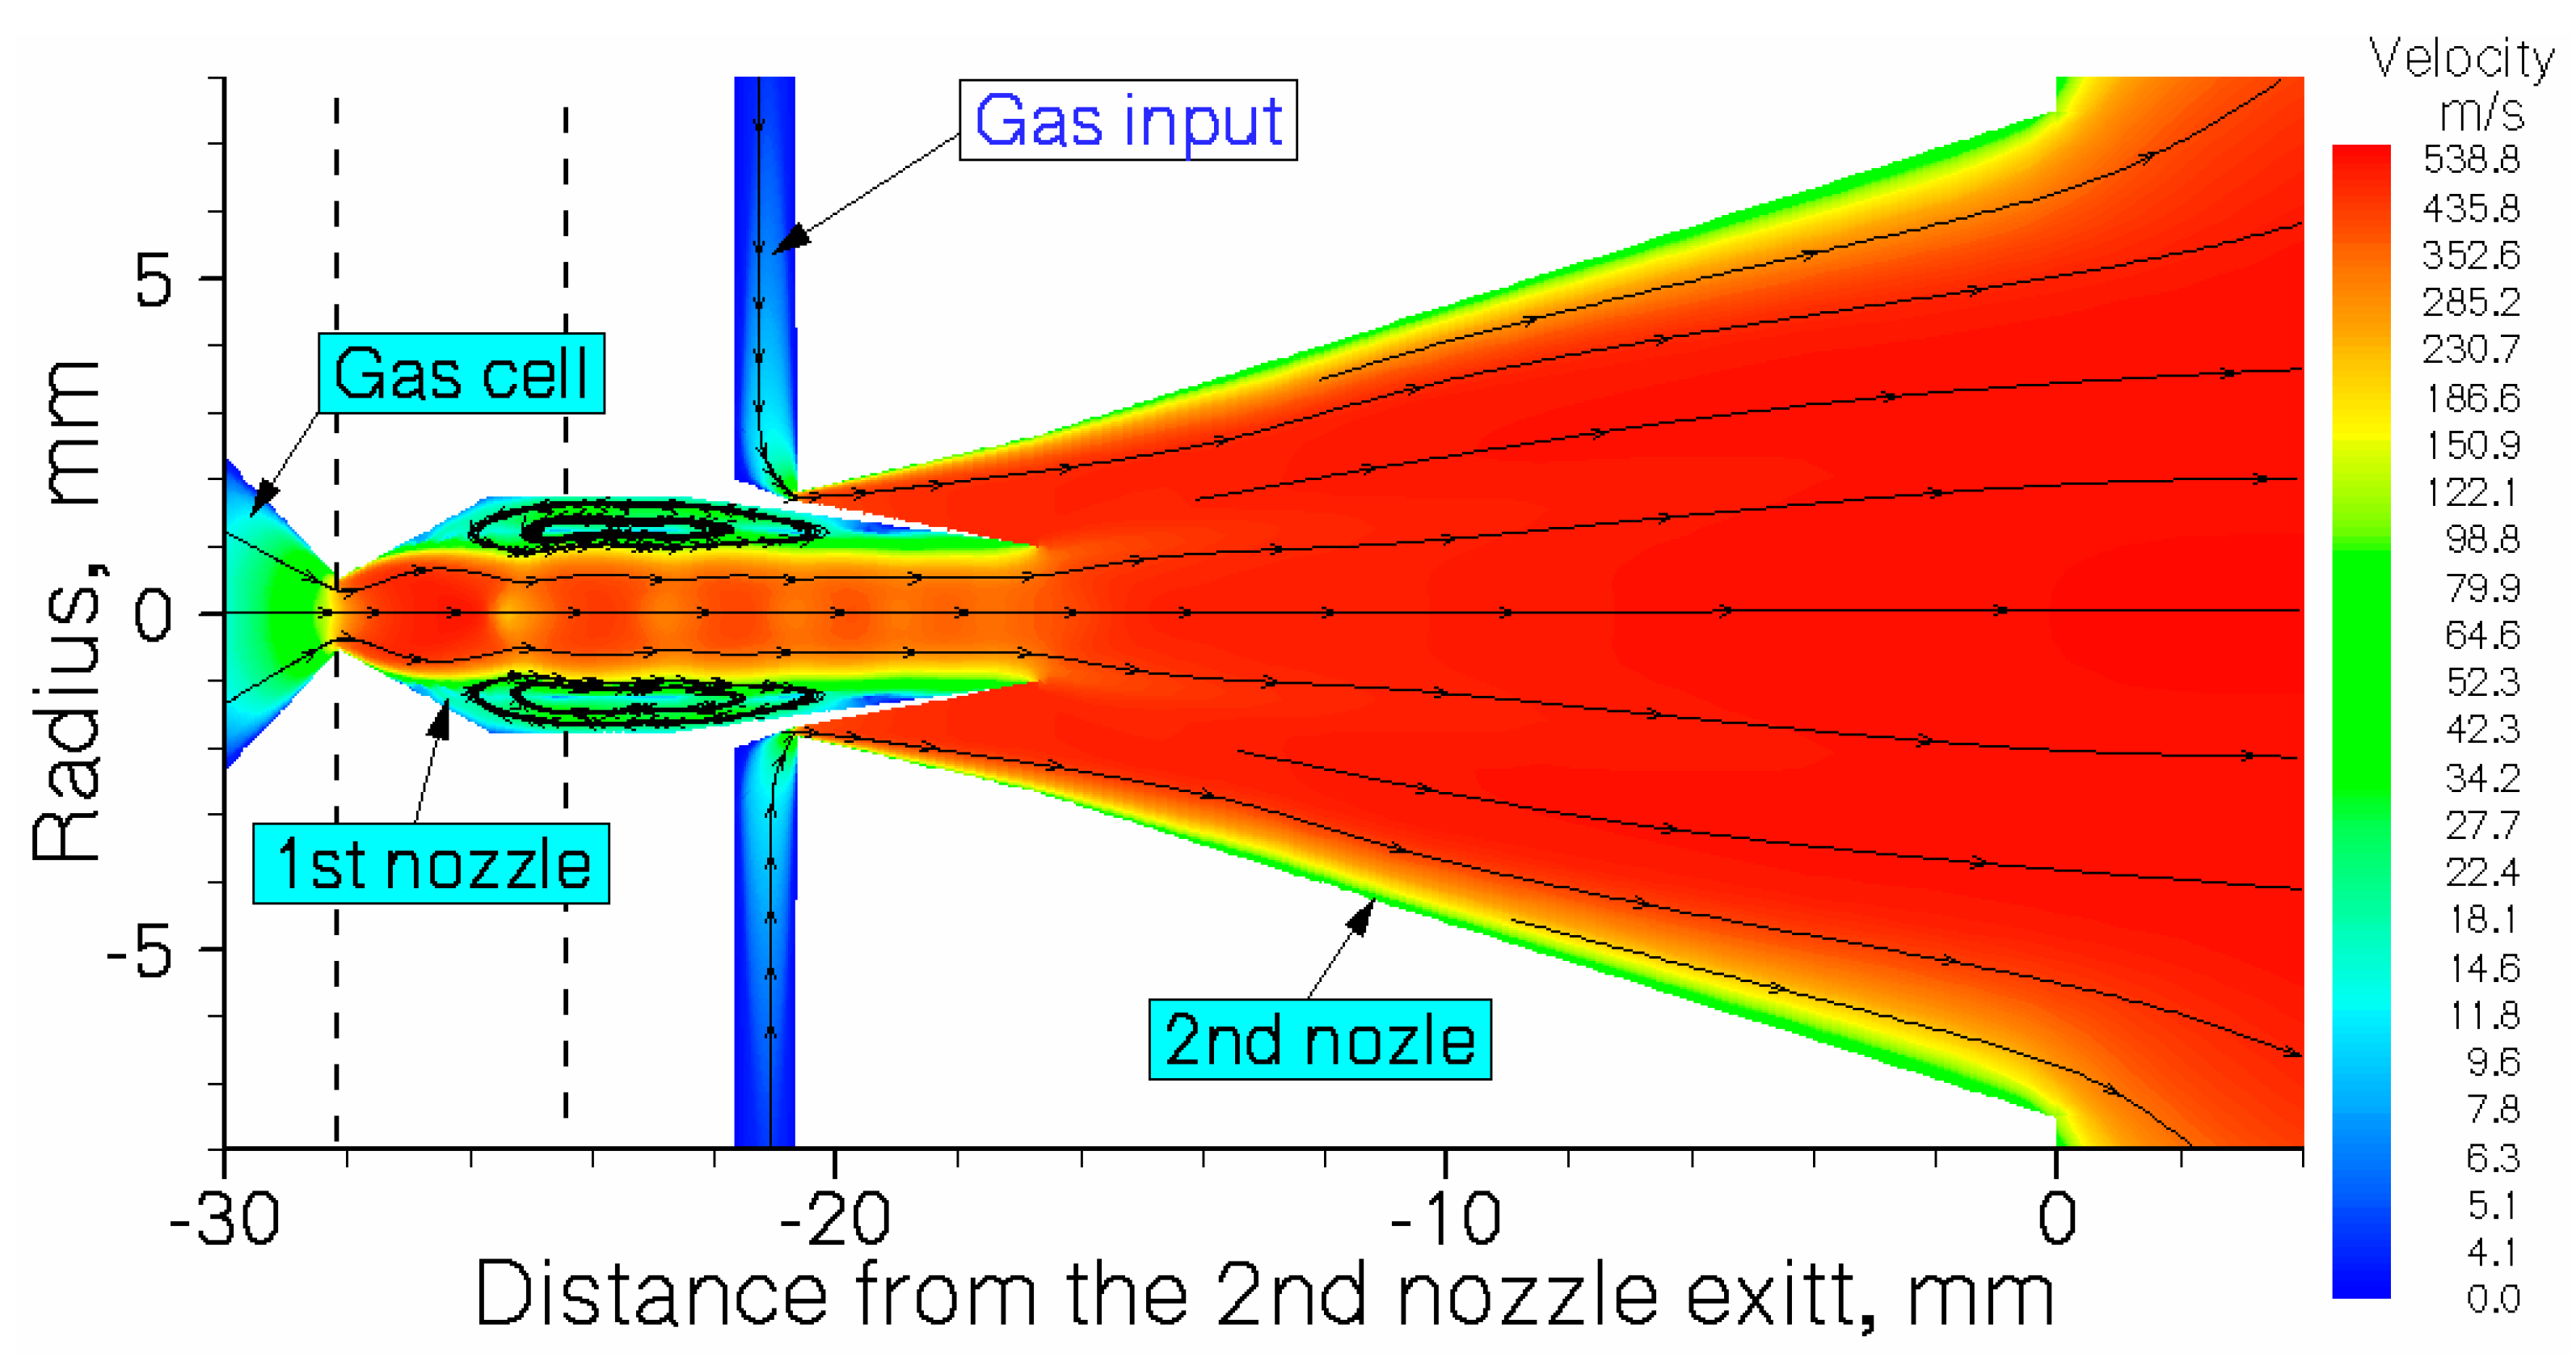
Figure 1.
Schematic view of the double-nozzle design combined with results of the gas dynamic simulation for argon velocity flow field. The stagnation gas cell pressure is Pcell = 100 mbar, gas input (stagnation) pressure is P
noz = 81 mbar, and background pressure in the vacuum gas-jet chamber is P
bg = 2.0 × 10
−2 mbar for the pumping capacity of 1300 L/s. The temperature of the gas cell and both nozzles is 296 K. Black-arrowed lines show the gas flow directions. Two black-dashed vertical lines designate a possible connection of flanges for assembling this double-nozzle device. For details of the design see Table 1 in [
1].
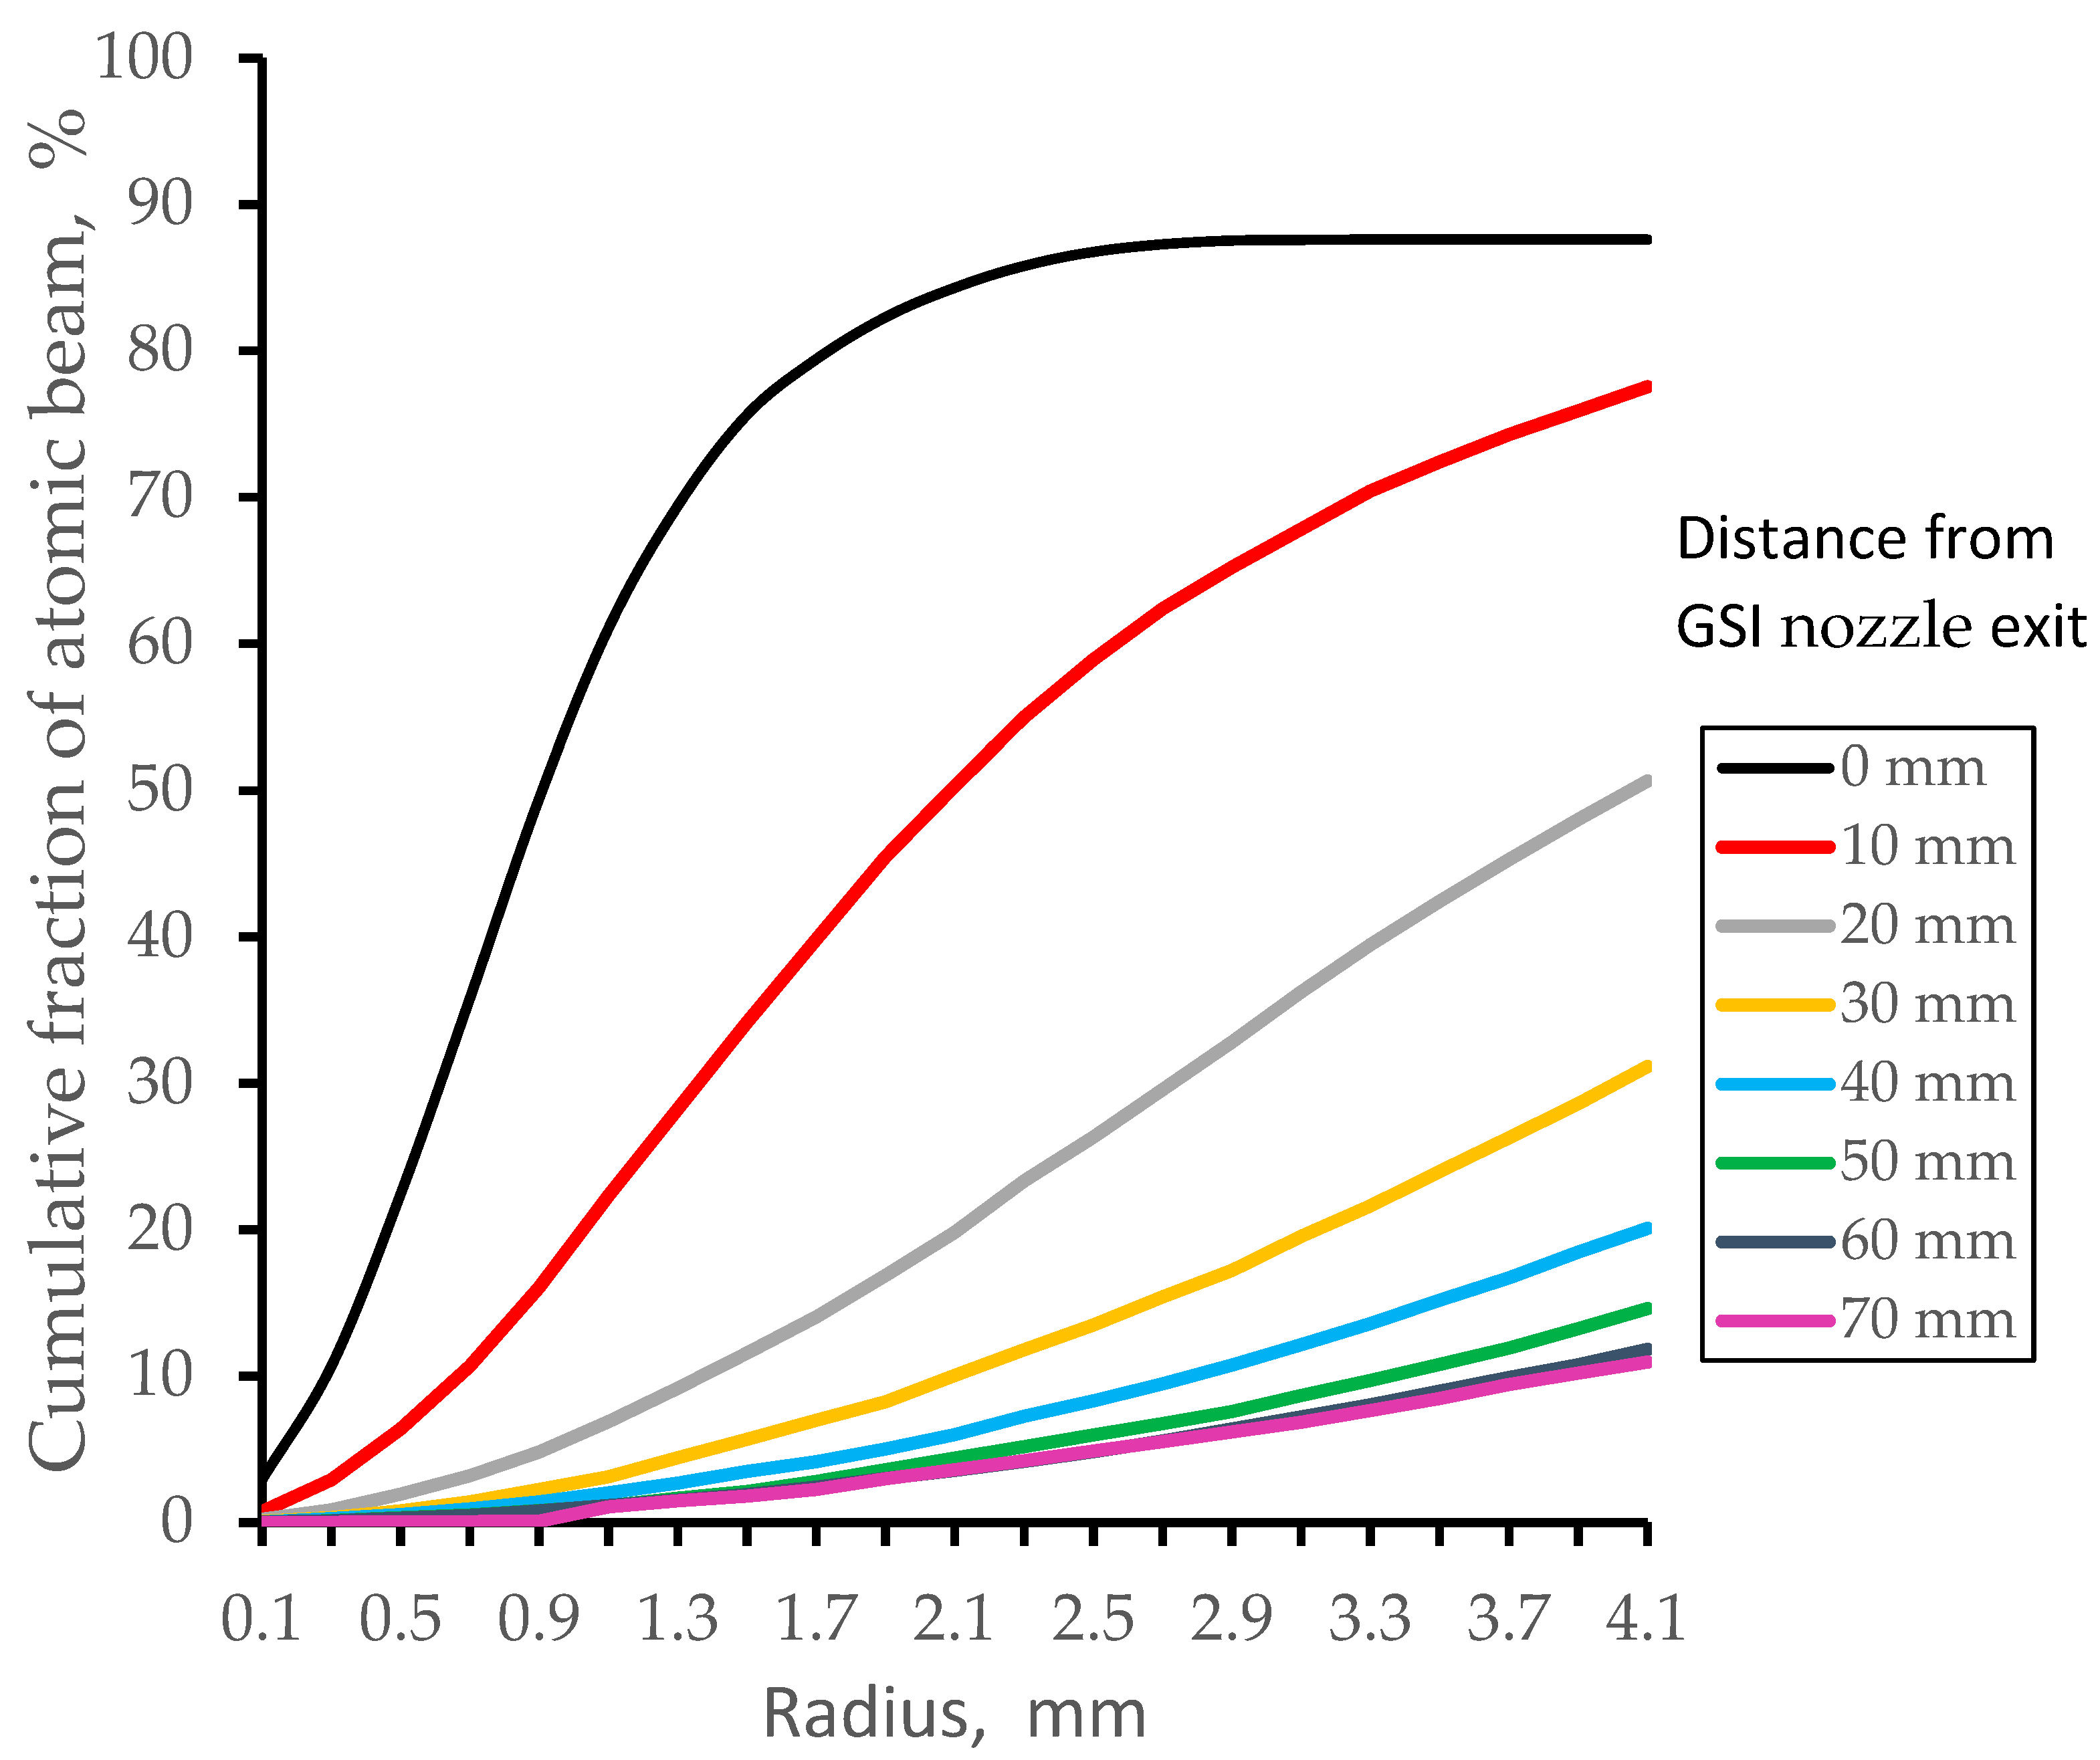
Figure 2.
Simulation results for cumulative fractions of nobelium-254 atomic beam inside a diameter of 8 mm (the Laser-1’s beam diameter) for different downstream distances from the GSI nozzle exit. “Cumulative fraction” here means fraction of all nobelium atoms extracted by the gas flow from the gas-stopping cell. Stagnation gas cell pressure is Pcell = 100 mbar; pumping capacity of the turbo molecular pump for the gas-jet chamber is 1300 L/s.
Figure 3.
Schematic view of the full version of the double-nozzle technique combined with the gas dynamic simulation results for argon velocity flow field. The stagnation gas cell pressure is Pcell = 300 mbar, gas input (stagnation) pressure is Pnoz = 200 mbar, and background pressure in the gas-jet chamber is Pbg = 5.1 × 10⁻² mbar for the pumping capacity of 1300 L/s. The temperature of the gas cell and nozzles is 296 K. Black-arrowed lines show the gas-flow direction.
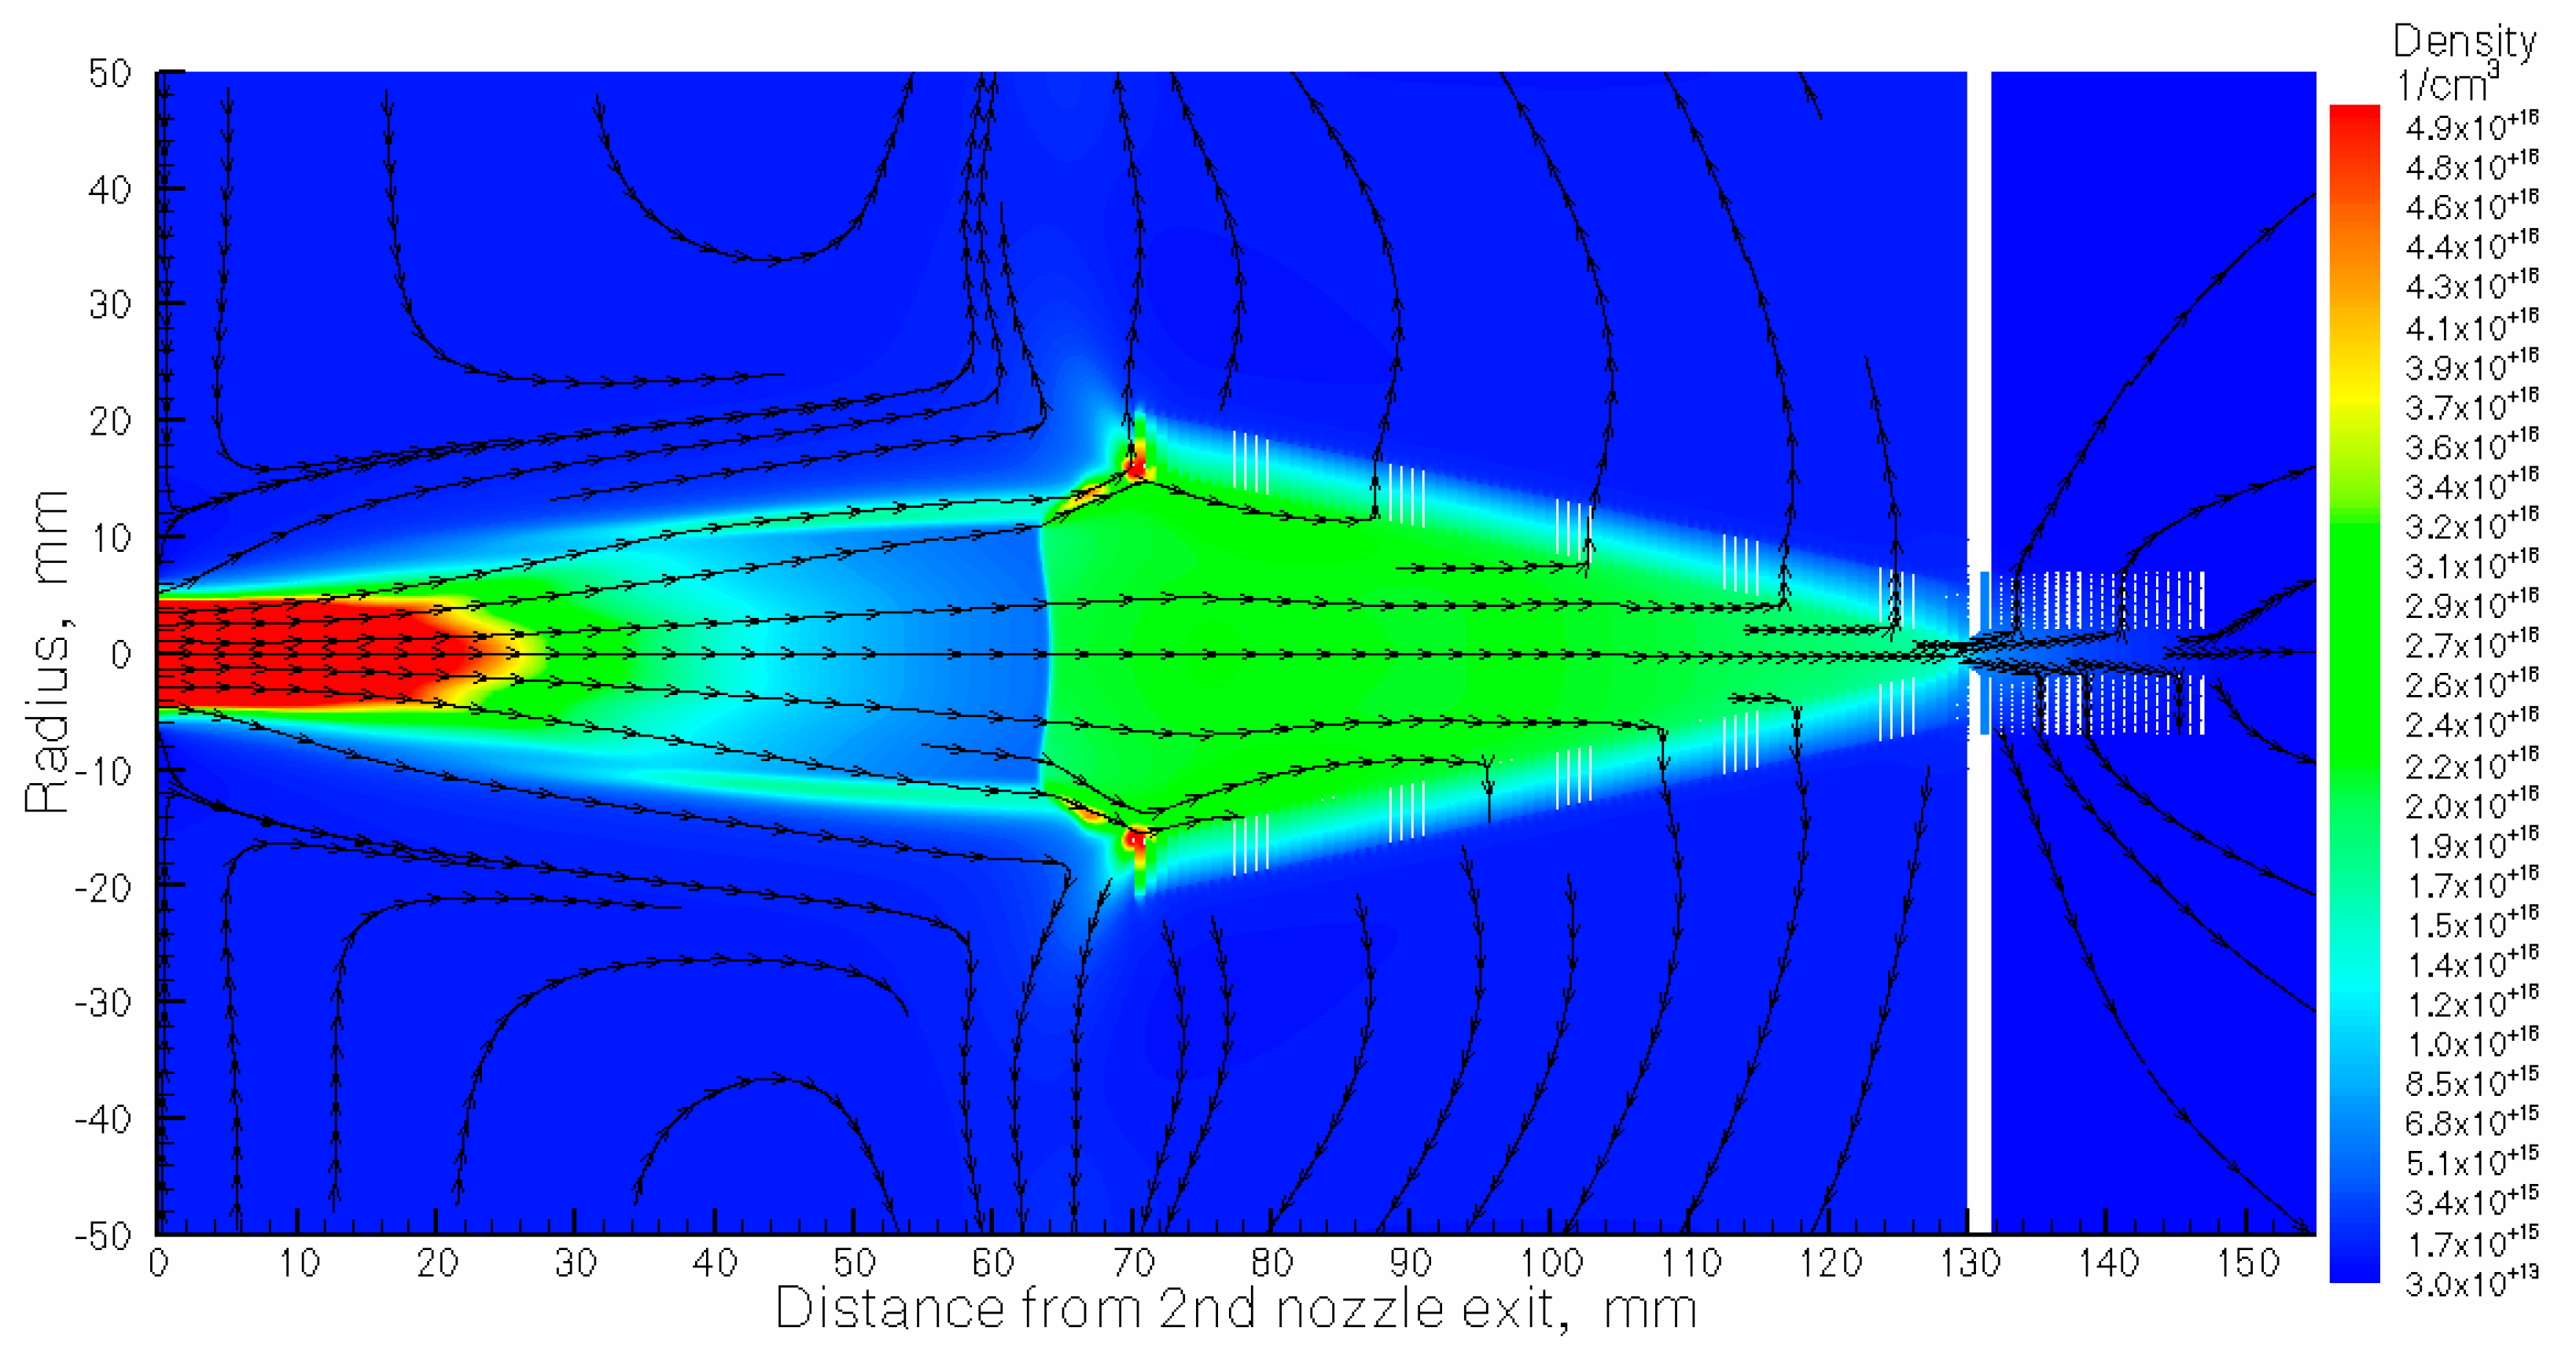
Figure 4.
Results of the gas dynamic simulation for argon density flow field. The stagnation gas-cell pressure Pcell = 300 mbar, gas input (stagnation) pressure Pnoz = 200 mbar, and background pressure in the gas-jet chamber Pbg = 5.1 × 10⁻² mbar for the pumping capacity of 1300 L/s. The temperature of the gas cell and nozzles is 296 K. Black-arrowed lines show the gas flow direction.
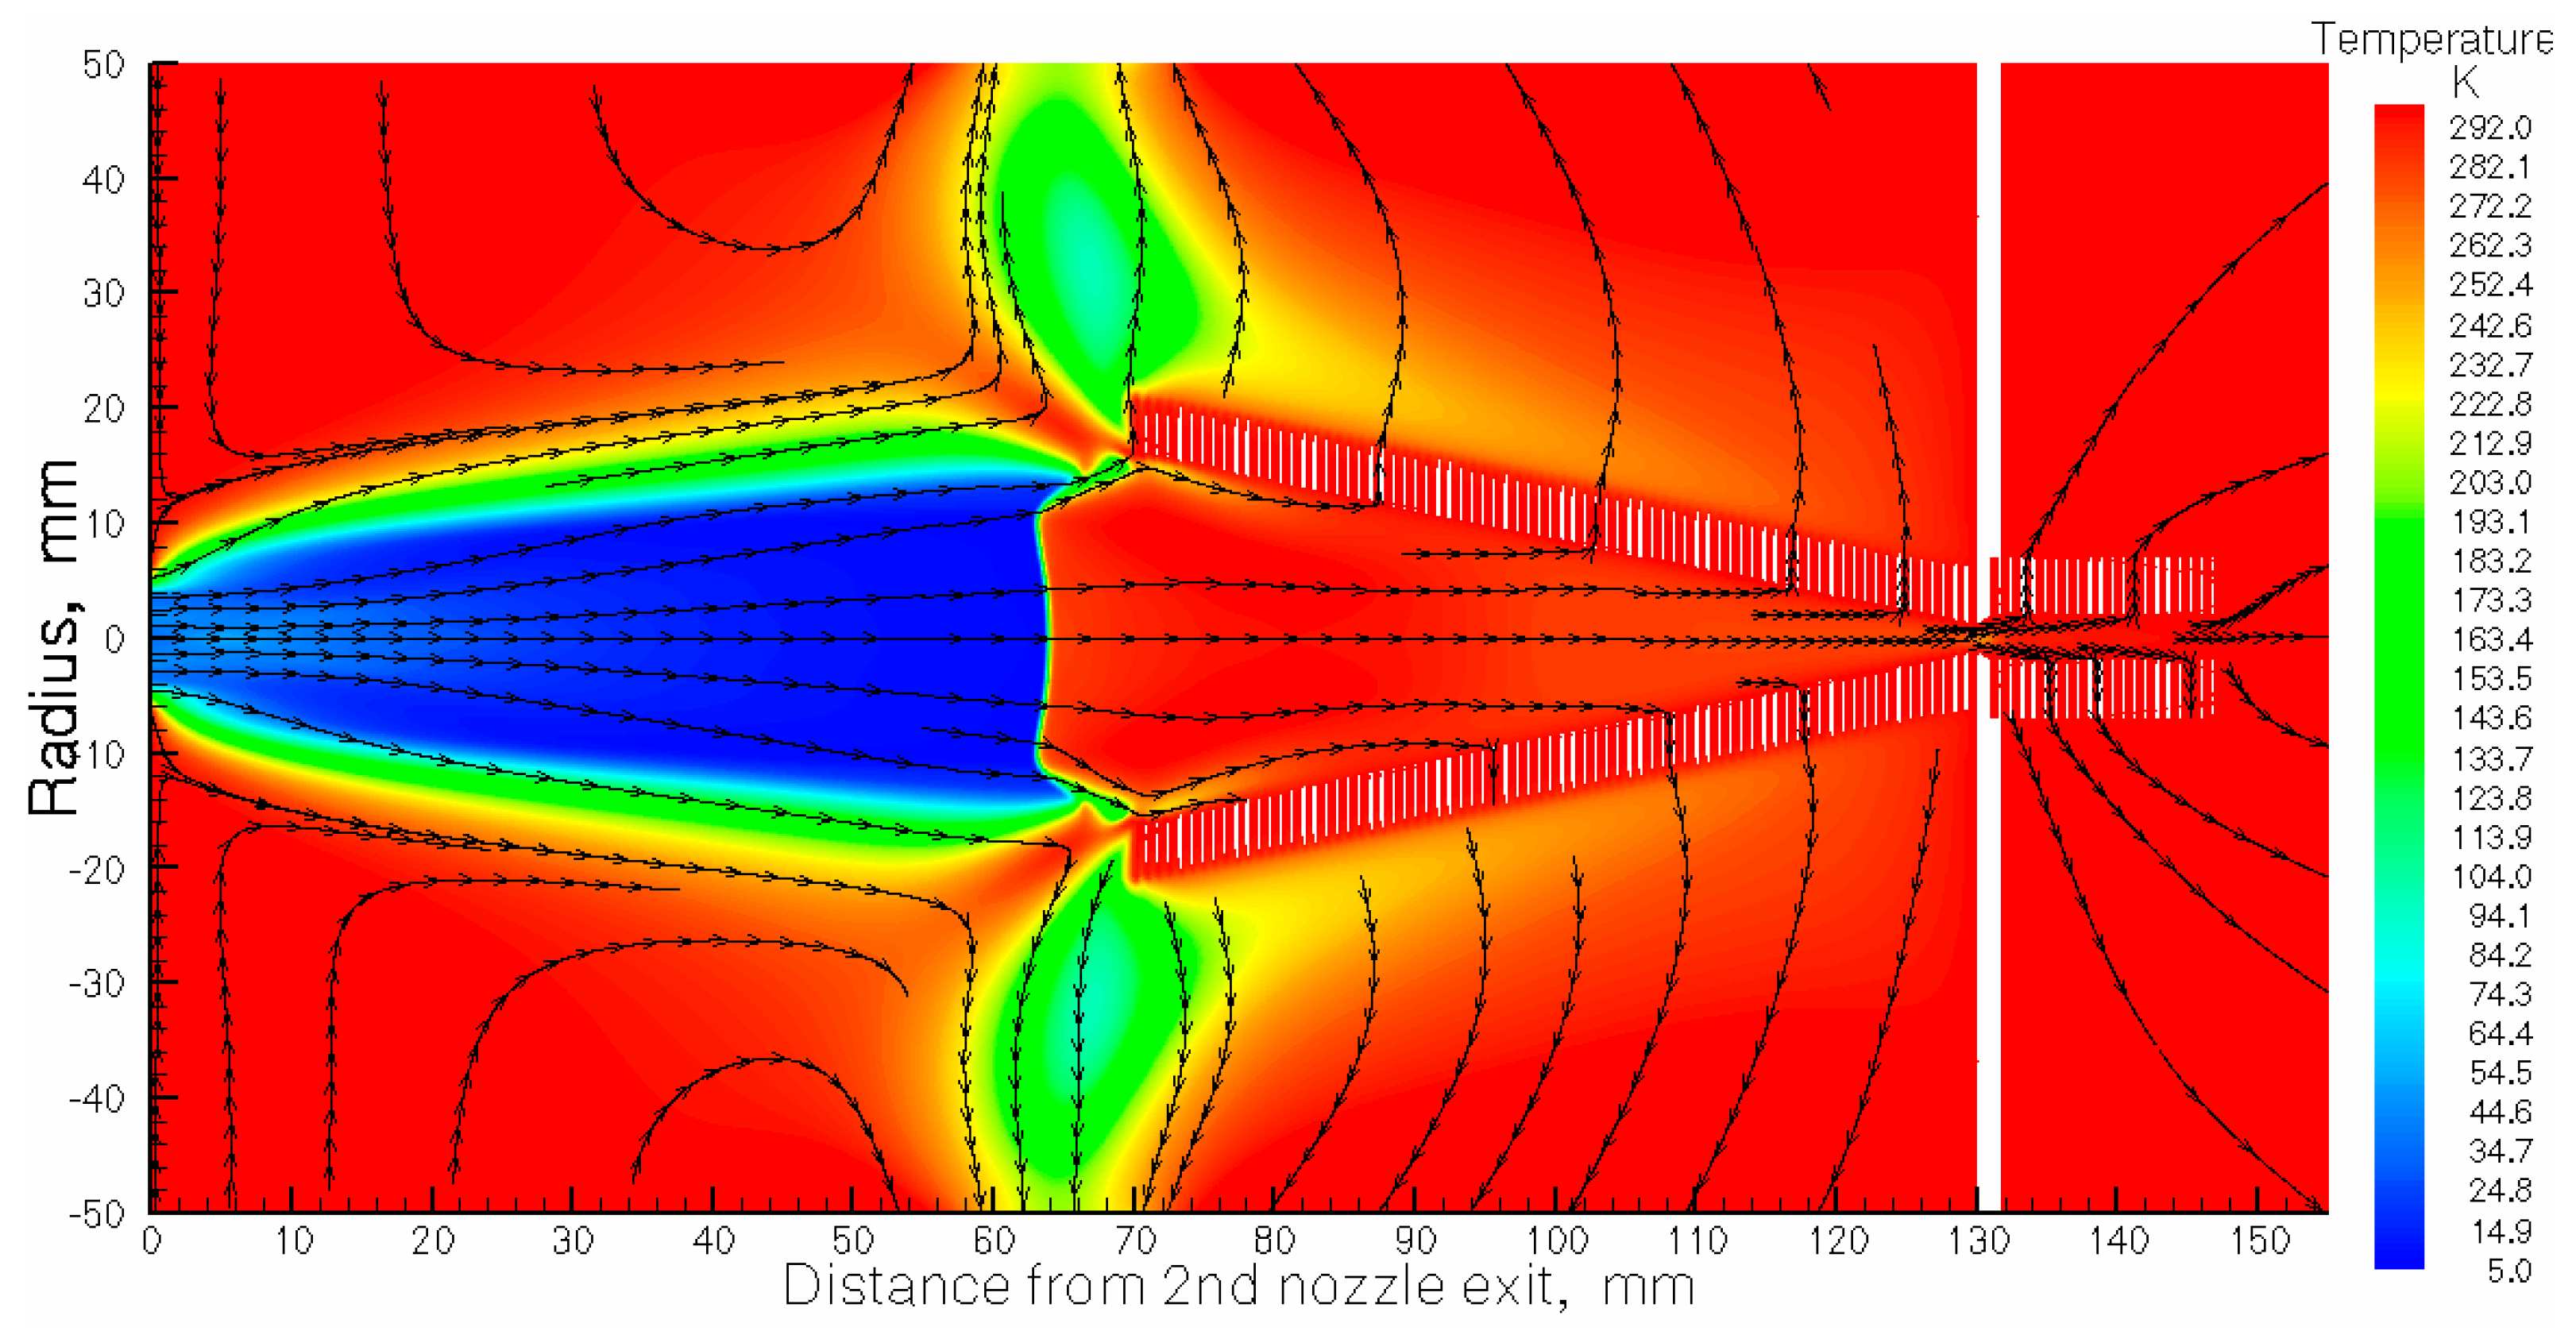
Figure 5.
Results of the gas dynamic simulation for the argon temperature flow field. The stagnation gas cell pressure Pcell = 300 mbar, gas input (stagnation) pressure Pnoz = 200 mbar, and background pressure in the gas-jet chamber Pbg = 5.1 × 10⁻² mbar for the pumping capacity of 1300 L/s. The temperature of the gas cell and nozzles is 296 K. Black-arrowed lines show the gas flow direction.
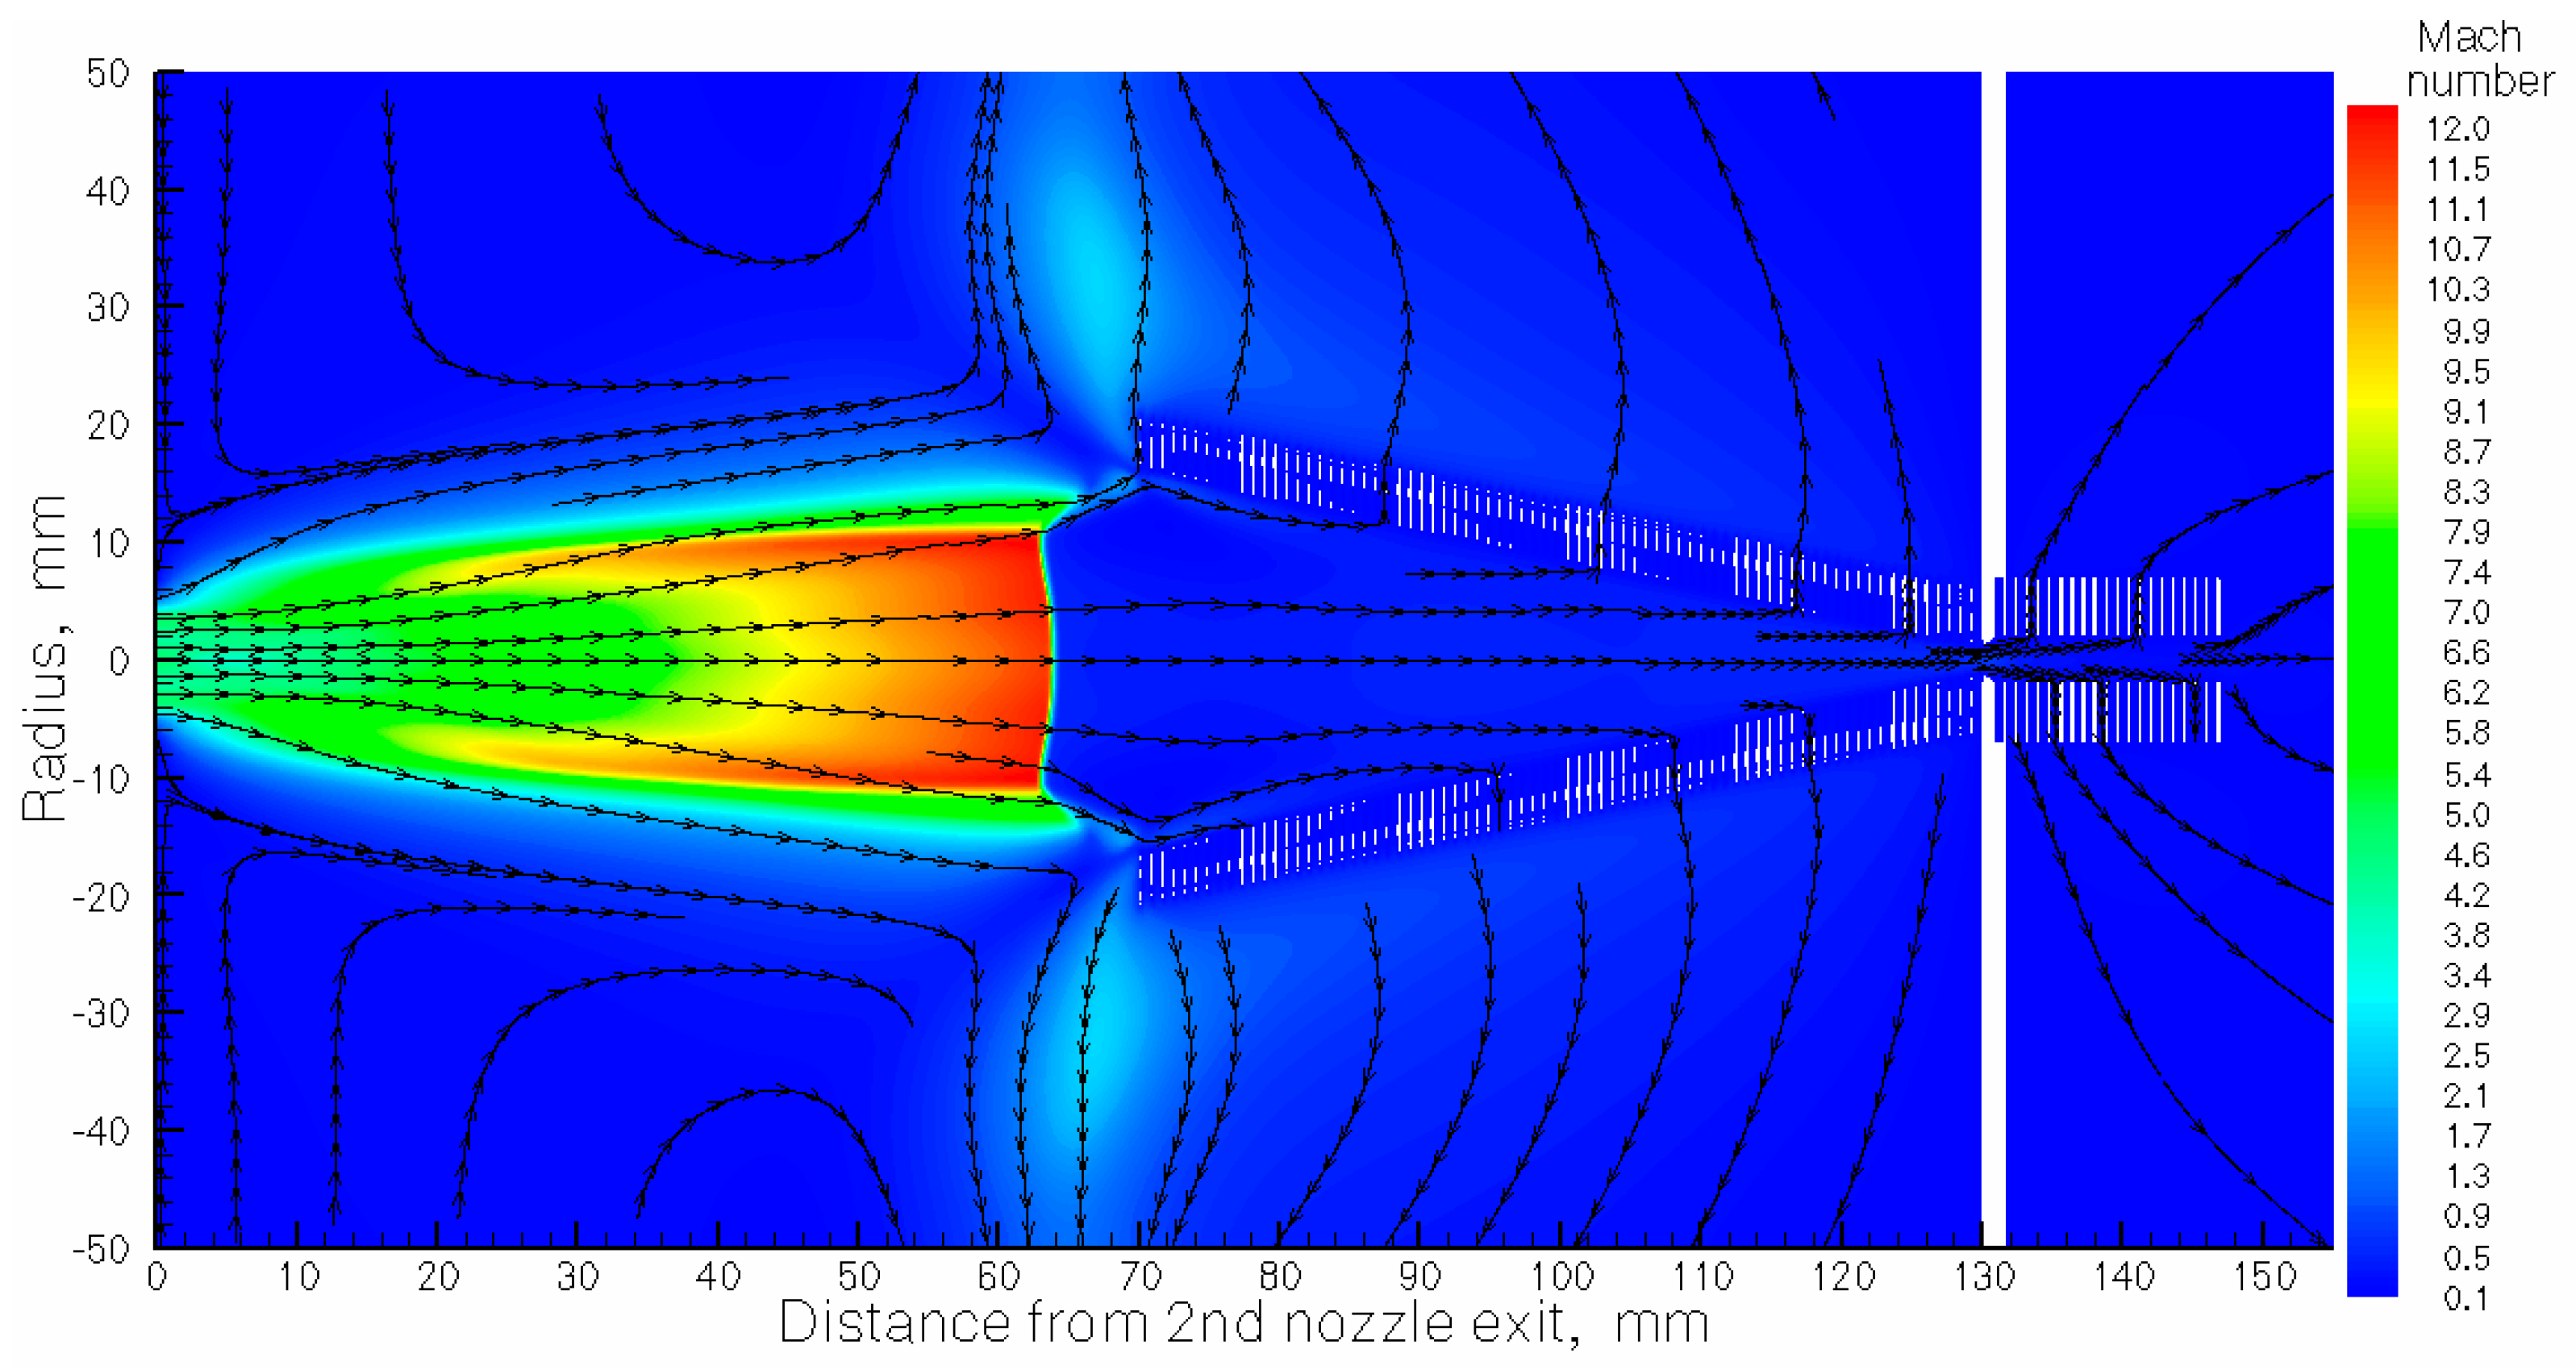
Figure 6.
Results of the gas dynamic simulation for the argon Mach number flow field. The stagnation gas cell pressure Pcell = 300 mbar, gas input (stagnation) pressure Pnoz = 200 mbar, and background pressure in the gas-jet chamber Pbg = 5.1 × 10⁻² mbar for the pumping capacity of 1300 L/s. The temperature of the gas cell and nozzles is 296 K. Black-arrowed lines show the gas flow direction.
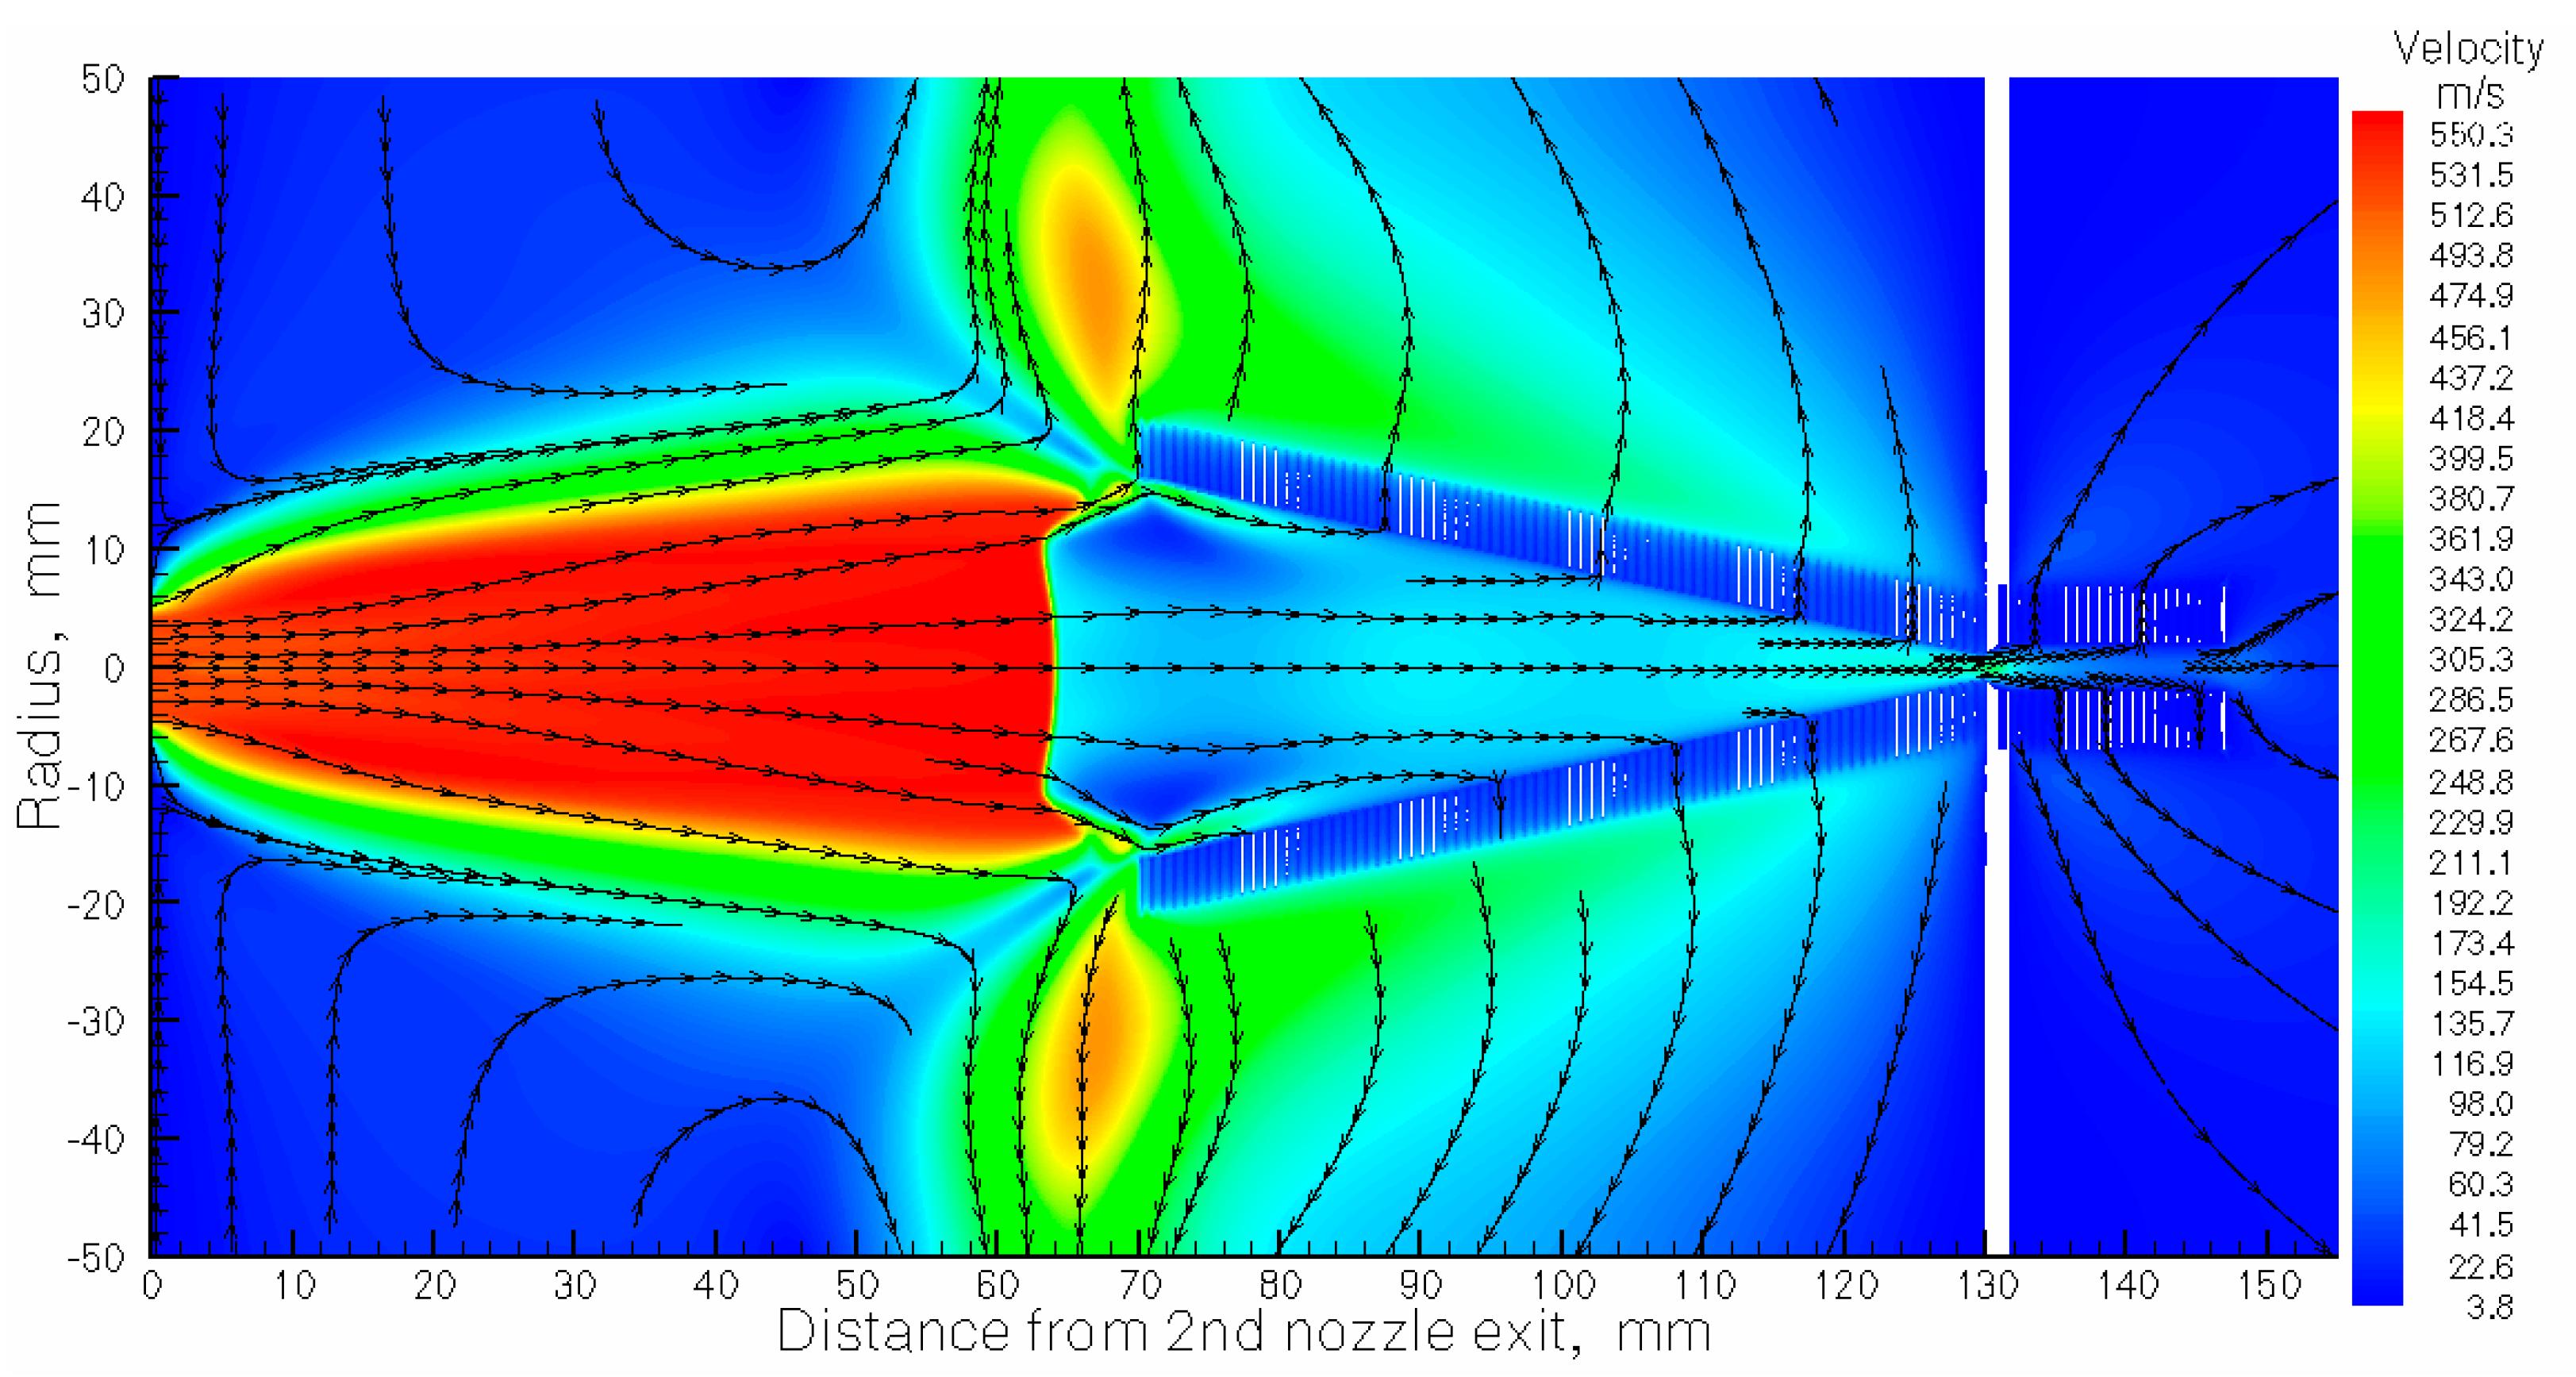
Figure 7.
Results of the gas dynamic simulation for the argon velocity flow field. The stagnation gas cell pressure Pcell = 300 mbar, gas input (stagnation) pressure Pnoz = 200 mbar, background pressure in the gas-jet chamber Pbg = 5.1 × 10⁻² mbar for the pumping capacity of 1300 L/s. The temperature of the gas cell and nozzles is 296 K. Black-arrowed lines show the gas flow direction.
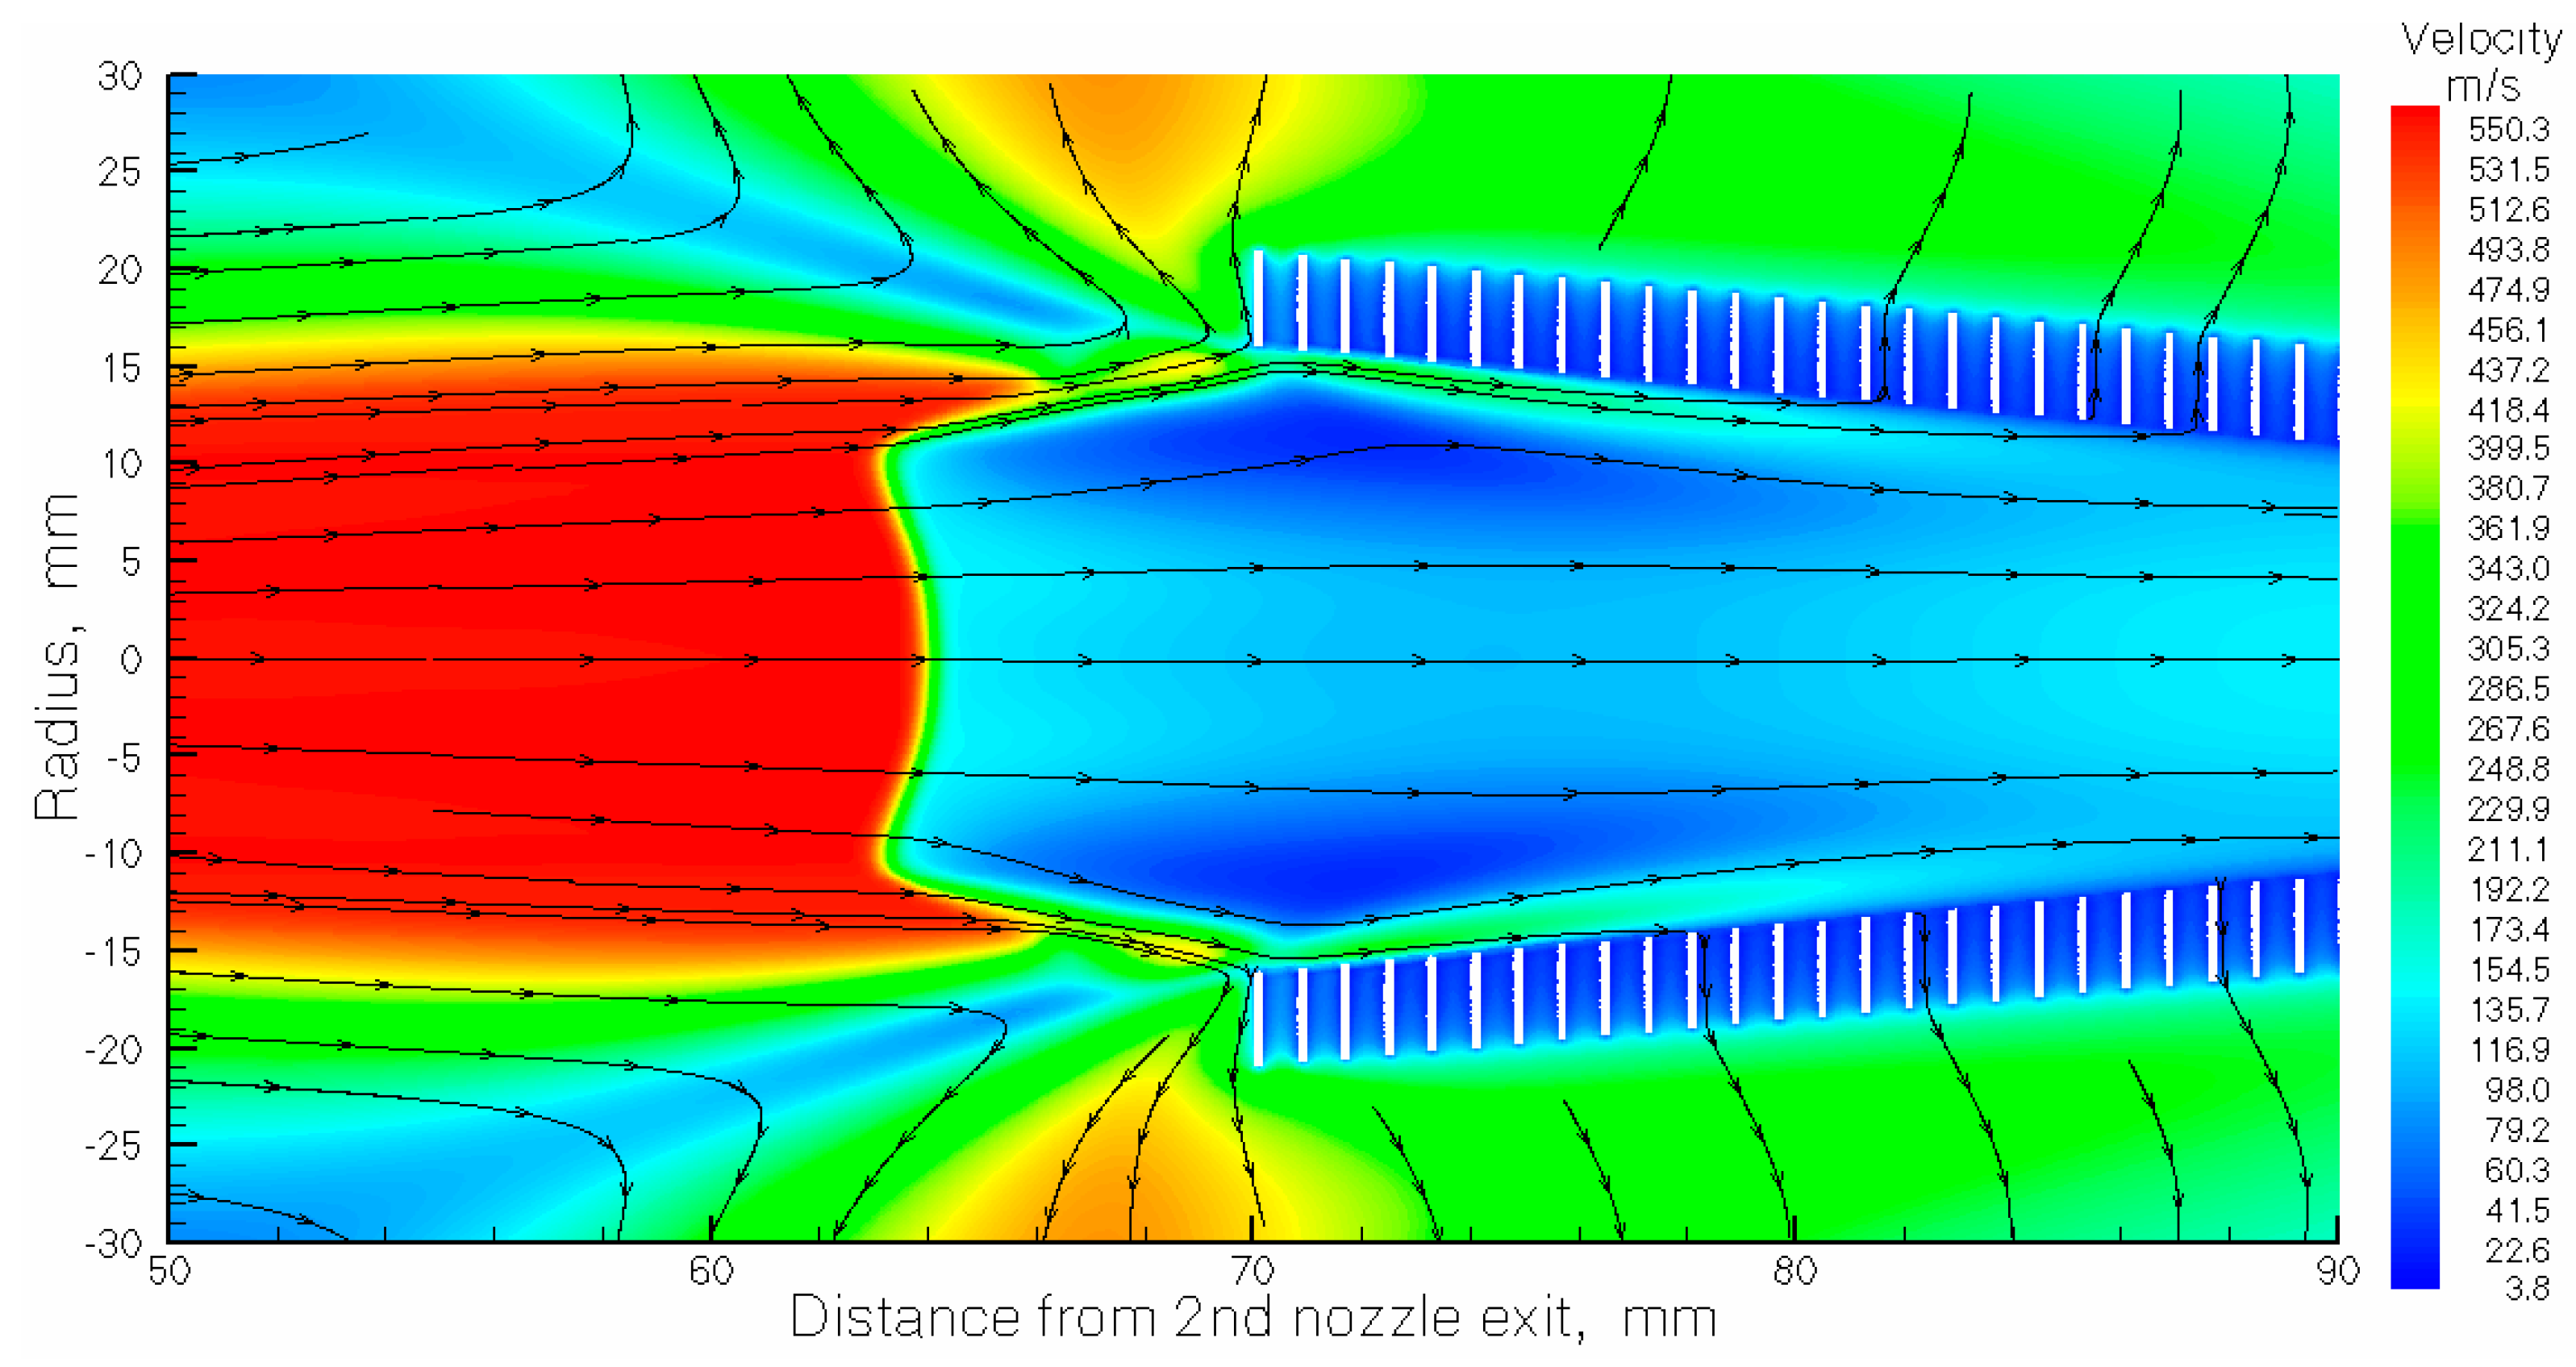
Figure 8.
Results of the gas dynamic simulation for the argon velocity flow field in the region of the RF-only funnel entrance. This is part of
Figure 7, shown in closeup view.
Figure 8.
Results of the gas dynamic simulation for the argon velocity flow field in the region of the RF-only funnel entrance. This is part of
Figure 7, shown in closeup view.
Figure 9.
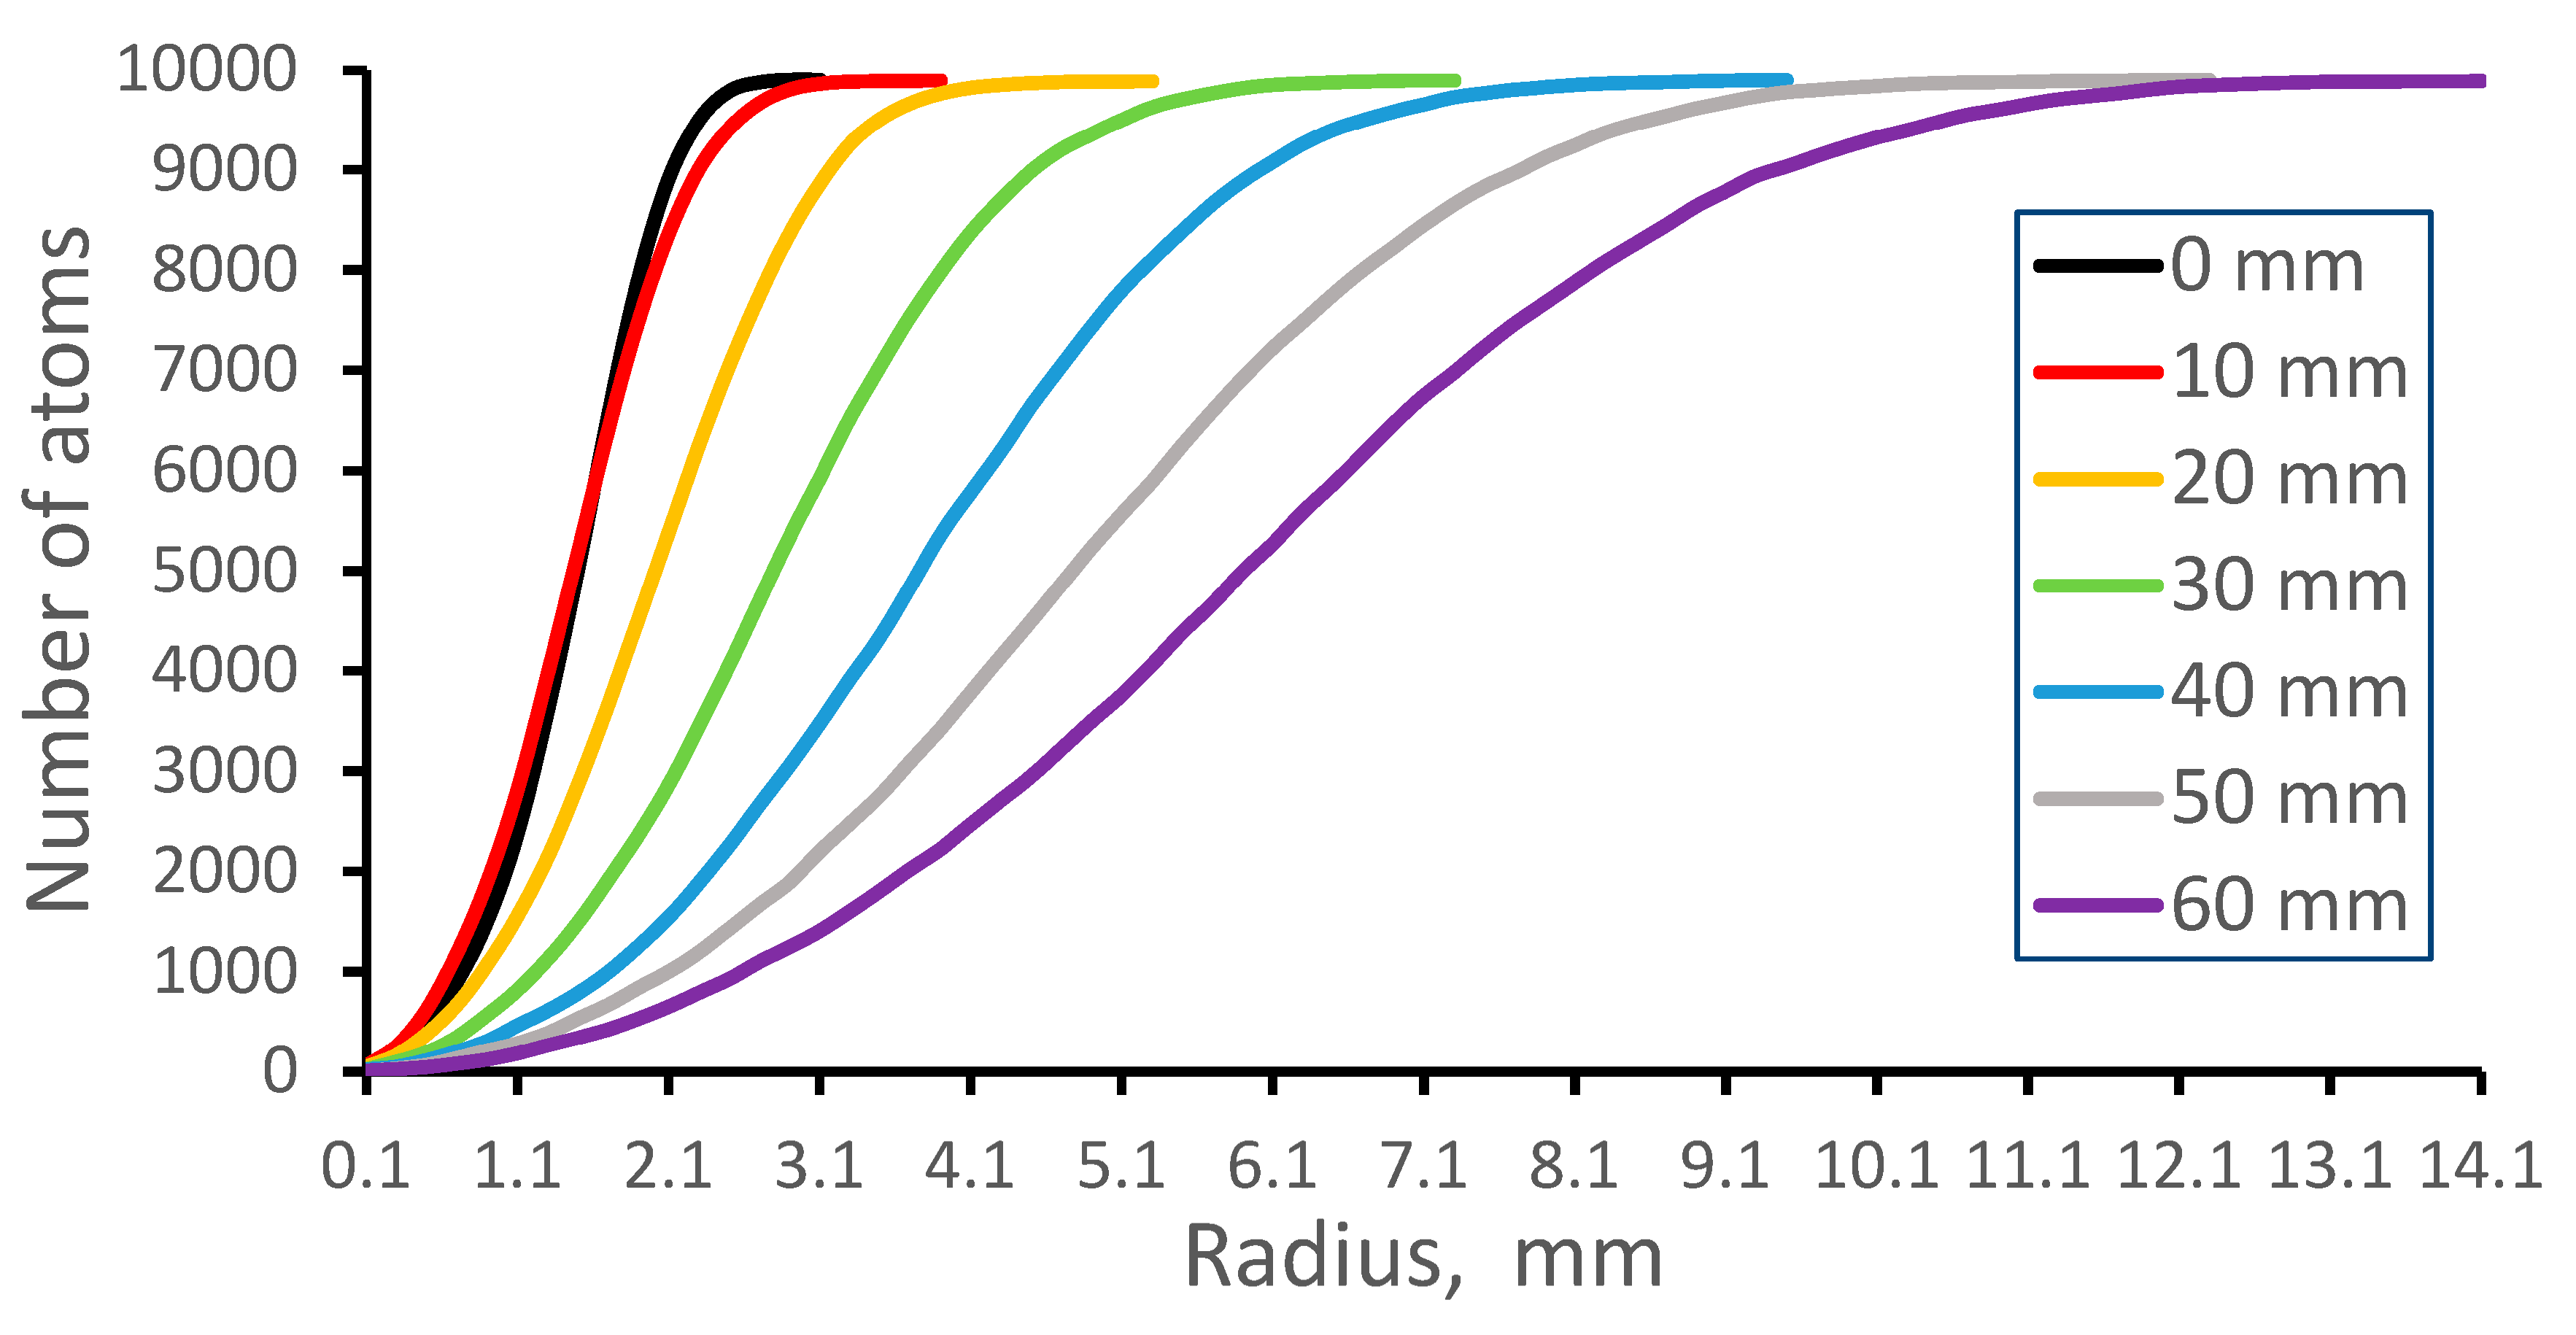
Results of Monte Carlo trajectory simulations for cumulative radial distributions of the nobelium-254 atomic beam at different downstream distances from the 2nd nozzle exit for the calculation variant #7. The number of calculated atoms is 10,000 for each distance.
Figure 9.
Results of Monte Carlo trajectory simulations for cumulative radial distributions of the nobelium-254 atomic beam at different downstream distances from the 2nd nozzle exit for the calculation variant #7. The number of calculated atoms is 10,000 for each distance.
Figure 10.
Results of Monte Carlo trajectory simulations for atomic beam longitudinal velocity distributions for different distances from the 2nd nozzle exit for the calculation variant #7. The data are averaged in the radial plane for the total beam. Number of calculated atoms is 10,000 for each distance.
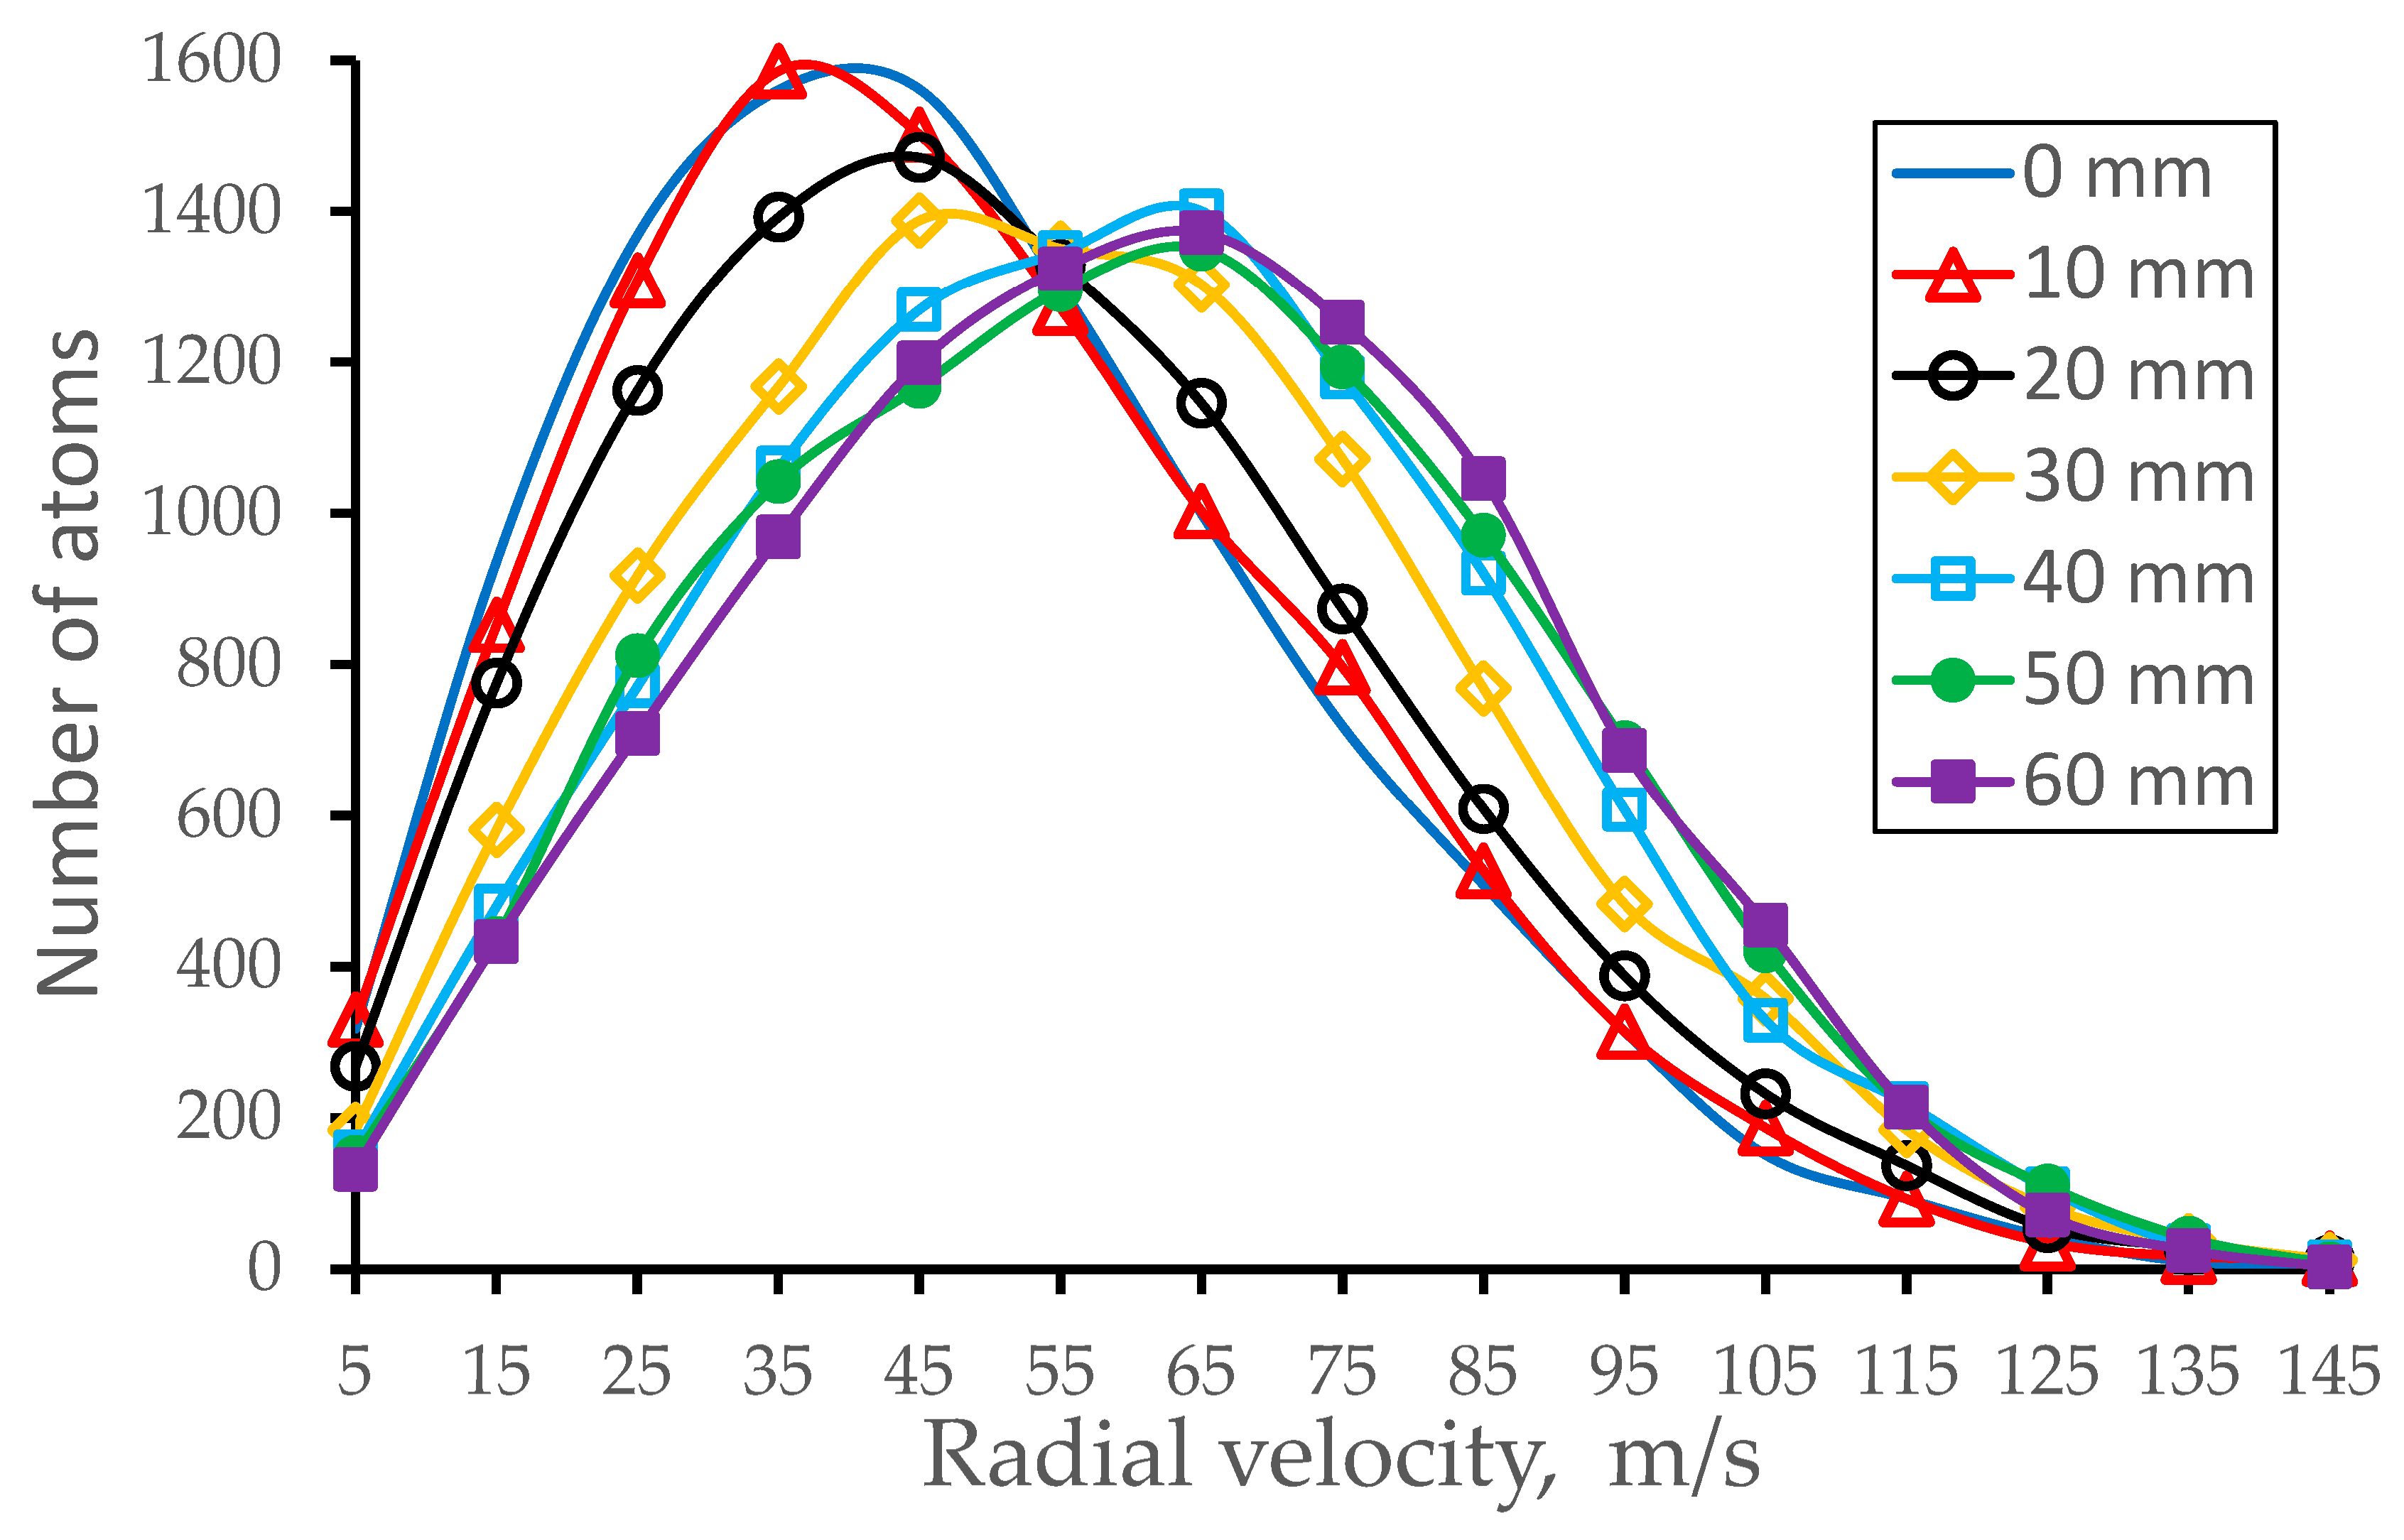
Figure 11.
Results of Monte Carlo trajectory simulations for atomic beam radial velocity distributions for different distances from the 2nd nozzle exit for the calculation variant #7. The data are averaged in the radial plane for the total beam. Number of calculated atoms is 10,000 for each distance.
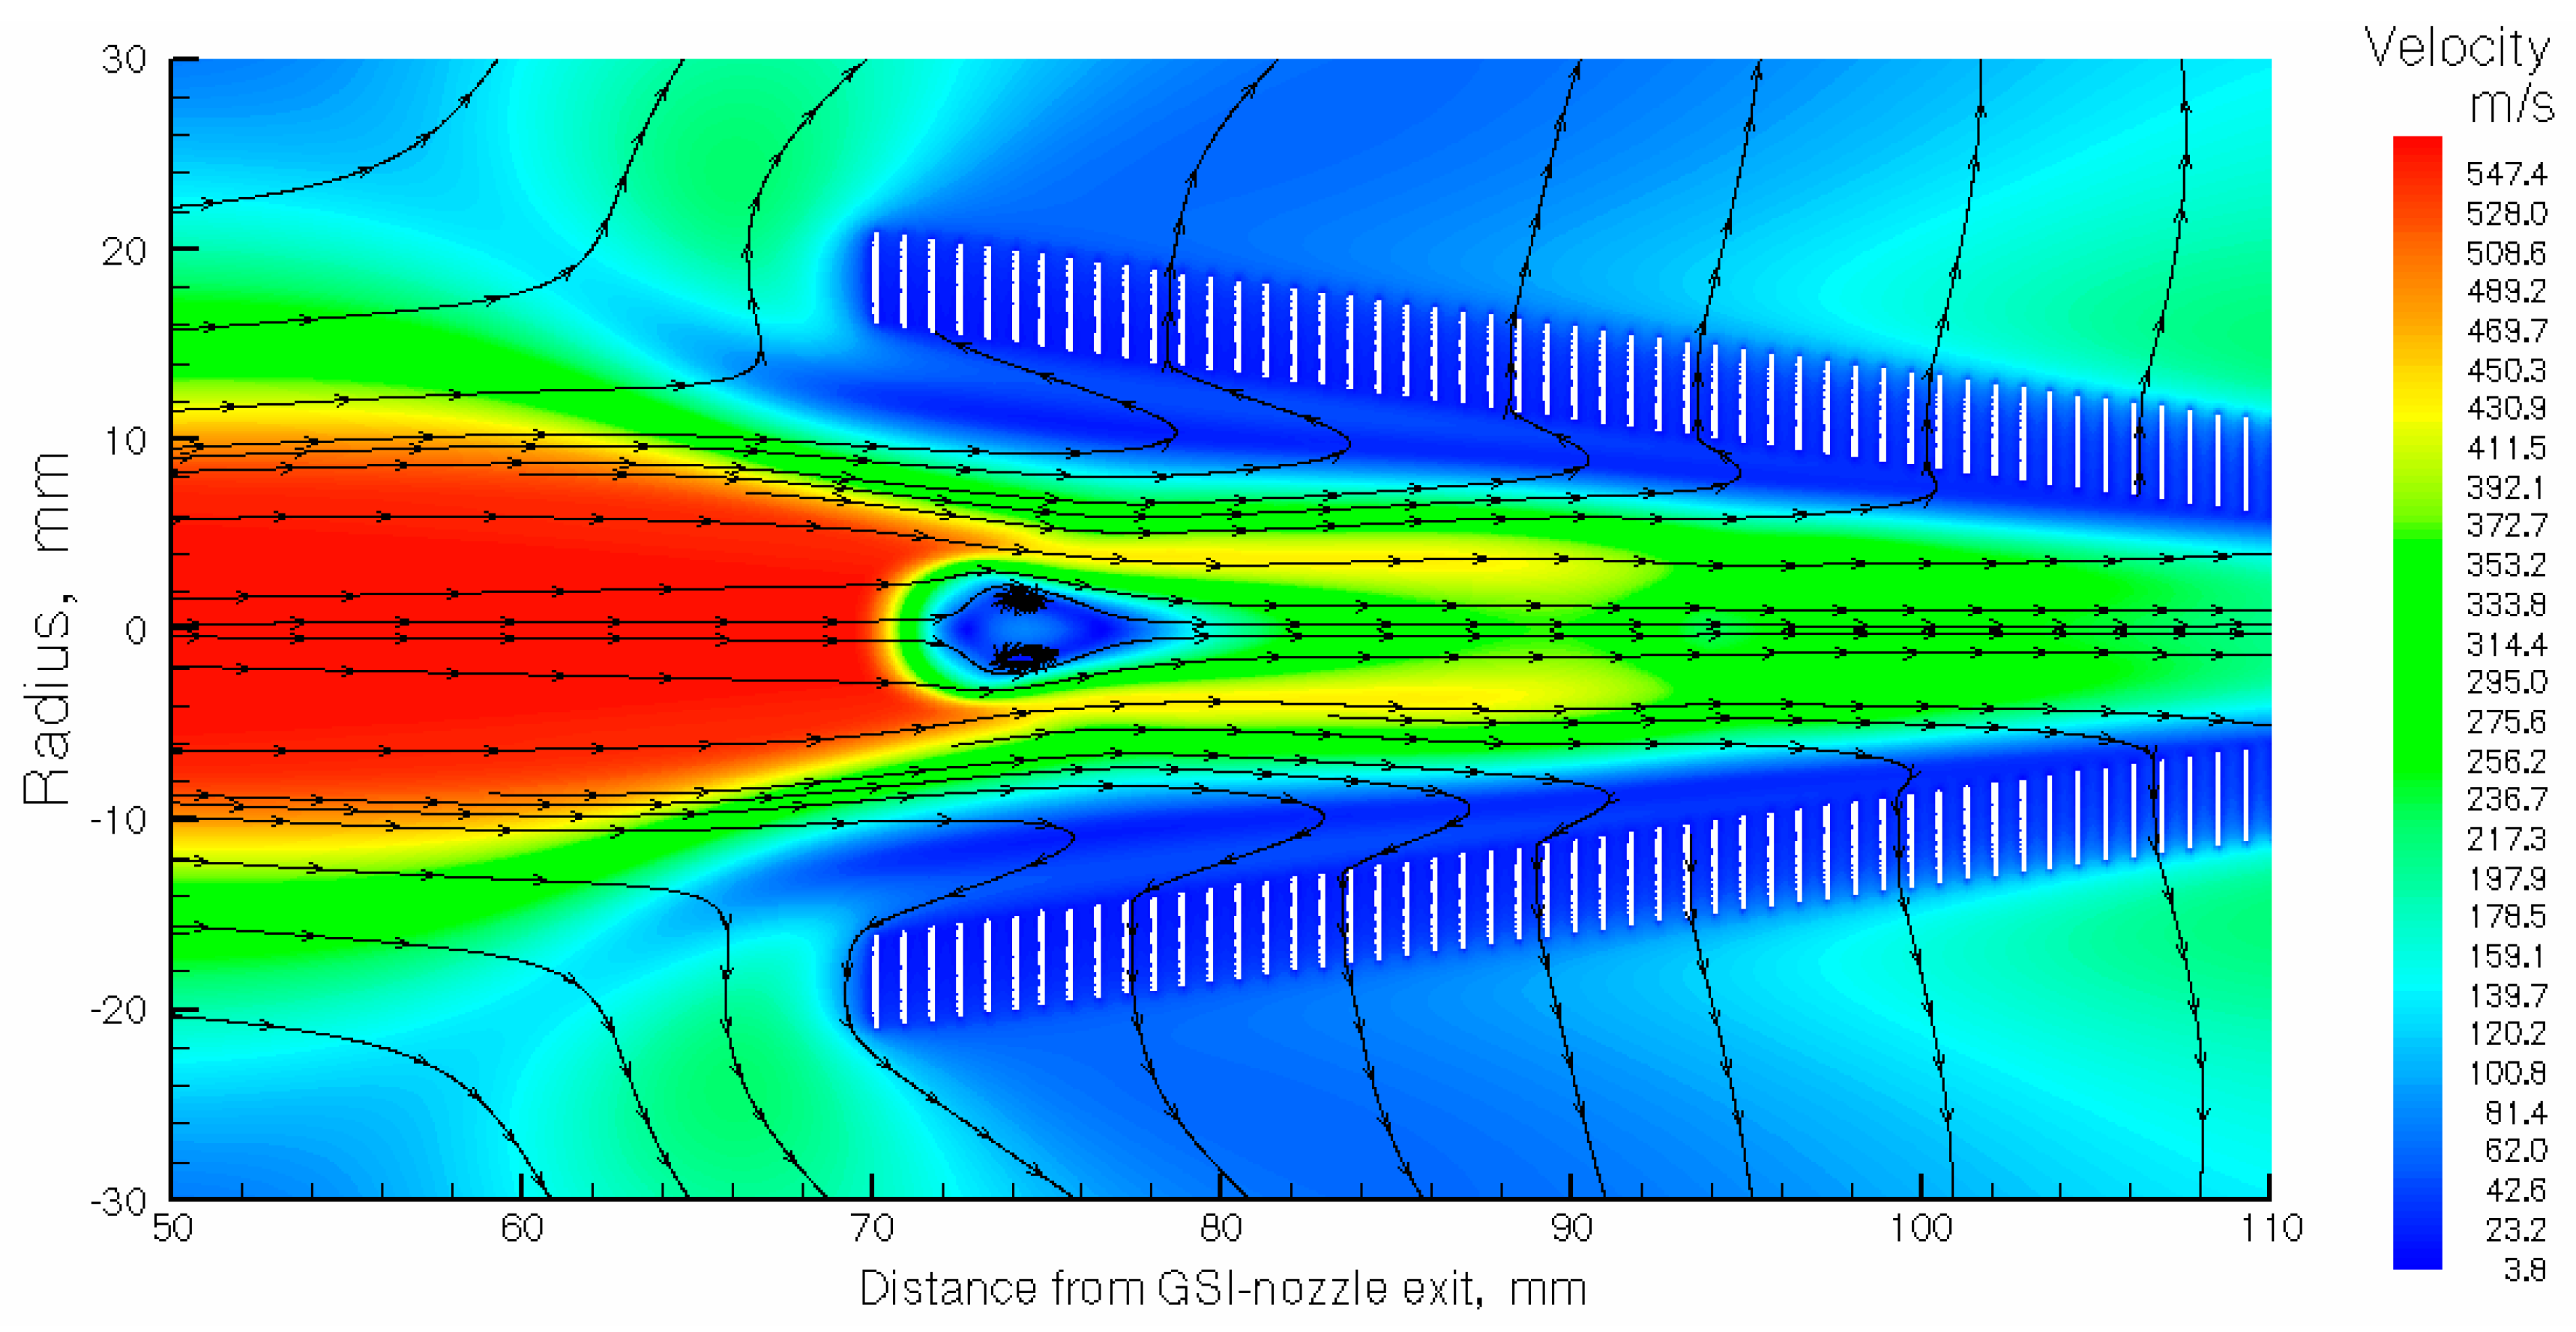
Figure 12.
Results of the gas dynamic simulation for argon velocity flow field in the region of the RF-only funnel entrance for the GSI nozzle operating at Pcell = 300 mbar and pumping capacity in the gas-jet chamber of 1300 L/s.
Figure 12.
Results of the gas dynamic simulation for argon velocity flow field in the region of the RF-only funnel entrance for the GSI nozzle operating at Pcell = 300 mbar and pumping capacity in the gas-jet chamber of 1300 L/s.
Table 1.
Main design parameters of the RF-only funnel and RF-buncher.
Table 1.
Main design parameters of the RF-only funnel and RF-buncher.
| | Rf-Only Funnel | RF-Buncher |
|---|
| Entrance aperture diameter (mm) | 32 | 4 |
| Exit aperture diameter (mm) | 2 | 4 |
| Electrode thickness (mm) | 0.2 | 0.2 |
| Inter-electrode spacing (mm) | 0.6 | 0.6 |
| Number of electrodes | 75 | 20 |
Table 2.
Results of gas dynamic simulations for the gas flow rates through the nozzles at pumping capacity of the gas-jet chamber of 1300 L/s.
Table 2.
Results of gas dynamic simulations for the gas flow rates through the nozzles at pumping capacity of the gas-jet chamber of 1300 L/s.
| Calculation Variant | #1 | #2 | #3 | #4 | #5 | #6 | #7 | #8 |
|---|
| Stagnation pressure Pcell (mbar) | 100 | 100 | 200 | 200 | 200 | 300 | 300 | 300 |
| Stagnation pressure Pnoz (mbar) | 200 | 300 | 100 | 200 | 300 | 100 | 200 | 300 |
| Background pressure in gas-jet chamber Pbg (mbar) | 0.033 | 0.045 | 0.03 | 0.042 | 0.054 | 0.039 | 0.051 | 0.063 |
| Total gas flow rate Qtot (mbar L/s) | 42.8 | 58.4 | 38.8 | 54.4 | 70 | 50.4 | 66 | 81.6 |
| Gas flow rate through funnel exit into vacuum Qvac (mbar L/s) | 0.154 | 0.435 | 0.053 | 0.172 | 0.538 | 0.11 | 0.245 | 0.432 |
| Flow rate ratio Qtot/Qvac | 278 | 134 | 732 | 316 | 112 | 458 | 269 | 189 |
Table 3.
Results of Monte Carlo simulations for the atomic beam radius (90% level) at different downstream distances from the 2nd nozzle exit for eight calculation variants. Radius values in (mm). Number of calculated atoms is 10,000 for each variant.
Table 3.
Results of Monte Carlo simulations for the atomic beam radius (90% level) at different downstream distances from the 2nd nozzle exit for eight calculation variants. Radius values in (mm). Number of calculated atoms is 10,000 for each variant.
| Calculation Variant | #1 | #2 | #3 | #4 | #5 | #6 | #7 | #8 |
|---|
| 0 mm | 2.0 | 2.0 | 2.14 | 2.17 | 2.08 | 2.2 | 2.2 | 2.23 |
| 10 mm | 2.25 | 2.35 | 2.6 | 2.36 | 2.29 | 2.62 | 2.36 | 2.33 |
| 20 mm | 2.84 | 4.35 | 3.91 | 3.1 | 2.74 | 4.09 | 3.22 | 2.89 |
| 30 mm | 3.83 | 4.95 | 5.6 | 4.36 | 3.69 | 5.99 | 4.54 | 3.98 |
| 40 mm | 5.1 | 6.6 | 7.6 | 5.69 | 4.84 | 7.99 | 6.02 | 5.26 |
| 50 mm | 6.4 | 8.15 | 9.5 | 7.32 | 6.07 | 9.98 | 7.7 | 6.57 |
| 60 mm | 7.8 | 10.5 | 11.4 | 8.78 | 7.32 | 11.8 | 9.35 | 7.96 |
Table 4.
Results of Monte Carlo trajectory simulations for atomic beam longitudinal velocity spread (FWHM) in m/s as a function of the downstream distance from the 2nd nozzle exit for different calculation variants. The data are averaged in the radial plane for the total beam. Number of calculated atoms is 10,000 for each calculation variant.
| Calculation Variant | #1 | #2 | #3 | #4 | #5 | #6 | #7 | #8 |
|---|
| 0 mm | 97.6 | 95.7 | 94.5 | 90.8 | 91.2 | 93.6 | 95.0 | 86.1 |
| 10 mm | 88.7 | 89.4 | 78.0 | 87.3 | 87.6 | 90.4 | 85.0 | 81.2 |
| 20 mm | 60.1 | 65.0 | 65.5 | 73.4 | 77.6 | 66.5 | 71.4 | 73.7 |
| 30 mm | 64.0 | 59.9 | 56.6 | 62.9 | 64.4 | 54.2 | 57.1 | 63.7 |
| 40 mm | 55.0 | 50.8 | 52.4. | 54.5 | 54.2 | 47.2 | 51.1 | 59.4 |
| 50 mm | 50.7 | 47.7 | 44.6 | 47.0 | 48.5 | 43.5 | 45.0 | 45.5 |
| 60 mm | 46.8 | 47.8 | 43.2 | 41.6 | 44.6 | 41.3 | 43.4 | 42.6 |
Table 5.
Results of Monte Carlo trajectory simulations for atomic beam radial velocity spread (FWHM) in m/s as a function of the downstream distance from the 2nd nozzle exit for different calculation variants. The data are averaged in the radial plane for the total beam diameter. Number of calculated atoms is 10,000 for each calculation variant.
| Calculation Variant | #1 | #2 | #3 | #4 | #5 | #6 | #7 | #8 |
|---|
| 0 mm | 63.7 | 45.2 | 52.5 | 61.5 | 63.2 | 64.6 | 59.3 | 53.5 |
| 10 mm | 70.9 | 49.1 | 72.4 | 60.7 | 57.2 | 69.1 | 68.1 | 58.6 |
| 20 mm | 59.4 | 53.2 | 72.2 | 65.1 | 61.1 | 78.3 | 64.0 | 60.9 |
| 30 mm | 62.3 | 57.3 | 86.0 | 67.7 | 61.2 | 83.3 | 64.5 | 62.0 |
| 40 mm | 69.3 | 55.5 | 78.0 | 71.2 | 64.2 | 69.4 | 66.3 | 63.3 |
| 50 mm | 66.3 | 55.2 | 81.6 | 67.9 | 64.9 | 70.6 | 60.0 | 62.6 |
| 60 mm | 67.0 | 52.3 | 82.7 | 73.3 | 63.0 | 71.0 | 56.2 | 64.6 |
Table 6.
Results of Monte Carlo trajectory simulations for the atomic beam time of flight in µsec starting from the gas cell nozzle throat as a function of the downstream distance from the 2nd nozzle exit for eight calculation variants. The data are averaged in the radial plane for the total beam diameter. Number of calculated atoms is 10,000 for each calculation variant.
| Calculation Variant | #1 | #2 | #3 | #4 | #5 | #6 | #7 | #8 |
|---|
| 0 mm | 68 | 68 | 64 | 64 | 64 | 63 | 63 | 63 |
| 10 mm | 88 | 88 | 86 | 84 | 84 | 82 | 82 | 82 |
| 20 mm | 108 | 108 | 104 | 103 | 102 | 101 | 101 | 101 |
| 30 mm | 125 | 124 | 124 | 121 | 121 | 120 | 120 | 120 |
| 40 mm | 144 | 142 | 142 | 140 | 140 | 138 | 138 | 138 |
| 50 mm | 162 | 162 | 162 | 158 | 157 | 157 | 155 | 155 |
| 60 mm | 180 | 180 | 180 | 176 | 176 | 175 | 174 | 174 |
Table 7.
RF frequency and RF amplitude (peak-to-peak) applied to the extraction RF-only funnel and RF-buncher. Extraction DC field = −10 V/cm.
Table 7.
RF frequency and RF amplitude (peak-to-peak) applied to the extraction RF-only funnel and RF-buncher. Extraction DC field = −10 V/cm.
| | RF-Only Funnel | RF-Buncher |
|---|
| RF-amplitude [Vpp] | 100 | 100 |
| RF-frequency [MHz] | 5 | 5 |
| Rf-funnel-RFbuncher DC bias | - | −0.8 V |
| DC potential gradient | - | −0.08 V |
Table 8.
Results of Monte Carlo simulations for fraction of ions in nobelium-254 beam at RF-only funnel entrance and total ion beam extraction efficiency into vacuum for eight calculation variants. The number of calculated ions is 10,000 for each variant.
Table 8.
Results of Monte Carlo simulations for fraction of ions in nobelium-254 beam at RF-only funnel entrance and total ion beam extraction efficiency into vacuum for eight calculation variants. The number of calculated ions is 10,000 for each variant.
| Calculation Variant | #1 | #2 | #3 | #4 | #5 | #6 | #7 | #8 |
|---|
| Fraction of ions in nobelium beam at RF-only funnel entrance (%) | 89.6 | 82.3 | 76.9 | 85.7 | 91.0 | 74.9 | 83.5 | 88.2 |
| Total ion beam extraction efficiency into vacuum (%) | 69.7 | 52.6 | 46.8 | 79.5 | 89.0 | 66.1 | 81.2 | 87.4 |
Table 9.
Results of Monte Carlo trajectory simulations for main parameters of the extracted pulsed nobelium ion beam for eight calculation variants. Number of calculated ions is 10,000 for each variant.
Table 9.
Results of Monte Carlo trajectory simulations for main parameters of the extracted pulsed nobelium ion beam for eight calculation variants. Number of calculated ions is 10,000 for each variant.
| Calculation Variant | #1 | #2 | #3 | #4 | #5 | #6 | #7 | #8 |
|---|
| Longitudinal (90%) energy spread (eV) | 0.29 | 1.1 | 0.43 | 0.42 | 0.62 | 0.46 | 0.45 | 0.59 |
| Bunch time (90%) width (µs) | 9 | 9 | 9 | 9 | 9 | 9 | 9 | 9.4 |
| Longitudinal emittance (90%) (eV µs) | 2.6 | 9.9 | 3.8 | 3.8 | 5.6 | 4.1 | 4.0 | 5.6 |
| Beam radius (90%) (mm) | 1.85 | 1.93 | 1.90 | 1.88 | 1.88 | 1.90 | 1.92 | 1.95 |
| Transverse (90%) energy spread (eV) | 0.12 | 0.21 | 0.18 | 0.18 | 0.17 | 0.23 | 0.16 | 0.17 |
| Normalized transverse emittance (90%) (π∙mm∙mrad∙[eV]1/2) | 224 | 156.1 | 292 | 289 | 309.8 | 321 | 336 | 310 |
Table 10.
Results of gas dynamic simulations for the gas flow rates through the GSI nozzle at pumping capacity of the gas-jet chamber of 1300 L/s.
Table 10.
Results of gas dynamic simulations for the gas flow rates through the GSI nozzle at pumping capacity of the gas-jet chamber of 1300 L/s.
| Stagnation Pressure Pcell | 200 Mbar | 300 Mbar |
|---|
| Background pressure in gas-jet chamber Pbg (mbar) | 0.0178 | 0.0267 |
| Total gas flow rate Qtot (mbar L/s) | 23.2 | 34.8 |
| Gas flow rate through funnel exit into vacuum Qvac (mbar L/s) | 0.05 | 0.271 |
| Flow rate ratio Qtot/Qvac | 464 | 128 |
Table 11.
Results of simulations for nobelium-254 atomic beam parameters for different downstream distances from the GSI nozzle exit. Stagnation pressure is Pcell = 200 mbar, background pressure is Pbg = 0.0179 mbar, and the nozzle temperature is T0 = 296 K. Number of calculated ions is 10,000 for each distance.
| Distance from GSI Nozzle Exit (mm) | 0 | 10 | 20 | 30 | 40 | 50 | 60 |
|---|
| Beam radius (90%) (mm) | 1.68 | 3.8 | 6.68 | 9.27 | 11.06 | 12.4 | 13.12 |
| Longitudinal velocity spread (FWHM) (m/s) | 91.2 | 59.0 | 43.3 | 40.2 | 40.6 | 44.1 | 56.0 |
| Radial velocity spread (FWHM) (m/s) | 65.1 | 99.8 | 99.2 | 85.0 | 58.0 | 51.0 | 59.4 |
| Time of flight (µs) | 44 | 60 | 80 | 96 | 116 | 132 | 152 |
Table 12.
Results of simulations for nobelium-254 atomic beam parameters for different downstream distances from the GSI nozzle exit. Stagnation pressure is Pcell = 300 mbar, background pressure is Pbg = 0.0268 mbar, and the nozzle temperature is T0 = 296 K. Number of calculated ions is 10,000 for each distance.
| Distance from GSI Nozzle Exit (mm) | 0 | 10 | 20 | 30 | 40 | 50 | 60 |
|---|
| Beam radius (90%) (mm) | 1.67 | 3.6 | 6.1 | 8.4 | 10.3 | 11.8 | 11.8 |
| Longitudinal velocity spread (FWHM) (m/s) | 84.3 | 55.1 | 51.4 | 47.8 | 38.1 | 40.0 | 43.6 |
| Radial velocity spread (FWHM) (m/s) | 56.9 | 95.9 | 97.2 | 80.5 | 71.3 | 50.7 | 44.0 |
| Time of flight (µs) | 44 | 60 | 80 | 96 | 116 | 132 | 152 |
Table 13.
Results of Monte Carlo simulations for total nobelium-254 ion beam extraction efficiencies for different stagnation gas pressures Pcell. The number of calculated ions is 10,000 for each variant.
Table 13.
Results of Monte Carlo simulations for total nobelium-254 ion beam extraction efficiencies for different stagnation gas pressures Pcell. The number of calculated ions is 10,000 for each variant.
| Stagnation Pressure Pcell | 200 Mbar | 300 Mbar |
|---|
| Fraction of ions in nobelium beam at FR-only funnel entrance (%) | 64.2 | 64.9 |
| Total ion beam extraction efficiency into vacuum (%) | 16.8 | 35.4 |


