A Facile Profiling Method of Short Chain Fatty Acids Using Liquid Chromatography-Mass Spectrometry


Abstract
1. Introduction
2. Materials and Methods
2.1. Materials
2.2. Sample Preparation
2.3. Biological Samples
2.4. Liquid Chromatography-Tandem Mass Spectrometry (LC-MS/MS)
2.5. Method Validation
3. Results and Discussion
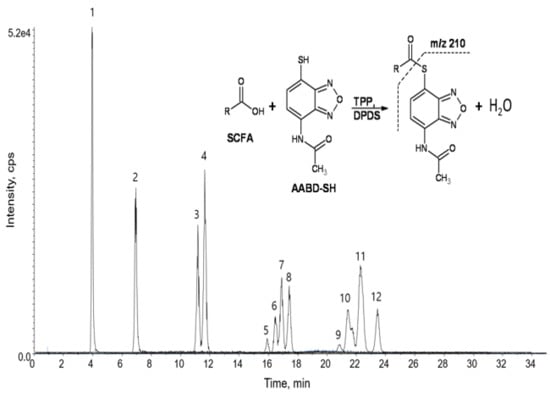
3.1. Liquid Chromatography-Tandem Mass Spectrometry (LC-MS/MS) of Derivatized Short Chain Fatty Acids
3.2. Optimization of the Derivatization Reaction and Method Validation
3.3. Profiling of SCFAs in Biological Samples
4. Conclusions
Supplementary Materials
Author Contributions
Funding
Acknowledgments
Conflicts of Interest
References
- Topping, D.L.; Clifton, P.M. Short-chain fatty acids and human colonic function: roles of resistant starch and nonstarch polysaccharides. Physiol. Rev. 2001, 81, 1031–1064. [Google Scholar] [CrossRef] [PubMed]
- Den Besten, G.; van Eunen, K.; Groen, A.K.; Venema, K.; Reijngoud, D.J.; Bakker, B.M. The role of short-chain fatty acids in the interplay between diet, gut microbiota, and host energy metabolism. J. Lipid Res. 2013, 54, 2325–2340. [Google Scholar] [CrossRef] [PubMed]
- Byrne, C.S.; Chambers, E.S.; Morrison, D.J.; Frost, G. The role of short chain fatty acids in appetite regulation and energy homeostasis. Int. J. Obes. (Lond.) 2015, 39, 1331–1338. [Google Scholar] [CrossRef] [PubMed]
- Canfora, E.E.; Jocken, J.W.; Blaak, E.E. Short-chain fatty acids in control of body weight and insulin sensitivity. Nat. Rev. Endocrinol. 2015, 11, 577–591. [Google Scholar] [CrossRef] [PubMed]
- Gao, X.; Pujos-Guillot, E.; Martin, J.F.; Galan, P.; Juste, C.; Jia, W.; Sebedio, J.L. Metabolite analysis of human fecal water by gas chromatography/mass spectrometry with ethyl chloroformate derivatization. Analyt. Biochem. 2009, 393, 163–175. [Google Scholar] [CrossRef] [PubMed]
- Zheng, X.; Qiu, Y.; Zhong, W.; Baxter, S.; Su, M.; Li, Q.; Xie, G.; Ore, B.M.; Qiao, S.; Spencer, M.D.; et al. A targeted metabolomic protocol for short-chain fatty acids and branched-chain amino acids. Metabolomics 2013, 9, 818–827. [Google Scholar] [CrossRef] [PubMed]
- Kvitvang, H.F.; Andreassen, T.; Adam, T.; Villas-Boas, S.G.; Bruheim, P. Highly sensitive GC/MS/MS method for quantitation of amino and nonamino organic acids. Anal. Chem. 2011, 83, 2705–2711. [Google Scholar] [CrossRef] [PubMed]
- Zhang, S.; Wang, H.; Zhu, M.J. A sensitive GC/MS detection method for analyzing microbial metabolites short chain fatty acids in fecal and serum samples. Talanta 2019, 196, 249–254. [Google Scholar] [CrossRef]
- Zhou, B.; Xiao, J.F.; Tuli, L.; Ressom, H.W. LC-MS-based metabolomics. Mol. Biosyst. 2012, 8, 470–481. [Google Scholar] [CrossRef]
- Perez, E.R.; Knapp, J.A.; Horn, C.K.; Stillman, S.L.; Evans, J.E.; Arfsten, D.P. Comparison of LC-MS-MS and GC-MS Analysis of Benzodiazepine Compounds Included in the Drug Demand Reduction Urinalysis Program. J. Anal. Toxicol. 2016, 40, 201–207. [Google Scholar] [CrossRef]
- Van Eijk, H.M.; Bloemen, J.G.; Dejong, C.H. Application of liquid chromatography-mass spectrometry to measure short chain fatty acids in blood. J. Chromatogr. 2009, 877, 719–724. [Google Scholar] [CrossRef] [PubMed]
- Chan, J.C.; Kioh, D.Y.; Yap, G.C.; Lee, B.W.; Chan, E.C. A novel LCMSMS method for quantitative measurement of short-chain fatty acids in human stool derivatized with (12)C- and (13)C-labelled aniline. J. Pharm. Biomed. Anal. 2017, 138, 43–53. [Google Scholar] [CrossRef] [PubMed]
- Zeng, M.; Cao, H. Fast quantification of short chain fatty acids and ketone bodies by liquid chromatography-tandem mass spectrometry after facile derivatization coupled with liquid-liquid extraction. J. Chromatogr. 2018, 1083, 137–145. [Google Scholar] [CrossRef] [PubMed]
- Han, J.; Lin, K.; Sequeira, C.; Borchers, C.H. An isotope-labeled chemical derivatization method for the quantitation of short-chain fatty acids in human feces by liquid chromatography-tandem mass spectrometry. Anal. Chim. Acta. 2015, 854, 86–94. [Google Scholar] [CrossRef] [PubMed]
- Sengul, U. Comparing determination methods of detection and quantification limits for aflatoxin analysis in hazelnut. J. Food Drug Anal. 2016, 24, 56–62. [Google Scholar] [CrossRef] [PubMed]
- Santa, T.; Okamoto, T.; Uchiyama, S.; Mitsuhashi, K.; Imai, K. A new fluorogenic reagent for carboxylic acids, 7-acetylamino-4-mercapto-2,1,3-benzoxadiazole (AABD-SH), derived from an empirical method for predicting fluorescence characteristics. Analyst 1999, 124, 1689–1693. [Google Scholar] [CrossRef]
- Garcia-Villalba, R.; Gimenez-Bastida, J.A.; Garcia-Conesa, M.T.; Tomas-Barberan, F.A.; Carlos Espin, J.; Larrosa, M. Alternative method for gas chromatography-mass spectrometry analysis of short-chain fatty acids in faecal samples. J. Sep. Sci. 2012, 35, 1906–1913. [Google Scholar] [CrossRef] [PubMed]
- Lotti, C.; Rubert, J.; Fava, F.; Tuohy, K.; Mattivi, F.; Vrhovsek, U. Development of a fast and cost-effective gas chromatography-mass spectrometry method for the quantification of short-chain and medium-chain fatty acids in human biofluids. Anal. Bioanal. Chem. 2017, 409, 5555–5567. [Google Scholar] [CrossRef] [PubMed]
- Molyneaux, P.L.; Cox, M.J.; Willis-Owen, S.A.; Mallia, P.; Russell, K.E.; Russell, A.M.; Murphy, E.; Johnston, S.L.; Schwartz, D.A.; Wells, A.U.; et al. The role of bacteria in the pathogenesis and progression of idiopathic pulmonary fibrosis. Am. J. Respir. Crit. Care Med. 2014, 190, 906–913. [Google Scholar] [CrossRef]
- Mirkovic, B.; Murray, M.A.; Lavelle, G.M.; Molloy, K.; Azim, A.A.; Gunaratnam, C.; Healy, F.; Slattery, D.; McNally, P.; Hatch, J.; et al. The Role of Short-Chain Fatty Acids, Produced by Anaerobic Bacteria, in the Cystic Fibrosis Airway. Am. J. Respir. Crit. Care Med. 2015, 192, 1314–1324. [Google Scholar] [CrossRef] [PubMed]
- Molyneaux, P.L.; Cox, M.J.; Wells, A.U.; Kim, H.C.; Ji, W.; Cookson, W.O.; Moffatt, M.F.; Kim, D.S.; Maher, T.M. Changes in the respiratory microbiome during acute exacerbations of idiopathic pulmonary fibrosis. Respir. Res. 2017, 18, 29. [Google Scholar] [CrossRef] [PubMed]
- Bicking, M.K. Integration Errors in Chromatographic Analysis, Part I: Peaks of Approximately Equal Size. LCGC 2006, 24, 402–414. [Google Scholar]
- Meyer, V.R. Errors in the Area Determination of Incompletely Resolved Chromatographic Peaks. J. Chrom. Sci. 1996, 33, 26–33. [Google Scholar] [CrossRef]
- Cledera-Castro, M.; Santos-Montes, A.; Izquierdo-Hornillos, R.; Gonzalo-Lumbreras, R. Comparison of the performance of different reversed-phase columns for liquid chromatography separation of 11 pollutant phenols. J. Sep. Sci. 2007, 30, 699–707. [Google Scholar] [CrossRef] [PubMed]
- Tuzimski, T.; Sherma, J. High Performance Liquid Chromatography in Pesticide Residue Analysis; CRC Press: Boca Raton, FL, USA, 2015; p. 109. [Google Scholar]
- Lu, Y.; Fan, C.; Li, P.; Lu, Y.; Chang, X.; Qi, K. Short Chain Fatty Acids Prevent High-fat-diet-induced Obesity in Mice by Regulating G Protein-coupled Receptors and Gut Microbiota. Sci. Rep. 2016, 6, 37589. [Google Scholar] [CrossRef] [PubMed]
- Yan, H.; Potu, R.; Lu, H.; Vezzoni de Almeida, V.; Stewart, T.; Ragland, D.; Armstrong, A.; Adeola, O.; Nakatsu, C.H.; Ajuwon, K.M. Dietary fat content and fiber type modulate hind gut microbial community and metabolic markers in the pig. PLoS ONE 2013, 8, e59581. [Google Scholar] [CrossRef]
- Agus, A.; Denizot, J.; Thevenot, J.; Martinez-Medina, M.; Massier, S.; Sauvanet, P.; Bernalier-Donadille, A.; Denis, S.; Hofman, P.; Bonnet, R.; et al. Western diet induces a shift in microbiota composition enhancing susceptibility to Adherent-Invasive E. coli infection and intestinal inflammation. Sci. Rep. 2016, 6, 19032. [Google Scholar] [CrossRef]
- Pizzolla, A.; Oh, D.Y.; Luong, S.; Prickett, S.R.; Henstridge, D.C.; Febbraio, M.A.; O’Hehir, R.E.; Rolland, J.M.; Hardy, C.L. High Fat Diet Inhibits Dendritic Cell and T Cell Response to Allergens but Does Not Impair Inhalational Respiratory Tolerance. PLoS ONE 2016, 11, e0160407. [Google Scholar] [CrossRef]


| Compound | DP | EP | MRM Transitions | IS | Calibration Curve | LOQ, μM (ng/mL) | Intraday (10 μM) | Interday (10 μM) | ||
|---|---|---|---|---|---|---|---|---|---|---|
| (V) | (V) | Q1 | Q3 | Calibration Range (μM) | R2 | RSD, % (Accuracy, %) | RSD, % (Accuracy, %) | |||
| Acetic acid | 70 | 8 | 252 | 210 | A | 1–1000 | 1 | 1.03 (61.8) | 6.66 (98.5) | 14.9 (103) |
| Propionic acid | 30 | 10 | 266 | 210 | B | 0.1–1000 | 0.999 | 0.293 (21.7) | 0.909 (110) | 15.1 (97.4) |
| Isobutyric acid | 70 | 6 | 280 | 210 | C | 0.1–1000 | 0.999 | 0.450 (39.6) | 1.05 (110) | 7.97 (93.2) |
| Butyric acid | 70 | 6 | 280 | 210 | C | 0.1–1000 | 1 | 0.158 (13.9) | 1.72 (116) | 13.4 (97.0) |
| 2,2-dimethylpropionic acid | 50 | 10 | 294 | 210 | D | 0.1–100 | 0.989 | 0.470 (47.9) | 1.75 (110) | 11.3 (86.1) |
| 2-Methylbutyric acid | 50 | 10 | 294 | 210 | D | 0.1–500 | 0.998 | 0.773 (78.8) | 1.50 (102) | 8.87 (86.9) |
| Isovaleric acid | 50 | 10 | 294 | 210 | D | 0.1–100 | 0.999 | 0.624 (63.6) | 2.11 (103) | 9.09 (91.4) |
| Valeric acid | 50 | 10 | 294 | 210 | D | 0.1–1000 | 0.997 | 0.451 (46.0) | 0.475 (101) | 6.00 (87.0) |
| 2,2-Dimethylbutyric acid | 70 | 10 | 308 | 210 | E | 0.1–100 | 0.997 | 0.430 (49.9) | 7.67 (116) | 11.6 (85.7) |
| 2-Ethylbutyric acid, | 70 | 10 | 308 | 210 | E | 0.1–100 | 0.999 | 0.546 (63.3) | 4.83 (108) | 12.2 (96.0) |
| 2-Methylvaleric acid | 70 | 10 | 308 | 210 | E | 0.1–500 | 0.983 | 0.773 (89.7) | 3.38 (112) | 4.49 (105) |
| Caproic acid | 70 | 10 | 308 | 210 | E | 0.1–1000 | 0.994 | 0.609 (70.6) | 1.66 (89.8) | 4.74 (89.3) |
| Acetic acid-2,2,2-d3 (A) | 70 | 6 | 255 | 211 | - | - | - | - | - | - |
| Propionic acid-d6 (B) | 30 | 8 | 272 | 211 | - | - | - | - | - | - |
| Butyric acid- d7 (C) | 70 | 8 | 287 | 211 | - | - | - | - | - | - |
| Valeric acid-2,2,3,3-d4 (D) | 50 | 8 | 298 | 211 | - | - | - | - | - | - |
| Caproic-5,5,6,6,6-d5 (E) | 70 | 8 | 313 | 210 | - | - | - | - | - | - |
| Mouse Feces (nmol/mg) | Mouse plasma (μM) | Human EBC (μM) | |||||||
|---|---|---|---|---|---|---|---|---|---|
| Average | Intraday | Interday | Average | Intraday | Interday | Average | Intraday | Interday | |
| RSD (%) | RSD (%) | RSD (%) | RSD (%) | RSD (%) | RSD (%) | ||||
| Acetic acid | 19.5 | 3.25 | 8.04 | 77.4 | 1.61 | 8.03 | 66.4 | 1.27 | 6.02 |
| Propionic acid | 3.54 | 0.866 | 2.88 | 8.08 | 3.1 | 2.27 | 13.4 | 1.17 | 2.41 |
| Isobutyric acid | 0.802 | 4.87 | 9.23 | 31.1 | 7.37 | 9.74 | 2.43 | 5.2 | 6.15 |
| Butyric acid | 0.0934 | 8.13 | 11.2 | 20.7 | 5.46 | 8.98 | 2.79 | 6.01 | 2.28 |
| 2,2-Dimethylpropionic acid | ND | - | - | 35.9 | 5.17 | 9.73 | ND | - | - |
| 2-Methylbutyric acid | 0.645 | 1.12 | 10 | 14.3 | 6.54 | 12.5 | ND | - | - |
| Isovaleric acid | 0.379 | 1.29 | 8.84 | 9.92 | 6.95 | 18 | ND | - | - |
| Valeric acid | 0.224 | 1.64 | 4.53 | 6.16 | 10.4 | 11.5 | ND | - | - |
| 2,2-Dimethylbutyric acid | ND | - | - | ND | - | - | ND | - | - |
| 2-Ethylbutyric acid | ND | - | - | 0.651 | 7.36 | 11.1 | ND | - | - |
| 2-Methylvaleric acid | ND | - | - | 2.09 | 6.07 | 2.01 | ND | - | - |
| Caproic acid | 0.0125 | 8.74 | 9.61 | 0.711 | 6.66 | 8.95 | ND | - | - |
| HFD Mouse Feces, (nmol/mg) | LFD Mouse Feces, (nmol/mg) | t Test | |||
|---|---|---|---|---|---|
| Average | STD | Average | STD | ||
| Acetic acid | 16.4 | 0.659 | 19.5 | 1.57 | * |
| Propionic acid | 2.99 | 0.118 | 3.54 | 0.102 | ** |
| Isobutyric acid | 0.416 | 0.0655 | 0.802 | 0.074 | ** |
| Butyric acid | 0.821 | 0.0352 | 0.0934 | 0.0105 | ** |
| 2,2-dimethylpropionic acid | ND | - | ND | - | |
| 2-Methylbutyric acid | 0.534 | 0.0503 | 0.645 | 0.0646 | |
| Isovaleric acid | 0.675 | 0.0046 | 0.379 | 0.0335 | ** |
| Valeric acid | 1.389 | 0.0698 | 0.223 | 0.0101 | ** |
| 2,2-Dimethylbutyric acid | ND | - | ND | - | |
| 2-Ethylbutyric acid | ND | - | ND | - | |
| 2-Methylvaleric acid | ND | - | ND | - | |
| Caproic acid | 0.00478 | 0.000357 | 0.0125 | 0.0012 | ** |
© 2019 by the authors. Licensee MDPI, Basel, Switzerland. This article is an open access article distributed under the terms and conditions of the Creative Commons Attribution (CC BY) license (http://creativecommons.org/licenses/by/4.0/).
Share and Cite
Song, H.E.; Lee, H.Y.; Kim, S.J.; Back, S.H.; Yoo, H.J. A Facile Profiling Method of Short Chain Fatty Acids Using Liquid Chromatography-Mass Spectrometry. Metabolites 2019, 9, 173. https://doi.org/10.3390/metabo9090173
Song HE, Lee HY, Kim SJ, Back SH, Yoo HJ. A Facile Profiling Method of Short Chain Fatty Acids Using Liquid Chromatography-Mass Spectrometry. Metabolites. 2019; 9(9):173. https://doi.org/10.3390/metabo9090173
Chicago/Turabian StyleSong, Ha Eun, Hyo Yeong Lee, Su Jung Kim, Sung Hoon Back, and Hyun Ju Yoo. 2019. "A Facile Profiling Method of Short Chain Fatty Acids Using Liquid Chromatography-Mass Spectrometry" Metabolites 9, no. 9: 173. https://doi.org/10.3390/metabo9090173
APA StyleSong, H. E., Lee, H. Y., Kim, S. J., Back, S. H., & Yoo, H. J. (2019). A Facile Profiling Method of Short Chain Fatty Acids Using Liquid Chromatography-Mass Spectrometry. Metabolites, 9(9), 173. https://doi.org/10.3390/metabo9090173