
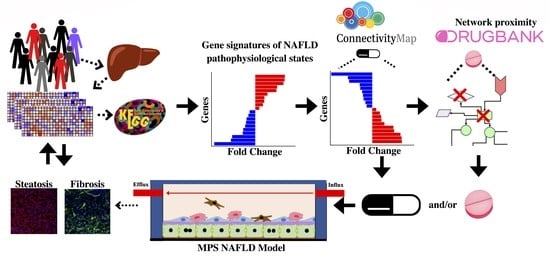
A Quantitative Systems Pharmacology Platform Reveals NAFLD Pathophysiological States and Targeting Strategies

 , ,
, ,  , , , , , ,
Abstract
:
1. Introduction
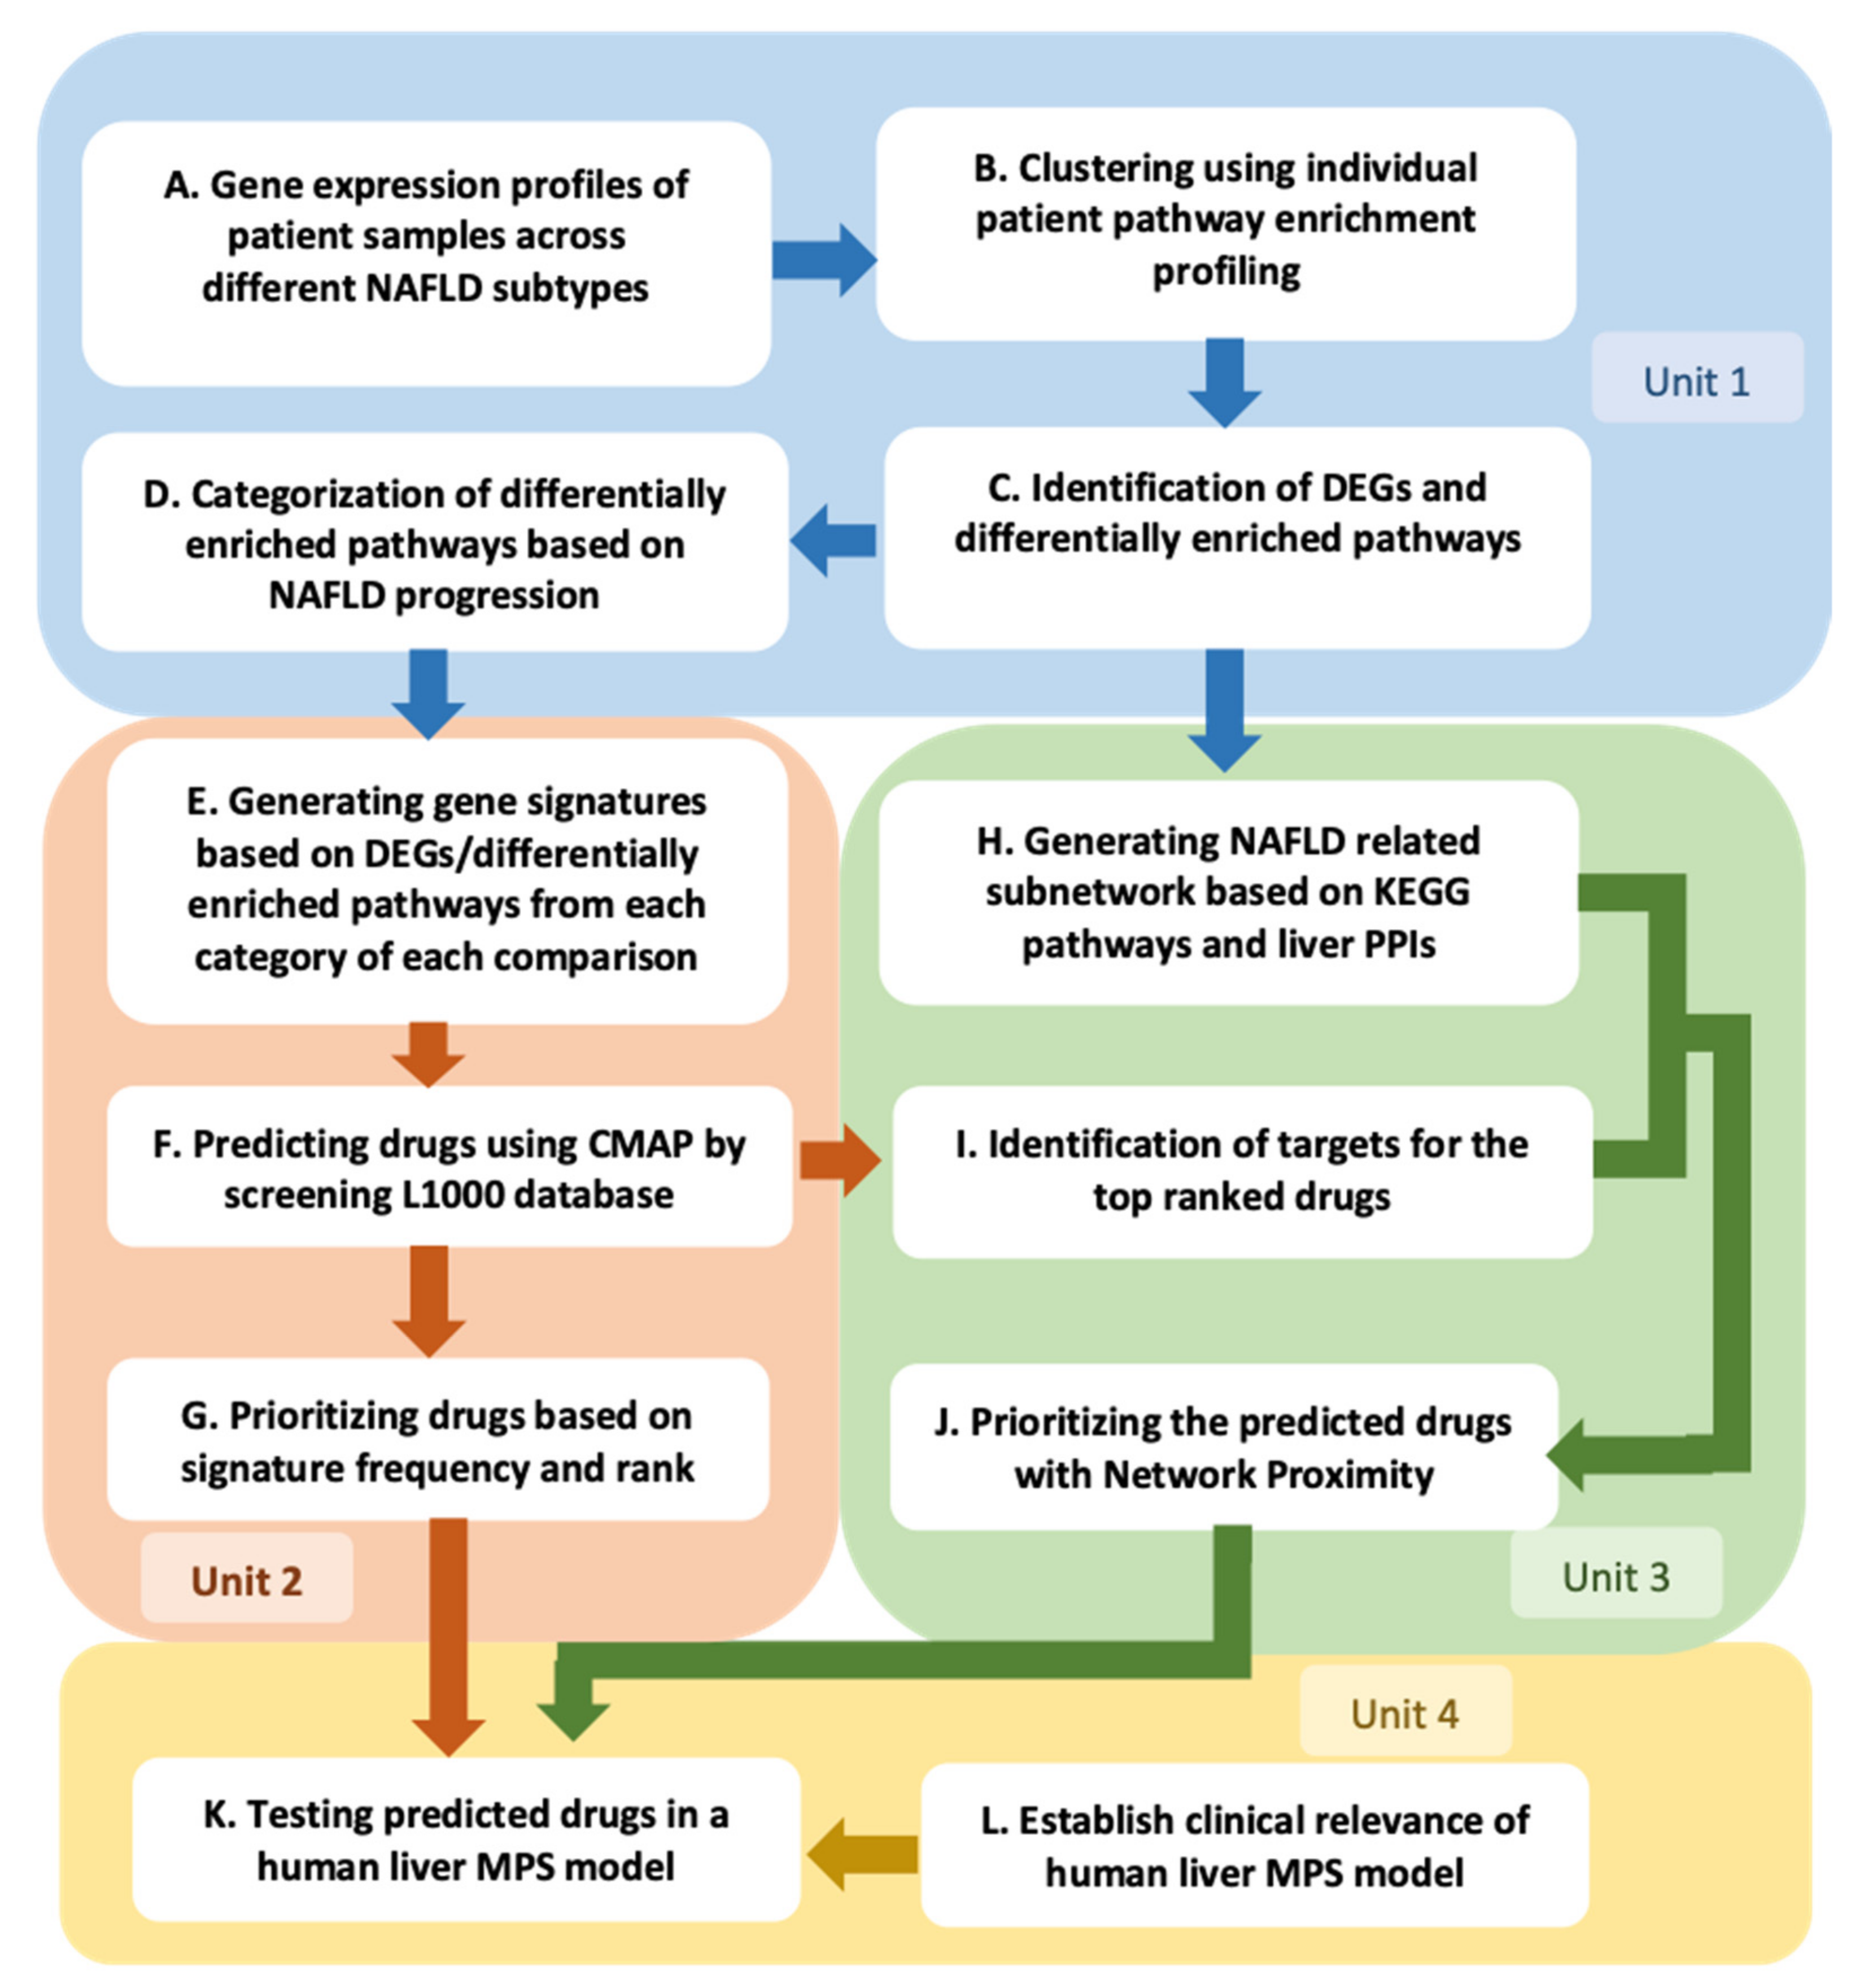
2. Results
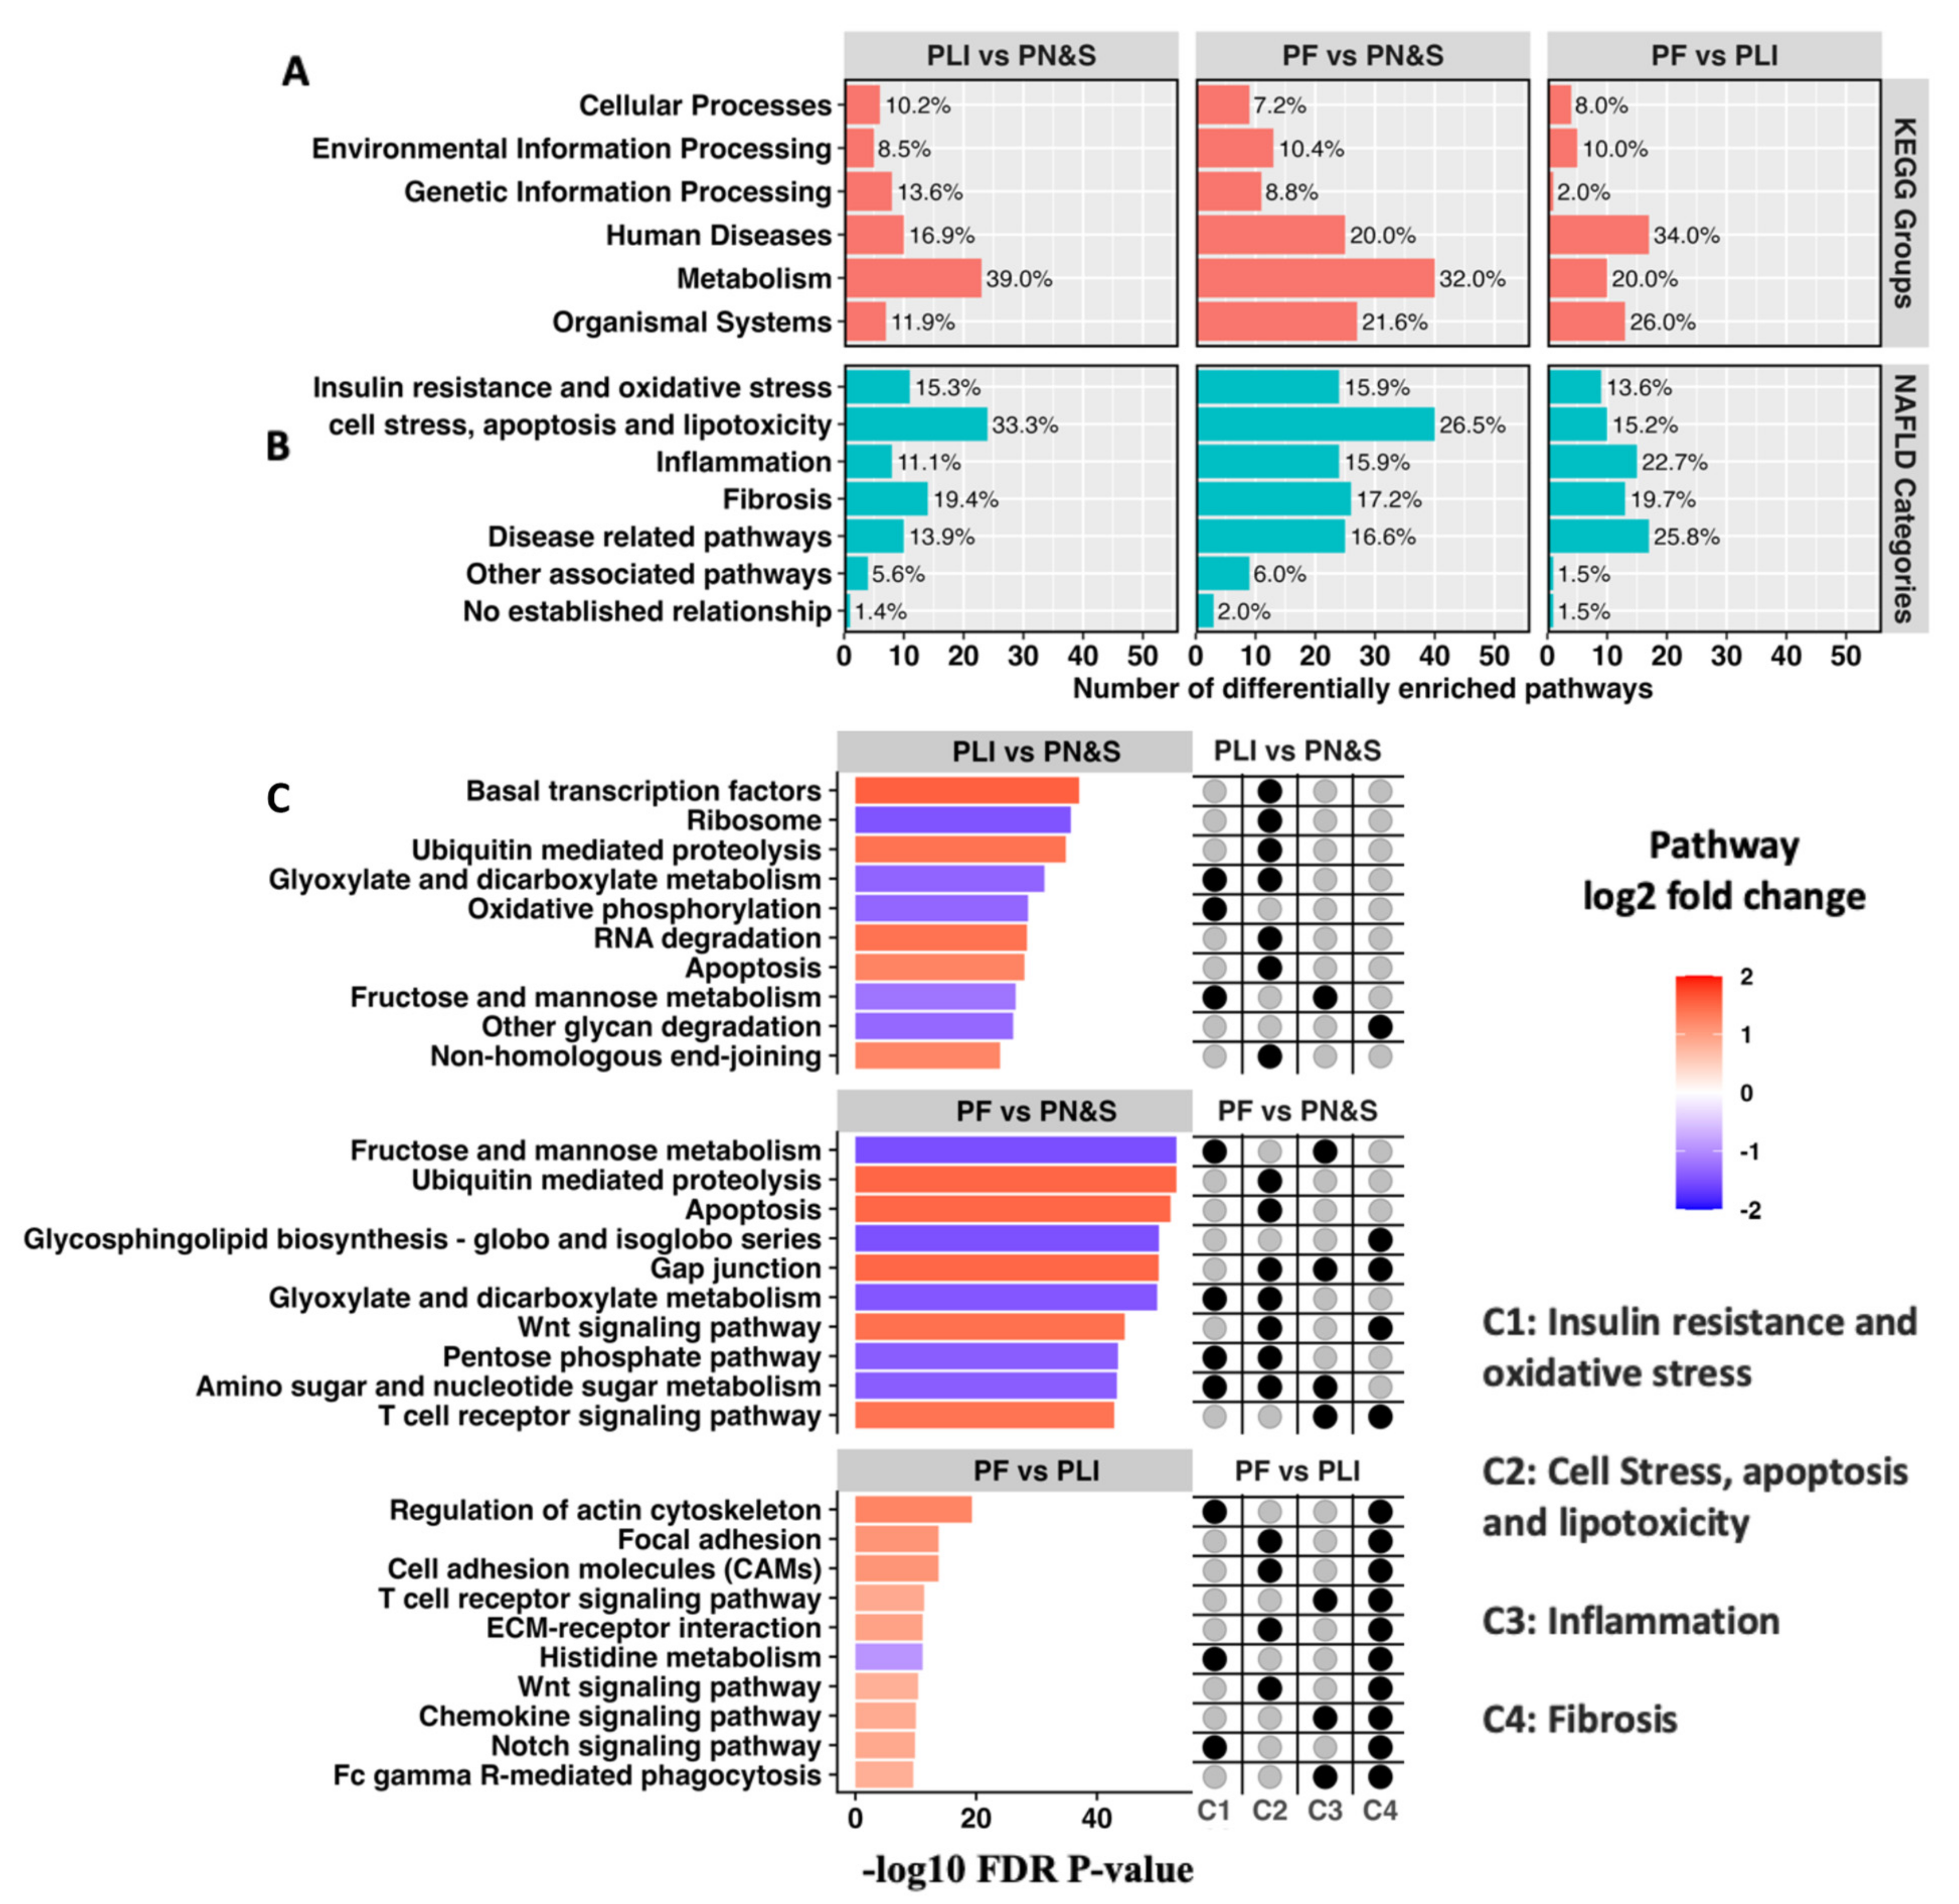
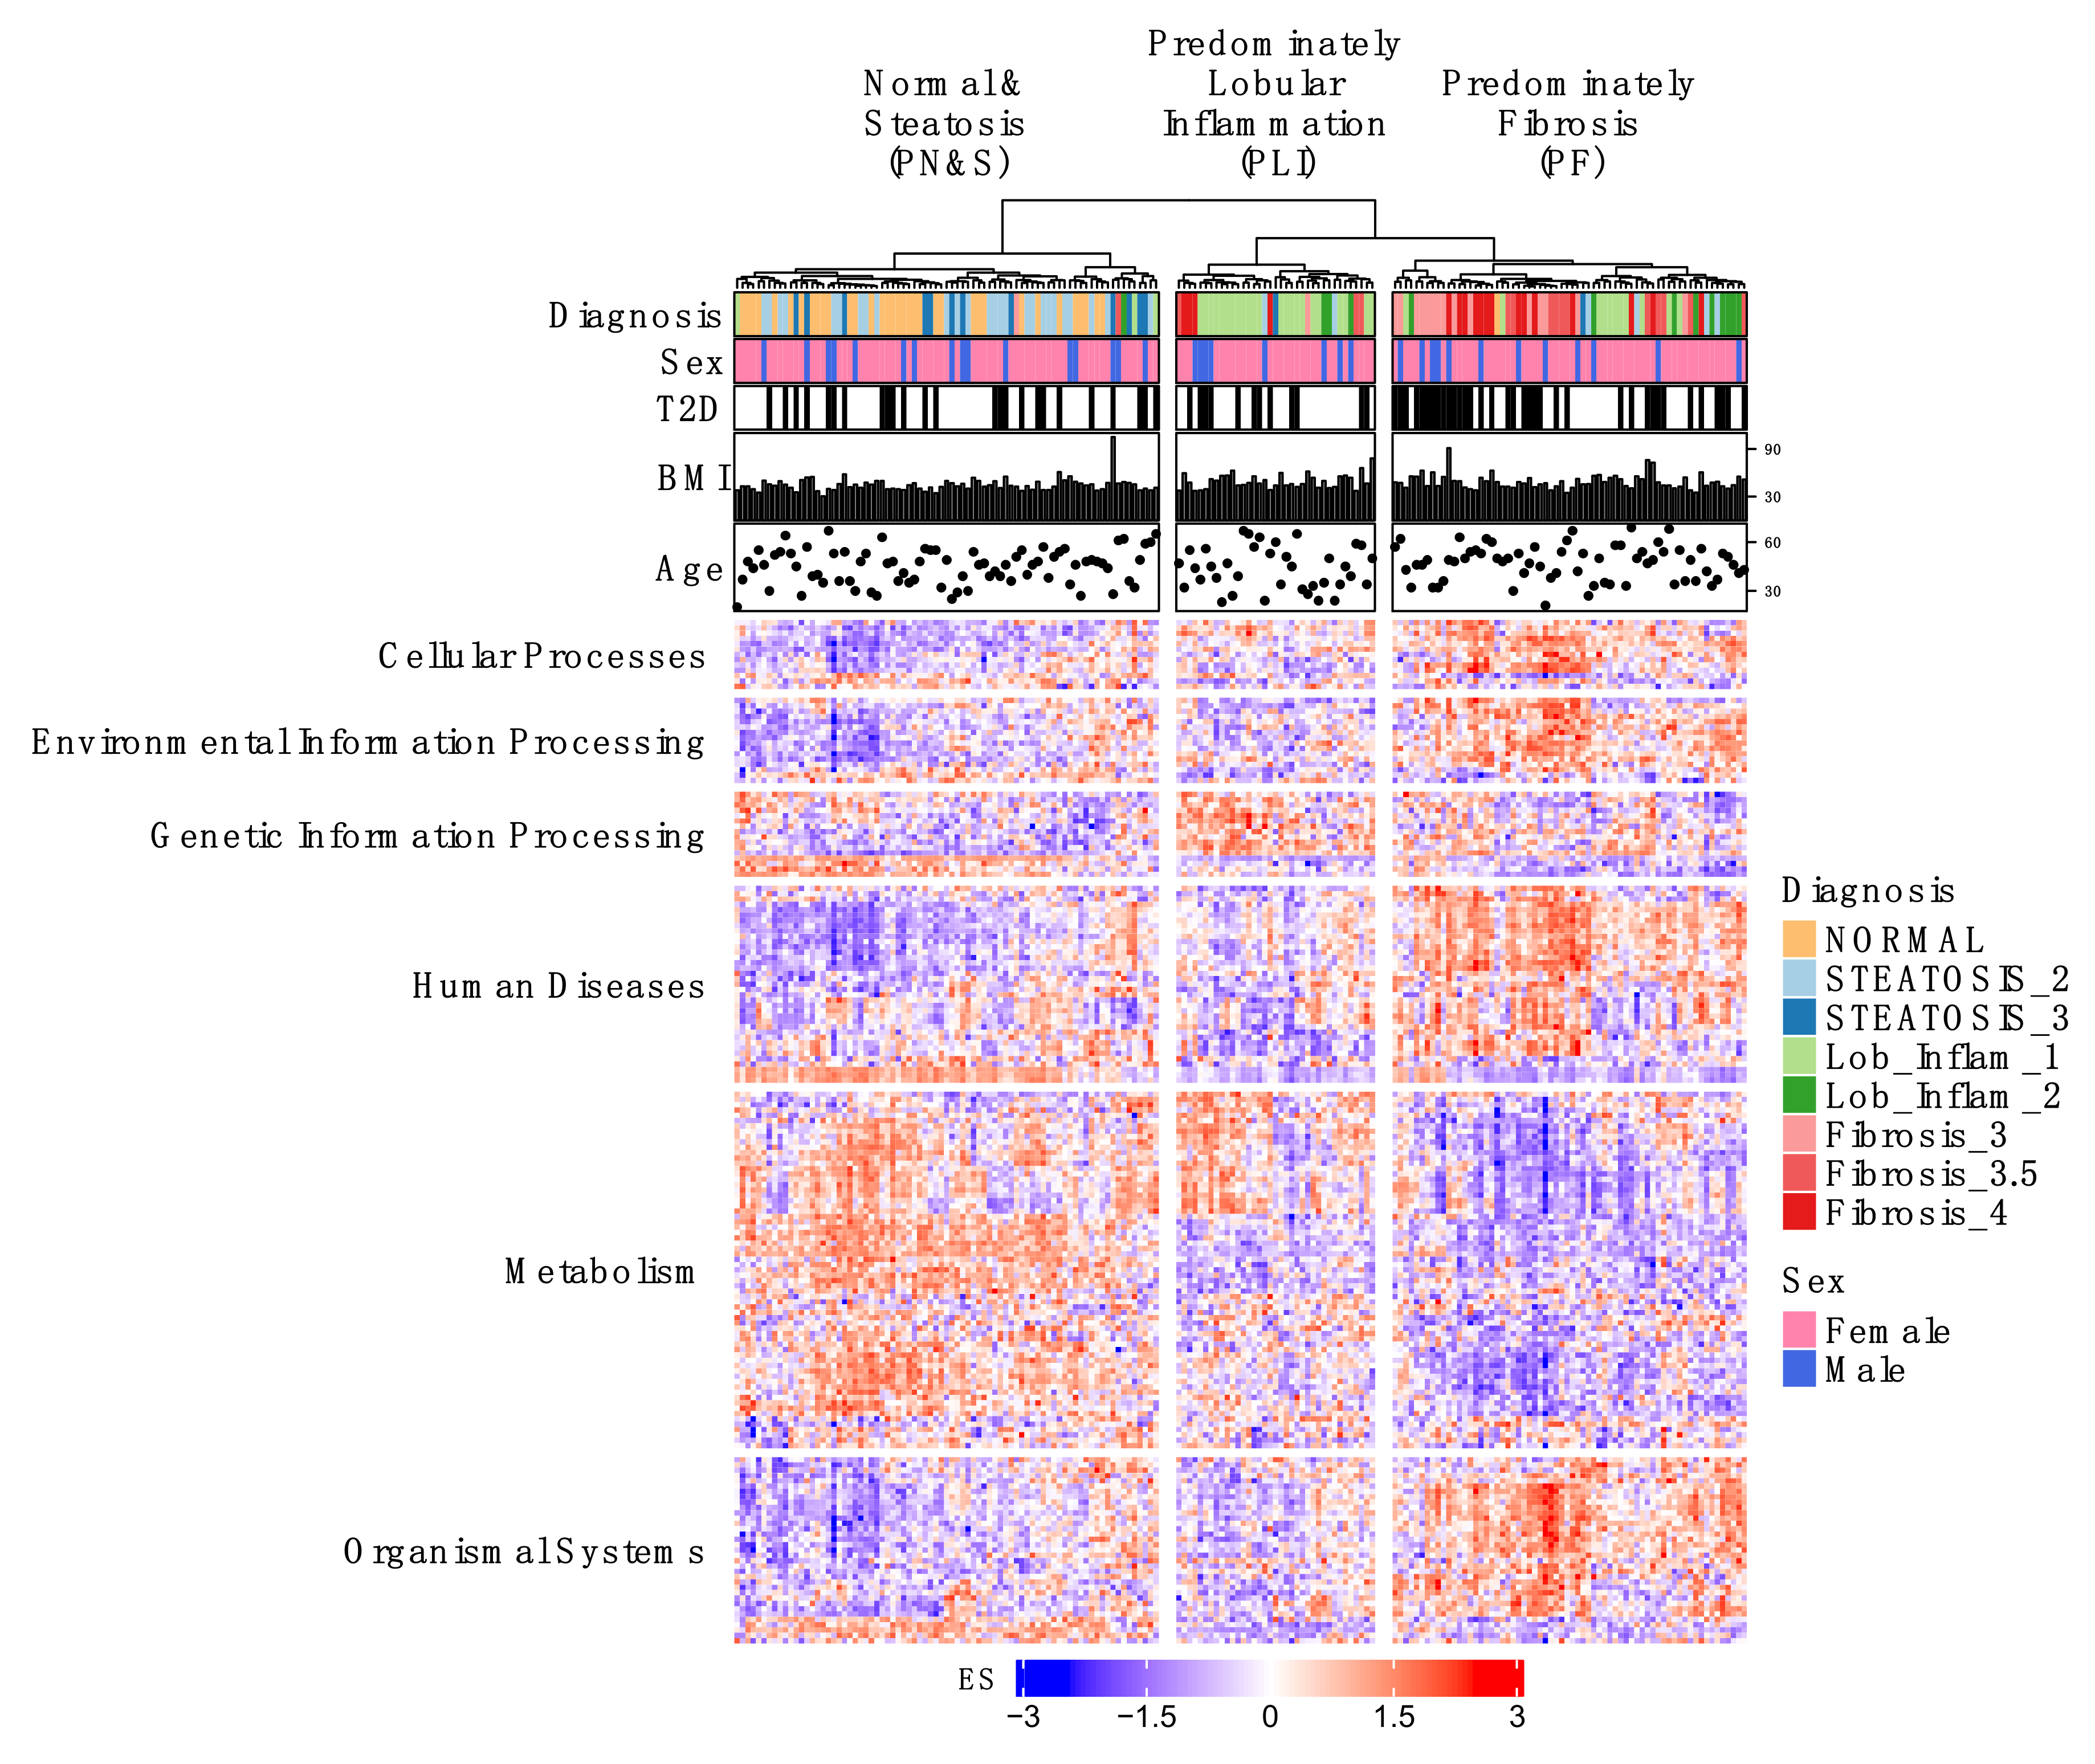
2.1. Individual Patient KEGG Pathway Enrichment Profiles Cluster According to Predominant NAFLD Subtypes
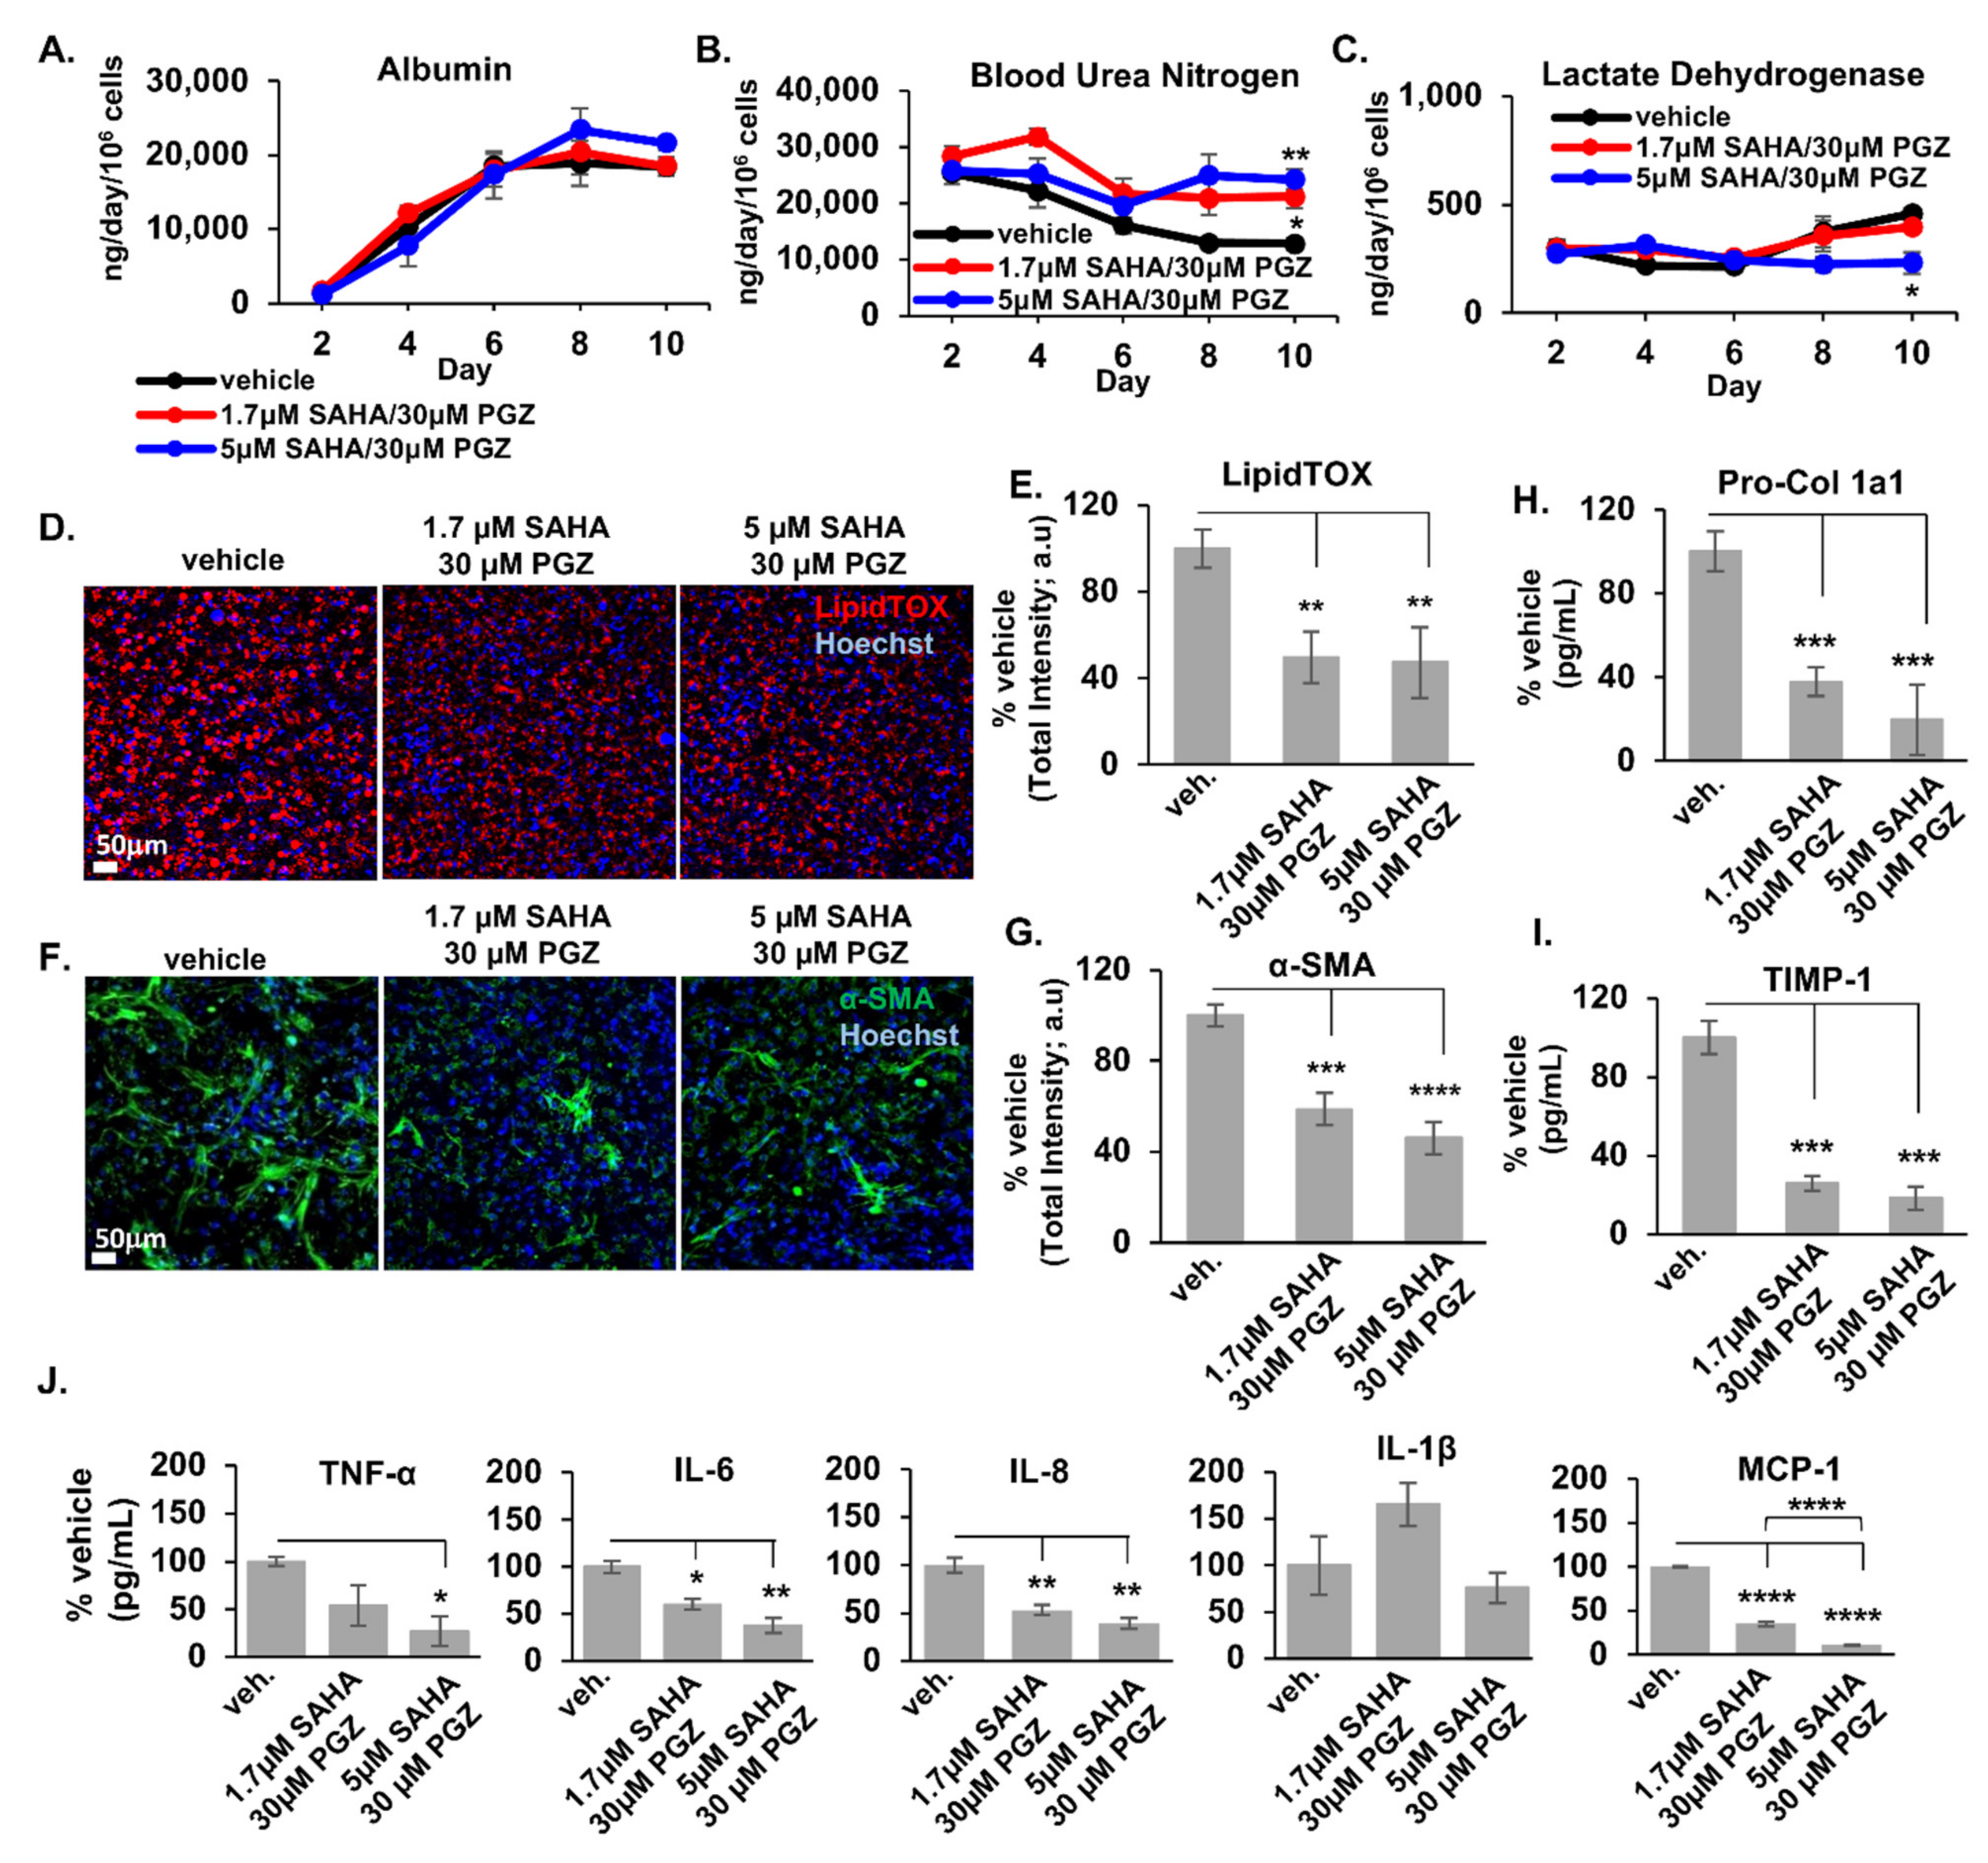
2.2. Initial Prediction and Testing of Drugs in a Human Liver MPS Model of NAFLD

2.3. Expansion and Complementary Prioritization of CMap Predicted Drugs Using Network Proximity

| Drug Name (DrugBank ID) | Gene Signature-Query Frequency | Gene Signature Indices (See Table S4) and Their Disease Categorization | Canonical Targets |
|---|---|---|---|
| Eltanolone * (DB12308) (pregnanolone) | 7 | s5: Insulin Resistance and Oxidative Stress s6: Cell Stress, Apoptosis, and Lipotoxicity s7: Inflammation s3: Inflammation s2: Cell Stress, Apoptosis, and Lipotoxicity s8: Fibrosis s1: Insulin Resistance and Oxidative Stress | (PXR) |
| Fenoprofen * (DB00573) | 7 | s5: Insulin Resistance and Oxidative Stress s6: Cell Stress, Apoptosis, and Lipotoxicity s7: Inflammation s8: Fibrosis s2: Cell Stress, Apoptosis, and Lipotoxicity s3: Inflammation s4: Fibrosis | PTGS2, PTGS1, PPARA, PPARG |
| Oxandrolone * (DB00621) | 7 | s2: Cell Stress, Apoptosis, and Lipotoxicity s6: Cell Stress, Apoptosis, and Lipotoxicity s3: Inflammation s4: Fibrosis s8: Fibrosis s1: Insulin Resistance and Oxidative Stress s5: Insulin Resistance and Oxidative Stress | AR |
| Cefotaxime * (DB00493) | 6 | s2: Cell Stress, Apoptosis, and Lipotoxicity s6: Cell Stress, Apoptosis, and Lipotoxicity s1: Insulin Resistance and Oxidative Stress s7: Inflammation s3: Inflammation s5: Insulin Resistance and Oxidative Stress | SLC22A6, SLC22A8, SLC22A11, SLC22A7, SLC15A1, ALB, SLC15A2 |
| Amorolfine * (DB09056) | 5 | s3: Inflammation s7: Inflammation s8: Fibrosis s5: Insulin Resistance and Oxidative Stress s6: Cell Stress, Apoptosis, and Lipotoxicity | |
| Dexamethasone * (DB01234) | 5 | s3: Inflammation s6: Cell Stress, Apoptosis, and Lipotoxicity s2: Cell Stress, Apoptosis, and Lipotoxicity s7: Inflammation s12: Fibrosis | NR3C1, NR0B1, ANXA1, NOS2, NR1I2 (PXR) |
| proxyphylline (DB13449) | 5 | s5: Insulin Resistance and Oxidative Stress s10: Cell Stress, Apoptosis, and Lipotoxicity s11: Inflammation s12: Fibrosis s9: Insulin Resistance and Oxidative Stress | |
| sn-38 * (DB05482) | 5 | s4: Fibrosis s2: Cell Stress, Apoptosis, and Lipotoxicity s5: Insulin Resistance and Oxidative Stress s6: Cell Stress, Apoptosis, and Lipotoxicity s7: Inflammation | TOP1, (PXR) |
| Sulfanitran * (DB11463) | 5 | s5: Insulin Resistance and Oxidative Stress s6: Cell Stress, Apoptosis, and Lipotoxicity s2: Cell Stress, Apoptosis, and Lipotoxicity s3: Inflammation s1: Insulin Resistance and Oxidative Stress | |
| Tetracycline * (DB00759) | 4 | s12: Fibrosis s6: Cell Stress, Apoptosis, and Lipotoxicity s8: Fibrosis s7: Inflammation | PRNP, PADI4, (PXR) |
| 7-hydroxystaurosporine * (DB01933) | 4 | s8: Fibrosis s6: Cell Stress, Apoptosis, and Lipotoxicity s2: Cell Stress, Apoptosis, and Lipotoxicity s4: Fibrosis | PDPK1 |
| dopamine (DB00988) | 4 | s12: Fibrosis s9: Insulin Resistance and Oxidative Stress s11: Inflammation s10: Cell Stress, Apoptosis, and Lipotoxicity | DRD2, DRD1, DRD5, DRD3, DRD4, SLC6A3, DBH, HTR1A, HTR7, SLC6A2, SLC6A4, HTR3A, HTR3B, SOD1, SLC18A2 |
| Medrysone * (DB00253) | 4 | s2: Cell Stress, Apoptosis, and Lipotoxicity s6: Cell Stress, Apoptosis, and Lipotoxicity s5: Insulin Resistance and Oxidative Stress s1: Insulin Resistance and Oxidative Stress | NR3C1 |
| Mestranol * (DB01357) | 4 | s2: Cell Stress, Apoptosis, and Lipotoxicity s6: Cell Stress, Apoptosis, and Lipotoxicity s4: Fibrosis s7: Inflammation | ESR1 |
| Norethindrone * (DB00717) | 4 | s10: Cell Stress, Apoptosis, and Lipotoxicity s12: Fibrosis s9: Insulin Resistance and Oxidative Stress s8: Fibrosis | PGR |
| Troxerutin * (DB13124) | 4 | s5: Insulin Resistance and Oxidative Stress s8: Fibrosis s7: Inflammation s6: Cell Stress, Apoptosis, and Lipotoxicity | |
| Brequinar * (DB03523) | 3 | s7: Inflammation s4: Fibrosis s3: Inflammation | DHODH |
| bromocriptine (DB01200) | 3 | s1: Insulin Resistance and Oxidative Stress s11: Inflammation s12: Fibrosis | DRD2, DRD3, HTR1D, ADRA2A, HTR1A, ADRA2C, ADRA2B, HTR2B, DRD4, HTR2A, HTR1B, HTR2C, DRD5, DRD1, ADRA1A, ADRA1B, ADRA1D, HTR7 |
| Cebranopadol * (DB12830) | 3 | s4: Fibrosis s7: Inflammation s8: Fibrosis | |
| flucloxacillin (DB00301) | 3 | s9: Insulin Resistance and Oxidative Stress s11: Inflammation s2: Cell Stress, Apoptosis, and Lipotoxicity | |
| granisetron (DB00889) | 3 | s11: Inflammation s10: Cell Stress, Apoptosis, and Lipotoxicity s12: Fibrosis | HTR3A |
| hexestrol (DB07931) | 3 | s9: Insulin Resistance and Oxidative Stress s10: Cell Stress, Apoptosis, and Lipotoxicity s11: Inflammation | AKR1C1, ESR1, NR1I2 (PXR), NR1I3 |
| iohexol (DB01362) | 3 | s1: Insulin Resistance and Oxidative Stress s4: Fibrosis s2: Cell Stress, Apoptosis, and Lipotoxicity | |
| Melphalan * (DB01042) | 3 | s3: Inflammation s5: Insulin Resistance and Oxidative Stress s6: Cell Stress, Apoptosis, and Lipotoxicity | |
| oxacillin (DB00713) | 3 | s9: Insulin Resistance and Oxidative Stress s12: Fibrosis s11: Inflammation | SLC15A1, SLC15A2 |
3. Discussion
4. Materials and Methods
4.1. Generation of Individual Patient Liver Gene Expression Profiles
4.2. Clustering of Individual Patient KEGG Pathway Enrichment Profiles Associated with NAFLD Clinical Subtypes
4.3. Identification of Differential Gene Expression Signatures for the Three Pairwise Comparisons within the Pathway Enrichment Clusters and within the Clinical Classifications
4.4. Comparative Pathway Analysis Using Additional NAFLD Patient Datasets
4.5. Drug Predictions Using the LINCS L1000 Database
4.6. Drug Prioritization Using Network Proximity Analysis
4.7. Experimental Drug Testing Using the Human Liver Acinus Microphysiology System (LAMPS)
4.8. Performing RNA-seq on the LAMPS NAFLD Models
4.9. Concordance Analysis of Differentially Enriched Pathways in Patients and LAMPS
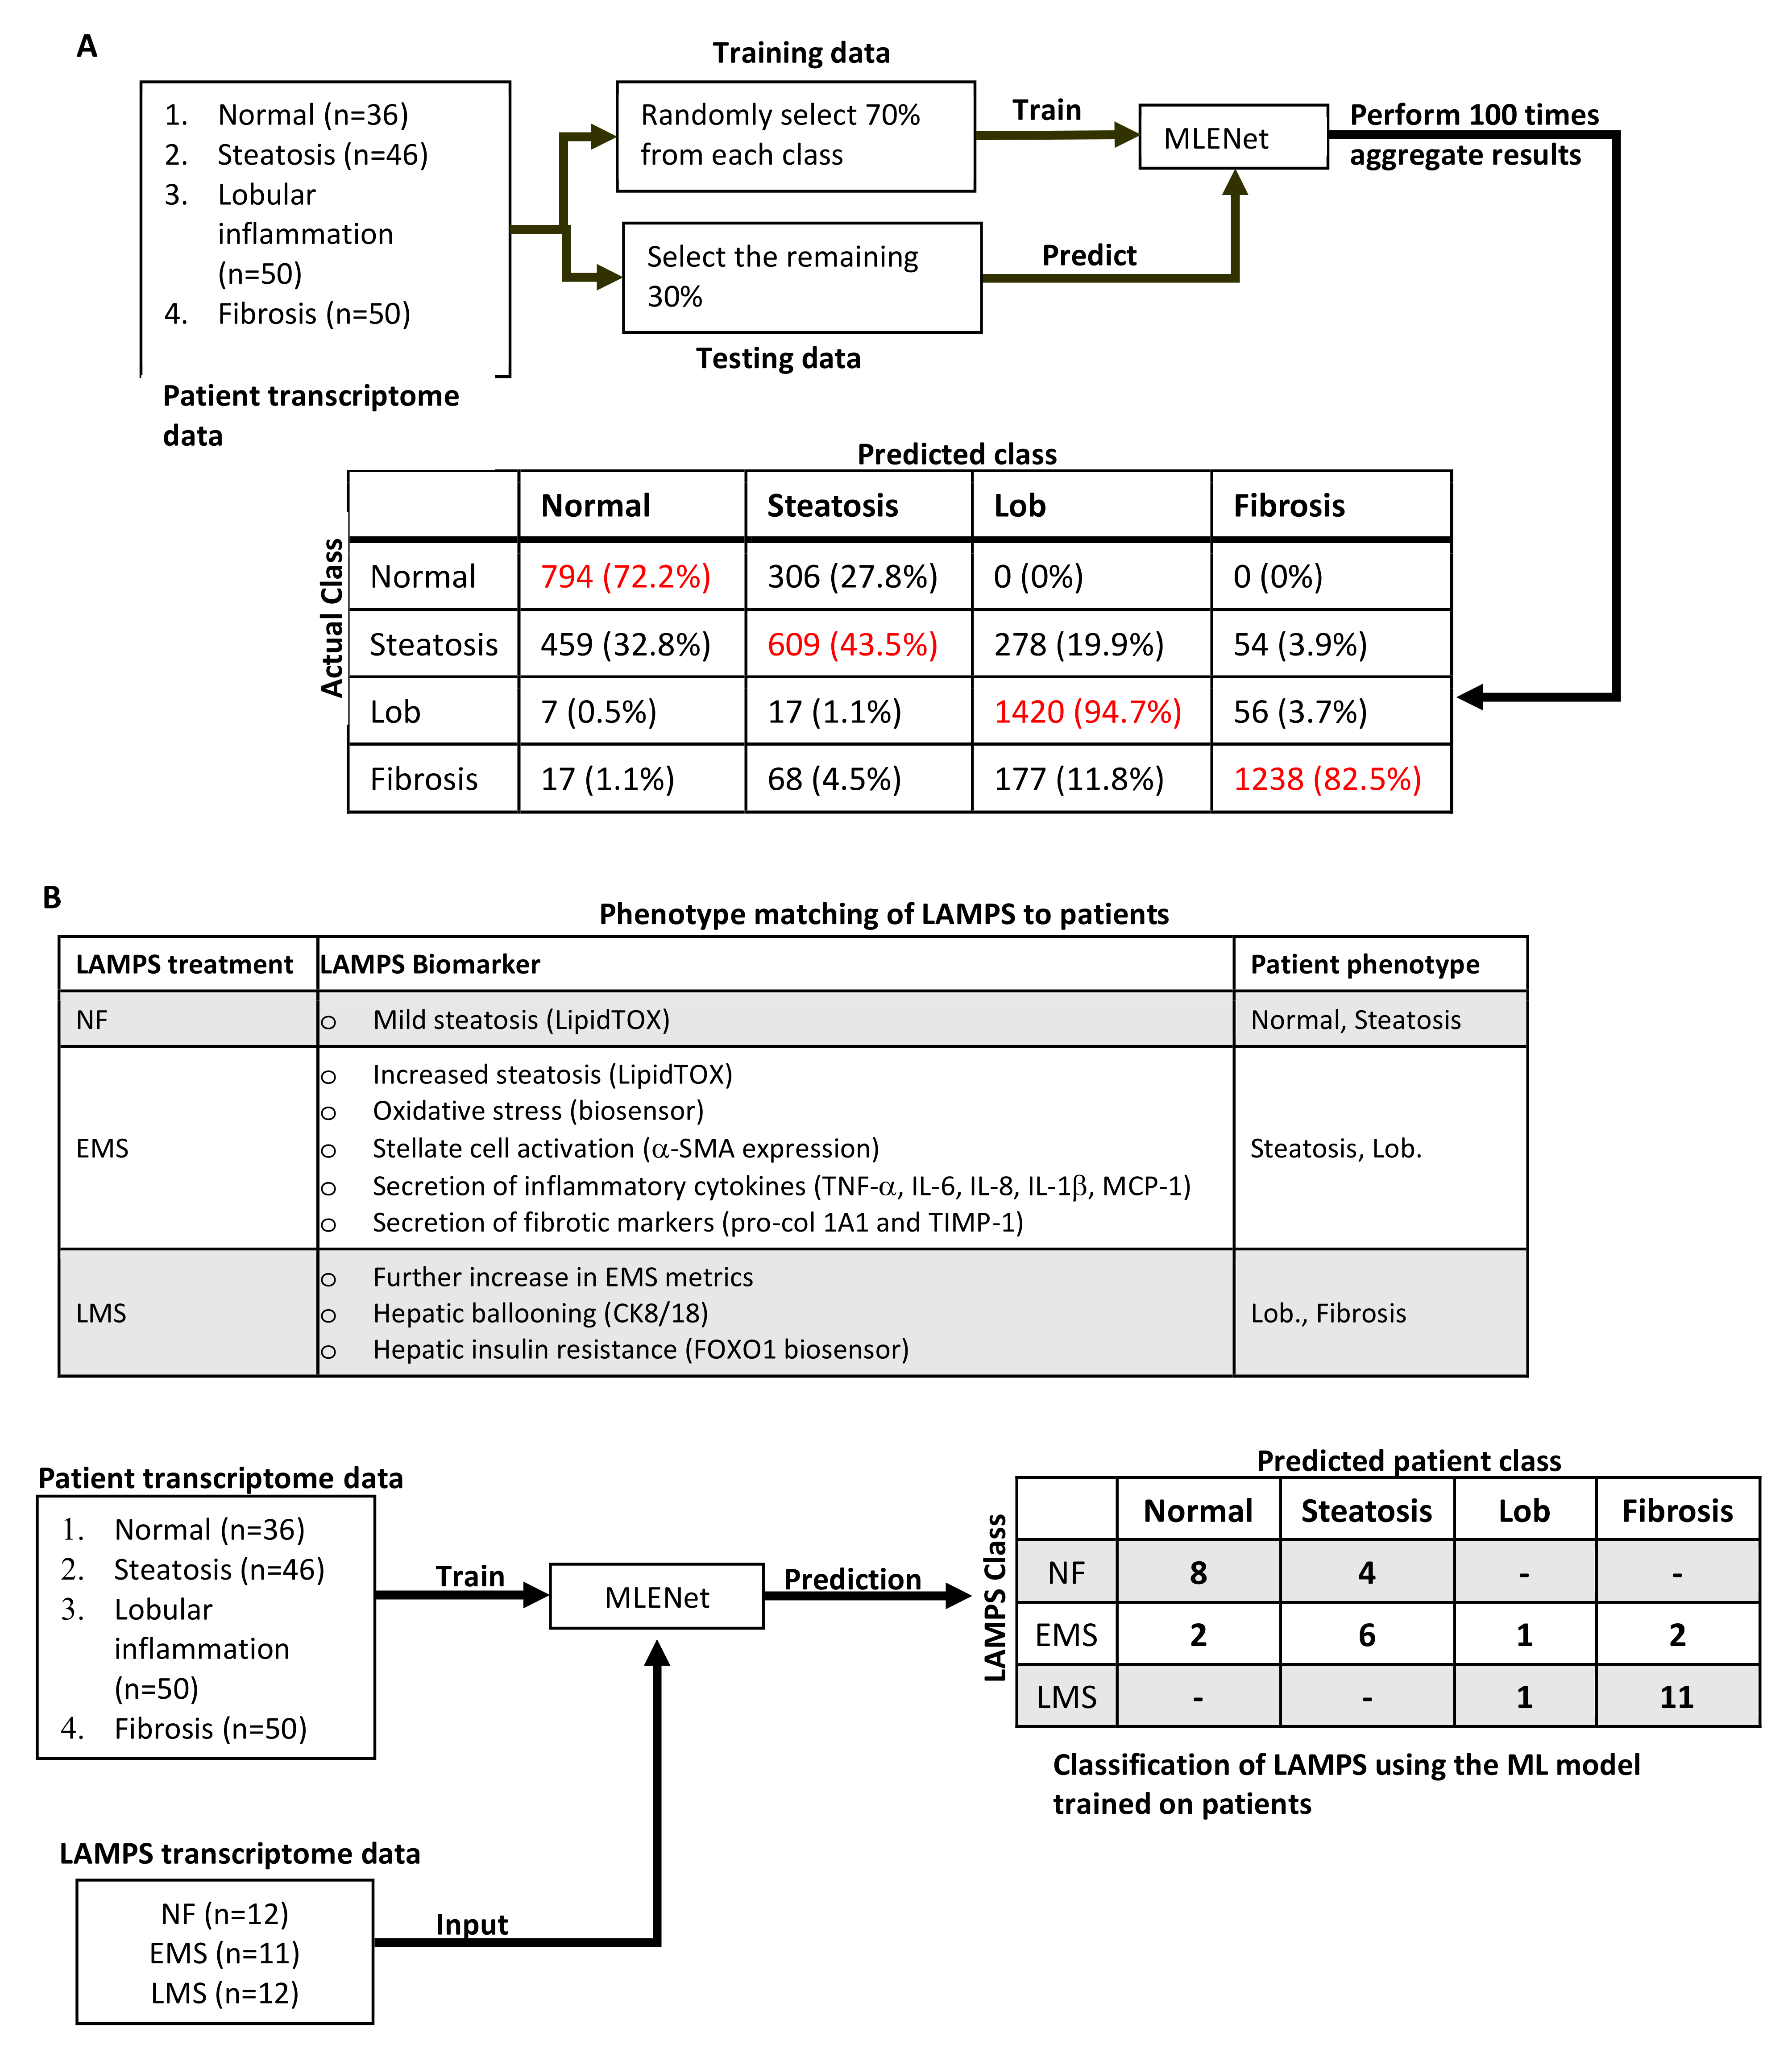
4.10. Comparing LAMPS NAFLD Model Transcriptomes to Patients via Multinomial Logistic Regression with Elastic Net Penalization (MLENet)
Supplementary Materials
Author Contributions
Funding
Institutional Review Board Statement
Informed Consent Statement
Data Availability Statement
Acknowledgments
Conflicts of Interest
References
- Eslam, M.; Sanyal, A.J.; George, J. MAFLD: A Consensus-Driven Proposed Nomenclature for Metabolic Associated Fatty Liver Disease. Gastroenterology 2020, 158, 1999–2014. [Google Scholar] [CrossRef]
- Friedman, S.L.; Neuschwander-Tetri, B.A.; Rinella, M.; Sanyal, A.J. Mechanisms of NAFLD development and therapeutic strategies. Nat. Med. 2018, 24, 908–922. [Google Scholar] [CrossRef] [PubMed]
- Loomba, R.; Friedman, S.L.; Shulman, G.I. Mechanisms and disease consequences of nonalcoholic fatty liver disease. Cell 2021, 184, 2537–2564. [Google Scholar] [CrossRef]
- Hardy, T.; Oakley, F.; Anstee, Q.M.; Day, C.P. Nonalcoholic Fatty Liver Disease: Pathogenesis and Disease Spectrum. Annu. Rev. Pathol. Mech. Dis. 2016, 11, 451–496. [Google Scholar] [CrossRef]
- Sanyal, A.J. Past, present and future perspectives in nonalcoholic fatty liver disease. Nat. Rev. Gastroenterol. Hepatol. 2019, 16, 377–386. [Google Scholar] [CrossRef] [PubMed]
- Younossi, Z.M.; Marchesini, G.; Pinto-Cortez, H.; Petta, S. Epidemiology of Nonalcoholic Fatty Liver Disease and Nonalcoholic Steatohepatitis: Implications for Liver Transplantation. Transplantation 2019, 103, 22–27. [Google Scholar] [CrossRef]
- Anstee, Q.M.; Reeves, H.L.; Kotsiliti, E.; Govaere, O.; Heikenwalder, M. From NASH to HCC: Current concepts and future challenges. Nat. Rev. Gastroenterol. Hepatol. 2019, 16, 411–428. [Google Scholar] [CrossRef] [PubMed]
- Younossi, Z.M.; Henry, L.; Bush, H.; Mishra, A. Clinical and Economic Burden of Nonalcoholic Fatty Liver Disease and Nonalcoholic Steatohepatitis. Clin. Liver Dis. 2017, 22, 1–10. [Google Scholar] [CrossRef]
- Polyzos, S.A.; Kountouras, J.; Anastasiadis, S.; Doulberis, M.; Katsinelos, P. Nonalcoholic fatty liver disease: Is it time for combination treatment and a diabetes-like approach? Hepatology 2018, 68, 389. [Google Scholar] [CrossRef] [Green Version]
- Wooden, B.; Goossens, N.; Hoshida, Y.; Friedman, S.L. Using Big Data to Discover Diagnostics and Therapeutics for Gastrointestinal and Liver Diseases. Gastroenterology 2017, 152, 53–67. [Google Scholar] [CrossRef] [Green Version]
- Mardinoglu, A.; Boren, J.; Smith, U.; Uhlen, M.; Nielsen, J. Systems biology in hepatology: Approaches and applications. Nat. Rev. Gastroenterol. Hepatol. 2018, 15, 365–377. [Google Scholar] [CrossRef]
- Yang, H.; Arif, M.; Yuan, M.; Li, X.; Shong, K.; Türkez, H.; Nielsen, J.; Uhlén, M.; Borén, J.; Zhang, C.; et al. A network-based approach reveals the dysregulated transcriptional regulation in non-alcoholic fatty liver disease. iScience 2021, 24, 103222. [Google Scholar] [CrossRef]
- Blencowe, M.; Karunanayake, T.; Wier, J.; Hsu, N.; Yang, X. Network Modeling Approaches and Applications to Unravelling Non-Alcoholic Fatty Liver Disease. Genes 2019, 10, 966. [Google Scholar] [CrossRef] [Green Version]
- Zareifi, D.S.; Chaliotis, O.; Chala, N.; Meimetis, N.; Sofotasiou, M.; Zeakis, K.; Pantiora, E.; Vezakis, A.; Matsopoulos, G.K.; Fragulidis, G.; et al. A network-based computational and experimental framework for repurposing compounds toward the treatment of non-alcoholic fatty liver disease. iScience 2022, 25, 103890. [Google Scholar] [CrossRef]
- Taylor, D.L.; Gough, A.; Schurdak, M.E.; Vernetti, L.; Chennubhotla, C.S.; Lefever, D.; Pei, F.; Faeder, J.R.; Lezon, T.R.; Stern, A.M.; et al. Harnessing Human Microphysiology Systems as Key Experimental Models for Quantitative Systems Pharmacology. Handb. Exp. Pharmacol. 2019, 260, 327–367. [Google Scholar] [CrossRef]
- Gough, A.; Soto-Gutierrez, A.; Vernetti, L.; Ebrahimkhani, M.R.; Stern, A.M.; Taylor, D.L. Human biomimetic liver microphysiology systems in drug development and precision medicine. Nat. Rev. Gastroenterol. Hepatol. 2020, 18, 252–268. [Google Scholar] [CrossRef]
- Collin de l’Hortet, A.; Takeishi, K.; Guzman-Lepe, J.; Morita, K.; Achreja, A.; Popovic, B.; Wang, Y.; Handa, K.; Mittal, A.; Meurs, N.; et al. Generation of Human Fatty Livers Using Custom-Engineered Induced Pluripotent Stem Cells with Modifiable SIRT1 Metabolism. Cell Metab. 2019, 30, 385–401. [Google Scholar] [CrossRef]
- Stern, A.M.; Schurdak, M.E.; Bahar, I.; Berg, J.M.; Taylor, D.L. A Perspective on Implementing a Quantitative Systems Pharmacology Platform for Drug Discovery and the Advancement of Personalized Medicine. J. Biomol. Screen. 2016, 21, 521–534. [Google Scholar] [CrossRef] [Green Version]
- Gerhard, G.S.; Legendre, C.; Still, C.D.; Chu, X.; Petrick, A.; Distefano, J.K. Transcriptomic Profiling of Obesity-Related Nonalcoholic Steatohepatitis Reveals a Core Set of Fibrosis-Specific Genes. J. Endocr. Soc. 2018, 2, 710–726. [Google Scholar] [CrossRef] [Green Version]
- Subramanian, A.; Narayan, R.; Corsello, S.M.; Peck, D.D.; Natoli, T.E.; Lu, X.; Gould, J.; Davis, J.F.; Tubelli, A.A.; Asiedu, J.K.; et al. A next generation connectivity map: L1000 platform and the first 1,000,000 profiles. Cell 2017, 171, 1437–1452. [Google Scholar] [CrossRef]
- Keenan, A.B.; Jenkins, S.L.; Jagodnik, K.M.; Koplev, S.; He, E.; Torre, D.; Wang, Z.; Dohlman, A.B.; Silverstein, M.C.; Lachmann, A.; et al. The Library of Integrated Network-Based Cellular Signatures NIH Program: System-Level Cataloging of Human Cells Response to Perturbations. Cell Syst. 2018, 6, 13–24. [Google Scholar] [CrossRef] [Green Version]
- Lamb, J.; Crawford, E.D.; Peck, D.; Modell, J.W.; Blat, I.C.; Wrobel, M.J.; Lerner, J.; Brunet, J.-P.; Subramanian, A.; Ross, K.N.; et al. The Connectivity Map: Using Gene-Expression Signatures to Connect Small Molecules, Genes, and Disease. Science 2006, 313, 1929–1935. [Google Scholar] [CrossRef] [Green Version]
- Guney, E.; Menche, J.; Vidal, M.; Barabasi, A.L. Network-based in silico drug efficacy screening. Nat. Commun. 2016, 7, 10331. Available online: https://www.nature.com/articles/ncomms10331#supplementary-information (accessed on 2 June 2022). [CrossRef] [PubMed] [Green Version]
- Liberzon, A.; Subramanian, A.; Pinchback, R.; Thorvaldsdóttir, H.; Tamayo, P.; Mesirov, J.P. Molecular signatures database (MSigDB) 3.0. Bioinformatics 2011, 27, 1739–1740. [Google Scholar] [CrossRef] [PubMed]
- Hänzelmann, S.; Castelo, R.; Guinney, J. GSVA: Gene set variation analysis for microarray and RNA-Seq data. BMC Bioinform. 2013, 14, 7. [Google Scholar] [CrossRef] [Green Version]
- Lefever, D. Software for Selecting Repurposable Drugs using QSP. Available online: https://github.com/lefeverde/QSPpaper (accessed on 13 May 2021).
- Bazick, J.; Donithan, M.; Neuschwander-Tetri, B.A.; Kleiner, D.; Brunt, E.M.; Wilson, L.; Doo, E.; Lavine, J.; Tonascia, J.; Loomba, R. Clinical Model for NASH and Advanced Fibrosis in Adult Patients With Diabetes and NAFLD: Guidelines for Referral in NAFLD. Diabetes Care 2015, 38, 1347–1355. [Google Scholar] [CrossRef] [PubMed] [Green Version]
- Portillo-Sanchez, P.; Bril, F.; Maximos, M.; Lomonaco, R.; Biernacki, D.; Orsak, B.; Subbarayan, S.; Webb, A.; Hecht, J.; Cusi, K. High Prevalence of Nonalcoholic Fatty Liver Disease in Patients With Type 2 Diabetes Mellitus and Normal Plasma Aminotransferase Levels. J. Clin. Endocrinol. Metab. 2015, 100, 2231–2238. [Google Scholar] [CrossRef]
- Kwok, R.; Choi, K.C.; Wong, G.L.-H.; Zhang, Y.; Chan, H.L.-Y.; Luk, A.O.-Y.; Shu, S.S.-T.; Chan, A.W.-H.; Yeung, M.-W.; Chan, J.C.-N.; et al. Screening diabetic patients for non-alcoholic fatty liver disease with controlled attenuation parameter and liver stiffness measurements: A prospective cohort study. Gut 2015, 65, 1359–1368. [Google Scholar] [CrossRef]
- Zhu, C.; Kim, K.; Wang, X.; Bartolome, A.; Salomao, M.; Dongiovanni, P.; Meroni, M.; Graham, M.J.; Yates, K.P.; Diehl, A.M.; et al. Hepatocyte Notch activation induces liver fibrosis in nonalcoholic steatohepatitis. Sci. Transl. Med. 2018, 10, eaat0344. [Google Scholar] [CrossRef]
- Zhao, X.-K.; Yu, L.; Cheng, M.-L.; Che, P.; Lu, Y.-Y.; Zhang, Q.; Mu, M.; Li, H.; Zhu, L.-L.; Zhu, J.-J.; et al. Focal Adhesion Kinase Regulates Hepatic Stellate Cell Activation and Liver Fibrosis. Sci. Rep. 2017, 7, 4032. [Google Scholar] [CrossRef] [PubMed]
- Wang, J.-N.; Li, L.; Li, L.-Y.; Yan, Q.; Li, J.; Xu, T. Emerging role and therapeutic implication of Wnt signaling pathways in liver fibrosis. Gene 2018, 674, 57–69. [Google Scholar] [CrossRef] [PubMed]
- Sircana, A.; Paschetta, E.; Saba, F.; Molinaro, F.; Musso, G. Recent Insight into the Role of Fibrosis in Nonalcoholic Steatohepatitis-Related Hepatocellular Carcinoma. Int. J. Mol. Sci. 2019, 20, 1745. [Google Scholar] [CrossRef] [Green Version]
- Ramachandran, P.; Iredale, J.P. Macrophages: Central regulators of hepatic fibrogenesis and fibrosis resolution. J. Hepatol. 2012, 56, 1417–1419. [Google Scholar] [CrossRef] [Green Version]
- Kennedy, L.; Hargrove, L.; Demieville, J.; Bailey, J.M.; Dar, W.; Polireddy, K.; Chen, Q.; Nevah Rubin, M.I.; Sybenga, A.; DeMorrow, S.; et al. Knockout of l-Histidine Decarboxylase Prevents Cholangiocyte Damage and Hepatic Fibrosis in Mice Subjected to High-Fat Diet Feeding via Disrupted Histamine/Leptin Signaling. Am. J. Pathol. 2018, 188, 600–615. [Google Scholar] [CrossRef] [Green Version]
- Hintermann, E.; Christen, U. The Many Roles of Cell Adhesion Molecules in Hepatic Fibrosis. Cells 2019, 8, 1503. [Google Scholar] [CrossRef] [Green Version]
- Diedrich, T.; Kummer, S.; Galante, A.; Drolz, A.; Schlicker, V.; Lohse, A.W.; Kluwe, J.; Eberhard, J.M.; Schulze Zur Wiesch, J. Characterization of the immune cell landscape of patients with NAFLD. PLoS ONE 2020, 15, e0230307. [Google Scholar] [CrossRef] [PubMed] [Green Version]
- Park, K.C.; Park, J.H.; Jeon, J.Y.; Kim, S.Y.; Kim, J.M.; Lim, C.Y.; Lee, T.H.; Kim, H.K.; Lee, H.G.; Kim, S.M.; et al. A new histone deacetylase inhibitor improves liver fibrosis inBDLrats through suppression of hepatic stellate cells. Br. J. Pharmacol. 2014, 171, 4820–4830. [Google Scholar] [CrossRef]
- Huang, H.-M.; Fan, S.-J.; Zhou, X.-R.; Liu, Y.-J.; Li, X.; Liao, L.-P.; Huang, J.; Shi, C.-C.; Yu, L.; Fu, R.; et al. Histone deacetylase inhibitor givinostat attenuates nonalcoholic steatohepatitis and liver fibrosis. Acta Pharmacol. Sin. 2022, 43, 941–953. [Google Scholar] [CrossRef]
- Lee-Montiel, F.T.; George, S.; Gough, A.H.; Sharma, A.D.; Wu, J.; DeBiasio, R.; Vernetti, L.; Taylor, D.L. Control of oxygen tension recapitulates zone-specific functions in human liver microphysiology systems. Exp. Biol. Med. 2017, 242, 1617–1632. [Google Scholar] [CrossRef] [PubMed] [Green Version]
- Saydmohammed, M.; Jha, A.; Mahajan, V.; Gavlock, D.; Shun, T.Y.; DeBiasio, R.; Lefever, D.; Li, X.; Reese, C.; E Kershaw, E.; et al. Quantifying the progression of non-alcoholic fatty liver disease in human biomimetic liver microphysiology systems with fluorescent protein biosensors. Exp. Biol. Med. 2021, 246, 2420–2441. [Google Scholar] [CrossRef] [PubMed]
- Sakolish, C.; Reese, C.E.; Luo, Y.-S.; Valdiviezo, A.; Schurdak, M.E.; Gough, A.; Taylor, D.L.; Chiu, W.A.; Vernetti, L.A.; Rusyn, I. Analysis of reproducibility and robustness of a human microfluidic four-cell liver acinus microphysiology system (LAMPS). Toxicology 2020, 448, 152651. [Google Scholar] [CrossRef]
- Shah, R.A.; Kowdley, K.V. Obeticholic acid for the treatment of nonalcoholic steatohepatitis. Expert Rev. Gastroenterol. Hepatol. 2020, 14, 311–321. [Google Scholar] [CrossRef]
- Younossi, Z.M.; Ratziu, V.; Loomba, R.; Rinella, M.; Anstee, Q.M.; Goodman, Z.; Bedossa, P.; Geier, A.; Beckebaum, S.; Newsome, P.N.; et al. Obeticholic acid for the treatment of non-alcoholic steatohepatitis: Interim analysis from a multicentre, randomised, placebo-controlled phase 3 trial. Lancet 2019, 394, 2184–2196. [Google Scholar] [CrossRef] [Green Version]
- Musso, G.; Cassader, M.; Paschetta, E.; Gambino, R. Thiazolidinediones and Advanced Liver Fibrosis in Nonalcoholic Steatohepatitis: A Meta-analysis. JAMA Intern. Med. 2017, 177, 633–640. [Google Scholar] [CrossRef]
- Leclercq, I.; Sempoux, C.; Starkel, P.; Horsmans, Y. Limited therapeutic efficacy of pioglitazone on progression of hepatic fibrosis in rats. Gut 2006, 55, 1020–1029. [Google Scholar] [CrossRef]
- Kostrzewski, T.; Maraver, P.; Ouro-Gnao, L.; Levi, A.; Snow, S.; Miedzik, A.; Rombouts, K.; Hughes, D. A Microphysiological System for Studying Nonalcoholic Steatohepatitis. Hepatol. Commun. 2019, 4, 77–91. [Google Scholar] [CrossRef] [Green Version]
- Vega, G.L.; Clarenbach, J.J.; Dunn, F.; Grundy, S.M. Oxandrolone Enhances Hepatic Ketogenesis in Adult Men. J. Investig. Med. 2008, 56, 920–924. [Google Scholar] [CrossRef] [PubMed]
- Watanabe, M.; Tozzi, R.; Risi, R.; Tuccinardi, D.; Mariani, S.; Basciani, S.; Spera, G.; Lubrano, C.; Gnessi, L. Beneficial effects of the ketogenic diet on nonalcoholic fatty liver disease: A comprehensive review of the literature. Obes. Rev. 2020, 21, e13024. [Google Scholar] [CrossRef] [Green Version]
- Luukkonen, P.K.; Dufour, S.; Lyu, K.; Zhang, X.-M.; Hakkarainen, A.; Lehtimäki, T.E.; Cline, G.W.; Petersen, K.F.; Shulman, G.I.; Yki-Järvinen, H. Effect of a ketogenic diet on hepatic steatosis and hepatic mitochondrial metabolism in nonalcoholic fatty liver disease. Proc. Natl. Acad. Sci. USA 2020, 117, 7347–7354. [Google Scholar] [CrossRef] [Green Version]
- Li, T.-T.; An, J.-X.; Xu, J.-Y.; Tuo, B.-G. Overview of organic anion transporters and organic anion transporter polypeptides and their roles in the liver. World J. Clin. Cases 2019, 7, 3915–3933. [Google Scholar] [CrossRef] [PubMed]
- Naik, A.; Belič, A.; Zanger, U.M.; Rozman, D. Molecular Interactions between NAFLD and Xenobiotic Metabolism. Front. Genet. 2013, 4, 2. [Google Scholar] [CrossRef] [PubMed] [Green Version]
- Cave, M.C.; Clair, H.B.; Hardesty, J.E.; Falkner, K.C.; Feng, W.; Clark, B.J.; Sidey, J.; Shi, H.; Aqel, B.A.; McClain, C.J.; et al. Nuclear receptors and nonalcoholic fatty liver disease. Biochim. Biophys. Acta (BBA) Gene Regul. Mech. 2016, 1859, 1083–1099. [Google Scholar] [CrossRef] [PubMed] [Green Version]
- Sayaf, K.; Zanotto, I.; Russo, F.P.; Gabbia, D.; De Martin, S. The Nuclear Receptor PXR in Chronic Liver Disease. Cells 2021, 11, 61. [Google Scholar] [CrossRef]
- Kanehisa, M.; Furumichi, M.; Tanabe, M.; Sato, Y.; Morishima, K. KEGG: New perspectives on genomes, pathways, diseases and drugs. Nucleic Acids Res. 2017, 45, D353–D361. [Google Scholar] [CrossRef] [Green Version]
- Kanehisa, M.; Goto, S. KEGG: Kyoto Encyclopedia of Genes and Genomes. Nucleic Acids Res. 2000, 28, 27–30. [Google Scholar] [CrossRef]
- Xu, G.; Fu, S.; Zhan, X.; Wang, Z.; Zhang, P.; Shi, W.; Qin, N.; Chen, Y.; Wang, C.; Niu, M.; et al. Echinatin effectively protects against NLRP3 inflammasome–driven diseases by targeting HSP90. JCI Insight 2021, 6, 1–17. [Google Scholar] [CrossRef]
- Nakagami, H.; Shimamura, M.; Miyake, T.; Shimosato, T.; Minobe, N.; Moritani, T.; Kiomy Osako, M.; Nakagami, F.; Koriyama, H.; Kyutoku, M.; et al. Nifedipine prevents hepatic fibrosis in a non-alcoholic steatohepatitis model induced by an L-methionine-and choline-deficient diet. Mol. Med. Rep. 2011, 5, 37–40. [Google Scholar] [CrossRef] [Green Version]
- Lee, S.; Han, D.; Kang, H.-G.; Jeong, S.J.; Jo, J.-E.; Shin, J.; Kim, D.K.; Park, H.-W. Intravenous sustained-release nifedipine ameliorates nonalcoholic fatty liver disease by restoring autophagic clearance. Biomaterials 2019, 197, 1–11. [Google Scholar] [CrossRef]
- Doumas, M.; Imprialos, K.; Dimakopoulou, A.; Stavropoulos, K.; Binas, A.; Athyros, V.G. The Role of Statins in the Management of Nonalcoholic Fatty Liver Disease. Curr. Pharm. Des. 2019, 24, 4587–4592. [Google Scholar] [CrossRef]
- Lee, J.I.; Lee, H.W.; Lee, K.S.; Lee, H.S.; Park, J.-Y. Effects of Statin Use on the Development and Progression of Nonalcoholic Fatty Liver Disease: A Nationwide Nested Case-Control Study. Am. J. Gastroenterol. 2020, 116, 116–124. [Google Scholar] [CrossRef]
- Ratziu, V.; Friedman, S.L. Why do so many NASH trials fail? Gastroenterology 2020, 1–9. [Google Scholar] [CrossRef]
- Vernetti, L.A.; Senutovitch, N.; Boltz, R.; DeBiasio, R.; Shun, T.Y.; Gough, A.; Taylor, D.L. A human liver microphysiology platform for investigating physiology, drug safety, and disease models. Exp. Biol. Med. 2015, 241, 101–114. [Google Scholar] [CrossRef]
- Kim, M.; Lee, H.-A.; Cho, H.-M.; Kang, S.-H.; Lee, E.; Kim, I.K. Histone deacetylase inhibition attenuates hepatic steatosis in rats with experimental Cushing’s syndrome. Korean J. Physiol. Pharmacol. 2018, 22, 23–33. [Google Scholar] [CrossRef] [Green Version]
- Cheng, Z.; Wen, Y.; Liang, B.; Chen, S.; Liu, Y.; Wang, Z.; Cheng, J.; Tang, X.; Xin, H.; Deng, L. Gene expression profile-based drug screen identifies SAHA as a novel treatment for NAFLD. Mol. Omics 2019, 15, 50–58. [Google Scholar] [CrossRef] [PubMed]
- Oladimeji, P.; Chen, T. PXR: More Than Just a Master Xenobiotic Receptor. Mol. Pharmacol. 2017, 93, 119–127. [Google Scholar] [CrossRef]
- Zerbino, D.R.; Achuthan, P.; Akanni, W.; Amode, M.R.; Barrell, D.; Bhai, J.; Billis, K.; Cummins, C.; Gall, A.; Girón, C.G.; et al. Ensembl 2018. Nucleic Acids Res. 2018, 46, D754–D761. [Google Scholar] [CrossRef] [PubMed]
- Bray, N.L.; Pimentel, H.; Melsted, P.; Pachter, L. Near-optimal probabilistic RNA-seq quantification. Nat. Biotechnol. 2016, 34, 525–527. [Google Scholar] [CrossRef]
- Soneson, C.; Love, M.I.; Robinson, M.D. Differential analyses for RNA-seq: Transcript-level estimates improve gene-level inferences. F1000Research 2016, 4, 1521. [Google Scholar] [CrossRef]
- Ritchie, M.E.; Phipson, B.; Wu, D.; Hu, Y.; Law, C.W.; Shi, W.; Smyth, G.K. limma powers differential expression analyses for RNA-sequencing and microarray studies. Nucleic Acids Res. 2015, 43, e47. [Google Scholar] [CrossRef]
- Law, C.W.; Chen, Y.; Shi, W.; Smyth, G.K. Voom: Precision weights unlock linear model analysis tools for RNA-seq read counts. Genome Biol. 2014, 15, R29. [Google Scholar] [CrossRef] [Green Version]
- Leek, J.T.; Storey, J.D. Capturing Heterogeneity in Gene Expression Studies by Surrogate Variable Analysis. PLoS Genet. 2007, 3, e161. [Google Scholar] [CrossRef] [Green Version]
- Leek, J.T.; Johnson, W.E.; Parker, H.S.; Jaffe, A.E.; Storey, J.D. The sva package for removing batch effects and other unwanted variation in high-throughput experiments. Bioinformatics 2012, 28, 882–883. [Google Scholar] [CrossRef]
- Subramanian, A.; Tamayo, P.; Mootha, V.K.; Mukherjee, S.; Ebert, B.L.; Gillette, M.A.; Paulovich, A.; Pomeroy, S.L.; Golub, T.R.; Lander, E.S.; et al. Gene set enrichment analysis: A knowledge-based approach for interpreting genome-wide expression profiles. Proc. Natl. Acad. Sci. USA 2005, 102, 15545–15550. [Google Scholar] [CrossRef] [Green Version]
- Han, J.; Kamber, M.; Pei, J. 3—Data Preprocessing. In Data Mining, 3rd ed.; Han, J., Kamber, M., Pei, J., Eds.; Morgan Kaufmann: Boston, MA, USA, 2012; pp. 83–124. [Google Scholar]
- Hennig, C. Cluster-wise assessment of cluster stability. Comput. Stat. Data Anal. 2007, 52, 258–271. [Google Scholar] [CrossRef] [Green Version]
- Ahrens, M.; Ammerpohl, O.; von Schönfels, W.; Kolarova, J.; Bens, S.; Itzel, T.; Teufel, A.; Herrmann, A.; Brosch, M.; Hinrichsen, H.; et al. DNA Methylation Analysis in Nonalcoholic Fatty Liver Disease Suggests Distinct Disease-Specific and Remodeling Signatures after Bariatric Surgery. Cell Metab. 2013, 18, 296–302. [Google Scholar] [CrossRef] [PubMed] [Green Version]
- Arendt, B.M.; Comelli, E.M.; Ma, D.W.; Lou, W.; Teterina, A.; Kim, T.; Fung, S.K.; Wong, D.K.; McGilvray, I.; Fischer, S.E.; et al. Altered hepatic gene expression in nonalcoholic fatty liver disease is associated with lower hepatic n-3 and n-6 polyunsaturated fatty acids. Hepatology 2015, 61, 1565–1578. [Google Scholar] [CrossRef] [PubMed] [Green Version]
- Murphy, S.; Yang, H.; Moylan, C.A.; Pang, H.; Dellinger, A.; Abdelmalek, M.; Garrett, M.E.; Ashley-Koch, A.; Suzuki, A.; Tillmann, H.L.; et al. Relationship Between Methylome and Transcriptome in Patients With Nonalcoholic Fatty Liver Disease. Gastroenterology 2013, 145, 1076–1087. [Google Scholar] [CrossRef] [Green Version]
- Smyth, G.K. Linear Models and Empirical Bayes Methods for Assessing Differential Expression in Microarray Experiments. Stat. Appl. Genet. Mol. Biol. 2004, 3, 1–25. [Google Scholar] [CrossRef] [PubMed]
- Wishart, D.S.; Feunang, Y.D.; Guo, A.C.; Lo, E.J.; Marcu, A.; Grant, J.R.; Sajed, T.; Johnson, D.; Li, C.; Sayeeda, Z.; et al. DrugBank 5.0: A Major Update to the DrugBank Database for 2018. Nucleic Acids Res. 2018, 46, D1074–D1082. [Google Scholar] [CrossRef]
- Chen, B.; Wei, W.; Ma, L.; Yang, B.; Gill, R.M.; Chua, M.-S.; Butte, A.J.; So, S. Computational Discovery of Niclosamide Ethanolamine, a Repurposed Drug Candidate That Reduces Growth of Hepatocellular Carcinoma Cells In Vitro and in Mice by Inhibiting Cell Division Cycle 37 Signaling. Gastroenterology 2017, 152, 2022–2036. [Google Scholar] [CrossRef]
- Benjamini, Y.; Hochberg, Y. Controlling the False Discovery Rate: A Practical and Powerful Approach to Multiple Testing. J. R. Stat. Soc. Ser. B 1995, 57, 289–300. [Google Scholar] [CrossRef]
- Liu, J.; Lee, J.; Salazar Hernandez, M.A.; Mazitschek, R.; Ozcan, U. Treatment of Obesity with Celastrol. Cell 2015, 161, 999–1011. [Google Scholar] [CrossRef] [Green Version]
- Marinka Zitnik, R.S.; Maheshwari, S.; Leskovec, J. BioSNAP Datasets: Stanford Biomedical Network Dataset Collection. 2018. Available online: https://snap.stanford.edu/biodata/ (accessed on 1 April 2020).
- Miedel, M.T.; Gavlock, D.C.; Jia, S.; Gough, A.; Taylor, D.L.; Stern, A.M. Modeling the Effect of the Metastatic Microenvironment on Phenotypes Conferred by Estrogen Receptor Mutations Using a Human Liver Microphysiological System. Sci. Rep. 2019, 9, 8341. [Google Scholar] [CrossRef]
- Schurdak, M.; Vernetti, L.; Bergenthal, L.; Wolter, Q.K.; Shun, T.Y.; Karcher, S.; Taylor, D.L.; Gough, A. Applications of the microphysiology systems database for experimental ADME-Tox and disease models. Lab a Chip 2020, 20, 1472–1492. [Google Scholar] [CrossRef] [Green Version]
- Law, C.W.; Zeglinski, K.; Dong, X.; Alhamdoosh, M.; Smyth, G.K.; Ritchie, M.E. A guide to creating design matrices for gene expression experiments. F1000Research 2020, 9, 1444. [Google Scholar] [CrossRef]
- Friedman, J.H.; Hastie, T.; Tibshirani, R. Regularization Paths for Generalized Linear Models via Coordinate Descent. J. Stat. Softw. 2010, 33, 1–22. [Google Scholar] [CrossRef] [Green Version]
- Li, X.; George, S.M.; Vernetti, L.; Gough, A.H.; Taylor, D.L. A glass-based, continuously zonated and vascularized human liver acinus microphysiological system (vLAMPS) designed for experimental modeling of diseases and ADME/TOX. Lab on a chip 2018, 18, 2614–2631. [Google Scholar] [CrossRef]
Publisher’s Note: MDPI stays neutral with regard to jurisdictional claims in published maps and institutional affiliations. |
© 2022 by the authors. Licensee MDPI, Basel, Switzerland. This article is an open access article distributed under the terms and conditions of the Creative Commons Attribution (CC BY) license (https://creativecommons.org/licenses/by/4.0/).
Share and Cite
Lefever, D.E.; Miedel, M.T.; Pei, F.; DiStefano, J.K.; Debiasio, R.; Shun, T.Y.; Saydmohammed, M.; Chikina, M.; Vernetti, L.A.; Soto-Gutierrez, A.; et al. A Quantitative Systems Pharmacology Platform Reveals NAFLD Pathophysiological States and Targeting Strategies. Metabolites 2022, 12, 528. https://doi.org/10.3390/metabo12060528
Lefever DE, Miedel MT, Pei F, DiStefano JK, Debiasio R, Shun TY, Saydmohammed M, Chikina M, Vernetti LA, Soto-Gutierrez A, et al. A Quantitative Systems Pharmacology Platform Reveals NAFLD Pathophysiological States and Targeting Strategies. Metabolites. 2022; 12(6):528. https://doi.org/10.3390/metabo12060528
Chicago/Turabian StyleLefever, Daniel E., Mark T. Miedel, Fen Pei, Johanna K. DiStefano, Richard Debiasio, Tong Ying Shun, Manush Saydmohammed, Maria Chikina, Lawrence A. Vernetti, Alejandro Soto-Gutierrez, and et al. 2022. "A Quantitative Systems Pharmacology Platform Reveals NAFLD Pathophysiological States and Targeting Strategies" Metabolites 12, no. 6: 528. https://doi.org/10.3390/metabo12060528
APA StyleLefever, D. E., Miedel, M. T., Pei, F., DiStefano, J. K., Debiasio, R., Shun, T. Y., Saydmohammed, M., Chikina, M., Vernetti, L. A., Soto-Gutierrez, A., Monga, S. P., Bataller, R., Behari, J., Yechoor, V. K., Bahar, I., Gough, A., Stern, A. M., & Taylor, D. L. (2022). A Quantitative Systems Pharmacology Platform Reveals NAFLD Pathophysiological States and Targeting Strategies. Metabolites, 12(6), 528. https://doi.org/10.3390/metabo12060528