Article

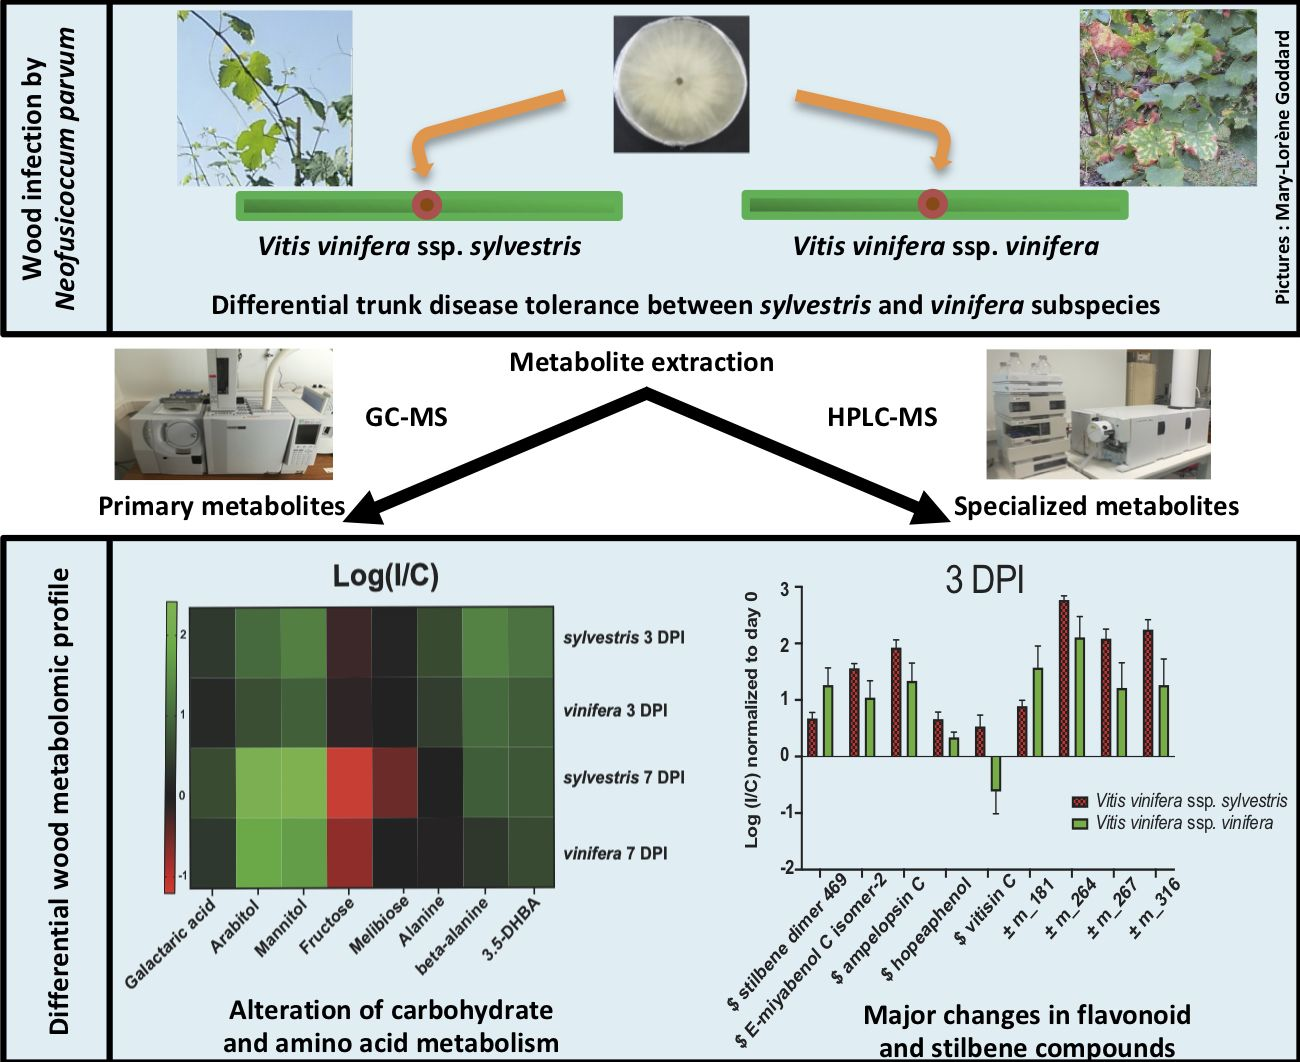
Wood Metabolomic Responses of Wild and Cultivated Grapevine to Infection with Neofusicoccum parvum, a Trunk Disease Pathogen

1
Laboratoire Vigne, Biotechnologies et Environnement (LVBE, EA3991), Université de Haute Alsace, 68000 Colmar, France
2
Laboratoire d’Innovation Moléculaire et Applications, Université de Haute-Alsace, Université de Strasbourg, CNRS, LIMA, UMR 7042, 68093 Mulhouse cedex, France
*
Authors to whom correspondence should be addressed.
Metabolites 2020, 10(6), 232; https://doi.org/10.3390/metabo10060232
Submission received: 28 April 2020 / Revised: 25 May 2020 / Accepted: 30 May 2020 / Published: 4 June 2020
(This article belongs to the Special Issue Plant Metabolomics)

Abstract

:
Grapevine trunk diseases (GTDs), which are associated with complex of xylem-inhabiting fungi, represent one of the major threats to vineyard sustainability currently. Botryosphaeria dieback, one of the major GTDs, is associated with wood colonization by Botryosphaeriaceae fungi, especially Neofusicoccum parvum. We used GC-MS and HPLC-MS to compare the wood metabolomic responses of the susceptible Vitis vinifera subsp. vinifera (V. v. subsp. vinifera) and the tolerant Vitis vinifera subsp. sylvestris (V. v. subsp. sylvestris) after artificial inoculation with Neofusicoccum parvum (N. parvum). N. parvum inoculation triggered major changes in both primary and specialized metabolites in the wood. In both subspecies, infection resulted in a strong decrease in sugars (fructose, glucose, sucrose), whereas sugar alcohol content (mannitol and arabitol) was enhanced. Concerning amino acids, N. parvum early infection triggered a decrease in aspartic acid, serine, and asparagine, and a strong increase in alanine and β-alanine. A trend for more intense primary metabolism alteration was observed in V. v. subsp. sylvestris compared to V. v. subsp. vinifera. N. parvum infection also triggered major changes in stilbene and flavonoid compounds. The content in resveratrol and several resveratrol oligomers increased in the wood of both subspecies after infection. Interestingly, we found a higher induction of resveratrol oligomer (putative E-miyabenol C, vitisin C, hopeaphenol, ampelopsin C) contents after wood inoculation in V. v. subsp. sylvestris.

Graphical Abstract

1. Introduction

Grapevine (Vitis vinifera) is a very economically important crop worldwide but it is susceptible to a wide range of pathogens. Currently, one of the major threats to vineyard sustainability is Grapevine trunk diseases (GTDs). The three economically major GTDs, i.e., Botryosphaeria dieback, Eutypa dieback, and esca, are widespread in wine-growing regions over the world and cause severe yield reduction. The incidence of GTDs has increased considerably over the past few decades and the economic losses of these diseases were estimated to exceed 1 billion dollars per year [1]. GTDs are considered a major threat to winegrowers since no effective plant protection strategy is available [2].
GTDs are associated with the development of a complex of xylem-inhabiting fungi, finally leading to the death of the plant. These fungi are characterized by a latent phase, where they are present in the plant as endophytes and by a pathogenic phase, where they become virulent and colonize grapevine wood [3,4]. Various symptoms associated with GTDs are: sectorial and/or central necrosis in woody tissues [5], brown stripes or cankers, leaf discolorations, and wilt of inflorescences and berries [5,6]. Concerning esca disease, it is characterized by a mild form where plant express foliar symptoms (necrosis, discolorations) and an apoplectic form with the sudden death of the vine [6].
Botryosphaeria dieback, one of the major GTDs, is associated with wood colonization by Botryosphaeriaceae fungi, especially Neofusicoccum parvum (N. parvum), which is one of the most aggressive Botryosphaeriaceae fungus associated to this disease [7]. Botryosphaeriaceae species are well-known pathogens causing dieback in apples, pine trees, and grapevines [8]. These fungi are latent pathogens in many woody hosts and are characterized by a quiescent passive life phase, followed by an active pathogenic phase [9]. Infection by N. parvum through pruning wounds results in internal wood cankers, foliar chlorosis and necrosis, and dieback of shoots and buds [4,10]. Since GTDs pathogens are always found in the wood but have never been isolated from the leaves of diseased plants, it has been speculated that foliar symptoms result from toxin production in the wood. Phytotoxic compounds would be translocated to leaves via the transpiration stream [2]. N. parvum has been shown to produce a number of different compounds belonging to different chemical classes: naphtalenones, dihydrotoluquinones, epoxylactones, dihydroisocoumarins, hydroxybenzoic acids, and fatty esters [11,12,13].
In order to better understand trunk disease development, it is necessary to study metabolic perturbations in the grapevine wood. However, to our knowledge, no metabolomic study of grapevine wood infected by Botryosphaeriaceae has been performed. Several studies have reported physiological perturbations, especially concerning carbohydrate metabolism and induction of defense responses, in different organs of vines affected by GTDs, especially leaves [6]. In esca apoplectic leaves, transcriptomic and metabolomic analyses of grapevines in the period preceding symptom appearance revealed major metabolic reprogramming, especially concerning the metabolism of sugars, amino acids, and phenylpropanoids [14]. Similarly, nuclear magnetic resonance (NMR)-based metabolomic analyses of esca-infected leaves of V. vinifera cv. Alvarinho demonstrated a decrease in carbohydrates associated with an increase in phenolic compounds, suggesting a rerouting from primary to specialized metabolism involved in plant defense [15]. Concerning Eutypa dieback, a transcriptomic study of leaves of V. vinifera cv. Cabernet-Sauvignon infected with Eutypa lata showed that genes whose expression was associated with a lack of symptoms in infected plants are involved in the light phase of photosynthesis. These results highlight the importance of primary metabolism for trunk disease resistance [16]. Regarding specialized metabolites, accumulation of phenolic compounds such as trans-caffeoyltartaric acid, trans-coumaroyl-tartaric acid, quercetin-3-O-glucoside, quercetin-3-O-galactoside, kaempferol-3-glucoside, and myricetin was associated with esca disease in the leaves of V. vinifera cv. Alvarinho [17]. In a recent study, Moret et al. [18] studied the leaf metabolome of two V. vinifera cv. Chardonnay clones expressing esca symptoms. They showed that metabolite fingerprint associated with esca disease differed in two clones of the same cultivar, discriminant metabolites belonging to flavonoid and phenolic compound families.
Grapevine responses in the wood have been less studied. However, analyses of modifications in green stem, cordon, and trunk during grapevine infection with esca revealed alteration of expression of genes encoding enzymes of the phenylpropanoid pathway and resveratrol contents in the three organs of diseased plants [19]. In another recent study, Rusjan et al. [20] also reported that esca infection caused a significant accumulation of gallic acid, total flavanols, stilbenes, and total analyzed phenolics in the esca decayed wood of different trunk parts of V. vinifera cv. Cabernet Sauvignon.
Currently, no grape variety is completely resistant to GTDs. However, epidemiologic studies in vineyards have shown that different grapevine cultivars have contrasted foliar symptom expression reflecting different tolerance levels to GTDs. These observations suggest a genetic basis for trunk disease tolerance [21,22]. In an attempt to identify novel genetic resources for resistance against trunk diseases, Guan et al. [23] conducted a broad screen to evaluate the susceptibility levels of a large panel of accessions from the Vitaceae family to Botryosphaeriaceae fungi. Several accessions of V. v. subsp. sylvestris, the ancestor of V. v. subsp. vinifera, were found more resistant to Botryosphaeriaceae artificial inoculation than the V. vinifera cv. Chardonnay and Gewürztraminer [23]. In an attempt to elucidate the better tolerance level to N. parvum in V. v. subsp. sylvestris, and to identify tolerance biomarkers, we compared the wood metabolomic responses of V. v. subsp. vinifera and V. v. subsp. sylvestris after artificial inoculation with N. parvum, a main pathogenic fungus associated with Botryosphaeria dieback. A representative set of 32 primary metabolites and 52 specialized metabolites were analyzed. The results give a detailed picture of metabolic alterations in the wood after colonization with N. parvum and a better understanding of the tolerance to GTDs observed in V. v. subsp. sylvestris.

2. Results

2.1. Changes in Primary Metabolites in Wood upon N. parvum Inoculation

To determine the metabolic responses in detached grapevine canes of V. v. subsp. sylvestris and V. v. subsp. vinifera genotypes infected with N. parvum, we analyzed three biological replicates conducted in 2017, 2018, and 2019 using a targeted approach for primary metabolites. Each biological replicate consisted of nine V. v. subsp. sylvestris genotypes (Ke 2, Ke 34, Ke 53, Ke 83, Ke 84, Ke 95, Ke 106, Ke 119, and Hö 29) and three V. v. subsp. vinifera genotypes (Chardonnay, Gewürztraminer, and Müller-Thurgau). A total of 32 compounds including four acid sugars, five sugar alcohols, eight sugars, nine amino acids, and eight organic acids were analyzed by GC-MS (Table S1). Since T0 basal contents in metabolites differed between the three years analyzed, we expressed metabolite contents in mock (C) or N. parvum (I) inoculated samples as the ratio between the content in inoculated vs non-inoculated sample at T0. In order to visualize the impact of the infection on the primary metabolism in detached grapevine canes, we first performed three-dimensional principal component analysis (3D-PCA) on the I and C mean values of the three biological replicates in V. v. subsp. sylvestris and V. v. subsp. vinifera accessions (Figure 1).
Inoculation of grapevine canes with N. parvum resulted in dramatic changes in the content of primary metabolites. PCA analysis revealed that primary metabolite profiles strongly differed between control and inoculated samples (Figure 1). C samples from both V. v. subsp. sylvestris and V. v. subsp. vinifera genotypes were grouped together and were clearly separated from V. v. subsp. vinifera and V. v. subsp. sylvestris I samples in the PCA analysis (Figure 1). Within I samples, PCA analysis showed that primary metabolite profile significantly differed between three and seven days after inoculation, for both V. v. subsp. vinifera and V. v. subsp. sylvestris. By contrast, C samples at three and seven days were grouped together (Figure 1).
To get insight into metabolite differences between V. v. subsp. sylvestris and V. v. subsp. vinifera, we analyzed mean normalized levels of each metabolite in the different V. v. subsp. sylvestris and V. v. subsp. vinifera accessions. Metabolites that are significantly impacted by the infection were identified by an increase or decrease of at least 1.5 in the fold change (FC) ratio between content in I and C samples. Significant differences between I and C were analyzed by a Wilcoxon test (p < 0.05) at three and seven DPI (Figure 2a and Figure 3a, respectively).
Three days after inoculation, N. parvum triggered enhanced levels in sugar acids (glyceric, gluconic, and galactaric acids), especially in the V. v. subsp. sylvestris genotype. Sugar alcohol contents, such as mannitol and arabitol, were strongly enhanced at three DPI, whereas sugar contents (fructose, glucose, sucrose) rather decreased, except for maltose, which increased after infection. Concerning amino acids, N. parvum infection triggered a decrease in aspartic acid, serine, and asparagine, and an increase in glycine, alanine, and β-alanine. Finally, for organic acids, N. parvum infection resulted in a decrease in malic acid but promoted the accumulation of succinic acid, γ-aminobutyric acid (GABA), and 3,5-dihydroxybenzoic acid (3.5-DHBA) (Figure 2a).
At seven days post-inoculation, primary metabolite alterations followed the same trend compared to three DPI with some modifications (Figure 3a): arabitol and mannitol contents were enhanced and higher compared to three DPI. Decrease in fructose and sucrose was also more dramatic compared to three DPI, whereas glucose content was not significantly altered and maltose raised. Concerning amino acids, we could observe a decrease in almost all of the studied amino acids, except for glycine, which was not strongly disturbed, and for β-alanine, which was significantly enhanced in V. v. subsp. sylvestris. Finally, levels of GABA, which showed an increase at three DPI, tend to decrease at seven DPI compared to mock-inoculated samples.

2.2. Primary Metabolic Pathways Impacted by N. parvum Infection

The overall alterations in studied primary metabolites highlighted the pathways impacted by N. parvum infection. Among the studied metabolites, 22 are involved in carbohydrate metabolism pathways such as the TCA cycle, glyoxylate and dicarboxylate metabolism, starch and sucrose metabolism, and galactose metabolism, etc. (Table S2). Among these 22 metabolites, we could observe that 11 increased (glyceric acid, gluconic acid, galactaric acid, glycerol, arabitol, mannitol galactose, glucose, maltose, glycine, and fumaric acid), eight decreased (myo-inositol, scyllo-inositol, fructose, sucrose, serine, malic acid, tartaric acid, and isocitric acid), and three were not significantly affected during the infection (threonic acid, melibiose, and succinic acid). Twelve studied metabolites are also involved in amino acid metabolism pathways: alanine, aspartic acid, and glutamic acid metabolism; glycine, serine, and threonine metabolism; phenylalanine metabolism; and cysteine and methionine metabolism, etc. (Table S3). Among these 12 metabolites, we could observe that four increased (glyceric acid, glycine, alanine, and fumaric acid), six decreased (aspartic acid, valine, serine, threonine, asparagine, and shikimic acid), and one did not decrease nor increase during the infection (succinic acid).

2.3. N. parvum Inoculation Resulted in More Intense Primary Metabolism Alterations in V. v. subsp. sylvestris Compared to V. v. subsp. vinifera

Generally, we observed the same trend in primary metabolite increase or decrease in both V. v. subsp. sylvestris and V. v. subsp. vinifera. However, we could observe a tendency for stronger primary metabolite alterations in V. v. subsp. sylvestris compared to V. v. subsp. vinifera, both three and seven days after inoculation with N. parvum.
Analysis of the three DPI Venn diagram (Figure 2b) revealed that among the 12 metabolites that increased significantly, five increased in both V. v. subsp. sylvestris and V. v. subsp. vinifera and seven increased only in V. v. subsp. sylvestris. Concerning the five metabolites that decreased significantly, two decreased in both V. v. subsp. sylvestris and V. v. subsp. vinifera and three decreased only in V. v. subsp. sylvestris (Figure 2c). In the Venn diagram at seven DPI (Figure 3b), we could observe that nine metabolites increased and 11 decreased in a significant way. Among the nine that significantly increased, five raised in both V. v. subsp. sylvestris and V. v. subsp. vinifera and four specifically in V. v. subsp. sylvestris. For metabolites that significantly decreased, four declined in both V. v. subsp. sylvestris and V. v. subsp. vinifera and seven only in V. v. subsp. sylvestris (Figure 3c). Together, these results may indicate a more intense response concerning primary metabolite changes in V. v. subsp. sylvestris compared to V. v. subsp. vinifera.
In addition, comparison of the I/C ratio revealed some significant differences between V. v. subsp. sylvestris and V. v. subsp. vinifera genotypes (p < 0.05, Figure 2a and Figure 3a). In particular, the content in arabitol, alanine, and galactaric acid tended to be higher in V. v. subsp. sylvestris compared to V. v. subsp. vinifera at three DPI. At seven DPI, the content in galactaric acid, beta-alanine, mannitol, and to a lesser extent arabitol tended to be higher in V. v. subsp. sylvestris compared to V. v. subsp. vinifera. In contrast, fructose content was lower in V. v. subsp. sylvestris compared to V. v. subsp. vinifera (Figure 3a).

2.4. Changes in Specialized Metabolites in Wood upon N. parvum Inoculation

Specialized metabolites were analyzed by a non-targeted approach on three biological replicates conducted in 2017, 2018, and 2019: 362 metabolites were detected over the three years. Among them, 52 were found in each of the three years. In order to see the effects of infection on specialized metabolism, 3D-PCA was performed (Figure 4).
3D-PCA analysis revealed that infected and control samples were clustered in different groups, thus showing an effect of the infection. Within infected and control samples, it could be noticed that there was no clear separation between samples for three and seven DPI, suggesting a similar response at three and seven DPI concerning specialized metabolites.
To get insight into specialized metabolite differences between V. v. subsp. sylvestris and V. v. subsp. vinifera, we analyzed mean normalized levels of each metabolite in V. v. subsp. sylvestris and V. v. subsp. vinifera accessions. Metabolites significantly impacted by the infection were identified by a fold change ratio of at least ± 1.5 between contents in infected (I) and control (C) samples normalized to T0 and by a Wilcoxon test (p < 0.05) at three and seven DPI. Among the 52 metabolites detected in each of the three years (Figures S1 and S2), 34 were significantly altered (increase or decrease) at three and seven DPI for V. v. subsp. sylvestris and/or V. v. subsp. vinifera (Figure 5 and Figure 6). Of these 34 metabolites, seven were identified at level 1 on the Schymanski scale and 27 at level 5 [24]. Among these 27 metabolites, ten did not match with our databases and 17 had a putative identification (Grapecyc, KEGG, homemade database). In order to confirm this identification, MS2 analyses were performed. After analysis of the ten, 25, and 40 eV fragmentation profiles, we were able to further identify 15 metabolites using MS-Finder [25,26], Global Natural Products Social Molecular Networking (GNPS) [27], and literature [28,29,30,31,32,33] (Table S4). The compounds significantly altered by N. parvum infection were assigned thanks to high-resolution mass analysis, MS/MS fragmentation patterns, and UV-vis absorption spectra. The identification of stilbene tetramers m_293 and m_300 has been done according to Reference [29]. Similarly, MS/MS fragmentation patterns [30] and UV data [31,32,33] allowed to identify epicatechin-3-O-gallate m_111, stilbene dimers (m_125, m_152, m_153 and m_158), and trimers (m_235; m_236, m_239, m_241 and m_242).
Among the 34 metabolites significantly impacted by N. parvum infection, we found stilbenes, which are known phytoalexins in grapevine (2 monomers, 11 dimers, six trimers, and two tetramers), flavonoids (three compounds), and ten compounds that we could not associate to a known family due to a lack of characterization (Figure 5 and Figure 6). At three DPI, we could measure a significant increase in different stilbenes in V. v. subsp. sylvestris and V. v. subsp. vinifera, especially trans-resveratrol, pallidol, trans-δ-viniferin, α-viniferin, several resveratrol trimers, and tetramers including hopeaphenol. On the other hand, contents in flavonoids such as epicatechin and epicatechin-3-O-gallate rather decreased, whereas content in naringenin significantly increased (Figure 5).
At seven DPI, we could observe the same trend as for three DPI, except for trans-resveratrol and trans-piceatannol, which decreased at a later time point (Figure 6).

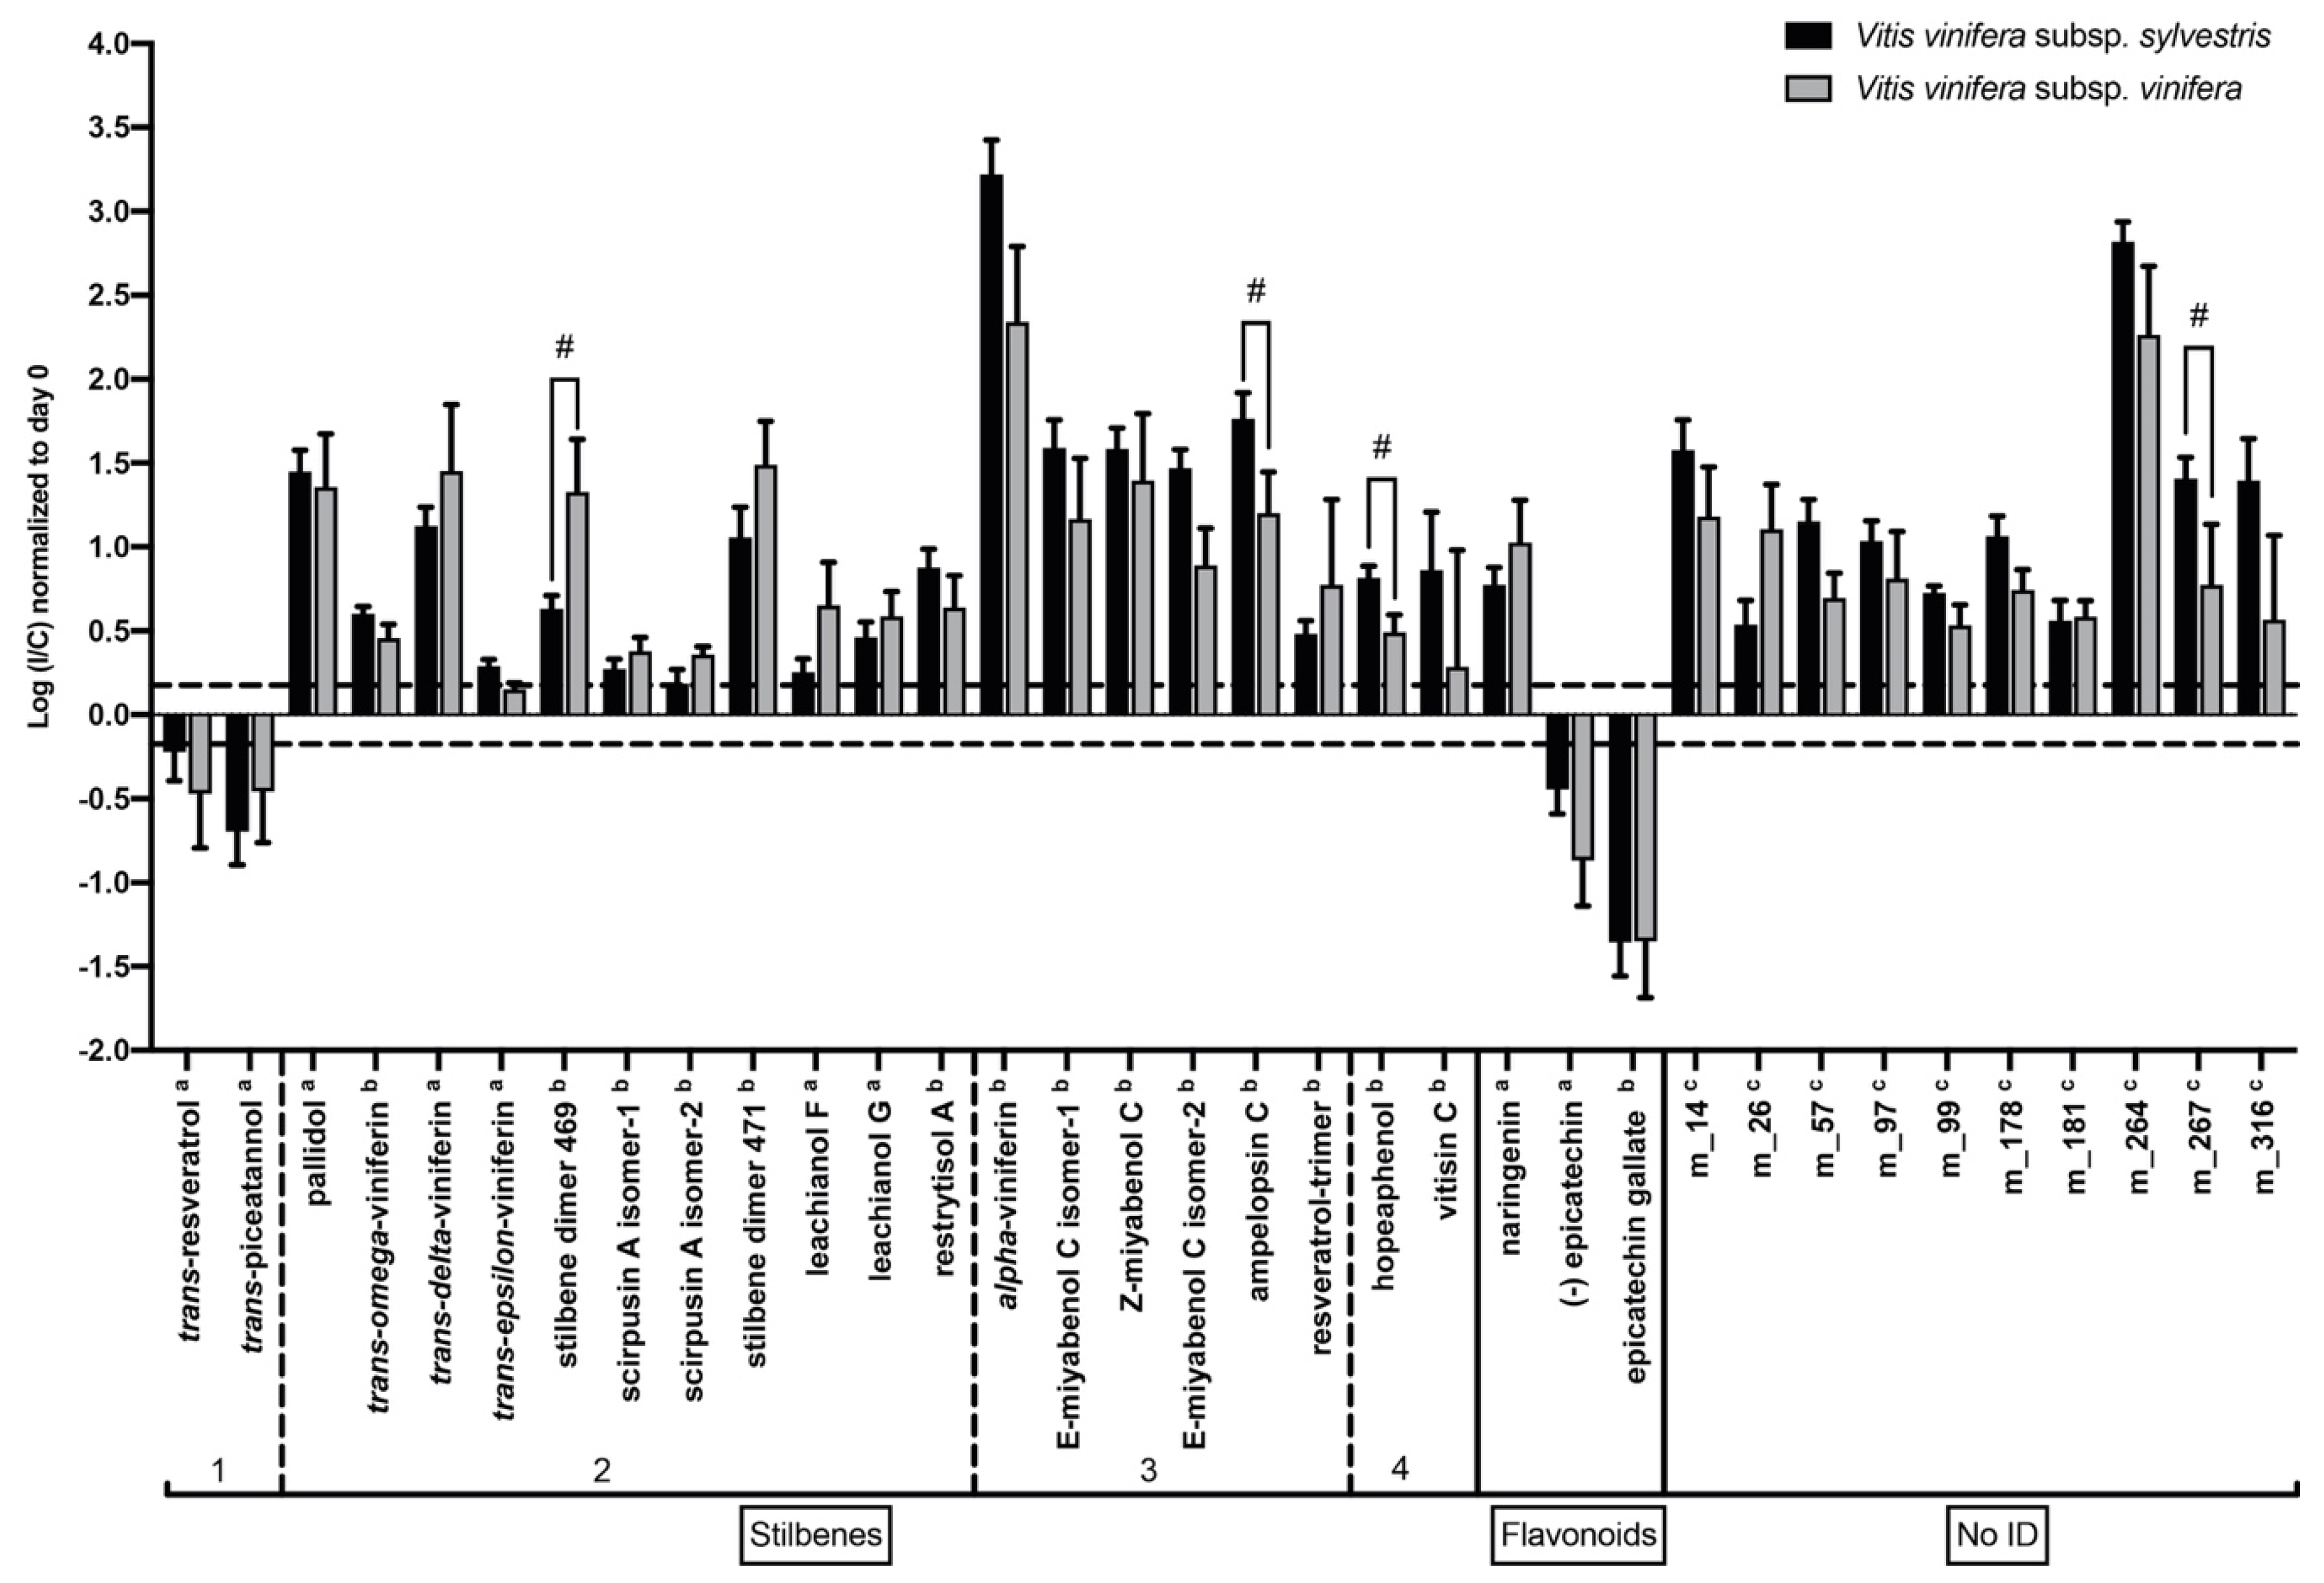
2.5. Response to N. parvum in V. v. subsp. sylvestris Is Characterized by Higher Induction of Resveratrol Oligomer Levels after Wood Inoculation

Response in specialized metabolite alterations appears to be rather similar in V. v. subsp. sylvestris and V. v. subsp. vinifera with changes in compounds notably belonging to stilbene and flavonoid families. However, significant differences in the I/C ratio for different specialized metabolites were observed between V. v. subsp. sylvestris and V. v. subsp. vinifera (p < 0.05). Levels of 2 resveratrol oligomers are generally more strongly induced at three DPI in the wood of V. v. subsp. sylvestris (Figure 5): the trimer E-miyabenol C isomer-2 (m_241) had a higher I/C ratio in V. v. subsp. sylvestris, and contents in the tetramer vitisin C were induced by infection in V. v. subsp. sylvestris, whereas they decreased in V. v. subsp. vinifera. In contrast, I/C ratio for the stilbene dimer 469 (m_150) was significantly higher in V. v. subsp. vinifera. Four other unknown metabolites showed a differential accumulation in V. v. subsp. sylvestris and V. v. subsp. vinifera at three days post-inoculation compared to control (Figure 5): one of them (m_181) was more induced in V. v. subsp. vinifera, and three of them (m_264, m_267 and m_316) had a higher I/C ratio in V. v. subsp. sylvestris.
Seven days post-inoculation, a lower number of metabolites showed significant different induction in the two genotypes compared to three DPI. Among the seven significantly different metabolites at three DPI, only two remained different at seven DPI: stilbene dimer 469 (m_150) was more induced in V. v. subsp. vinifera and m 267 had a higher I/C ratio in V. v. subsp. sylvestris. Interestingly, two new resveratrol oligomers showed different induction at seven DPI in the two genotypes: the trimer ampelopsin C (m_242) and the tetramer hopeaphenol (m_293) were more strongly induced in V. v. subsp. sylvestris compared to V. v. subsp. vinifera. These results show an early different specialized metabolite induction between the two genotypes.

3. Discussion

V. v. subsp. sylvestris, which is considered to be the progenitor of cultivated grapevines, has important tolerance potential for abiotic stress [34] and pathogen resistance [23,35]. However, mechanisms underlying stress tolerance in this subspecies are still not explored in detail. Interaction between grapevine and trunk disease-associated fungi is also poorly understood, especially in the wood. Previous metabolomic studies of grapevine infected by trunk disease fungi were performed on leaves [15,18]. However, to gain a better understanding of mechanisms underlying trunk disease progression, there is a need to study metabolic perturbations in the wood. Our study shows that both primary and specialized metabolites undergo important changes in the wood following infection with N. parvum. We are nevertheless aware that in contrast to studies on leaves, where perturbations rather reflect plant metabolism, metabolomic studies on wood reflect metabolites from both plant and fungal origin.
Concerning primary metabolites, N. parvum infection triggered a strong decrease in sugars such as fructose, glucose, and sucrose and an increase in maltose. Increase in maltose was also reported in the case of Rosaceae infection with the biotrophic pathogen Gymnosporangium asiaticum [36]. It is possible that maltose arises from starch degradation during infection since a depletion in starch reserves has been observed in wood infected by GTD fungi [6]. On another hand, decline of sugars is a hallmark of pathogen attack since the fungus acts as an additional sink within the plant tissue and diverts sugars, especially hexoses, to its own profit [37]. A decrease in carbohydrates has been described in the case of leaves from V. vinifera cv. Alvarino affected by esca [15] and could result from rerouting of sugars toward specialized metabolite synthesis. In contrast, Moret et al. [18] found a higher level in carbohydrates such as glucose and fructose in leaves of Chardonnay clone 95 plants showing esca symptoms. In our study, decrease of sugars we observed in the wood could thus also be explained by remobilization toward the leaves to better sustain the infection. In a recent study, Cardot et al. [38] showed coordinated upregulation of the hexose transporter VvHT5 and cell wall invertase in leaves of the tolerant cultivar Merlot elicited by Eutypa lata, but not in the highly susceptible cultivar Ugni Blanc. Regulation of sugar availability thus seems crucial for plant tolerance to trunk diseases.
Concerning amino acids, N. parvum infection triggered a decrease in aspartic acid, serine, and asparagine, and a strong increase in alanine and β-alanine at three DPI. Alanine and β-alanine accumulation were higher in V. v. subsp. sylvestris compared to V. v. subsp. vinifera at three and seven DPI, respectively. Accumulation of alanine has been previously reported in Chardonnay leaves just before esca apoplexy [14]. Several amino acids (asparagine, isoleucine, leucine, methionine, phenylalanine, proline, tyrosine, and valine) were also found to increase in the xylem sap of Chardonnay undergoing both water stress and esca disease [39]. Alterations in amino acid contents thus seem to be a common feature of trunk diseases. The exact function of amino acids in plant response to pathogens is not well established. β-Alanine accumulation has been reported in several plants submitted to biotic and abiotic stresses: in opium poppy cells, β-alanine was only accumulated in elicitor-treated cultures [40] and also accumulated in MeJA-treated Medicago truncatula cells [41]. It has been proposed that β-alanine could play diverse roles: as nitrogen reserve, in plant defense signaling, protein and membrane stabilization, and in the maintenance of osmotic pressure [15,42,43].
GABA, a non-protein amino acid, showed a significant increase in V. v. subsp. sylvestris and V. v. subsp. vinifera wood at three DPI. GABA could be involved in various biological and physiological responses to stress conditions [44]. A number of pathogenic fungi are also able to synthesize GABA. In the wheat fungal pathogen Stagonospora nodorum, GABA is implicated in response to environmental stimuli and asexual development and differentiation [45]. In plants, GABA, together with the secondary messenger Ca2+, could be involved in defense response signaling [44].
Both at three and seven DPI, a strong increase in sugar alcohols (mannitol and arabitol) was observed. Both sugar alcohols could be of fungal origin since mannitol has been described as a common carbohydrate stored in fungi. Indeed, it has been demonstrated that the necrotrophic pathogens Botrytis cinerea and Sclerotinia sclerotiorum convert plant hexoses, especially glucose, to mannitol, which is the main energy store in B. cinerea [46,47]. Moreover, mannitol, as a reactive oxygen species (ROS) quencher, may be used by pathogenic fungi to sustain ROS produced by the plant as a defense mechanism [47]. On another hand, accumulation of polyols such as mannitol was observed in a variety of plants submitted to stresses, especially water stress, and could protect cells from deleterious osmotic and metabolic imbalances [48]. Conde et al. [49] demonstrated that mannitol accumulation is crucial for salt and osmotic stress tolerance in Olea europea. In addition, mannitol accumulation induced by overexpression of an Escherichia coli mannitol-1-phosphate dehydrogenase resulted in increased tolerance to water stress and salinity in several plants [50]. A trend for higher levels in both arabitol and mannitol was observed in V. v. subsp. sylvestris compared to V. v. subsp. vinifera after infection. Since GTD pathogens colonize the vascular system, they cause vessel occlusion and a decline in hydraulic conductivity, as it is observed in the case of water stress. We can thus hypothesize that higher polyol levels observed in V. v. subsp. sylvestris may help the plant to sustain the stress caused by N. parvum.
Overall, primary metabolite signature indicates that a higher number of metabolites exhibit significant changes after N. parvum inoculation in V. v. subsp. sylvestris compared to V. v. subsp. vinifera, especially at 3 DPI. A faster and stronger metabolic reprogramming could thus allow the V. v. subsp. sylvestris genotype to better sustain a pathogen attack.
Analyses of specialized metabolites showed that major changes concerned compounds belonging to stilbene and flavonoid classes, which are rather specific from plants. A correlation between the accumulation of flavonoids, hydroxycinnamoyl tartaric acids, and esca-disease expression was also reported by Lima et al. [17]. Concerning flavonoids, content in naringenin was stimulated by infection, whereas contents in catechin and particularly epicatechin and epicatechin-3-O-gallate decreased. Catechin and epicatechin, which are the precursors of condensed tannins, could be used for the synthesis of these antimicrobial compounds.
Stilbenes, which are well-known phytoalexins in grapevine, showed major alterations in the wood after inoculation with N. parvum. A number of studies involved stilbenes in both inducible and constitutive plant defenses to bioagressors [51]. There are also several reports indicating that stilbenes could participate in the grapevine response to trunk diseases. Accumulation of phytoalexins (resveratrol and derivatives such as ε-viniferin) was previously reported in different tissues or organs of grapevine affected by esca [52]. In addition, V. v. subsp. vinifera cells treated with secreted proteins from N. parvum accumulated high levels of δ-viniferin [53]. More complex stilbenoids such as ampelopsins A, B, and H, leachianols F and G, hopeaphenol, isohopeaphenol, and pallidol were found higher in discolored wood of esca-diseased vines [52,54]. Induction of genes involved in resveratrol biosynthesis pathway in esca-diseased leaves prior to symptom appearance was also observed [14]. In addition, comparison between cultivars with contrasted sensitivity to esca also revealed that less susceptible cultivars showed an earlier and stronger induction of the PAL and STS genes, and a higher accumulation of stilbene compounds compared to a highly susceptible one [55].
In this study, three days after inoculation, the content in resveratrol and several resveratrol oligomers (resveratrol dimers, trimers, and tetramers) increased in the wood of both V. v. subsp. vinifera and V. v. subsp. sylvestris genotypes compared to non-infected wood. However, seven days after inoculation, the I/C ratio of resveratrol and piceatannol decreased, whereas the I/C ratio for resveratrol oligomers remained high. This suggests that these two stilbene monomers are consumed for the oligomer synthesis at later time points after infection. It is interesting to point out that content in 3,5-DHBA, which could be a biodegradation product of resveratrol, increased at both three and seven DPI (Figure 2 and Figure 3). It is thus possible that N. parvum can degrade resveratrol as it has been observed for the fungal endophyte Phomopsis liquidambari [56].
Importantly, the I/C ratio of some stilbene oligomers was shown significantly different between V. v. subsp. sylvestris and V. v. subsp. vinifera. Levels in resveratrol dimers and trimers were significantly induced by N. parvum infection in the wood of both V. v. subsp. sylvestris and V. v. subsp. vinifera genotypes. However, E-miyabenol C isomer-2 and ampelopsin C were more induced in the wood of V. v. subsp. sylvestris compared to V. v. subsp. vinifera at three and seven DPI, respectively. On another hand, the I/C ratio of the stilbene dimer 469 was higher in V. v. subsp. vinifera. Interestingly, the content in the tetramer vitisin C was upregulated at three DPI in V. v. subsp. sylvestris genotype but decreased in V. v. subsp. vinifera. Several resveratrol oligomers were previously described in the wood of V. vinifera cv. Sangiovese affected by esca proper [52]. Dimers, trimers, and tetramers of resveratrol were present both in the wood of asymptomatic and symptomatic grapevines [52]. Interestingly, comparison of the resveratrol oligomer profile between asymptomatic and brown symptomatic wood showed higher contents in several resveratrol oligomers (such as the tetramer hopeaphenol and the dimers ampelopsin A and B) in symptomatic brown wood. In another study, Lambert et al. [57] reported an increase in resveratrol oligomers (ε-viniferin, miyabenol C, hopeaphenol, and isohopeaphenol) in foliar cuttings inoculated with N. parvum, whereas the monomers resveratrol, piceid, and piceatannol did not vary significantly. It is known that dimers (viniferins) and oligomers of resveratrol have a potent antifungal activity, greater than the resveratrol monomer [51]. In the case of trunk disease pathogens, Stempien et al. [58] have shown that resveratrol has low fungistatic activity on fungi associated with Botryosphaeria dieback (N. parvum and Diplodia seriata), which are able to rapidly metabolize this compound. In contrast, δ-viniferin exhibited a significantly higher fungistatic activity especially toward N. parvum Bourgogne [58]. Botryosphaeriaceae fungi thus appear to have lower metabolization activity of resveratrol oligomers, although they are able to grow in the wood containing these compounds. Interestingly, Lambert et al. [57] showed that hydroxystilbenoids, especially oligomers such as miyabenol C, isohopeaphenol, and vitisin A and B, significantly reduced the growth of GTD-associated fungi, especially Botryospaheriaceae. Even if these compounds are fungistatic and not fungicidal, it is thus possible that higher inducibility of several resveratrol oligomers is part of the better tolerance of the V. v. subsp. sylvestris genotypes to GTD infection. Antimicrobial stilbene signature thus seems to be a hallmark of pathogen tolerance evidenced in this genotype. Indeed, V. v. subsp. sylvestris genotypes showing quick and strong accumulation of resveratrol and viniferins in the leaves following UV stress had a lower sensitivity to Plasmopara viticola, the downy mildew agent [35].
In conclusion, metabolic response of V. v. subsp. sylvestris to N. parvum infection is characterized by more rapid and intense alteration in primary metabolites compared to V. v. subsp. vinifera and by a higher induction of several resveratrol oligomer contents. Both of these responses could participate in the better tolerance of V. v. subsp. sylvestris to trunk diseases. Several other unknown metabolites are also differently accumulated in the two genotypes and future work should focus on their elucidation in order to better understand the wood response to GTDs.

4. Materials and Methods

4.1. Plant Material

Detached internodes of 1-year old dormant lignified canes were used for inoculation and were collected from three V. v. subsp. vinifera commercial cultivars (Chardonnay, Müller-Thurgau, and Gewürztraminer) and nine V. v. subsp. sylvestris accessions (Ke 2, Ke 34, Ke 53, Ke 83, Ke 84, Ke 95, Ke 106, Ke 119, and Hö 29). The Ke accessions originate from a large population of V. v. subsp. sylvestris on the Ketsch peninsula in Germany and the Hördt accession was from an isolated plant in Hördt alluvial forest (Upper Rhine valley, Rheinland-Pfalz). These accessions belong to an ex situ conservation program and are grown in the Botanical Garden of the Karlsruhe Institute of Technology. This collection constitutes part of a complete genetic copy of the V. v. subsp. sylvestris still existing in Germany, and accessions have been characterized genetically by microsatellite markers [59]. Three biological replicates were analyzed over three years (2017, 2018, and 2019). For each year, four internodes of each accession were inoculated for each time point and treatment.

4.2. Fungal Material and Wood Inoculation

N. parvum Bt-67 was obtained from a single spore collection of the Instituto Superior de Agronomia (Universidade de Lisboa, Portugal). N. parvum was grown on potato dextrose agar (PDA) at 27 °C in the dark and was subcultured every ten days. Internodes from dormant canes were used for wood inoculation experiments according to the protocol adapted from Guan et al. [23]. Woody internodes (Ø 7 mm) were drilled at the center with a power drill (PSB 500R, Bosch, Saint-Ouen, France) (Ø 5 mm and 3 mm deep). For each biological replicate, four internodes of each genotype were inoculated with a 5 mm diameter plug collected from a 14-day-old fungal culture on potato dextrose agar. The inoculation point was subsequently sealed with Parafilm. Mock-inoculated internodes were inoculated with PDA plugs. Non-inoculated intact internodes (T0 samples) were collected, freezed in liquid nitrogen, and freeze-dried after debarking and cutting in a lyophilizer (Alpha 1–2 LD freeze dryer, Christ, Osterode am Harz, Germany). After inoculation, the detached internodes were incubated in the dark at 28 °C in a saturated humidity chamber. Samples were collected after 3–7 days of incubation: the stems were debarked and wood sections of 1.5 cm long were made from 0.5 cm of the drill point; on both sides. Wood sections were then cut in approximately 2 mm thick sections, freeze-dried in a lyophilizer (Alpha 1–2 LD freeze dryer, Christ, Osterode am Harz, Germany), and then ground for 2 min at speed 10 using a planetary mill (MiniMill, Philips, Eindhoven, The Netherlands) with bowl and four beads (1 cm diameter) made from zirconium oxide.

4.3. Metabolite Extraction

Approximately 10 mg of ground woody tissue was precisely weighted and aliquoted in 2 mL polypropylene microtubes for successive extractions of primary and secondary metabolites. For extraction of primary metabolites, woody powder was first extracted with 600 µL of 50 mM potassium phosphate buffer pH 6 containing phenoxyacetic acid at 10 mg/L as an internal standard, in an ultrasound bath during 30 min (power 9, 20 °C as starting temperature). Samples were centrifuged (20,000 g, 20 min, 20 °C). Then, the supernatant was deposited on a filtration plate (96-well plates Acroprep 1 mL, 0.45 µm GHP membrane, Pall Life Science, Portsmouth, United Kingdom) and filtered with the help of a vacuum manifold (Pall Corporation, Portsmouth, United Kingdom). The filtrate was collected on a collector plate (96-well PP plate, 1.2 mL, VWR 732-2890/391-0077, Fontenay-sous-Bois, France). Two further similar extractions were performed on the pellet, a second with the same extraction buffer and a third with LC-MS grade water (Fisher Scientific, Illkirch, France), to rinse the sample as much as possible. The steps of sonication, centrifugation, and filtration remained the same for all extractions. Extraction 1 and 2 were pooled together, agitated on a Titramax 1000 orbital shaker (Heidolph Instruments GmbH & CO., Schwabach, Germany) at 1350 rpm for 1 min, and used for GC-MS analysis (Section 4.4). The remaining pellet after extractions was freeze-dried and used for specialized metabolite extraction.
For extraction of specialized metabolites, we performed a one-step extraction. The remaining pellet was extracted in an ultrasound bath (power 9 and 20 °C as starting temperature) with 500 µL of LC-MS grade methanol (Fisher Scientific, Illkirch, France) containing 5-methylsalicylic acid at 5 mg/L as an internal standard. The steps of sonication, centrifugation, and filtration remained the same as those described above. The obtained filtrates were analyzed by LC-MS Section 4.5).

4.4. GC-MS Analysis

Thirty microliters of each extract were freeze-dried in an amber HPLC vial. Prior to GC-MS analysis, a derivatization reaction was carried out on “non-diluted” and “diluted” extracts according to the method inspired by Noctor et al. [60]. Twenty microliters of methoxyamine hydrochloride solution at 30 mg/mL in anhydrous pyridine were subsequently added in each vial, which was placed at 37 °C and 600 rpm for 120 min. Eighty microliters of n-methyl-n-(trimethylsilyl)trifluoroacetamide (MSTFA) were added and samples were incubated for 30 additional minutes at 37 °C and 600 rpm. Finally, samples were stored at room temperature for 60 min before GC-MS injection. The injection volume of samples and calibrants was 1 µL.
Quantitative GC-MS analysis of wood extracts was performed on GC-2010 gas chromatography coupled with GC-QP2010 mass detector (Shimadzu corporation, Tokyo, Japan) operating at 70 eV ionization source. In order to separate the compounds, an SGE analytical Science BPX5 column (25 m × 0.25 µm, Ø 15 mm) was used. The MS was adjusted using perfluorotributylamine (PFTBA). The helium flow rate was 0.97 mL/min. The initial temperature of the column was 110 °C, increased to 155 °C at a rate of 10.5 °C/min, then increased to a final temperature of 350 °C at a rate of 11.5 °C/min. The oven was maintained at this temperature for 6 min. The injector was set at 310 °C, the transfer line at 330 °C, and the ion source at 200 °C. The total analysis time was 31.24 min. Two selected ion monitoring (SIM) methods described in supplementary data were used for the diluted and non-diluted samples (Tables S5 and S6). Data were acquired with Shimadzu Real-Time Analysis version 4.5 (Shimadzu corporation, Tokyo, Japan) system software. The absolute quantification of the primary metabolites was performed thanks to an external calibration. The external calibration was performed by mixing 32 commercially available compounds at 1 mM concentration in water. Six calibration standard solutions (25, 10, 5, 2.5, 1.25, and 0.5 µM) were made by serial dilution from this stock solution. Calibrants were analyzed in triplicate according to the same protocol as the extracts.

4.5. HPLC-DAD-MS Analysis

The analytical system used was High-Performance Liquid Chromatography Agilent 1100 series equipped with a diode array detector (DAD) and coupled to Agilent 6510 accurate-mass Quadrupole-Time of Flight (Q-TOF) mass spectrometer with electrospray ionization (ESI) interface in negative ionization mode (Agilent Technologies, Santa Clara, CA, USA). The mobile phase solvents were composed of 0.1% formic acid in LC-MS grade water (solvent A) and 0.1% formic acid in LC-MS grade methanol (solvent B) to separate secondary metabolites on a Zorbax SB-C18 column (3.1 × 150 mm, Ø 3.5 µm), equipped with a Zorbax Eclipse plus C18 pre-column (2.1 × 12.5 mm, Ø 5 µm) (Agilent Technologies, Santa Clara, CA, USA). The gradient solvent system was composed of ratios of solvent A and B: 95:5 (0–3 min), 95:5 to 0:100 (3–23 min), 0:100 (23–33 min), and 95:5 (33–40 min). The flow rate was 0.35 mL/min. The injection volume of samples was 2 µL. The drying gas flow and the nebulizer pressure were set at 13.0 L/min at 325 °C and 35 psi, respectively. Other MS conditions included fragmentor: 150 V, capillary voltage: −3500 V and collision energy: 20 V. Negative mass calibration was performed with a mix of standard compounds (G1969-85000, Agilent Technologies, Santa Clara, CA, USA). Data were acquired with Agilent MassHunter version B.02.00 system software. MS/MS experiments were carried out at 10, 25, and 40 eV with the analytical method previously described and nitrogen as collision gas.

4.6. Metabolomic Data Processing and Statistical Analysis

In order to highlight metabolomic responses of the V. v. subsp. vinifera and V. v. subsp. sylvestris groups, the different accessions and cultivars belonging to each specific group were pooled together for analysis. The GC-MS raw data processing was performed with Shimadzu post-run analysis from the Shimadzu lab solution with the following parameters for peak integration: Savitzky-Golay smoothing method [61] (# of peaks:5, width:9). The result table was imported into Microsoft Excel prior to calculate the exact concentration according to the exact weighted mass of the sample and the standard calibration curve. Data pretreatment, multivariate, and univariate statistical analyses were performed with the MetaboAnalyst 4.0 online platform (https://www.metaboanalyst.ca, [62]). As data pretreatment, the metabolite contents were submitted to different steps of normalization: firstly, they were normalized to the internal standard, secondly to the content of intact canes (T0), and finally by the pareto scale method [63] (each metabolite was mean-centered and divided by the square of the standard deviation).
To point out the impact of the fungal infection on metabolite contents, a 1.5-fold change ratio analysis was applied, and a Wilcoxon test (p < 0.05) was performed to identify specific metabolites significantly impacted by the treatment (Infected or Control) at a specific time point. A Wilcoxon test analysis was performed on the I/C ratio to identify specific metabolites significantly impacted by the subspecies (V. v. subsp. sylvestris/V. v. subsp. vinifera) at a specific time point. A false discovery rate approach was performed as a multiple testing correction. A three-dimensional principal component analysis (3D-PCA) was performed on centered-reduced data. The heatmaps represent the effect of the fungal infection between normalized I and C samples (I/C ratio). Histograms are drawn using Prism 8 (version 8.2.1). Venn diagram of impacted metabolites (p < 0.05 and FC ± 1.5) are drawn using jvenn online platform [64]. Error bars on histograms represent the standard error of the mean [65].
The HPLC-MS raw data pre-processing was performed with Agilent Profinder software version B.07.00 and consisted of feature extraction combined with peak alignment and integration. The preprocessed datasets, corresponding to 362 features in negative mode over the three years, were imported in Microsoft Excel and converted to .txt files. Data pretreatment consists of a baseline correction to the median, normalization by the internal standard, and a pareto scale method (each metabolite was mean-centered and divided by the square of the standard deviation). Prior to the statistical analysis, datasets were filtered based on the 80% modified rules [66] to remove metabolites with low reproducibility. The same statistical analysis as for primary metabolites was carried out for the secondary metabolites. Metabolite characterization was performed on all detected metabolites, first with confirmed standard. A MS/MS identification was carried out on significantly affected compounds, and the MS/MS spectra were analyzed with MS-Finder [25,26] and GNPS [27].

Supplementary Materials

The following are available online at https://www.mdpi.com/2218-1989/10/6/232/s1, Figure S1: Changes in specialized metabolite contents at three DPI, Figure S2: Changes in specialized metabolite contents at three DPI, Table S1: List of primary metabolites studied by GC/MS, Table S2: List of primary metabolites involved in cabohydrate metabolism, Table S3: List of primary metabolites involved in amino acid metabolism, Table S4: List of the 34 secondary metabolites analyzed by MS/MS and significantly impacted by N. parvum infection, Table S5: SIM method used for 1/20th diluted samples, Table S6: SIM method used for non-diluted samples.

Author Contributions

Conceptualization, C.B., J.C., and M.-L.G.; methodology, C.L., K.W., H.L., and M.-L.G.; software, C.L. and M.-L.G.; validation, C.L., M.-L.G., and J.C.; formal analysis, C.L., J.C., and M.-L.G.; investigation, C.B., C.T., and M.-L.G.; resources, C.T.; data curation, C.L. and M.-L.G.; writing—original draft preparation, C.L. and J.C.; writing—review and editing, M.-L.G.; supervision, C.B., C.T., J.C., and M.-L.G.; project administration, C.B.; funding acquisition, C.B. and M.-L.G. All authors have read and agreed to the published version of the manuscript.

Funding

This research was funded by Plan National Dépérissement du Vignoble, project Euréka and by Université de Haute Alsace.

Acknowledgments

The authors are grateful to Peter Nick and Joachim Daumann (Karlsruhe Institute of Technology) for the supply of the V. v. subsp. sylvestris cuttings. We are grateful to Yann Leva for technical support.

Conflicts of Interest

The authors declare no conflict of interest. The funders had no role in the design of the study; in the collection, analyses, or interpretation of data; in the writing of the manuscript; or in the decision to publish the results.

References

  1. Hofstetter, V.; Buyck, B.; Croll, D.; Viret, O.; Couloux, A.; Gindro, K. What if esca disease of grapevine were not a fungal disease? Fungal Divers. 2012, 54, 51–67. [Google Scholar] [CrossRef] [Green Version]
  2. Bertsch, C.; Ramírez-Suero, M.; Magnin-Robert, M.; Larignon, P.; Chong, J.; Mansour, E.A.; Spagnolo, A.; Clement, C.; Fontaine, F. Grapevine trunk diseases: Complex and still poorly understood. Plant Pathol. 2012, 62, 243–265. [Google Scholar] [CrossRef] [Green Version]
  3. Ahimera, N.; Driever, G.F.; Michailides, T.J. Relationships among propagule numbers of Botryosphaeria dothidea, latent infections, and severity of panicle and shoot blight in Pistachio orchards. Plant Dis. 2003, 87, 846–853. [Google Scholar] [CrossRef] [PubMed] [Green Version]
  4. Urbes-Torres, J.R. The status of Botryosphaeriaceae species infecting grapevines. Phytopathol. Mediterr. 2011, 50, 5–45. [Google Scholar] [CrossRef]
  5. Larignon, P. Maladies Cryptogamiques Du Bois De La Vigne: Symptomatologie Et Agents Pathogènes. Available online: http://www.vignevin.com/menu-haut/actualites/article.html?tx_ttnews%5Btt_news%5D=368&tx_ttnews%5BbackPid%5D=918&cHash=2c0eccd030 (accessed on 19 January 2017).
  6. Fontaine, F.; Pinto, C.; Vallet, J.; Clément, C.; Gomes, A.C.; Spagnolo, A. The effects of grapevine trunk diseases (GTDs) on vine physiology. Eur. J. Plant Pathol. 2015, 144, 707–721. [Google Scholar] [CrossRef]
  7. Úrbez-Torres, J.R.; Gubler, W.D. Pathogenicity of Botryosphaeriaceae species isolated from grapevine cankers in California. Plant Dis. 2009, 93, 584–592. [Google Scholar] [CrossRef] [Green Version]
  8. Mehl, J.W.M.; Slippers, B.; Roux, J.; Wingfield, M.J. Cankers and other diseases caused by the Botryosphaeriaceae. In Infectious Forest Diseases; Gonthier, P., Nicolotti, G., Eds.; CABI Publishing: Warringford, UK, 2013; pp. 298–317. [Google Scholar]
  9. Slippers, B.; Wingfield, M.J. Botryosphaeriaceae as endophytes and latent pathogens of woody plants: Diversity, ecology and impact. Fungal Biol. Rev. 2007, 21, 90–106. [Google Scholar] [CrossRef]
  10. Larignon, P.; Fulchic, R.; Cere, L.; Dubos, B. Observation on Black Dead Arm in French vineyards. Phytopathol. Mediterr. 2001, 40, 336–342. [Google Scholar]
  11. Evidente, A.; Punzo, B.; Andolfi, A.; Cimmino, A.; Melck, D.; Luque, J. Lipophilic phytotoxins produced by Neofusicoccum parvum, a grapevine canker agent. Phytopathol. Mediterr. 2010, 49, 74–79. [Google Scholar]
  12. Mansour, E.A.; Debieux, J.-L.; Ramírez-Suero, M.; Bénard-Gellon, M.; Magnin-Robert, M.; Spagnolo, A.; Chong, J.; Farine, S.; Bertsch, C.; L’Haridon, F.; et al. Phytotoxic metabolites from Neofusicoccum parvum, a pathogen of Botryosphaeria dieback of grapevine. Phytochemistry 2015, 115, 207–215. [Google Scholar] [CrossRef]
  13. Burruano, S.; Giambra, S.; Mondello, V.; Dellagreca, M.; Basso, S.; Tuzi, A.; Andolfi, A. Naphthalenone polyketides produced by Neofusicoccum parvum, a fungus associated with grapevine Botryosphaeria dieback. Phytopathol. Mediterr. 2016, 55, 197–206. [Google Scholar] [CrossRef]
  14. Magnin-Robert, M.; Adrian, M.; Trouvelot, S.; Spagnolo, A.; Jacquens, L.; Letousey, P.; Rabenoelina, F.; Harir, M.; Roullier-Gall, C.; Clément, C.; et al. Alterations in grapevine leaf metabolism occur prior to esca apoplexy appearance. Mol. Plant Microbe Interact. 2017, 30, 946–959. [Google Scholar] [CrossRef] [PubMed]
  15. Lima, M.; Felgueiras, M.; Graça, G.; Rodrigues, J.E.; Barros, A.; Gil, A.M.; Dias, A.C.P. NMR metabolomics of esca disease-affected Vitis vinifera cv. Alvarinho leaves. J. Exp. Bot. 2010, 61, 4033–4042. [Google Scholar] [CrossRef] [PubMed] [Green Version]
  16. Camps, C.; Kappel, C.; Lecomte, P.; Léon, C.; Gomès, E.; Coutos-Thévenot, P.; Delrot, S. A transcriptomic study of grapevine (Vitis vinifera cv. Cabernet-Sauvignon) interaction with the vascular ascomycete fungus Eutypa lata. J. Exp. Bot. 2010, 61, 1719–1737. [Google Scholar] [CrossRef] [PubMed]
  17. Lima, M.; Felgueiras, M.; Cunha, A.; Chicau, G.; Ferreres, F.; Dias, A.C.P. Differential phenolic production in leaves of Vitis vinifera cv. Alvarinho affected with esca disease. Plant Physiol. Biochem. 2017, 112, 45–52. [Google Scholar] [CrossRef]
  18. Moret, F.; Lemaître-Guillier, C.; Grosjean, C.; Clément, G.; Coelho, C.; Negrel, J.; Jacquens, L.; Morvan, G.; Mouille, G.; Trouvelot, S.; et al. Clone-dependent expression of esca disease Revealed by leaf metabolite analysis. Front. Plant Sci. 2019, 9, 9. [Google Scholar] [CrossRef]
  19. Magnin-Robert, M.; Spagnolo, A.; Boulanger, A.; Joyeux, C.; Clément, C.; Mansour, E.A.; Fontaine, F. Changes in plant metabolism and accumulation of fungal metabolites in response to esca proper and apoplexy expression in the whole grapevine. Phytopathology 2016, 106, 541–553. [Google Scholar] [CrossRef]
  20. Rusjan, D.; Persic, M.; Likar, M.; Biniari, K.; Mikulic-Petkovsek, M. Phenolic responses to esca-associated fungi in differently decayed grapevine woods from different trunk parts of ‘Cabernet Sauvignon’. J. Agric. Food Chem. 2017, 31, 6615–6624. [Google Scholar] [CrossRef]
  21. Grosman, J.; Doublet, B. Maladies du bois de la vigne. Synthèse des dispositifs d’observation au vignoble, de l’observatoire 2003-2008 au réseau d’épidémiosurveillance actuel. Phytoma 2012, 651, 31–35. [Google Scholar]
  22. Bruez, E.; Lecomte, P.; Grosman, J.; Doublet, B.; Bertsch, C.; Fontaine, F.; Ugaglia, A.; Teissedre, P.-L.; Da Costa, J.-P.; Guerin-Dubrana, L.; et al. Overview of grapevine trunk diseases in France in the 2000s. Phytopathol. Mediterr. 2013, 52, 262–275. [Google Scholar]
  23. Guan, X.; Essakhi, S.; Laloue, H.; Nick, P.; Bertsch, C.; Chong, J. Mining new resources for grape resistance against Botryosphaeriaceae: A focus on Vitis vinifera subsp. Sylvestris. Plant Pathol. 2015, 65, 273–284. [Google Scholar] [CrossRef]
  24. Schymanski, E.L.; Jeon, J.; Gulde, R.; Fenner, K.; Ruff, M.; Singer, H.P.; Hollender, J. Identifying small molecules via high resolution mass spectrometry: Communicating confidence. Environ. Sci. Technol. 2014, 48, 2097–2098. [Google Scholar] [CrossRef]
  25. Lai, Z.; Tsugawa, H.; Wohlgemuth, G.; Mehta, S.; Mueller, M.; Zheng, Y.; Ogiwara, A.; Meissen, J.; Showalter, M.; Takeuchi, K.; et al. Identifying metabolites by integrating metabolome databases with mass spectrometry cheminformatics. Nat. Methods 2017, 15, 53–56. [Google Scholar] [CrossRef] [PubMed]
  26. Tsugawa, H.; Kind, T.; Nakabayashi, R.; Yukihira, D.; Tanaka, W.; Cajka, T.; Saito, K.; Fiehn, O.; Arita, M. Hydrogen rearrangement rules: Computational MS/MS fragmentation and structure elucidation using MS-FINDER software. Anal. Chem. 2016, 88, 7946–7958. [Google Scholar] [CrossRef]
  27. Wang, M.; Carver, J.J.; Phelan, V.; Sanchez, L.M.; Garg, N.; Peng, Y.; Nguyen, N.D.; Watrous, J.; A Kapono, C.; Luzzatto-Knaan, T.; et al. Sharing and community curation of mass spectrometry data with Global Natural Products Social Molecular Networking. Nat. Biotechnol. 2016, 34, 828–837. [Google Scholar] [CrossRef] [Green Version]
  28. Flamini, R.; De Rosso, M. Chapter 5-High-Resolution mass spectrometry and biological properties of grapevine and wine stilbenoids. In Studies in Natural Products Chemistry; Rahman, A., Ed.; Elsevier: Amsterdam, The Netherlands, 2019; pp. 175–210. [Google Scholar]
  29. Gabaston, J.; Leborgne, C.; Waffo-Teguo, P.; Valls, J.; Pinto, A.P.; Richard, T.; Cluzet, S.; Merillon, J.-M. Wood and roots of major grapevine cultivars and rootstocks: A comparative analysis of stilbenes by UHPLC-DAD-MS/MS and NMR. Phytochem. Anal. 2019, 30, 320–331. [Google Scholar] [CrossRef] [PubMed]
  30. Moss, R.; Mao, Q.; Taylor, D.; Saucier, C. Investigation of monomeric and oligomeric wine stilbenoids in red wines by ultra-high-performance liquid chromatography/electrospray ionization quadrupole time-of-flight mass spectrometry. Rapid Commun. Mass Spectrom. 2013, 27, 1815–1827. [Google Scholar] [CrossRef]
  31. Oshima, Y.; Ueno, Y.; Hikino, H.; Ling-Ling, Y.; Kun-Ying, Y. Ampelopsins A, B and C, new oligostilbenes of VAR. Tetrahedron 1990, 46, 5121–5126. [Google Scholar] [CrossRef]
  32. Chaher, N.; Arraki, K.; Dillinseger, E.; Temsamani, H.; Bernillon, S.; Pedrot, E.; Delaunay, J.-C.; Mérillon, J.-M.; Monti, J.-P.; Izard, J.-C.; et al. Bioactive stilbenes from Vitis vinifera grapevine shoots extracts. J. Sci. Food Agric. 2013, 94, 951–954. [Google Scholar] [CrossRef]
  33. Billet, K.; Houillé, B.; De Bernonville, T.D.; Besseau, S.; Oudin, A.; Courdavault, V.; Delanoue, G.; Guérin, L.; Clastre, M.; Giglioli-Guivarc’H, N.; et al. Field-based metabolomics of Vitis vinifera L. stems provides new insights for genotype discrimination and polyphenol metabolism structuring. Front. Plant Sci. 2018, 9, 798. [Google Scholar] [CrossRef]
  34. Daldoul, S.; Boubakri, H.; Gargouri, M.; Mliki, A. Recent advances in biotechnological studies on wild grapevines as valuable resistance sources for smart viticulture. Mol. Biol. Rep. 2020, 47, 3141–3153. [Google Scholar] [CrossRef] [PubMed]
  35. Duan, D.; Halter, D.; Baltenweck, R.; Tisch, C.; Tröster, V.; Kortekamp, A.; Hugueney, P.; Nick, P. Genetic diversity of stilbene metabolism in Vitis sylvestris. J. Exp. Bot. 2015, 66, 3243–3257. [Google Scholar] [CrossRef] [PubMed]
  36. Lee, D.-K.; Ahn, S.; Cho, H.Y.; Yun, H.Y.; Park, J.H.; Lim, J.; Lee, J.; Kwon, S.W. Metabolic response induced by parasitic plant-fungus interactions hinder amino sugar and nucleotide sugar metabolism in the host. Sci. Rep. 2016, 6, 37434. [Google Scholar] [CrossRef] [PubMed] [Green Version]
  37. Lemoine, R.; La Camera, S.; Atanassova, R.; Dédaldéchamp, F.; Allario, T.; Pourtau, N.; Bonnemain, J.-L.; Laloi, M.; Coutos-Thévenot, P.; Maurousset, L.; et al. Source-to-sink transport of sugar and regulation by environmental factors. Front. Plant Sci. 2013, 4, 272. [Google Scholar] [CrossRef] [Green Version]
  38. Cardot, C.; Mappa, G.; La Camera, S.; Gaillard, C.; Vriet, C.; Lecomte, P.; Ferrari, G.; Coutos-Thévenot, P. Comparison of the molecular responses of tolerant, susceptible and highly susceptible grapevine cultivars during interaction with the pathogenic fungus Eutypa lata. Front. Plant Sci. 2019, 10, 991. [Google Scholar] [CrossRef] [Green Version]
  39. Lima, M.; Machado, A.F.; Gubler, W.D. Metabolomic study of Chardonnay grapevines double-stressed with Esca-associated fungi and drought. Phytopathology 2017, 107, 669–680. [Google Scholar] [CrossRef]
  40. Zulak, K.G.; Weljie, A.M.; Vogel, H.J.; Facchini, P.J. Quantitative 1H NMR metabolomics reveals extensive metabolic reprogramming of primary and secondary metabolism in elicitor-treated opium poppy cell cultures. BMC Plant Biol. 2008, 8, 5. [Google Scholar] [CrossRef] [Green Version]
  41. Broeckling, C.D.; Huhman, D.; Farag, M.A.; Smith, J.T.; May, G.D.; Mendes, P.; Dixon, R.A.; Sumner, L.W. Metabolic profiling of Medicago truncatula cell cultures reveals the effects of biotic and abiotic elicitors on metabolism. J. Exp. Bot. 2004, 56, 323–336. [Google Scholar] [CrossRef] [Green Version]
  42. Monselise, E.B.-I.; Parola, A.H.; Kost, D. Low-frequency electromagnetic fields induce a stress effect upon higher plants, as evident by the universal stress signal, alanine. Biochem. Biophys. Res. Commun. 2003, 302, 427–434. [Google Scholar] [CrossRef]
  43. Kaplan, F.; Kopka, J.; Haskell, D.W.; Zhao, W.; Schiller, K.C.; Gatzke, N.; Sung, D.Y.; Guy, C.L. Exploring the temperature-stress metabolome of Arabidopsis. Plant Physiol. 2004, 136, 4159–4168. [Google Scholar] [CrossRef] [Green Version]
  44. Seifikalhor, M.; Aliniaeifard, S.; Hassani, B.; Niknam, V.; Lastochkina, O. Diverse role of γ-aminobutyric acid in dynamic plant cell responses. Plant Cell Rep. 2019, 38, 847–867. [Google Scholar] [CrossRef] [PubMed]
  45. Mead, O.; Thynne, E.; Winterberg, B.; Solomon, P.S. Characterising the role of GABA and its metabolism in the wheat pathogen Stagonospora nodorum. PLoS ONE 2013, 8, e78368. [Google Scholar] [CrossRef] [PubMed]
  46. Jobic, C.; Boisson, A.-M.; Gout, E.; Rascle, C.; Fevre, M.; Cotton, P.; Bligny, R. Metabolic processes and carbon nutrient exchanges between host and pathogen sustain the disease development during sunflower infection by Sclerotinia sclerotiorum. Planta 2007, 226, 251–265. [Google Scholar] [CrossRef] [PubMed] [Green Version]
  47. Dulermo, T.; Rascle, C.; Chinnici, G.; Gout, E.; Bligny, R.; Cotton, P. Dynamic carbon transfer during pathogenesis of sunflower by the necrotrophic fungus Botrytis cinerea: From plant hexoses to mannitol. New Phytol. 2009, 183, 1149–1162. [Google Scholar] [CrossRef] [PubMed]
  48. Conde, A.; Regalado, A.; Rodrigues, D.; Costa, J.M.; Blumwald, E.; Chaves, M.M.; Geros, H. Polyols in grape berry: Transport and metabolic adjustments as a physiological strategy for water-deficit stress tolerance in grapevine. J. Exp. Bot. 2014, 66, 889–906. [Google Scholar] [CrossRef] [Green Version]
  49. Conde, A.; Silva, P.; Agasse, A.; Conde, C.; Geros, H. Mannitol transport and mannitol dehydrogenase activities are coordinated in Olea europaea under salt and osmotic stresses. Plant Cell Physiol. 2011, 52, 1766–1775. [Google Scholar] [CrossRef] [Green Version]
  50. Meena, M.; Prasad, V.; Zehra, A.; Gupta, V.K.; Upadhyay, R.S. Mannitol metabolism during pathogenic fungal–host interactions under stressed conditions. Front. Microbiol. 2015, 6, 38. [Google Scholar] [CrossRef] [Green Version]
  51. Chong, J.; Poutaraud, A.; Hugueney, P. Metabolism and roles of stilbenes in plants. Plant Sci. 2009, 177, 143–155. [Google Scholar] [CrossRef]
  52. Amalfitano, C.; Agrelli, D.; Arrigo, A.; Mugnai, L.; Surico, G.; Evidente, A. Stilbene polyphenols in the brown red wood of Vitis vinifera cv. Sangiovese affected by esca proper. Phytopathol. Mediterr. 2011, 50, 224–235. [Google Scholar] [CrossRef]
  53. Stempien, E.; Goddard, M.-L.; Leva, Y.; Bénard-Gellon, M.; Laloue, H.; Farine, S.; Kieffer-Mazet, F.; Tarnus, C.; Bertsch, C.; Chong, J. Secreted proteins produced by fungi associated with Botryosphaeria dieback trigger distinct defense responses in Vitis vinifera and Vitis rupestris cells. Protoplasma 2017, 255, 613–628. [Google Scholar] [CrossRef]
  54. Amalfitano, C.; Peduto, F.; Mugnai, L.; Evidente, A.; Surico, G. Chemical characterisation of stilbenic polyphenols from esca diseased wood and their role in defence mechanisms. Phytopathol. Mediterr. 2005, 44, 99. [Google Scholar]
  55. Lambert, C.; Khiook, I.L.K.; Lucas, S.; Télef-Micouleau, N.; Mérillon, J.-M.; Cluzet, S. A Faster and a stronger defense response: One of the key elements in grapevine explaining its lower level of susceptibility to esca? Phytopathology 2013, 103, 1028–1034. [Google Scholar] [CrossRef] [PubMed]
  56. Wang, H.-W.; Sun, K.; Guan, Y.-X.; Qiu, M.-H.; Zhang, L.; Dai, C.-C. Fungal endophyte Phomopsis liquidambari biodegrades soil resveratrol: A potential allelochemical in peanut monocropping systems. J. Sci. Food Agric. 2019, 99, 5899–5909. [Google Scholar] [CrossRef] [PubMed]
  57. Lambert, C.; Bisson, J.; Waffo-Téguo, P.; Papastamoulis, Y.; Richard, T.; Corio-Costet, M.-F.; Mérillon, J.-M.; Cluzet, S. Phenolics and their antifungal role in grapevine wood decay: Focus on the Botryosphaeriaceae Family. J. Agric. Food Chem. 2012, 60, 11859–11868. [Google Scholar] [CrossRef]
  58. Stempien, E.; Goddard, M.-L.; Wilhelm, K.; Tarnus, C.; Bertsch, C.; Chong, J. Grapevine Botryosphaeria dieback fungi have specific aggressiveness factor repertory involved in wood decay and stilbene metabolization. PLoS ONE 2017, 12, e0188766. [Google Scholar] [CrossRef]
  59. Nick, P. Schützen und nützen-Von der erhaltung zur anwendung. fallbeispiel europäische wildrebe. Hoppea Denkschr. Regensb. Bot. Ges. 2014, 159–173. Available online: https://www.botanik.kit.edu/garten/downloads/Pub_Nick_2014_sylvestris.pdf (accessed on 3 June 2020).
  60. Noctor, G.; Bergot, G.; Mauve, C.; Thominet, D.; Lelarge-Trouverie, C.; Prioul, J.L. A comparative study of amino acid measurement in leaf extracts by gas chromatography-time of flight-mass spectrometry and high performance liquid chromatography with fluorescence detection. Metabolomics 2007, 3, 161–174. [Google Scholar] [CrossRef]
  61. Press, H.; Teukolsky, S.A. Savitzky-Golay smoothing filters. Comput. Phys. 1990, 4, 669. [Google Scholar] [CrossRef]
  62. Chong, J.; Wishart, D.S.; Xia, J. Using MetaboAnalyst 4.0 for Comprehensive and integrative metabolomics data analysis. Curr. Protoc. Bioinform. 2019, 68, 86. [Google Scholar] [CrossRef]
  63. Van Den Berg, R.A.; Hoefsloot, H.C.J.; Westerhuis, J.A.; Smilde, A.K.; Van Der Werf, M.J. Centering, scaling, and transformations: Improving the biological information content of metabolomics data. BMC Genom. 2006, 7, 142. [Google Scholar] [CrossRef] [Green Version]
  64. Bardou, P.; Mariette, J.; Escudié, F.; Djemiel, C.; Klopp, C. Jvenn: An interactive Venn diagram viewer. BMC Bioinform. 2014, 15, 293. [Google Scholar] [CrossRef] [PubMed] [Green Version]
  65. Cumming, G.; Fidler, F.; Vaux, D.L. Error bars in experimental biology. J. Cell Biol. 2007, 177, 7–11. [Google Scholar] [CrossRef] [PubMed] [Green Version]
  66. Yang, J.; Zhao, X.; Lü, X.; Lin, X.; Xu, G. A data preprocessing strategy for metabolomics to reduce the mask effect in data analysis. Front. Mol. Biosci. 2015, 2, 4. [Google Scholar] [CrossRef] [PubMed] [Green Version]
Figure 1. Three-dimensional principal component analysis (3D-PCA) of primary metabolite contents. PCA was performed on mean values at three and seven days post-infection (DPI) normalized to T0 non-inoculated control. Control samples (C) were mock-inoculated with potato dextrose agar (PDA), inoculated samples (I) were inoculated with N. parvum. Each time point is represented by a symbol (dots for three DPI and rectangles for seven DPI). The V. v. subsp. sylvestris and V. v. subsp. vinifera genotypes are represented by different colors (red for V. v. subsp. sylvestris and blue for V. v. subsp. vinifera for C samples and green for V. v. subsp. sylvestris and yellow for V. v. subsp. vinifera for I samples). The three major principal components explained 72.7% of the cumulative variance.
Metabolites 10 00232 g001
Figure 2. Changes in primary metabolite contents at three DPI. (a) Contents are expressed as the log of the ratio between content (normalized to T0) in inoculated sample (I) and content in mock-inoculated control sample (C). Metabolite contents are represented in black for V. v. subsp. sylvestris and in gray for V. v. subsp. vinifera. * means a statistically significant difference between I and C (fold change at least ± 1.5 and p < 0.05). # represents a (I/C) statistically significantly different between V. v. subsp. sylvestris and V. v. subsp. vinifera (p < 0.05). Error bar represents standard error of the mean. (b) Venn diagram of metabolites increasing significantly between I and C (fold change at least ± 1.5 and p < 0.05), in black for V. v. subsp. sylvestris and in gray for V. v. subsp. vinifera. (c) Venn diagram of metabolites decreasing significantly between I and C (fold change at least ± 1.5 and p < 0.05), in black for V. v. subsp. sylvestris and in gray for V. v. subsp. vinifera.
Metabolites 10 00232 g002
Figure 3. Changes in primary metabolite contents at seven DPI. (a) Contents are expressed as the log of the ratio between content (normalized to T0) in inoculated sample (I) and content in mock-inoculated control sample (C). Metabolite contents are represented in black for V. v. subsp. sylvestris and in gray for V. v. subsp. vinifera. * means a statistically significant difference between I and C (fold change at least ± 1.5 and p < 0.05). # represents a (I/C) statistically significantly different between V. v. subsp. sylvestris and V. v. subsp. vinifera (p < 0.05). Error bars represent standard error of the mean. (b) Venn diagram of metabolites increasing significantly between I and C (fold change at least ± 1.5 and p < 0.05) in black for V. v. subsp. sylvestris and in gray for V. v. subsp. vinifera. (c) Venn diagram of metabolites decreasing significantly between I and C (fold change at least ± 1.5 and p < 0.05), in black for V. v. subsp. sylvestris and in gray for V. v. subsp. vinifera.
Metabolites 10 00232 g003
Figure 4. Three-dimensional principal component analysis (3D-PCA) of specialized metabolite contents. PCA was performed on mean values of the three biological replicates at three and seven days post-inoculation (DPI). The value of each biological replicate was normalized to T0 value in non-inoculated sample. Control samples (C) were inoculated with PDA, inoculated samples (I) were inoculated with N. parvum. Each time point is represented by a symbol (dots for three DPI and rectangles for seven DPI). The V. v. subsp. sylvestris and V. v. subsp. vinifera genotypes are represented by different colors (red for V. v. subsp. sylvestris and blue for V. v. subsp. vinifera for C samples and green for V. v. subsp. sylvestris and yellow for V. v. subsp. vinifera for I samples). The three major principal components explained 66.2% of the cumulative variance.
Metabolites 10 00232 g004
Figure 5. Changes in specialized metabolite contents significantly affected at three DPI. Contents are expressed as the log of the ratio between content (normalized to T0) in inoculated sample (I) and content in mock-inoculated control sample (C). Metabolite contents are represented in black for V. v. subsp. sylvestris and in gray for V. v. subsp. vinifera. # represents a (I/C) statistically significantly different for V. v. subsp. sylvestris and V. v. subsp. vinifera (p < 0.05). a indicates confirmed identification with standard, b indicates putative metabolites identified by MS/MS, and c indicates non-characterized metabolites. Error bars represent standard error of the mean. For stilbenes, 1-2-3 and 4 indicates monomeric, dimeric, trimeric and tetrameric forms, respectively.
Metabolites 10 00232 g005
Figure 6. Changes in specialized metabolite contents at seven DPI. Contents are expressed as the log of the ratio between content (normalized to T0) in inoculated sample (I) and content in mock-inoculated control sample (C). Metabolite contents are represented in black for V. v. subsp. sylvestris and in gray for V. v. subsp. vinifera. # represents a (I/C) statistically significantly different for V. v. subsp. sylvestris and V. v. subsp. vinifera (p < 0.05). a indicates confirmed metabolites by standard, b indicates putative metabolites identified by MS/MS, and c indicates non-characterized metabolites. Error bars represent standard error of the mean. For stilbenes, 1-2-3 and 4 indicates monomeric, dimeric, trimeric and tetrameric forms, respectively.
Metabolites 10 00232 g006

