Abstract
Merapi is an active volcano in the Sleman District with eruptions occurring periodically. However, the time and the power of the eruptions of Merapi could not be predicted accurately. Therefore, considering the dense population around the peak of Mount Merapi, appropriate and fast handling is needed when an eruption occurs. One of the crucial parts to be handled is the availability of evacuation places for the affected population. Even though Sleman district already has contingency and evacuation plans, the existing contingency and evacuation plans cannot necessarily be implemented, as in the case of the 2010 eruption. The locations planned as the shelters based on the contingency and evacuation plans of 2009 are no longer safe, including the permanent shelters owned by Sleman Regency. Thus, in the 2010 eruption, the refugees had to be evacuated to other safe places. Hence, some additional locations planned to be temporary refuges or shelters are needed to anticipate the change in eruption patterns in the future. This paper aims to provide a model to determine suitable temporary shelter locations that meet several criteria, which include constraints (exclusionary criteria) and factors (evaluation criteria). The criteria in this study were defined based on a literature review, interviews, and a questionnaire survey on experts who have experience in the field of disasters, especially in the eruption of Mount Merapi. Constraint criteria are used to determine the candidates for shelters, i.e., the locations that are possible to be used as shelters. Potential shelters will be selected from the candidates that meet the factor criteria using geographic information system (GIS), fuzzy logic, multi-criteria decision making (analytical hierarchy process (AHP), and weighted linear combination (WLC)). The implementation of the model in the 2010 eruption case shows that the refugees experienced moving to a safe place three times during the evacuation, within a safe radius of 10, 15, and 20 km due to the increase in the power of the eruption. In this paper, therefore, the potential temporary shelters will be designed at a safe radius of 10, 15, and 20 km. For further research, the potential shelters determined can be used as input in determining the optimal shelter locations by developing an optimization model.
1. Introduction
Mount Merapi is located in the north of Sleman Regency, and the upper slope area is occupied by three sub-districts, namely, from West to East, Turi, Pakem, and Cangkringan. Merapi is one of the most active volcanoes in the world [1,2], erupting periodically. There are allegations that the eruption of Merapi was detected first in the year 1006, marked by the Mataram civilization that moved from Central Java to East Java [3], and the Merapi eruption is still happening. The number of people living in the disaster-prone areas of Merapi is more than 50,000 people, but many of them refuse to be relocated because the physical conditions of the Merapi environment are suitable for farming and tourism [4,5]. Therefore, good evacuation planning is needed to handle the people when Merapi erupts.
The eruption of Mount Merapi in 2010 is considered to be the largest eruption since the 1870s. The Merapi eruption in 2010 was preceded by an increase in the status from normally active to on guard on 20 September 2010, an increased status from on guard to prepared on 21 October 2010, and subsequently an increased status from prepared to beware starting on 25 October 2010. After the status of Mount Merapi was upgraded to beware, the Geological Agency recommended immediately evacuating the residents in the disaster-prone areas to safe areas outside the 10 km radius. The eruption that occurred on 26 October 2010 left 17 people dead, including Mbah Maridjan, the gatekeeper of Merapi, as a block-and-ash pyroclastic flow reached Kinahrejo Village [2].
After the eruption on 26 October 2010, Merapi’s activity continued to increase. On 3 November 2010, a major eruption occurred again. The Geological Agency recommended shifting the refugees to a safe area outside the radius of 15 km [6]. The existing 2009 contingency and evacuation plans could only be implemented well to handle the crisis in the first evacuation. During the second evacuation, contingency and evacuation plans were no longer used [2].
On 5 November 2010, there was an explosive eruption accompanied by glides of lava and hot clouds with a sliding distance of 17 km. The result of a study by the Geological Agency on Mount Merapi activity recommends that the safe distance be increased from 15 km to 20 km, which means that refugees need to move again outside the safe radius of 20 km. During the third evacuation, the refugees did not know where to evacuate, so they fled until they felt safe [6].
The three movements of refugees in the 2010 Merapi eruption indicate that the competent authorities need to revise the contingency and evacuation plans, especially the location of the shelters, to deal with the changes in the eruption characteristic every time Merapi explodes. One of the most influential aspects of designing an executable evacuation plan is determining the appropriate location of the shelters. The proper location of the shelters will reduce casualties and improve community safety. A place can be selected to be a shelter location if it meets certain criteria. The criteria should be identified and defined carefully, based on the characteristics of the disaster and the affected people. The criteria identified play an important role in the success of determining the location of the shelters.
Evacuation shelters can be in the form of official shelters designated by the government, community-based shelters, and relative-based shelters [2]. Official shelters can be in the form of (1) places that are built permanently and designated as refuges in the event of an eruption of Merapi (permanent shelters) and (2) places that usually are not used as shelters but function as shelters in the event of a Merapi eruption (temporary shelters). There are currently 12 permanent shelters, namely Barak Bimomartani, Barak Tirtomartani, Barak Umbulmartani, Barak Kuwang Argomulyo, Barak Gayam Argomulyo, Barak Sindumartani, Barak Pandanpuro Hargobinangun, Barak Kiyaran Wukirsari, Barak Brayut Wukirsari, Barak Plosokerep Umbulharjo, Barak Purwobinangun, and Barak Wonokerto. Some of the existing permanent shelters are within a radius of less than 15 km. Therefore, if the safe area is beyond a 15-km radius, some of the shelters remain unoccupied and temporary shelters are required.
In addition to the uncertain character of the Merapi eruption, the behavior of residents living around Mount Merapi is also unique. During the eruption period, they do a kind of dynamic evacuation. Based on an interview with the Regional Disaster Management Agency (RDMA) of Sleman Regency (BPBD Sleman), residents do not want to evacuate if the shelter is too far from their homes. They will move to farther shelters if the previous shelter is no longer safe. Residents living around Mount Merapi are not willing to directly evacuate to a place far from their homes, so it is not possible to immediately evacuate them, e.g., to a radius of 20 km. Therefore, some temporary shelters are needed to cope with the dynamic evacuation pattern, due to the uncertainty of the strength of the Merapi eruption.
This study aims to determine the location of temporary shelters for dynamic evacuations during volcanic eruptions, which is rarely discussed in the shelter site selection problem. The determination of temporary shelter locations plays a significant role during the emergency response period, especially during dynamic evacuations where the affected population will move more than once to the next safe shelter because the previous shelter has become insecure, as in the case of the Merapi eruption.
2. Literature Review
Site selection is the process of finding and selecting locations according to several criteria so that the multi-criteria decision-making (MCDM) method can assist in solving the problem of site selection [7]. Various MCDM methods are used in the site selection problems, e.g., analytical hierarchy process (AHP), weighted linear combination (WLC), preference ranking organization method for enrichment evaluation (PROMETHEE), elimination and choice translating reality (ELECTRE), and technique for order preference by similarity to ideal solution (TOPSIS) [8].
Site selection problems involve spatial data and require spatial analysis [9]. The Geographic Information System (GIS) is a computer software program for managing, visualizing, and analyzing location-based data on and under the earth’s surface. The strength of GIS lies in the ability to perform spatial analysis. Thus, GIS is widely used in site selection problems, e.g., the shelter location problem in a volcano disaster discussed in this paper. The integration of GIS and MCDM (GIS-MCDM) for site selection problems have been widely applied and is not limited to shelter site selection. Literature reviews regarding the site selection issues have been carried out, such as industrial site selection [10], photovoltaic solar power plant site selection [7,11], and landfill site selection [12,13]. The use of GIS in emergency services is not limited to shelter site selection, but also to other fields that require spatial data, such as runoff calculations [14,15].
A review of site selection models in natural disaster shelters has been carried out by Ma et al. [16]. This study reviews the optimization model for the shelter site selection problem. Based on the hierarchical type and objective function that minimizes evacuation time or time, shelter number or cost, and total risk, shelter location models can be classified as single-objective models, multi-objective models, and hierarchical models. Besides using exact and heuristics, some of the papers reviewed used GIS to find model solutions.
Sanyal and Lu [17] combined cartographic and remotely sensed data to identify the settlements that are vulnerable to monsoon floods in the Ajay River Basin of West Bengal, India. Proximity analysis tools in vector GIS and relational database management systems (RDBMS) are used to determine the ideal location for establishing flood shelters.
Tai et al. [18] applied Model Builder in GIS to construct a framework for analyzing the suitability of earthquake shelter planning. Model Builder, a tool of Arc GIS 9.3, with shelter location suitability analysis and flow charts to visualize the workflow, is used for shelter location evaluation. Shelter location evaluation consists of three layers and each layer corresponds to planning criteria.
Studies exploring how emergency shelters can adapt to multi-hazard environments using GIS were proposed by Chen et al. [19]. These studies applied three steps to select shelters location, i.e., (1) select the suitable resources and safe locations for emergency shelters in the context of multiple disasters; (2) predict the demand for different types of shelters by analyzing the scale and spatial distribution of affected areas and populations under different types of disaster scenarios; and (3) allocate shelters according to different conditions in the districts by taking into account the coverage of affected people.
A study plotting predicted inundation areas and locations for homecare recipients, nursing stations, and welfare evacuation shelters using GIS was proposed by Nakai et al. [20]. The study predicted evacuation routes, and then analyzed the time difference between the time required for evacuation and tsunami arrival at a welfare evacuation shelter.
Shan et al. [21] studied the optimal urban seismic shelter for evacuation, and used the GIS spatial analysis method, i.e., buffer analysis and network analysis, to study the optimal allocation of shelters and evacuation, while Huang et al. [22] studied a suitability assessment of emergency shelters based on GIS to determine the most appropriate location of emergency shelters. In these studies, the criteria of emergency shelters can be divided into three categories: applicability criterion, accessibility criterion, and safety criterion.
Kar and Hodgson [23] explored spatial location adequacy and the physical and socio-economic suitability of evacuation shelters in Florida using a GIS-based suitability model. The paper purposed to rank the existing and candidate of shelters on their site suitability. Suitability is defined as decreasing with proximity to hazardous facilities but as increasing with road accessibility and proximity to healthcare facilities. A GIS-based suitability model integrating WLC with a Pass/Fail screening technique was implemented for the 17 counties of Southern Florida.
Tsai et al. [24] proposed the integrated Takagi–Sugeno decision-making (TSDMK) system, which combines Takagi–Sugeno (T-S) fuzzy models into GIS spatial analysis for the allocation of disaster shelters in the Hualien train station area, Taiwan. Fuzzy is also used in a paper written by Chu and Su [25]. Chu and Su [25] used GIS, AHP, and comprehensive fuzzy evaluation to establish an earthquake emergency shelter. The AHP method is used to determine the index weight, and a comprehensive fuzzy evaluation method is used to select earthquake emergency shelters. The paper proposed an evaluation system that consists of two levels. The first level is the three-criteria layer and the second level is the nine-sub-criteria layer. Furthermore, Chu and Su [26] selected fixed seismic shelters for evacuation in cities using GIS, AHP, the entropy method, and TOPSIS. The weights of evaluation indicators are calculated through a combination of AHP and entropy, while fixed seismic shelters for evacuation are selected by applying the TOPSIS method.
The decision-making in the selection of earthquake emergency shelters by establishing a comprehensive evaluation model was proposed by Cheng and Yang [27]. The study used three evaluation indicators: the capacity of shelter, quality of the facility, and accessibility. The weight of each indicator is determined by using the AHP. Tong et al. [28] used GIS and AHP to determine three-level emergency shelters from alternate districts, community levels, street levels, and urban district levels in Songbei District of Harbin City, China. GIS spatial analysis is used for suitability analysis and AHP is used to obtain each weighting coefficient. GIS and AHP are also used to site selection of temporary housings after the earthquake in the sixth region of Shiraz Municipality, Iran [29]. Moreover, a GIS-based AHP approach is used for the site selection of urban emergency shelters in Jing’an District, Shanghai, China [30].
Dou et al. [31] proposed a GIS-based responsibility area subdivision for metropolitan emergency shelters. Three steps are applied for selecting the emergency shelters, i.e., (1) analyze and select the factors affecting the responsibility area; (2) determine their weights using the AHP method; (3) generate the weighted Voronoi diagram in ArcGIS.
Omidvar et al. [32] proposed a model of appropriate and systematic site selection for temporary shelters before an earthquake using a GIS and various MCDM, based on an earthquake damage assessment. The first step in the model is to determine the effective criteria for the site selection of temporary shelters. The second step is to prepare the geographical layers of those criteria. The geographical layers are used to select temporary shelters that match the criteria. The last step is the final selection using various MCDM (AHP, TOPSIS, ELECTRE, SAW).
Anhorn and Khazai [33] proposed open space suitability analysis for the selection of emergency shelters after an earthquake. The objective of this study is to model shelter site suitability by considering road network accessibility, capacity, and suitability of shelter. Anhorn and Khazai [29] defined the open space suitability index (OSSI) using a combination of two different measures: a qualitative evaluation criterion and a quantitative criterion. Therefore, the suitability index OSSI consists of two factors: first, an expert-based weighting procedure, and second, a GIS-based accessibility and capacity measure (CAMOS).
A multi-criteria spatial decision support system to identify shelters and emergency service locations in urban evacuation planning is proposed by Esmaelian et al. [34]. The study proposed the integration of GIS and MCDM method of Preference Ranking Organization Method for Enrichment Evaluation IV (PROMETHEE IV) combined with a linear programming model to find the most suitable locations for the construction of emergency service stations.
AHP was also applied as an MCDM method to investigate different shelter sites that belong to disaster-prone areas in the north of Iran [35]. Some possible criteria, including proximity to vulnerable areas, proximity to access paths (roads accessibilities), proximity to fire-fighting centers, proximity to populated areas, distance from fault lines, and proximity to medical centers, were considered to determine optimal temporary shelter areas and locations. With the support of GIS, the method comprised three steps, i.e., selecting candidate shelters, analyzing the spatial coverage of the shelters, and determining the shelter locations.
Asadi and Karami [36] proposed the use of GIS and MCDM methods of PROMETHEE, AHP, GAIA, and their comparison via data envelopment analysis (DEA) which determines the optimal location of safe shelters for earthquake conditions-based urban planning. The paper considered nine criteria, i.e., distance from the street network, distance from danger sites, population density, city texture, distance from the hospital, distance from support centers, the capacity of shelter, scattering, and allocation.
Shi et al. [37] constructed multi-level location models for different grades of emergency shelters to minimize the travel and construction costs and maximize the coverage rate. The actual service of emergency shelters is determined using GIS software and weighted Voronoi diagram (WVD) models. The service scope of emergency shelters was established in addition to the impact factors to be used in the evaluation system, based on AHP.
3. Research Methodology
Suitable locations and places for temporary shelters need to be determined before a disaster occurs. Locating (site selection) is the process of finding sites that meet some criteria [8,38]. Therefore, the problem of site selection, including selecting the location of the shelter, must start with identifying the appropriate criteria.
Determining the appropriate criteria is the most important step in determining the location of a facility, as well as determining the location of a shelter. Determination of shelter criteria in this study was carried out using a literature review, interviews, and a questionnaire survey on experts who have experience in the field of disasters, especially in the eruption of Mount Merapi. The experts that help to determine shelter criteria in this study come from agencies related to disasters, namely the RDMA of Sleman Regency (BPBD Sleman in Indonesia), RDMA of Yogyakarta Special Region Province (BPBD DIY in Indonesia), Center for Natural Disaster Studies of Universitas Gadjah Mada, Research and Development Center for Geological Disaster Technology (BPPTKG in Indonesia), Search and Rescue (SAR) of Yogyakarta Special Region Province, and from academics. All the respondents have experience in the field of disaster of more than 10 years.
The steps in determining the location of the shelters are shown in Figure 1. The first step is the identification of the criteria to determine the location of shelters from some references. In this step, a literature review is carried out to collect the criteria used in other research related to disaster management. This literature review is not limited by the type of disasters. The second step is designing a questionnaire. Not all the criteria identified from the literature review will be considered and used in the questionnaire. They need to be adjusted by considering the geographical conditions and policies of the Sleman government. This questionnaire contains criteria and sub-criteria that have been identified from the literature and adapted to geographical conditions, community behavior, and government policies. Parameters for each of sub-criteria are also included in this questionnaire. Respondents will fill in whether these criteria need to be considered in determining the location of the shelter. If these criteria are considered, the respondent will fill in the required parameters. For example, if distance from the road is considered as a criterion, then the parameter that must be filled in is the maximum distance of the candidate shelter from the road.
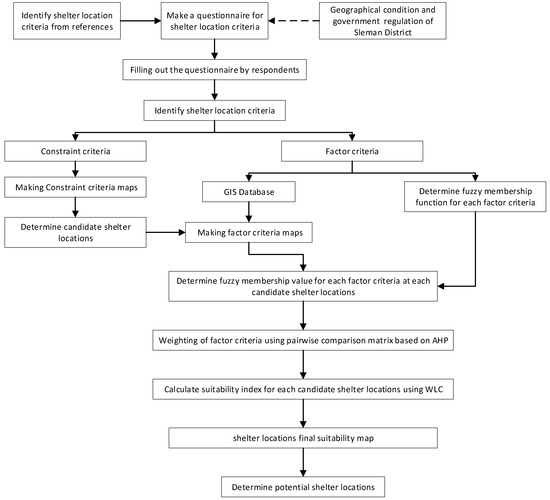
Figure 1.
Research methodology.
The next step is distributing the questionnaire to the target respondents to be filled out. Data filling by individual respondents will be carried out under supervision, but data filling by agencies will be carried out through the discussion of the relevant team. The result of the survey that has been filled in by respondents represents the criteria for determining the location of the shelters. The criteria obtained are then confirmed by BPBD Sleman, to be verified if there may be other criteria required to be considered or if there are criteria that should be dropped. The parameter values for each criterion will be used to determine the fuzzy membership function.
In general, the criteria for selecting the location, including the selection of shelter locations in this study, can be divided into two types, namely constraints (exclusionary criteria) and factors (evaluation criteria) [23,39]. A constraint is a criterion that specifies the location of a shelter in such a way that it should be within or further than a predetermined limit. For example, when the distance of a shelter from the affected area is limited to a maximum of 500 m, then accordingly, the location of the shelter is not allowed to be more than 500 m from the affected area [39]. Factor criteria is a list of requirements that must be designed to be met by a solution. A factor states the criteria in the form of the difference from the limit, to model the possibilities that the limits of the criteria may be violated. The ideal value of a factor is zero.
Places that are possible as shelter locations, hereinafter referred to as shelter candidates, are determined based on constraint criteria. From an interview with BPBD Sleman, a shelter candidate must be in a public place, not private property. To ensure that shelter candidates meet the constraint criteria, criteria constraint mapping is carried out. The mapping process of factor criteria is conducted based on a GIS database that matches these criteria. The source of data in the GIS database is a map in the form of a .shp file obtained from INA-Geoportal (village boundary maps, hazard zone maps, and road maps), from OpenStreetMaps (market maps, medical center maps, security maps, residential area maps, offices government, sports buildings, universities), from search results using google maps (fields and material reserves/warehouses), as well as from digitization results (river maps obtained from digitizing the Main River Flow Map in the Mount Merapi Region from BNPB). This digitization method was also carried out by Sayl et al. [40] to fulfill their data requirements.
Criteria in the form of constraints are based on Boolean logic, which is true or false. Constraints distinguish the suitable areas from the areas that are not. In contrast, criteria in the form of factors are based on fuzzy logic, because factors define degrees of suitability of all geographic areas, and usually, the suitability is measured in a continuous scale [41]. Every continuous mathematical function can be approximated by a fuzzy set [42]. Fuzzy logic is based on the value of an item which is not only true or false, but also the values between true and false. Suppose that the value 0 indicates false and the value 1 indicates true. Then, the membership value will include real numbers in the interval of [0, 1]. The membership value can be described by a curve/function called a membership function. Membership functions include linear and triangular functions.
Factor criteria mapping is used to determine the fuzzy membership value, especially for proximity criteria. For example, if proximity to the medical center is a factor criterion, it is necessary to calculate the distance from the candidate shelter to the medical center. The distance is calculated by entering the medical center map and the candidate shelter map in ArcGIS software. After the distance is obtained, the fuzzy membership value can be calculated using the fuzzy membership function.
The fuzzy membership value of non-proximity criteria, such as shelter capacity or open space ratio, is calculated based on the area that can be used as a shelter. For instance, the building area, the open area, and the field area are determined using Google Earth. The capacity of candidate shelters in the form of sports buildings, government offices, and universities, is calculated based on the building area divided by 3, according to BPBD Sleman’s policy that each person needs at least 3 square meters. The open space ratio is calculated from open area divided by total area of candidate shelter, which is the sum of building area and open area. According to the standard from BPBD Sleman, the area of candidate shelters in the form of fields that can be used for setting up tents is 30% of the total. For following is an example of capacity calculation for a field. Suppose that the area of each tent is 180 square meters. Then, each tent can cover 60 people. Hence, the shelter capacity is calculated from the number of tents times 60, where the number of tents is calculated from 30% times the field area divided by 180.
A potential shelter, i.e., a shelter candidate that has the potential to become a shelter location, is determined from a high suitability index value. Mapping the value of the suitability index will further define the locations of potential shelters. The value of the suitability index of each shelter candidate is calculated using weighted linear combination (WLC) method. The WLC is one of the most widely used GIS-based decision rules [43] and can be implemented in both raster and vector GIS environments. In a raster GIS environment, the alternatives are represented by the set of cells or pixels in a raster GIS database [43,44]. The alternatives in a vector GIS environment are given as points, lines, or areas (polygons) [44]. The alternatives in this study are candidate shelters in the form of points.
The WLC is based on the concept of a weighted average in which continuous criteria are standardized to a common numeric range, and then combined by means of a weighted average [44]. Therefore, the suitability value can be calculated using Equation (1).
where S is suitability, Wi is weight of factor i, and Xi is the criterion score of factor i.
If the criteria are measured at different scales, the factors need to be standardized first. The process of standardizing can be performed by transforming the measures into a statement of set membership. If the continuous factors are real fuzzy sets, simply recognizable as just one of many possible values in the set membership functions, then the standardization of factors is suggested to use a range of fuzzy set membership functions of either a 0–1 real number scale or a 0–255 bytes-scale [44].
There are several techniques to determine the weight of factor, such as ranking methods, rating methods, pairwise comparison methods, or trade-off analysis methods [44]. The pairwise comparison technique has developed by Saaty [45], known as AHP. The weight of factor criterion in this study is determined using AHP.
The AHP is a powerful multi-criteria decision-making tool that has been widely used in almost all applications related to decision-making, especially in hierarchical decision-making. The AHP applies the Eigenvalues approach to pair-wise comparison among criteria [46,47]. The measurement scales suitable for pairwise comparisons are mainly: 1 = equally preferred, 3 = moderately preferred, 5 = strongly preferred, 7 = strongly preferred, and 9 = extremely preferred. The numbers 2, 4, 6, and 8 are used to distinguish similar alternatives between the main scales [47].
The consistency index (CI) needs to be calculated first to see the consistency of the respondents’ assessments. The first step is to add up the values in each column of the pairwise comparison matrix and then divide each column value by the total column in question. The matrix obtained is called the normalized matrix. The priority vector element is the weight for each criterion obtained from the average of the normalized matrix rows. The CI calculation is to be conducted by calculating the consistency ratio (CR). If the CR is less than 0.1, it means that the assessment is consistent, and the obtained weights can be used. The equation for calculating CR is
where RI is a random index, n is the order of the pairwise comparison matrix, and λmax is calculated from the average of each element of the priority vector matrix divided by the matrix elements of the product of the pairwise comparison matrix with the priority vector matrix.
CR = CI/RI
CI = (λmax − n)/(n − 1)
RI = 1.98(n − 2)/n
4. Research Result
4.1. Shelter Criteria for the Merapi Eruption
The location that will be used as a shelter in this study is limited to the Sleman Regency area. The map of the Sleman Regency is shown in Figure 2. The area affected by the eruption of Mount Merapi is not only Sleman Regency, but also Magelang Regency, Klaten Regency, and Boyolali Regency. However, disaster management is carried out by each district, and the government regulations and the behavior of the population may be different. Therefore, this study does not discuss all of the affected districts, but only the location of temporary shelters in the Sleman district.
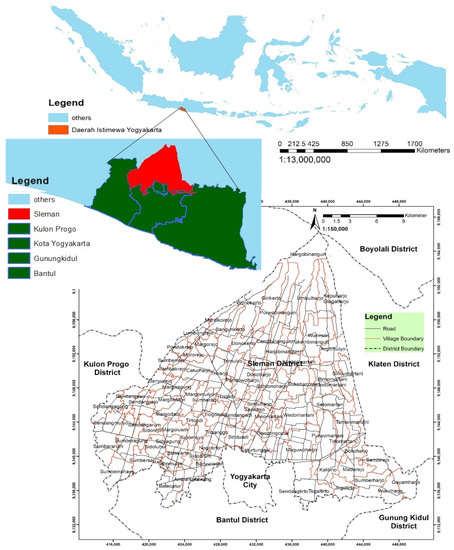
Figure 2.
Sleman Regency.
The establishment of the criteria to determine the location of the Merapi eruption shelters in this study was adjusted to the geographical conditions and government regulations of Sleman Regency. Based on the results of the questionnaire, the criteria obtained are divided into two parts, namely constraints and factors.
The constraint criteria in this study are:
- 1.
- The location of the shelter can be in the hazard zone, with a maximum limit of 500 m from the hazard zone boundary. If the location of the shelter in meters is x then
x ≥ hazard zone boundary − 500
- 2.
- The location of the shelter can be in an area with less than a safety radius, with a maximum limit of 1000 m from the safety radius. If the location of the shelter in meters is x, then
x ≥ safety radius − 1,000
The parameter values, or the constraint limits, were obtained from the questionnaire results and verified by BPBD Sleman, because BPBD Sleman is directly involved in contingency planning, in evacuation during the eruption of Merapi, and in taking care of refugees in shelters during the evacuation period.
The Sleman Regency Government has a policy regarding the hazard zone (Kawasan Rawan Bencana or KRB in Indonesia) of the eruption of Mount Merapi. The hazard zone is divided into three degrees of hazard, namely Hazard Zone I, Hazard Zone II, and Hazard Zone III (see Figure 3). Hazard Zone III is the area closest to the hazard source and is frequently affected by pyroclastic flows, lava flows, rock falls, and ejected rock fragments. Hazard Zone II is the area affected by mass flow (pyroclastic flows, lava flows, and lahars) and ejected material (material fall, volcanic bombs, and other ejected rocks). Hazard Zone I is an area potentially affected by lahar/flood. The Hazard Zone I area is also potentially affected by volcanic ash fall and ejected rock fragments if the Merapi eruption increases [48,49]. Figure 3a shows a hazard zone map for Sleman Regency.
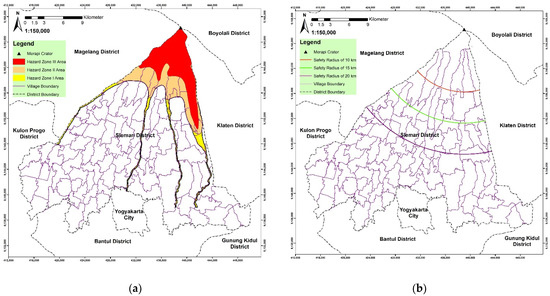
Figure 3.
Hazard zone map and safety radius map. (a) Hazard Zone Map. (b) Safety Radius Map.
A safety radius is used to determine a safe area to occupy in the event of an eruption. The safety radius is determined at the time of the eruption and is measured from the peak of Mount Merapi. For example, if the safety radius is 10 km, then the area outside the 10-km radius is a safe area to live in and can be used as the location for shelters. Figure 3b shows a safety radius map of 10 km, 15 km, and 20 km for Sleman Regency. From the results of the questionnaire, there is one more constraint criterion, namely that the location of the shelter must have communication services. However, based on an interview with BPBD Sleman, almost all the places in Sleman are covered by telephone or internet networks, so communication services are eliminated from the constraint criteria.
The factor criteria consist of five criteria, namely disaster risk, land suitability, accessibility, infrastructure, and feasibility. Based on the reviewed literature on the shelter site selection problem, there are six criteria, namely (1) disaster risk, with sub-criteria distance from hazardous areas [19,22,23,25,26,32,36,50], geological hazard [25,26,51,52], distance to fault [29,51,53],, environmental diseases [32,52], secondary hazard [33,52], pollution issues [33,52], flood potential [53], distance for dams [28], distance to river [29]; (2) land suitability, with sub-criteria soil permeability [32,52], slope [22,31,32,52,54,55,56,57], topography [25,26,32,54,55,56,57], elevation [19,51,58], type of terrain [54,55], ownership [52,54], land use [30,31,33,34,52,58]; (3) infrastructure, with sub-criteria electrical infrastructure [25,33,50,52,54,55,56], sewage infrastructure [54,56], water resources [25,32,33,50,51,52,56], sanitary system [50,55,57]; (4) accessibility, with sub-criteria distance from medical center/healthcare [22,23,26,32,33,36,52,53,54,56], distance from fire station [22,26,50,53,56], distance from material reserve/warehouse [26,50,56], distance from market/supermarket [54,56], distance from road [23,30,36,54,56], road connection/access connection [25,27,32,51,52], distance from emergency area [17,24,27,52], distance from residential area [17,28], width of street [25,26,31,39], population density [23,29,34,36,51], communication services [27,52,56]; (5) feasibility, with sub-criteria shelter area [25,31,39], open space ratio [22,53], capacity of shelter [27,50,53,56]; and (6) environment, with sub-criteria distance from waste treatment stations [19], security and protection [31,32,34,53], solid waste disposal [56]. The sub-criteria in the environmental criteria are still relevant if they are included in the accessibility criteria, therefore only five criteria are defined. The sub-criteria obtained from the literature are not for volcanic eruption disasters, thus not all sub-criteria are considered for volcanic eruption cases. The sub-criteria used in this study have been adjusted based on geographical conditions, government policies, and the consideration of experts through questionnaires.
The factor criteria and the related probability mass functions (pmf) of the fuzzy membership can be shown in Table 1.

Table 1.
Factor criteria.
A survey conducted shows that places inside the hazard zone cannot be used as a shelter. If a place that is in the hazard zone has to be used as a shelter, the distance of the place must not exceed 500 m from the hazard zone. However, the chance of the place being selected is small, which is 0.05.
The area that can be used as shelters must be outside the safety radius set by the Geological Agency. The survey results said that if it is necessary to use an area that is less than the specified safety radius, then the area must be located less than 1000 m from the safety radius, and the chance of choosing that place is small, i.e., 0.05.
The river refers to a river that has the potential for cold lava flooding, namely a river that originates at Mount Merapi. If there is heavy rain, the river becomes dangerous because it has the potential to drain cold lava floods. Thus, the location of the shelter should not be too close to the river.
Land use indicates the current land use, e.g., land used for schools, colleges, fields, sports buildings, settlements, agricultural land, industrial land, government offices, landfills, and cultural heritage. From the survey results, the land that can be used as a location for shelters is the land currently used for sports buildings, universities, fields, and government offices. However, not all university buildings can be used as temporary shelters. University buildings that can be used are the auditorium, student arena, multipurpose building, and others that are not located together with the building for lecture activities so that they do not interfere with teaching and learning activities.
Accessibility indicates the ease of access from the shelter to the places needed by refugees or from the affected area to the shelter. Places whose roads are too narrow and difficult to pass through for vehicles will not be selected as locations for shelters because they are difficult to reach from the affected area during the evacuation and will cause difficulty in distributing relief items. In addition, remote places that are far from settlements, cannot be used as shelters, because generally places that are far from settlements are also far from places where refugees go to meet their needs, e.g., health facilities and markets.
The proximity of the location of the shelter to the medical center/healthcare is needed to help sick refugees. The closer the location of the shelter to the hospital, the better. The proximity of the shelter location to the material reserve/warehouse is needed to facilitate the distribution of goods needed by refugees. The closer the shelter location to the material warehouse, the better. The proximity of the shelter to the market/supermarket makes it easier for refugees to buy the necessary items if they are not available as relief items. It is good if the shelter is close to the market, but if the shelter is too close to the market, it will disrupt the distribution of relief goods. The proximity of the shelter location to the residential area will make the refugees feel comfortable, but if they are too close, it can cause clashes with the residents of the village. The proximity of the shelter location to the fire station location is required in case of a fire at the shelter. The closer the shelter location to the location of the fire station, the better. The proximity to police stations, security posts, or military premises is needed to protect refugees from crimes such as theft.
The proximity of the shelter to the road facilitates the evacuation and distribution of relief items. The roads meant here are national roads, provincial roads, city roads, and regency roads, not village roads. The roads are better if they are wide enough, allowing for both directions so that trucks or cars can pass each other from different directions. Road connection/access connection refers to road access to get to the shelter. If there are many alternate ways to reach the shelters from the affected area, the evacuation process will be easier.
The infrastructure is associated with the refugees’ daily needs to be fulfilled. If it is not met, their health and comfort will be affected. The existence of clean water sources at the shelter or the proximity to clean water sources is a must in determining the location of shelters. Electricity is currently indispensable in everyday life, so it is necessary to have a shelter close to the electricity source. Sanitary systems are the basic needs of refugees. The location of the shelter should not be far from the sanitary system.
From the results of the questionnaire, a temporary garbage disposal facility needs to be considered in determining the location of the shelters. However, after being confirmed with the Sleman BPBD, the Sleman Regency government usually provides temporary waste disposal sites in the form of containers at each shelter location, both permanent and temporary shelters. Therefore, for the case of determining the location of shelters in the eruption of Mount Merapi, this criterion was omitted.
The place to be used as a shelter should be suitable. For example, it should have a large enough area so that it can accommodate quite many refugees. The shelter should also have open space that can be used in addition to sleeping and resting. The open space ratio is the ratio of the open space area without buildings to the total land area used as the location of the shelter. The use of open spaces, among others, is for parking and children’s play areas.
4.2. Candidate Shelters for the Merapi Eruption
This study discusses the determination of the location of temporary shelters in dynamic evacuations where the shelters that were originally safe become unsafe due to the increased eruptions. Based on the 2010 Merapi eruption, the safety radius which was originally set at 10 km was changed to 15 km and changed again to 20 km, so in this study, the location of temporary shelters will be determined at a safety radius of 10 km, 15 km, and 20 km.
The location of candidate shelters must meet the constraint criteria. From the interviews with respondents and the questionnaires, locations that can be used as candidate shelters are public property locations such as fields, sports buildings, government offices, and universities. However, not all those types of locations can be utilized as candidate shelters. Most government offices can be used as shelter candidates if the office has a large enough open space so that it can benefit as, among others, a parking lot and children’s playground.
Sports buildings can usually be utilized as candidate shelters. Not all fields can be used as shelter candidates because the fields usually do not have bathrooms and sanitary systems, so the fields that will be used as shelters location are the fields that are located close to public facilities such as mosques/musholas, schools, or government offices. When a field is used as a shelter, some tents will be set up and, in such a way, 70% of the total field area should be dedicated for open space purposes. Therefore, a field with an inadequate area cannot also be used as a shelter candidate. The area of the field and the distance from the field to the water source, to the electrical installation, and to the sanitary system, are determined with the help of the Google Earth.
Buildings within universities that can be used as shelters include auditoriums, multi-purpose buildings, and convention halls. Not all universities can be used as shelter candidate locations. University facilities can be used as shelters as long as they do not interfere with teaching and learning activities. A university that has an auditorium may not necessarily be used as a shelter candidate location, e.g., if the university has an auditorium on the 4th floor, but the floors below are used for teaching and learning activities.
Table 2.
Shelter candidates.
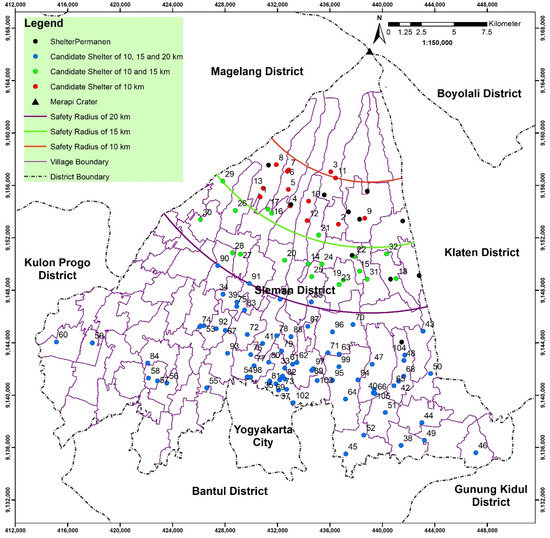
Figure 4.
Shelter candidates map.
The shelter candidate numbers 1–13 are no longer safe if the safety radius changes to 15 km. For a safety radius of 20 km, the candidates for shelters that are still safe begin with shelter number 33.
4.3. Fuzzy Membership Value
The fuzzy membership value is calculated using the obtained fuzzy membership function. In some fuzzy membership functions in Table 1, to calculate the fuzzy membership value, it takes the distance of the shelter candidate to a certain place. Therefore, a map is needed to determine the closest distance from the shelter candidate to that place. The mapping of several criteria is carried out in ArcGIS and then the closest distance is determined using the near tool.
In the hazard zone sub-criteria, three maps are made, namely for a safety radius of 10 km, 15 km, and 20 km. The hazard zone chosen to be used to calculate the fuzzy membership value depends on the safety radius set by the Sleman Regency government. If the government stipulates a safety radius of 10 km, then the Hazard Zone II boundary is used because most of the area in Hazard Zone III is no longer safe and some areas in Hazard Zone II are located within the 10-km safety radius. If the safety radius is 15 km or 20 km, most of the area in Hazard Zone II is no longer safe. Then, the Hazard Zone I boundary is used. Figure 5 shows the calculation of fuzzy membership value through the hazard zone map for (a) a safety radius of 10 km, (b) a safety radius of 15 km, and (c) a safety radius of 20 km. The unsafe zone on the map is an area that cannot be used as a shelter location because it violates the constraints.
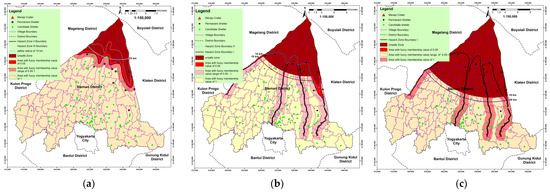
Figure 5.
Hazard zone map for calculating fuzzy membership values. (a) Hazard Zone Map in the 10 km Safety Radius. (b) Hazard Zone Map in the 15 km Safety Radius. (c) Hazard Zone Map in the 20 km Safety Radius.
Figure 6 shows that all the specified shelter candidates have met the constraints, so to make it easier to read the map, the hazard zones for those maps are not depicted. Fuzzy membership values for the safety radius sub-criteria can be seen in Figure 6. Figure 6a shows the fuzzy membership values for a safety radius of 10 km set by the government, Figure 6b is for a safety radius of 15 km, and Figure 6c is for a safety radius of 20 km. The yellow area in Figure 6 shows an area with a fuzzy membership value of 0, which means that the area is still possible to be used as a shelter location but is not suitable. On one hand, the closer the location of the shelter candidates to the crater in the blue area, the higher the value of fuzzy membership because refugees do not want to evacuate to places that are too far away. On the other hand, the closer the shelter candidate locations to the crater in the pink area, the smaller the fuzzy membership value because it is closer to the unsafe zone.
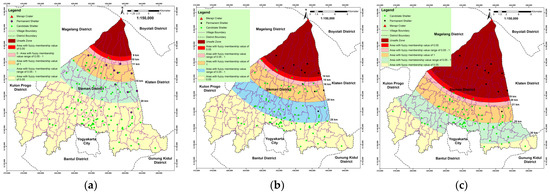
Figure 6.
Fuzzy membership values in safety radius sub-criteria. (a) Safety Radius of 10 km Map. (b) Safety Radius of 15 km Map. (c) Safety Radius of 20 km Map.
The proximity of the shelter candidate locations to the river and the proximity of the shelter candidate locations to the road are shown in Figure 7a,b. The white area in Figure 7a shows an area that is more than 1000 m away from the river and has a fuzzy membership value of 1. In contrast, Figure 7b displays the white area that has a fuzzy membership value of 0 because it is far from the road.
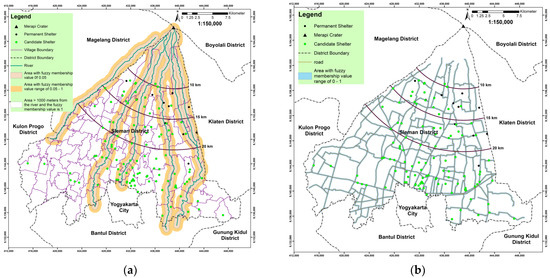
Figure 7.
Fuzzy membership value for sub-criteria (a) distances from the river and (b) distances from the road.
The distance from the shelter candidate locations to the market/supermarket location and the medical center, respectively, are calculated based on the maps in Figure 8a,b using the near tool in ArcGIS. This distance is used to determine the fuzzy membership values in the respective sub-criteria. The fuzzy membership values for the sub-criteria ‘distance from material reserve/warehouse, security, and protection’ and ‘distance from fire station’ are determined in the same way as the calculation of the fuzzy membership values for the sub-criteria ‘distance from market/supermarket’. The fuzzy membership values for the ‘distance from the residential area’ sub-criteria are calculated based on the closest distance between the shelter candidate locations and the residential area using a map as shown in Figure 8c.
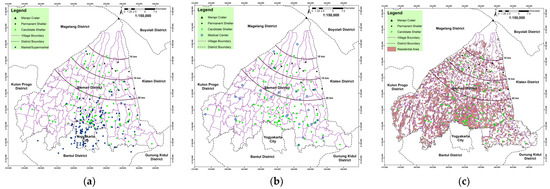
Figure 8.
(a) Market/supermarket map (b) Medical center map (c) Residential area map.
The shelter candidates whose current functions are government offices, sports buildings, and universities already have electrical installations, clean water sources, and sanitary systems, so their values of the fuzzy membership are 1. In general, the fuzzy membership values of other types of facilities used as shelter candidates are calculated based on their distance to the nearest public facility that has a source of clean water, electrical installations, and sanitary system.
4.4. Analytical Hierarchy Process
After the fuzzy membership values are obtained, the next step is to determine the weight of each criterion using the AHP. According to Equations (2)–(4), the calculation of the weight of each criterion can be seen in Table 3, Table 4, Table 5, Table 6, Table 7 and Table 8.
Table 3.
Pairwise comparison matrix and normalized matrix for disaster risk criterion.
Table 4.
Pairwise comparison matrix for accessibility criterion.
Table 5.
Normalized matrix for accessibility criterion.
Table 6.
Pairwise comparison matrix and normalized matrix for infrastructure criterion.
Table 7.
Pairwise comparison matrix and normalized matrix for feasibility criterion.
Table 8.
Pairwise comparison matrix and normalized matrix for the main criterion.
4.5. Potential Shelter
AHP is used to determine the relative importance among factor criteria, by which the weight is obtained for each of these criteria. Meanwhile, the suitability index (SI) for each location is determined using the WLC according to Equation (1). The factor criterion score in this study is a fuzzy membership value, so Equation (1) is modified to Equation (5).
In Equation (4), n is the order of the pairwise comparison matrix, wi and fi are the weights and the fuzzy membership values for the ith criterion, respectively.
The SI values are classified into three levels of suitability, namely high, medium, and low (Table 9). Shelter candidates who have a high suitability level will be classified as potential shelters. Potential shelters are locations that are prioritized as temporary shelters during the emergency response phase. Shelter candidates with a medium suitability level can be used as a backup or alternate temporary shelters if the available potential shelters are insufficient due to the impact of the eruption.
Table 9.
Suitability level of shelter candidates.
The purpose of this study is to determine the potential for temporary shelters in dynamic evacuation due to the changes in the power of the Merapi eruption. The changes in the power of the eruption will be followed by the changes in the safety radius. This study is applied to three levels of safety radius, namely the safety radius of 10 km, 15 km, and 20 km, based on the 2010 Merapi eruption case. Figure 9, Figure 10 and Figure 11 present suitability maps for a safety radius of 10 km, 15 km, and 20 km, respectively. Shelter candidates with green color are potential shelters and have a high suitability level, blue shelter candidates have medium suitability levels, and red shelter candidates have low suitability levels.
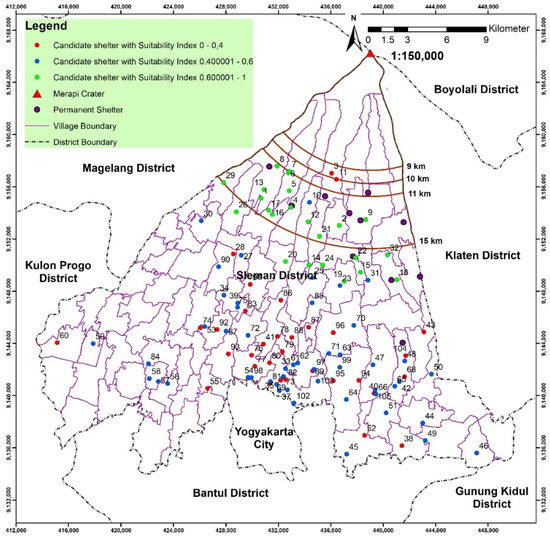
Figure 9.
Suitability map for a safety radius of 10 km.
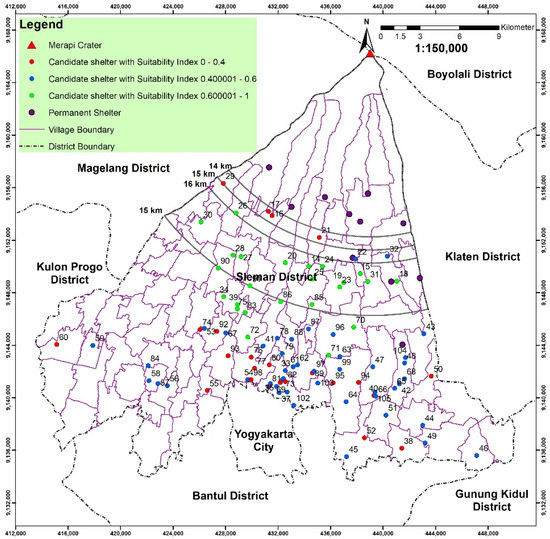
Figure 10.
Suitability map for a safety radius of 15 km.
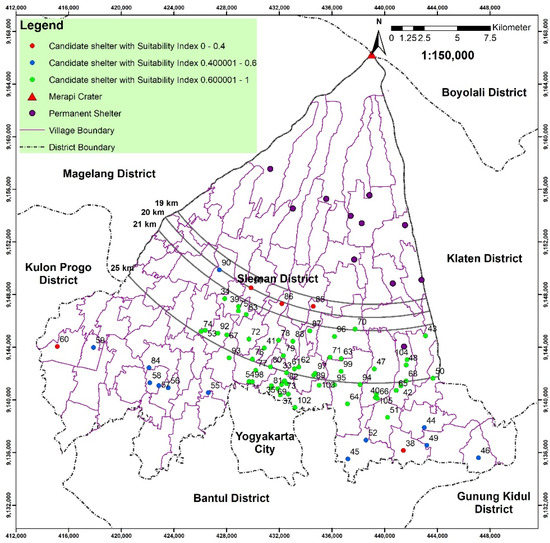
Figure 11.
Suitability map for a safety radius of 20 km.
5. Discussion
Immediately after the eruption, temporary shelters need to be ready for occupation. Therefore, the emergency decision maker should be able to identify suitable evacuation shelters as quickly as possible. Moreover, when the power of the eruption increases and the inhabited shelters are no longer safe, the decision maker must immediately identify the next suitable shelters. This study addresses the problem of quick identification of suitable shelters.
To determine a suitable shelter, the first thing that should be known is the criteria that must be met to assign a location as a temporary shelter. Locations that meet the constraint criteria and are public facilities in the form of sports buildings (GOR in Indonesia), government offices, universities, and fields will be used as candidates for temporary shelter locations or shelter candidates. The mapping of the shelter candidates that have been obtained is performed by entering the coordinates in ArcGIS. Overlay and buffering in ArcGIS against the GIS database are conducted to determine the data used to calculate the fuzzy membership values, including distance data. The fuzzy membership values and the weight of each factor criterion obtained from the AHP are then used to determine the SI of each shelter candidate using WLC. Shelter candidates who have an SI of greater than 0.6 or have a high suitability level will be classified as potential shelters, which will be prioritized as temporary shelters in the emergency response phase.
As mentioned previously, this study aims to determine some locations to build temporary shelters to be used by refugees during the dynamic eruption of Mount Merapi, which is the power of the eruption change over time. The power of a volcanic eruption can be measured using the volcanic explosivity index (VEI). The scale of VEI describes the explosiveness of a volcanic eruption in terms of its magnitude and intensity. The increase of VEI during the crisis indicates the widening of the safety radius so that the shelters’ location previously safe becomes unsafe, and the refugees have to move farther to the next safe place. According to BPBD Sleman, an ideal temporary shelter should be far away from the peak of Mount Merapi so that the refugees are not necessary to move repeatedly when the power of the eruption increase. However, the behavior of the residents around Merapi mountain is unique. They would not move too far from their houses because their livelihood is there. Thus, they prefer to refuge again and again, following the increase of VEI, moving to the next safe place when the shelters where they live become unsafe again.
Figure 9 shows that for a safety radius of 10 km, the higher the suitability index of a shelter, the closer its position to the borderline of a 10-km radius. This means that most potential temporary shelters are near the borderline of the 10-km radius. Similarly, in Figure 10, most potential temporary shelters are close to the safety radius of 15 km. For a safety radius of 20 km, the most potential temporary shelters will be around the borderline of the 20 km radius (Figure 11).
The government can use Figure 9, Figure 10 and Figure 11 as implementation guidance to manage the dynamic evacuation when a disaster happens, as in the case of the 2010 eruption. In the beginning, when the safety radius is 10 km, the government can decide the places shown in Figure 9 as the shelters for the residents living in the location inside the radius of 10 km. The number of potential shelters outside the radius of 10 km is 23. When the VEI increase and the safety radius changes to 15 km, the residents living in the area between the radius of 10–15 km and the refugees that have been living in the shelters near the 10 km safety radius will be moved to the potential temporary shelters illustrated in Figure 10. There are 24 potential shelters outside the radius of 15 km. Likewise, when the safety radius changes to 20 km, the places shown in Figure 11 become the shelters for the residents living in the area between the radius of 15 km to 20 km and the refugees living in the 15 km shelters. Outside the radius of 20 km, there are 57 potential shelters can be used. The number of shelters needed at the safety radius of 10 km is lower than the number of shelters needed at the safety radius of 15 km because there are fewer refugees. Furthermore, the number of evacuees in the safety radius of 20 km is the highest compared to the number of evacuees in the safety radius of 10 km or 15 km, so the number of shelters needed is the most. The number of potential shelters determined to be available for the safety radius of 10 km, 15 km, and 20 km are respectively increasing according to the increasing number of refugees, although those potential shelters are not necessarily all used as the shelter during the emergency response phase. In case where residents agree to move far away from the peak of Mount Merapi, e.g., in the potential temporary shelters outside the 20 km radius, the residents do not necessarily need to repeatedly move even though the VEI increases.
6. Conclusions
The results of this study are potential temporary shelter locations, namely locations that have a high level of suitability to be prioritized as temporary shelter locations in the emergency response phase. The potential temporary shelters obtained can be applied to the evacuation during the dynamic Merapi eruption, when refugees will move to the next safe shelter because the previous shelter has become unsafe. In this study, three levels of safety radius are given based on the 2010 Merapi eruption, namely the safety radius of 10 km, 15 km, and 20 km.
The potential shelters obtained in this study are locations that meet several criteria. However, these locations are not necessarily optimal locations that minimize the total evacuation time. Therefore, this research can be extended to the determination of the optimal shelter locations by developing an optimization model and solving it analytically or heuristically. For further research, the potential shelters obtained using the model in this paper can be used as the initial condition for the determination of the optimal shelter location using an optimization model.
Author Contributions
Conceptualization, S.S.W., B.M.S., A.M.S.A. and H.S.; methodology, S.S.W., B.M.S., A.M.S.A. and H.S.; software, S.S.W. and H.S.; validation, S.S.W., B.M.S. and H.S.; formal analysis, S.S.W., B.M.S., A.M.S.A. and H.S.; investigation, S.S.W. and H.S.; data curation, S.S.W. and H.S.; writing—original draft preparation, S.S.W. and A.M.S.A.; writing—review and editing, S.S.W., B.M.S. and A.M.S.A.; visualization, S.S.W. and H.S.; supervision, B.M.S., A.M.S.A. and H.S.; project administration, B.M.S.; funding acquisition, S.S.W. and B.M.S. All authors have read and agreed to the published version of the manuscript.
Funding
This research is funded by the Indonesian Ministry of Education, Culture, Research and Technology through the PDD Scheme managed by Gadjah Mada University (Contract No. 2299/UNI/DITLIT/DIT-LIT/PT/2021).
Institutional Review Board Statement
Not applicable.
Informed Consent Statement
Not applicable.
Data Availability Statement
The study did not report any data.
Conflicts of Interest
The authors declare no conflict of interest.
References
- Voight, B.; Constantine, E.K.; Siswowidjoyo, S.; Torley, R. Historical Eruptions of Merapi Volcano, Central Java, Indonesia. J. Volcanol. Geotherm. Res. 2000, 100, 69–138. [Google Scholar] [CrossRef]
- Mei, E.T.W.; Lavigne, F. Mass Evacuation of the 2010 Merapi Eruption. Int. J. Emerg. Manag. 2013, 9, 298–311. [Google Scholar] [CrossRef]
- Newhall, C.G.; Bronto, S.; Alloway, B.; Banks, N.G.; Bahar, I. 10,000 Years of Explosive Eruptions of Merapi Volcano, Central Java: Archaeological and Modern Implications. J. Volcanol. Geotherm. Res. 2000, 100, 9–50. [Google Scholar] [CrossRef]
- Mei, E.T.W.; Lavigne, F.; Picquout, A.; de Bélizal, E.; Brunstein, D.; Grancher, D.; Sartohadi, J.; Cholik, N.; Vidal, C. Lessons Learned from the 2010 Evacuations at Merapi Volcano. J. Volcanol. Geotherm. Res. 2013, 261, 348–365. [Google Scholar] [CrossRef]
- Jumadi Carver, S.J.; Quincey, D.J. A Conceptual Design of Spatio-Temporal Agent-Based Model for Volcanic Evacuation. Systems 2017, 5, 53. [Google Scholar] [CrossRef]
- BPBD Sleman. Laporan Tanggap Darurat Erupsi Merapi 2010; Pemerintah Kabupaten Sleman: Sleman, Indonesia, 2011. [Google Scholar]
- Al Garni, H.Z.; Awasthi, A. Solar PV Power Plants Site Selection: A Review. Adv. Renew. Energ. Power Technol. 2018, 1, 57–75. [Google Scholar] [CrossRef]
- Wigati, S.S.; Sopha, B.M.; Asih, A.M.S.; Sutanta, H. Bibliometric Analysis for Site Selection Problems Using Geographic Information Systems, Multi-Criteria Decision Analysis and Fuzzy Method. URICSE J. Phys. Conf. Ser. 2019, 1351, 012051. [Google Scholar] [CrossRef]
- Muneer, A.S.; Sayl, K.N.; Kamal, A.H. Modeling of spatially distributed infiltration in the Iraqi Western Desert. Appl. Geomat. 2021, 13, 467–479. [Google Scholar] [CrossRef]
- Rikalović, A.; Cocić, I. GIS Based Multi-Criteria Decision Analysis for Industrial Site Selection: The State of the Art. J. Appl. Eng. Sci. 2014, 12, 197–206. [Google Scholar] [CrossRef]
- Rediske, G.; Siluk, J.C.M.; Gastaldo, M.G.; Rigo, P.D.; Rosa, C.B. Determinant Factors in Site Selection for Photovoltaic Projects: A Systematic Review. Int. J. Energy Res. 2018, 1–13. [Google Scholar] [CrossRef]
- Lokhande, T.I.; Mane, S.J.; Mali, S.T. Landfill Site Selection using GIS and MCDA Methods: A Review. Int. J. Res. Eng. Sci. Technol. 2017, 3, 25–30. [Google Scholar]
- Abujayyab, S.K.M.; Sanusi, M.S.; Yahya, A.S.; Alslaibi, T. GIS Modeling for Landfill Site Selection via Multi-Criteria Decision Analysis: A Systematic Review. In Proceedings of the International Conference on High Performance Compilation, Computing and Communications, Kuala Lumpur, Indonesia, 22–24 March 2017. [Google Scholar] [CrossRef]
- Hashim, H.Q.; Sayl, K.N. The application of radial basis network model, GIS, and spectral reflectance band recognition for runoff calculation. Int. J. Des. Nat. Ecodynamics 2020, 15, 441–447. [Google Scholar] [CrossRef]
- Muneer, A.S.; Sayl, K.N.; Kamel, A.H. Modeling of runoff in the arid regions using remote sensing and geographic information system (GIS). Int. J. Des. Nat. Ecodynamics 2020, 15, 691–700. [Google Scholar] [CrossRef]
- Ma, Y.; Xu, W.; Qin, L.; Zhao, X. Site Selection Models in Natural Disaster Shelters: A Review. Sustainability 2019, 11, 399. [Google Scholar] [CrossRef]
- Sanyal, J.; Lu, X.X. Ideal Location for Flood Shelter: A Geographic Information System Approach. J. Flood Risk Manag. 2009, 2, 262–271. [Google Scholar] [CrossRef]
- Tai, C.; Lee, Y.; Lin, C. Earthquake Evacuation Shelter Feasibility Analysis Applying with GIS Model Builder. In Proceedings of the 40th International Conference on Computers & Industrial Engineering, CIE40, Awaji, Japan, 25–28 July 2010. [Google Scholar] [CrossRef]
- Chen, W.; Zhai, G.; Ren, C.; Shi, Y.; Zhang, J. Urban Resources Selection and Allocation for Emergency Shelters: In a Multi-Hazard Environment. Int. J. Environ. Res. Public Health 2018, 15, 1261. [Google Scholar] [CrossRef]
- Nakai, H.; Itatani, T.; Horiike, R.; Kyota, K.; Tsukasaki, K. Tsunami Evacuation Simulation Using Geographic Information Systems for Homecare Recipients Depending on Electric Devices. PLoS ONE 2018, 13, 1–18. [Google Scholar] [CrossRef]
- Shan, B.; Wang, K.; Wang, L. Optimal Location of Urban Seismic Shelter for Evacuation Based on Network Analysis of GIS. In Proceedings of the IEEE 3rd International Conference on Cloud Computing and Big Data Analysis, Chengdu, China, 20–22 April 2018; pp. 532–536. [Google Scholar] [CrossRef]
- Huang, Y.; Yin, Z.; Chu, H. Suitability Assessment of Emergency Shelters Based on GIS: A Case Study in Urban Function Optimization Area of Shanghai. In Proceedings of the IOP Conference Series: Earth and Environmental Science, Hubei, China, 14–16 December 2018; Volume 234, p. 012039. [Google Scholar] [CrossRef]
- Kar BHodgson, M.E. A GIS-based Model to Determine Site Suitability of Emergency Evacuation Shelters. Trans. GIS 2018, 12, 227–248. [Google Scholar] [CrossRef]
- Tsai, C.H.; Chen, C.W.; Chiang, W.L.; Lin, M.L. Application of geographic information system to the allocation of disaster shelters via fuzzy models. Eng. Comput. 2008, 25, 86–100. [Google Scholar] [CrossRef]
- Chu, J.Y.; Su, Y.P. Comprehensive Evaluation Index System in the Application for Earthquake Emergency Shelter Site. Adv. Mater. Res. 2011, 156, 79–83. [Google Scholar] [CrossRef]
- Chu, J.; Su, Y. The Application of TOPSIS Method in Selecting Fixed Seismic Shelter for Evacuation in Cities. Syst. Eng. Procedia 2012, 3, 391–397. [Google Scholar] [CrossRef]
- Cheng, H.; Yang, X.K. The Comprehensive Evaluation Model for Earthquake Emergency Shelter. Sustainable Transportation Systems: Plan, Design, Build, Manage, and Maintenance. In Proceedings of the Ninth Asia Pacific Transportation Development Conference, Chongqing, China, 29 June–1 July 2012; pp. 412–422. [Google Scholar] [CrossRef]
- Tong, Z.; Zhang, J.; Liu, X. GIS-Based Design of Urban Emergency Shelter in Songbei Harbin. Lect. Notes Electr. Eng. 2012, 129, 617–622. [Google Scholar] [CrossRef]
- Givechi, S.; Attar, M.A.; Rashidi, A.; Nasbi, N. Site Selection of Temporary Housing After Earthquake by GIS and AHP Method Case Study: Region 6 of Shiraz Urban-Regional. J. Urban-Reg. Stud. Res. 2013, 5, 29–32. [Google Scholar]
- Yu, J.; Wen, J. Multi-criteria Satisfaction Assessment of the Spatial Distribution of Urban Emergency Shelters Based on High-Precision Population Estimation. Int. J. Disaster Risk Sci. 2016, 7, 413–429. [Google Scholar] [CrossRef]
- Dou, K.; Zhan, Q.; Li, S. GIS-based Responsibility Area Subdivision for Metropolitan Emergency Shelters: Case Study of Wuchang District, Wuhan City. In Proceedings of the 6th International Association for China Planning Conference, Wuhan, China, 17–19 June 2012. [Google Scholar] [CrossRef]
- Omidvar, B.; Baradaran-Shoraka, M.; Nojavan, M. Temporary Site Selection and Decision-Making Methods: A Case Study of Tehran, Iran. Disaster 2013, 37, 536–553. [Google Scholar] [CrossRef] [PubMed]
- Anhorn, J.; Khazai, B. Open Space Suitability Analysis for Emergency Shelter After an Earthquake. Nat. Hazards Earth Syst. Sci. 2015, 15, 789–803. [Google Scholar] [CrossRef]
- Esmaelian, M.; Tavana, M.; Arteaga, F.J.S. A Multicriteria Spatial Decision Support System for Solving Emergency Service Station Location Problems. Int. J. Geogr. Inf. Sci. 2015, 29, 37–41. [Google Scholar] [CrossRef]
- Junian, J.; Azizifar, V. The Evaluation of Temporary Shelter Areas Locations Using Geographic Information System and Analytic Hierarchy Process. Civ. Eng. J. 2018, 4, 1678–1688. [Google Scholar] [CrossRef]
- Asadi, M.; Karami, J. Spatial Optimization of Safe Shelters for Urban Evacuation Planning Caused by Earthquake Based on PROMETHEE, GAIA and DEA Method in GIS Environment (Case Study: Municipal District 12 of Tehran). Disaster Adv. 2019, 12, 37–45. [Google Scholar]
- Shi, Y.; Zhai, G.; Xu, L.; Zhu, Q.; Deng, J. Planning Emergency Shelters for Urban Disasters: A Multi-Level Location–Allocation Modeling Approach. Sustainability 2019, 11, 4285. [Google Scholar] [CrossRef]
- Khudhair, M.A.; Sayl, K.N.; Darama, Y. Locating Site Selection for Rainwater Harvesting Structure using Remote Sensing and GIS. IOP Conf. Ser. Mater. Sci. Eng. 2020, 881, 012170. [Google Scholar] [CrossRef]
- Alçada-Almeida, L.; Tralhao, L.; Santos, L.; Coutinho-Rodrigues, J. A Multiobjective Approach to Locate Emergency Shelters and Identify Evacuation Routes in Urban Areas. Geogr. Anal. 2009, 41, 9–29. [Google Scholar] [CrossRef]
- Sayl, K.N.; Sulaiman, S.O.; Kamel, A.H.; Muhammad, N.S.; Abdullah, J.; Al-Ansari, N. Minimizing the Impacts of Desertification in an Arid Region: A Case Study of the West Desert of Iraq. Adv. Civ. Eng. 2021, 2021, 5580286. [Google Scholar] [CrossRef]
- Melo, A.L.O.; Calijuri, M.L.; Duarte, I.C.D.; Azevedo, R.F.; Lorentz, J.F. Strategic Decision Analysis for Selection of Landfill Sites. J. Surv. Eng. 2006, 132, 83–92. [Google Scholar] [CrossRef]
- Zadeh, L.A. Fuzzy Sets. Inf. Control. 1965, 8, 338–353. [Google Scholar] [CrossRef]
- Malczewski, J. Review Article on the Use of Weighted Linear Combination Method in GIS: Common and Best Practice Approaches. Trans. GIS 2000, 4, 5–22. [Google Scholar] [CrossRef]
- Drobne, S.; Lisec, A. Multi-attribute Decision Analysis in GIS: Weighted Linear Combination and Ordered Weighted Averaging. Informatica 2009, 33, 459–474. [Google Scholar]
- Saaty, T.L. A Scaling Method for Priorities in Hierarchical Structures. J. Math. Psychol. 1977, 15, 234–281. [Google Scholar] [CrossRef]
- Hadisantono, R.D.; Andreastuti, S.; Abdurachman, E.; Sayudi, D.; Nurnusanto, I.; Martono, A. Peta Kawasan Rawan Bencana Gunungapi Merapi, Jawa Tengah dan Daerah Istimewa Yogyakarta (Volcanic Hazard Map of Merapi Volcano, Central Java and Yogyakarta Special Province); Center for Volcanology and Geological Hazard Mitigation: Bandung, Indonesia, 2002. [Google Scholar]
- Sayudi, D.S.; Nurnaning, A.; Juliani, D.J.; Muzani, M. Peta Kawasan Rawan Bencana Gunungapi Merapi, Jawa Tengah dan Daerah Istimewa Yogyakarta 2010 (Merapi Hazard Map, Central Java and Yogyakarta Special Region Provinces 2010); Pusat Vulkanologi dan Mitigasi Bencana Geologi: Bandung, Indonesia, 2010. [Google Scholar]
- Vaidya, O.S.; Kumar, S. Analytic Hierarchy Process: An Overview of Applications. Eur. J. Oper. Res. 2006, 169, 1–29. [Google Scholar] [CrossRef]
- Ahmed, A.; Mahmoud, H.; Aly, A. Site Suitability Evaluation for Sustainable Distribution of Hospital Using Spatial Information Technologies and AHP: A Case Study of Upper Egypt, Aswan City. J. Geogr. Inf. Syst. 2016, 8, 578–594. [Google Scholar] [CrossRef]
- Nappi, M.M.L.; Souza, J.C. Disaster management: Hierarchical structuring criteria for selection and location of temporary shelters. Nat. Hazards 2015, 75, 2421–2436. [Google Scholar] [CrossRef]
- Liu, Q.; Ruan, X.; Shi, P. Selection of emergency shelter sites for seismic disasters in mountainous regions: Lessons from the 2008 Wenchuan Ms 8.0 Earthquake, China. J. Asian Earth Sci. 2011, 40, 926–934. [Google Scholar] [CrossRef]
- Soltani, A.; Ardalan, A.; Boloorani, A.D.; Haghdoost, A.; Hosseinzadeh-Attar, M.J. Criteria for Site Selection of Temporary Shelters after Earthquakes: A Delphi Panel. PLoS Curr. Disasters 2015, 7. [Google Scholar] [CrossRef] [PubMed]
- Tsai, C.; Yeh, Y. The study of integrating geographic information with multi-objective decision making on allocating the appropriate refuge shelters: Using Kengting National Park as an example. Nat. Hazards 2016, 82, 2133–2147. [Google Scholar] [CrossRef]
- Kilci, F.; Kara, B.Y.; Bozkaya, B. Locating Temporary Shelter Areas after an Earthquake: A Case for Istanbul. Eur. J. Oper. Res. 2015, 242, 323–332. [Google Scholar] [CrossRef]
- Trivedi, A.; Singh, A. A hybrid multi-objective decision model for emergency shelter location-relocation projects using fuzzy analytic hierarchy process and goal programming approach. Int. J. Proj. Manag. 2017, 35, 827–840. [Google Scholar] [CrossRef]
- Trivedi, A. A multi-criteria decision approach based on DEMATEL to assess determinants of shelter site selection in disaster response. Int. J. Disaster Risk Reduct. 2018, 31, 722–728. [Google Scholar] [CrossRef]
- Geng, S.; Hou, H.; Zhang, S. Multi-Criteria Location Model of Emergency Shelters in Humanitarian Logistics. Sustainability 2020, 12, 1759. [Google Scholar] [CrossRef]
- Chanta, S.; Sangsawang, O. Shelter-Site Selection During Flood Disaster. Lect. Notes Manag. Sci. 2012, 4, 282–288. [Google Scholar]


Disclaimer/Publisher’s Note: The statements, opinions and data contained in all publications are solely those of the individual author(s) and contributor(s) and not of MDPI and/or the editor(s). MDPI and/or the editor(s) disclaim responsibility for any injury to people or property resulting from any ideas, methods, instructions or products referred to in the content. |
© 2023 by the authors. Licensee MDPI, Basel, Switzerland. This article is an open access article distributed under the terms and conditions of the Creative Commons Attribution (CC BY) license (https://creativecommons.org/licenses/by/4.0/).