1. Introduction
Since China’s reform and opening up, the economic aggregate of China has been growing at high speed, and urban spatial agglomeration is in a stage of rapid development. The difference in development scale among the cities leads to the intensification of the imbalance of regional development, and the research on urban radiation can provide a new idea for coordinated development among the cities [
1]. Urban radiation refers to a city’s comprehensive influence and driving force on the surrounding area and town [
2]. Under the joint action of social, economic, political, and cultural factors, the city can effectively drive and promote the development of the surrounding cities in the maximum area, which is called the radiation scope of the city [
3]. The radiation scope of a city is a complex regional socio-economic system reflecting the interaction between cities and regions [
4].
The reasonable determination of the spatial scope of urban radiation in a region is an essential basis for the formulation of the overall development strategy of the area, and it is also a prerequisite for the coordination of the interrelationship between the cities in the region [
5]. The city is in the process of constant development and change. With the continuous enhancement of the comprehensive strength of the city, the urban radiation force increases, and the influence scope of the city will also change. Therefore, studying the evolution of urban radiation patterns has important practical significance for promoting the coordinated development of the region in terms of the society and economy.
As a result, research on urban radiation has emerged, mainly including studies on the structure of the urban system [
6,
7], the pattern of the urban economic impact zone [
8,
9], and the scope of the urban hinterland [
10,
11]. In terms of research scale, the researchers paid more attention to large-scale areas such as the country [
12], the urban agglomerations [
13], and the metropolitan regions [
14], but with the deepening of the research, some scholars began to focus on smaller-scale areas such as provincial and municipal areas [
15,
16,
17]. In terms of the research methods, the research on urban radiation has changed from qualitative to quantitative; among these methods, the retail gravity model proposed by Reilly [
18] and the breaking point model presented by Converse [
19] are classic.
In the context of the widespread application of RS and GIS technology, scholars began to use spatial analysis methods, such as the field strength model [
20], accessibility [
21], the Voronoi diagram (V-graph), and the improved weighted V-graph model [
22] to study urban radiation patterns. These research methods greatly enrich urban radiation influence area division theory and practice. On this basis, some scholars combined the urban breaking point theory with the weighted V-graph to propose the extended breaking point theory, which extends the simple concept of breaking point to a “breaking arc” [
23], which could more scientifically and reasonably clarify the spatial pattern of urban radiation. Okabe and Sadahiro proposed a method for organizing multi-level spatial data based on a V-graph [
24]; this is called a hierarchical V-graph and is a multi-level division of spatial areas in the form of a tree. As an extension of the hierarchical V-graph, a hierarchical weighted V-graph is a method for dividing multi-level space under the premise of considering the weight of parent points [
25].
The Yangtze River Delta (YRD) region is an important growth pole driving China’s economic development. This paper takes 41 prefecture-level cities in the YRD region as the research object, hoping that the research results will help deepen the regional integration development of the YRD region and provide practical reference for the development of other regions. Regarding the integration development of the YRD region, the construction and exploration of the metropolitan areas have vital strategic value. As an important resource allocation platform, metropolitan areas can fully integrate the resources inside and outside the region, which is conducive to accelerating the speed and quality of regional development in the YRD region. Based on this, firstly, this paper measures the intensity of city centrality (ICC) according to the comprehensive strength of the city (CSC). Secondly, the extended breaking point model is used to study the spatial extent and type of urban radiation expansion from the single-layer level. Finally, the paper analyzes the characteristics of the multi-center circle structure from multiple levels and judges the coincidence with the current planning scope of each metropolitan area. Thus, it provides a theoretical basis for the further promotion of the integration development process of the YRD region and the planning and development direction of the future metropolitan area.
2. Materials and Methods
2.1. Overview of Study Area
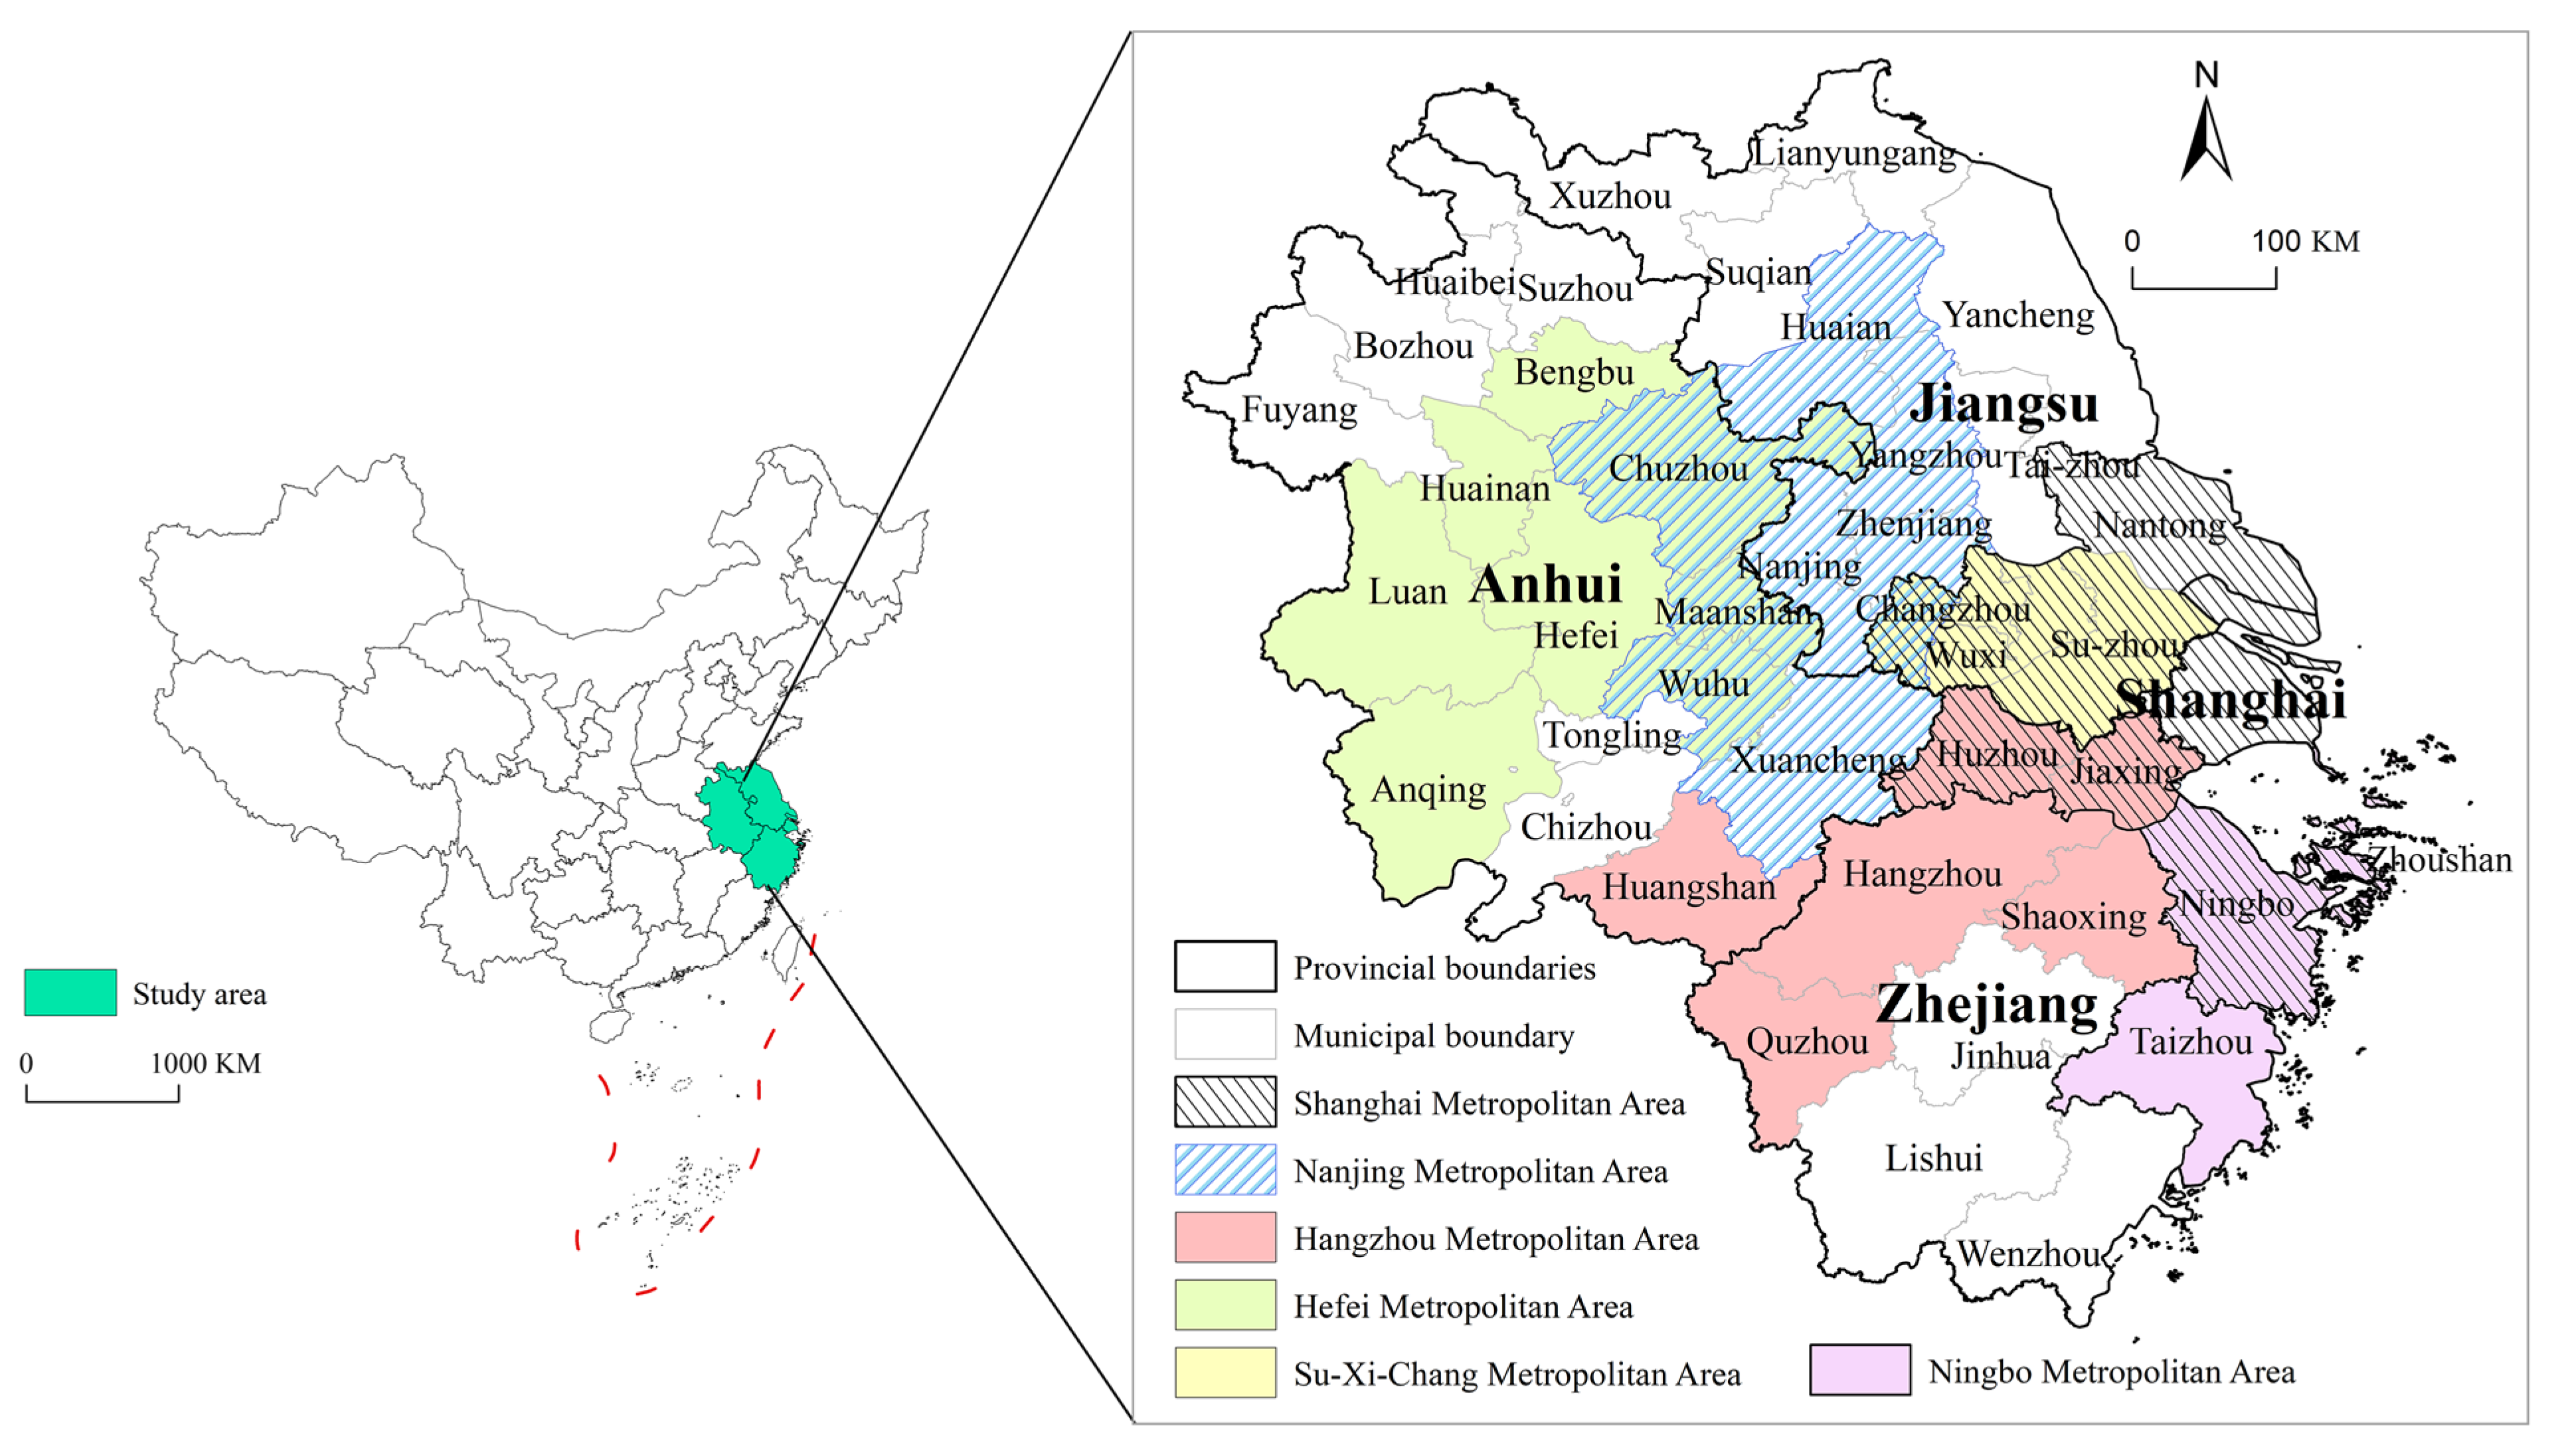
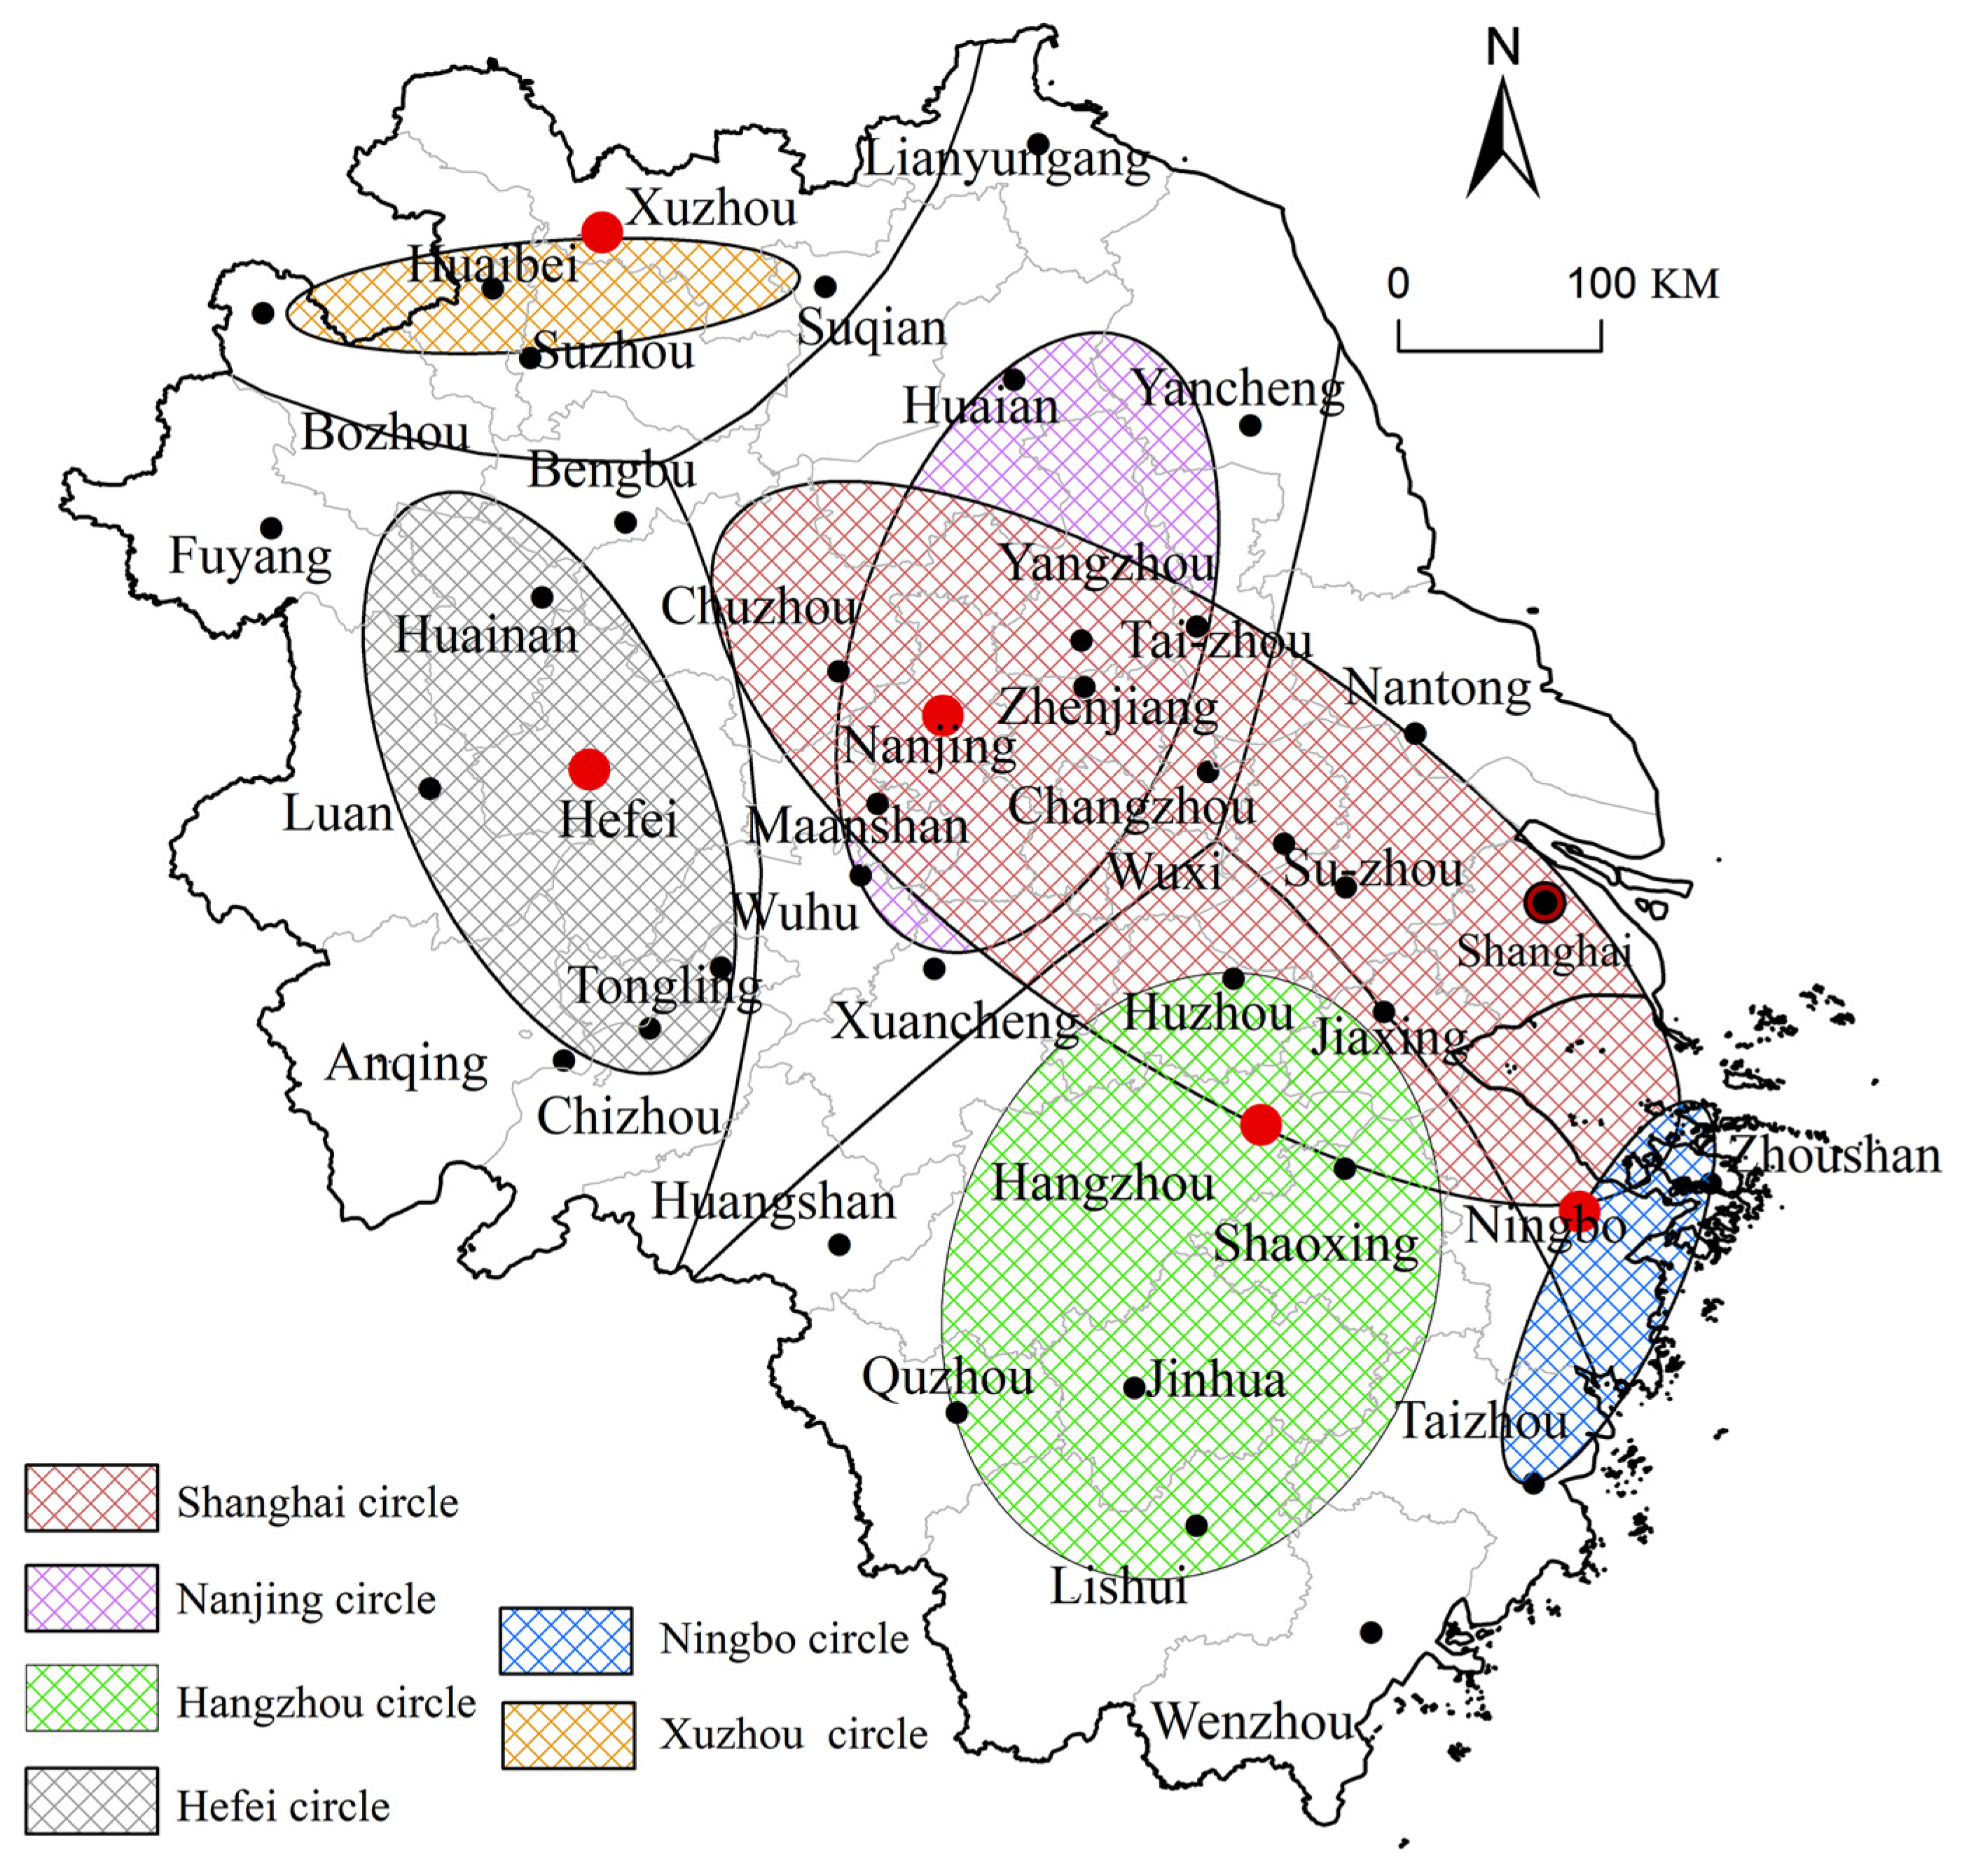
The Yangtze River Delta (YRD) region is located along the east coast of China, spanning 114°54′–123°25′ E longitude and 27°02′–35°20′ N latitude. The YRD region is not only an essential part of the plain in the middle and lower reaches of the Yangtze River but also the region with the fastest economic development rate and an enormous economic aggregate scale in China. According to the Outline of the Plan for the Integrated Development of the Yangtze River Delta, released in 2019, the YRD region includes Shanghai and all the cities in Jiangsu, Zhejiang, and Anhui provinces, and there is a total of 41 cities at the prefecture level. The YRD region plays an essential strategic role in China’s modernization construction and all-round opening-up and is an important engine driving China’s high-quality development [
26]. There are six metropolitan areas in the YRD region: the Shanghai metropolitan area, the Nanjing metropolitan area, the Hangzhou metropolitan area, the Hefei metropolitan area, the Suzhou-Wuxi-Changzhou metropolitan area, and the Ningbo metropolitan area, each of which includes member cities, as shown in
Figure 1.
The member cities of the Shanghai metropolitan area are derived from the Shanghai Metropolitan Area Spatial Collaborative Planning. The member cities of the Nanjing metropolitan area are derived from the Development Plan of the Nanjing Metropolitan Area. The member cities of the Hangzhou metropolitan area are derived from Hangzhou Metropolitan Area Development Report (2020). The member cities of the Hefei metropolitan area are derived from the Notice on Agreeing to Bengbu City as a Whole to Join the Hefei Metropolitan Area. The member cities of the Ningbo metropolitan area and the Suzhou-Wuxi-Changzhou metropolitan area are derived from the Yangtze River Delta Urban Agglomeration Development Plan.
2.2. Index System
The intensity of city centrality (ICC) refers to the relative importance of the city to the services of the other cities in the region [
27], which affects the size of the urban radiation scope. In this paper, the comprehensive strength of the city (CSC) is used to represent the ICC [
28]. A city is a concentrated expression of material, cultural, and institutional development, and the CSC is a comprehensive evaluation of the internal strength and external radiation of a city’s material and spiritual strength. On the one hand, the assessment lies in the city’s hard power, including the city’s scale, economic stability, and infrastructure, which can reflect the material quality of life of the urban residents and the material basis of urban development. On the other hand, the soft power of cities, including intangible resources such as culture, institutions, policies, and citizen qualities [
29], can reflect the source power of internal urban development.
To obtain a full appreciation of the comprehensive influence and radiating driving force of the city on the surrounding areas in a certain region, this paper constructs a CSC evaluation index system of the city from multiple angles and at multiple levels based on complying with the principles of data accessibility, timeliness, and pertinence. Combined with the actual characteristics of the YRD region, the relevant evaluation indexes of the urban soft power are added based on previous studies [
5,
30] to construct the CSC evaluation index system of the YRD region (
Table 1).
It should be noted that the urban administrative level is assigned according to the administrative level of the city. The administrative levels, in descending order, are a municipality directly under the central government, a sub-provincial city, and a prefecture-level city. Due to the importance and particularity of some cities, there will be a phenomenon of “high allocation”, in which the leadership position level is higher than the administrative level of the city. The evaluation of urban administrative status is based on the leadership position level system of the city, that is, whether the provincial leader concurrently holds the position of municipal party secretary. The strategic position of a city depends on whether it is the core city of the metropolitan area.
The research data mainly come from the Statistical Yearbook of Chinese Cities (2021), the Shanghai Statistical Yearbook, the Jiangsu Statistical Yearbook, the Zhejiang Statistical Yearbook, the Anhui Statistical Yearbook, the Cultural and Tourism Development Statistical Bulletin, and other individual missing data supplemented through interpolation. This paper uses ArcGIS, Photoshop, SPSS, Excel, and other software for statistical calculation, spatial analysis, and the expression of the original data.
2.3. Methods
2.3.1. Extended Breaking Point Model
The breaking point theory proposed by Converse, based on Reilly’s retail gravity model, takes city size as the criterion by which to measure city attractiveness. He believes that the attraction of a city to the surrounding area is proportional to the size of the city and inversely proportional to the square of the distance between the two cities and defines the point where the attraction between two cities reaches a balance as the breaking point [
31]. The calculation formula is as follows,
where
are the distances from the breaking point to city
and the breaking point to city
;
is the distance between city
and city
; and
are the scales of city
and city
. Formula (1) can simplify the transformation to obtain the following formula:
Dirichlet defined the Voronoi graph (V-graph) in 1850, supposing that
is a set of points on the same plane,
, where any two points are not collinear and any four points are not collinear. Then the V-diagram of
can be defined as:
where
represents the Euclidean distance, and
is a convex polygon.
The weighted V-graph is an improvement of the conventional V-graph, which is suitable for space division with different central point weights, and its calculation formula is as follows,
where
represents an arbitrary point;
is
points on a two-dimensional Euclidean space; and
is the given
positive real numbers. The plane is divided into
parts, and the plane segment determined by
is called a weighted V-graph.
is the weight of
.
Some scholars have obtained necessary inferences from the in-depth exploration of the breakpoint model when in the homogeneous plane area; the radiation range of all the urban points constitutes a weighted V-graph, and the weight of each urban point is equal to the square root of their respective ICC [
32,
33]. Based on this inference, the ICC is used as the key parameter of the extended fracture point model, and the value of centrality strength is assigned to Formula (4). The extended breaking point model is a combination of the breaking point model and the weighted V-graph, which can overcome the disadvantage that the breaking point model can only describe a single breaking point and reasonably divide the actual radiation range of the study area [
34].
2.3.2. Hierarchical Weighted V-Graph
On the premise that each point representing a city has ordinal scale attribute data, the local center is defined, firstly, as energy greater than or equal to any adjacent weighted V-graph attribute data. Secondly, the urban centers of all the spatial data points in the study area (namely, the lowest level) are selected as the optional point set, and the second-level local centers are chosen. Taking the second-level local center as an alternative point set, the regional centers of the next higher level are extracted in the same way. Repeat the above process until there is only one point left: the first level of the central city; the remaining city points are the second level, the third level, and so on in descending order.
This approach can be visualized as a continuous search for higher levels of “peaks” or “highlands” in a region [
35].
2.3.3. Fractal Dimension
Fractal theory is a significant method to measure the complex characteristics of regional spatial morphology [
36]. This paper uses the morphological dimension, the spatial structure stability index, and the standard deviation ellipse to study the polycentric circle structure in the YRD region.
Firstly, the morphological dimension is used to describe the complexity and stability of urban radiation space morphology [
37,
38], and the morphological extent is used to characterize the tortuous degree of the boundary of the urban radiation range. The calculation formula is as follows,
where
represents the area of urban external radiation space in the YRD region,
is the perimeter of the same radiated spatial range,
is the intercept term, and
is the morphological dimension, and its value is generally between 1 and 2. The complexity of urban radiation spatial morphology increases with the
value.
indicates that the spatial form of urban radiation is in a random state similar to Brownian motion. When the value of
approaches 1.5, the urban radiation form is more unstable [
39].
Secondly, the stability index of the spatial structure is used to test the stability of the urban radiation form, and its calculation formula is as follows,
The larger the stability index
, the more stable the spatial form of urban radiation [
15].
Finally, the primary distribution directions of the city nodes are judged by the long axis of the standard deviational ellipse (SDE) [
40,
41,
42]. The SDE is a standard method to analyze the discrete distribution characteristics of the datasets by realizing the interpretation of the overall center of gravity distribution and the direct distribution of the point pattern.
3. Characteristics of ICC in the YRD Region
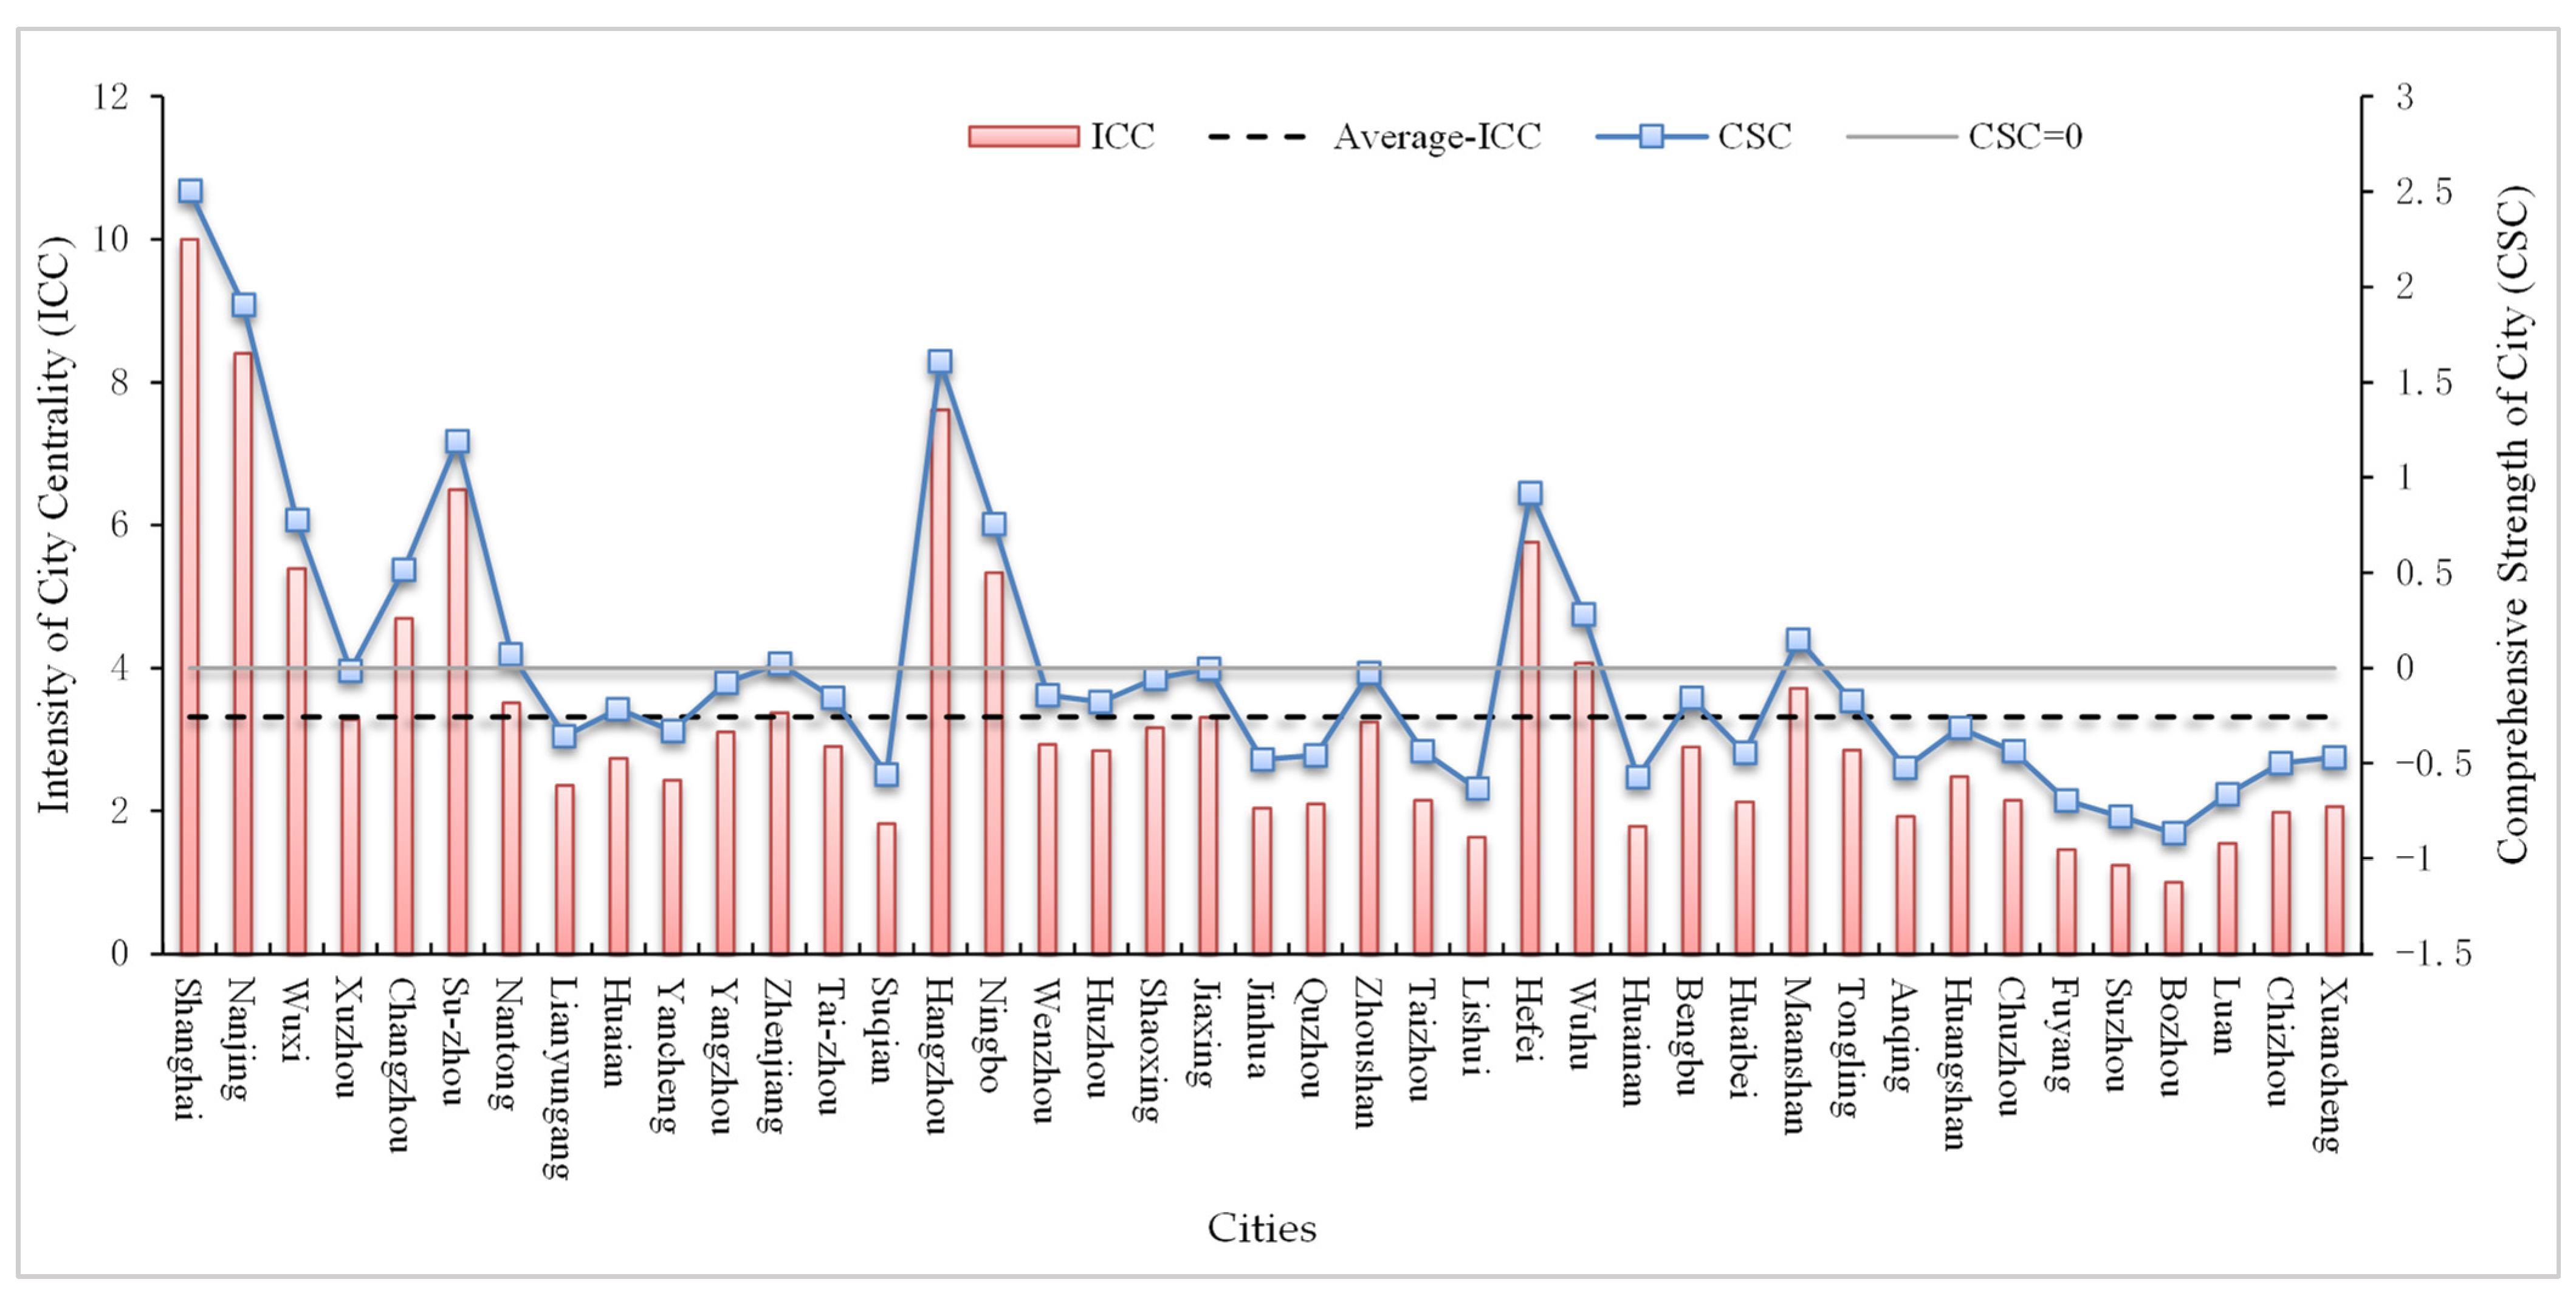
With the help of SPSS software, the CSC of 41 prefecture-level cities in the YRD region was calculated using the principal component analysis. Because some scores of the CSC are negative, it is not conducive to calculating the extended breaking point model. Therefore, under the premise of ensuring that the same order of the original data is unchanged, the min-max specification method is adopted to convert all of them into positive values (
Figure 2).
In
Figure 2, the broken line chart represents the value of the CSC, while the bar chart represents the value of the ICC. The larger the two values are, the stronger the comprehensive strength and the more prominent the centrality of the city. From the positive and negative CSC scores, there are six cities in Jiangsu Province with positive scores, accounting for 46.15%, while Zhejiang Province and Anhui Province accounted for 18.18% and 18.75%, respectively. The overall level of urban development in Jiangsu Province is significantly better than that in Zhejiang and Anhui provinces. According to the ranking of the ICC scores, the top 10 cities in the YRD region include Shanghai, Nanjing, Suzhou, Hangzhou, Ningbo, Hefei, Wuhu, and Ma’anshan. At the same time, Anhui Province accounts for 70 percent of the cities in the bottom 10. In terms of the mean level of ICC, the average ICC in the YRD region is 3.314, and the average ICC in Jiangsu Province is 3.884, which is higher than the regional average. The mean values of the Zhejiang and Anhui provinces are 3.304 and 2.440, respectively, which are lower than the overall provincial average level. In order from high to low, the average level of ICC in the provinces was: Jiangsu Province, Zhejiang Province, and Anhui Province.
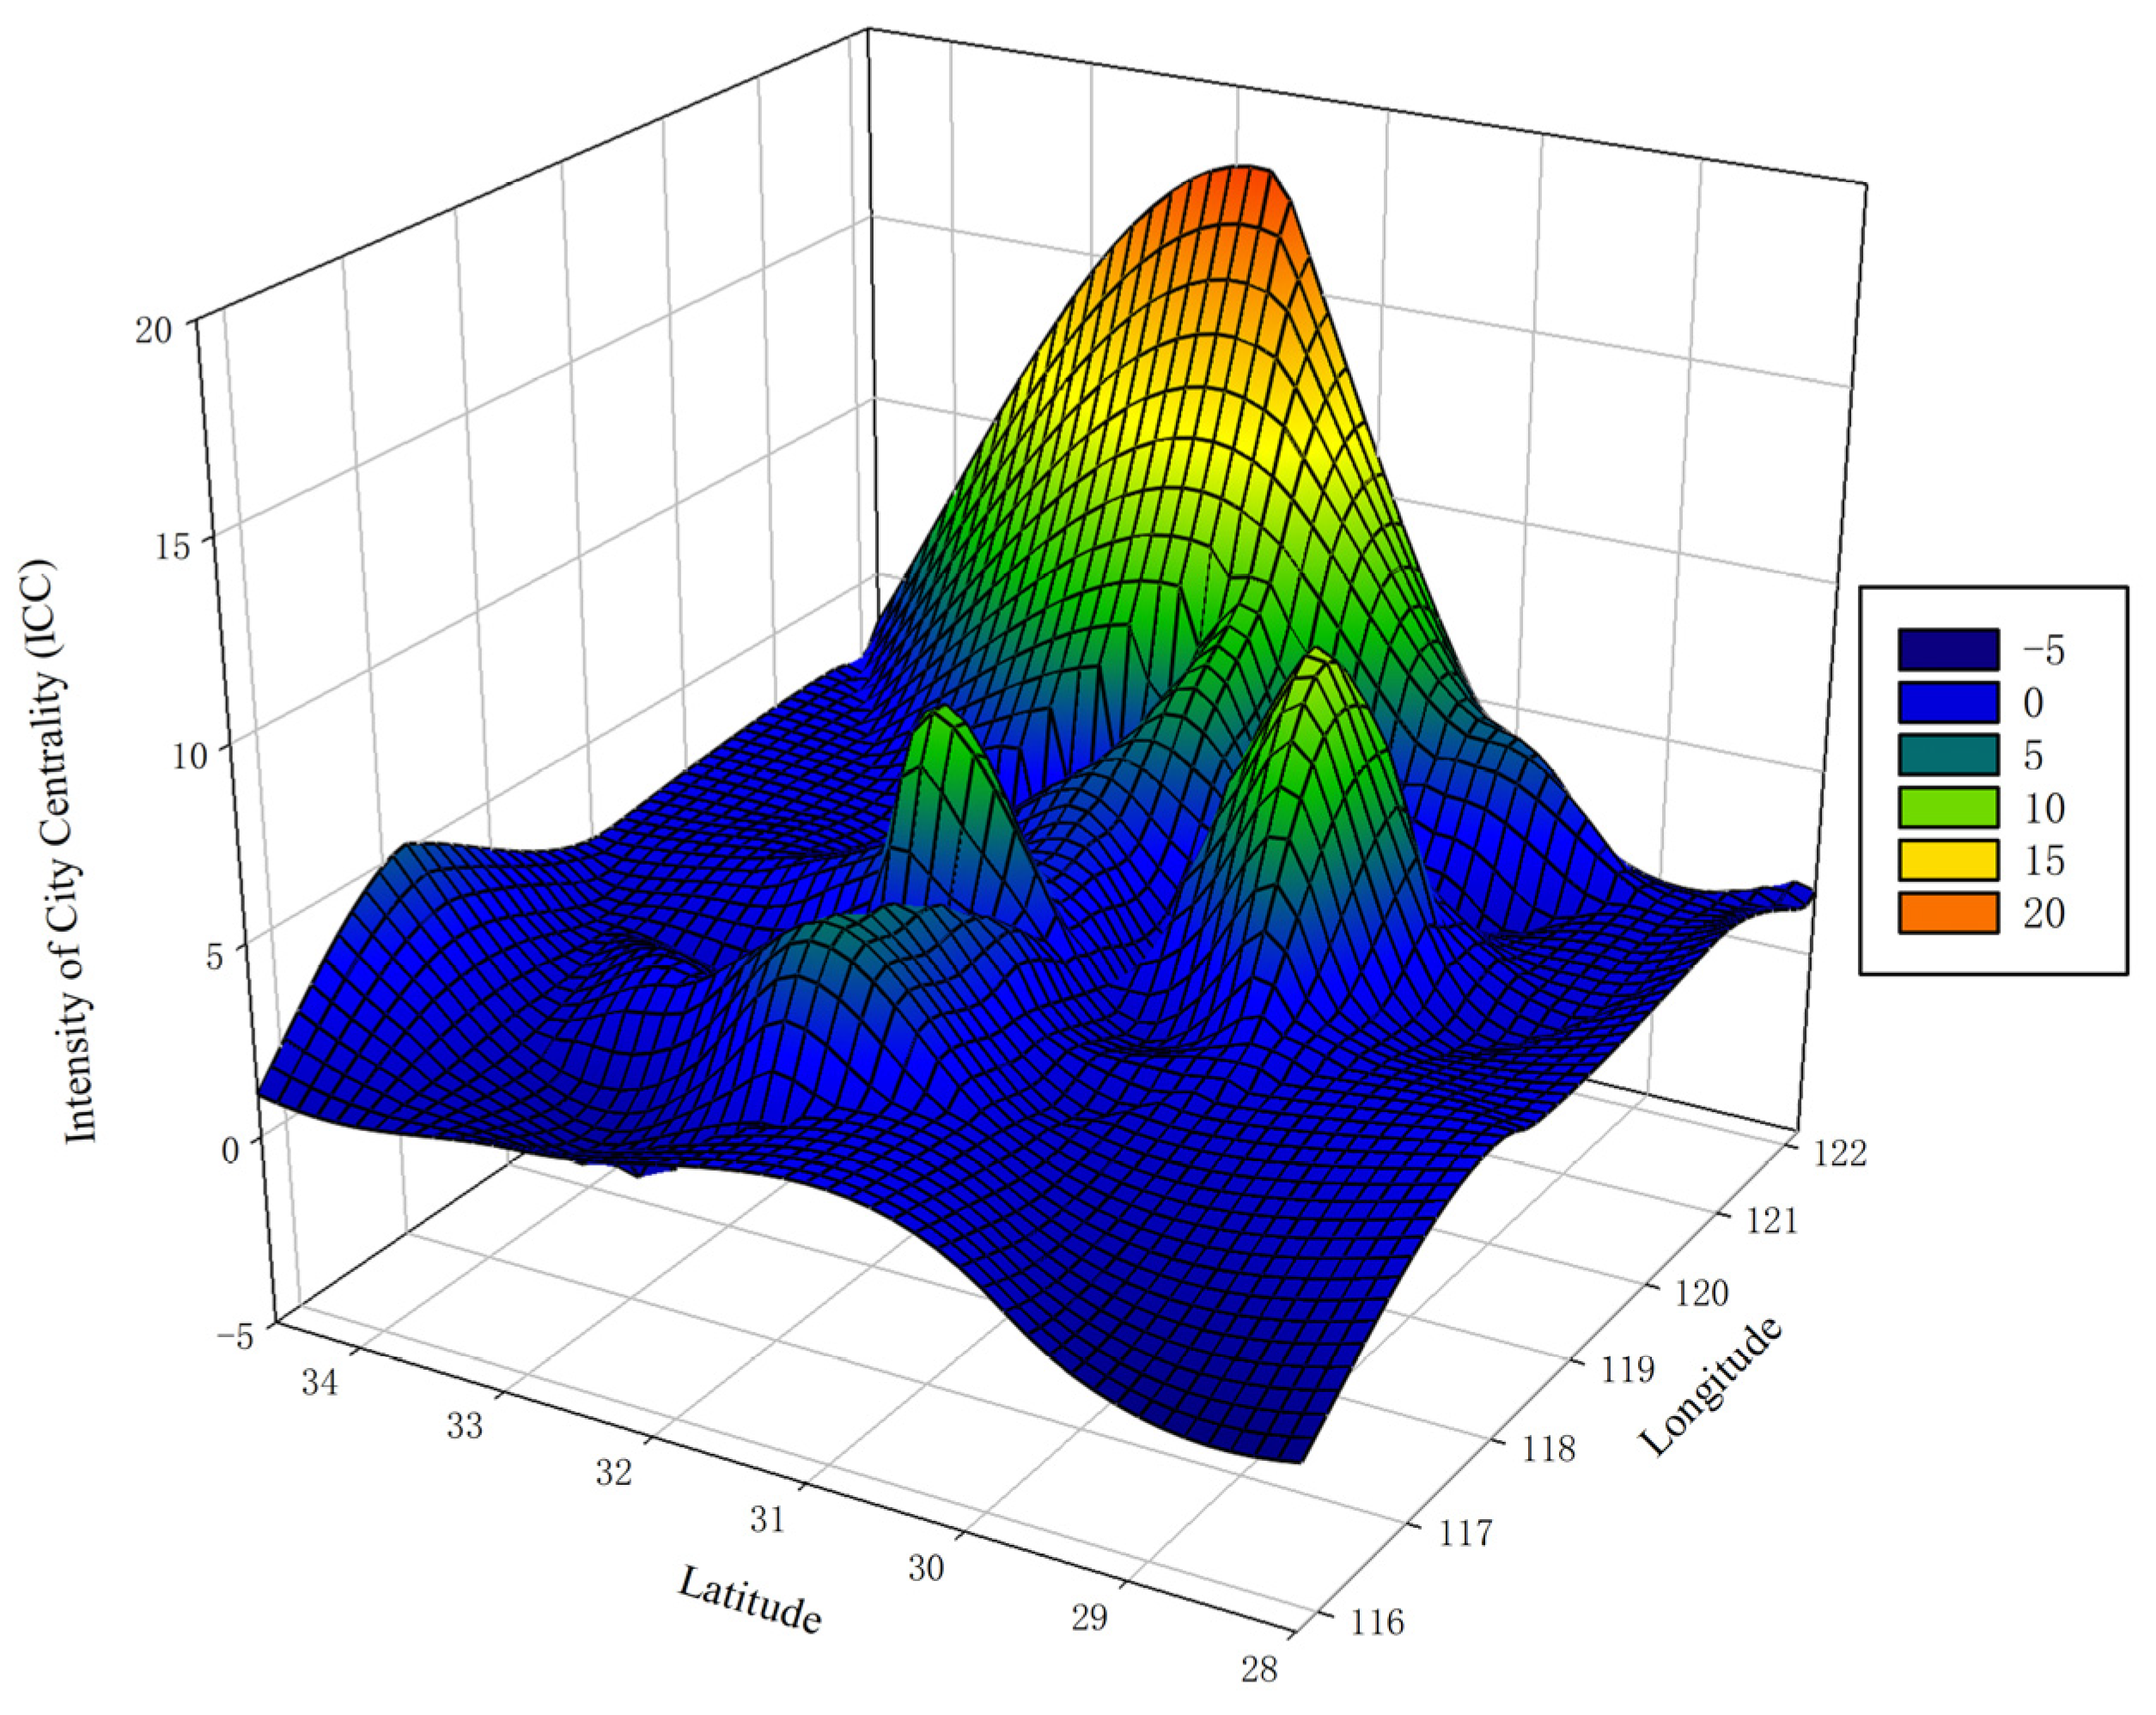
To further understand the spatial pattern of ICC in the YRD region, this paper uses Sigma Plot12.5 for visual analysis (
Figure 3). The figure shows that the ICC in the YRD region generally presents a spatial differentiation pattern of “high in the east and low in the west, high in the middle and low in the north and south”. Specifically, the cities with high ICC are mainly located near the east–west axis of the YRD region, including Shanghai, Suzhou, Nanjing, Hangzhou, Ningbo, and Hefei. In contrast, the cities with low ICC are mainly located in the periphery of the YRD region, including northern Jiangsu, southern Zhejiang, and northern and southern Anhui. The spatial pattern of ICC in the three provinces is different; Jiangsu Province shows a pattern of “high in the south and low in the north” on the whole, and Suzhou, Wuxi, Changzhou, and Nanjing in the south of Jiangsu form high-ICC agglomeration areas. Zhejiang Province is high in the north and low in the south, with Hangzhou and Ningbo as the center of the high-value area. Anhui Province takes Hefei as the single high-value center, high in the middle and low in the north and south. Compared with Jiangsu and Zhejiang provinces, which have many high-value centers, the overall urban centrality of Anhui Province is weak, and it is the province with the most low-ICC cities in the YRD region.
4. Urban Radiation Pattern in the YRD Region
4.1. The Spatial Extent of Urban Radiation
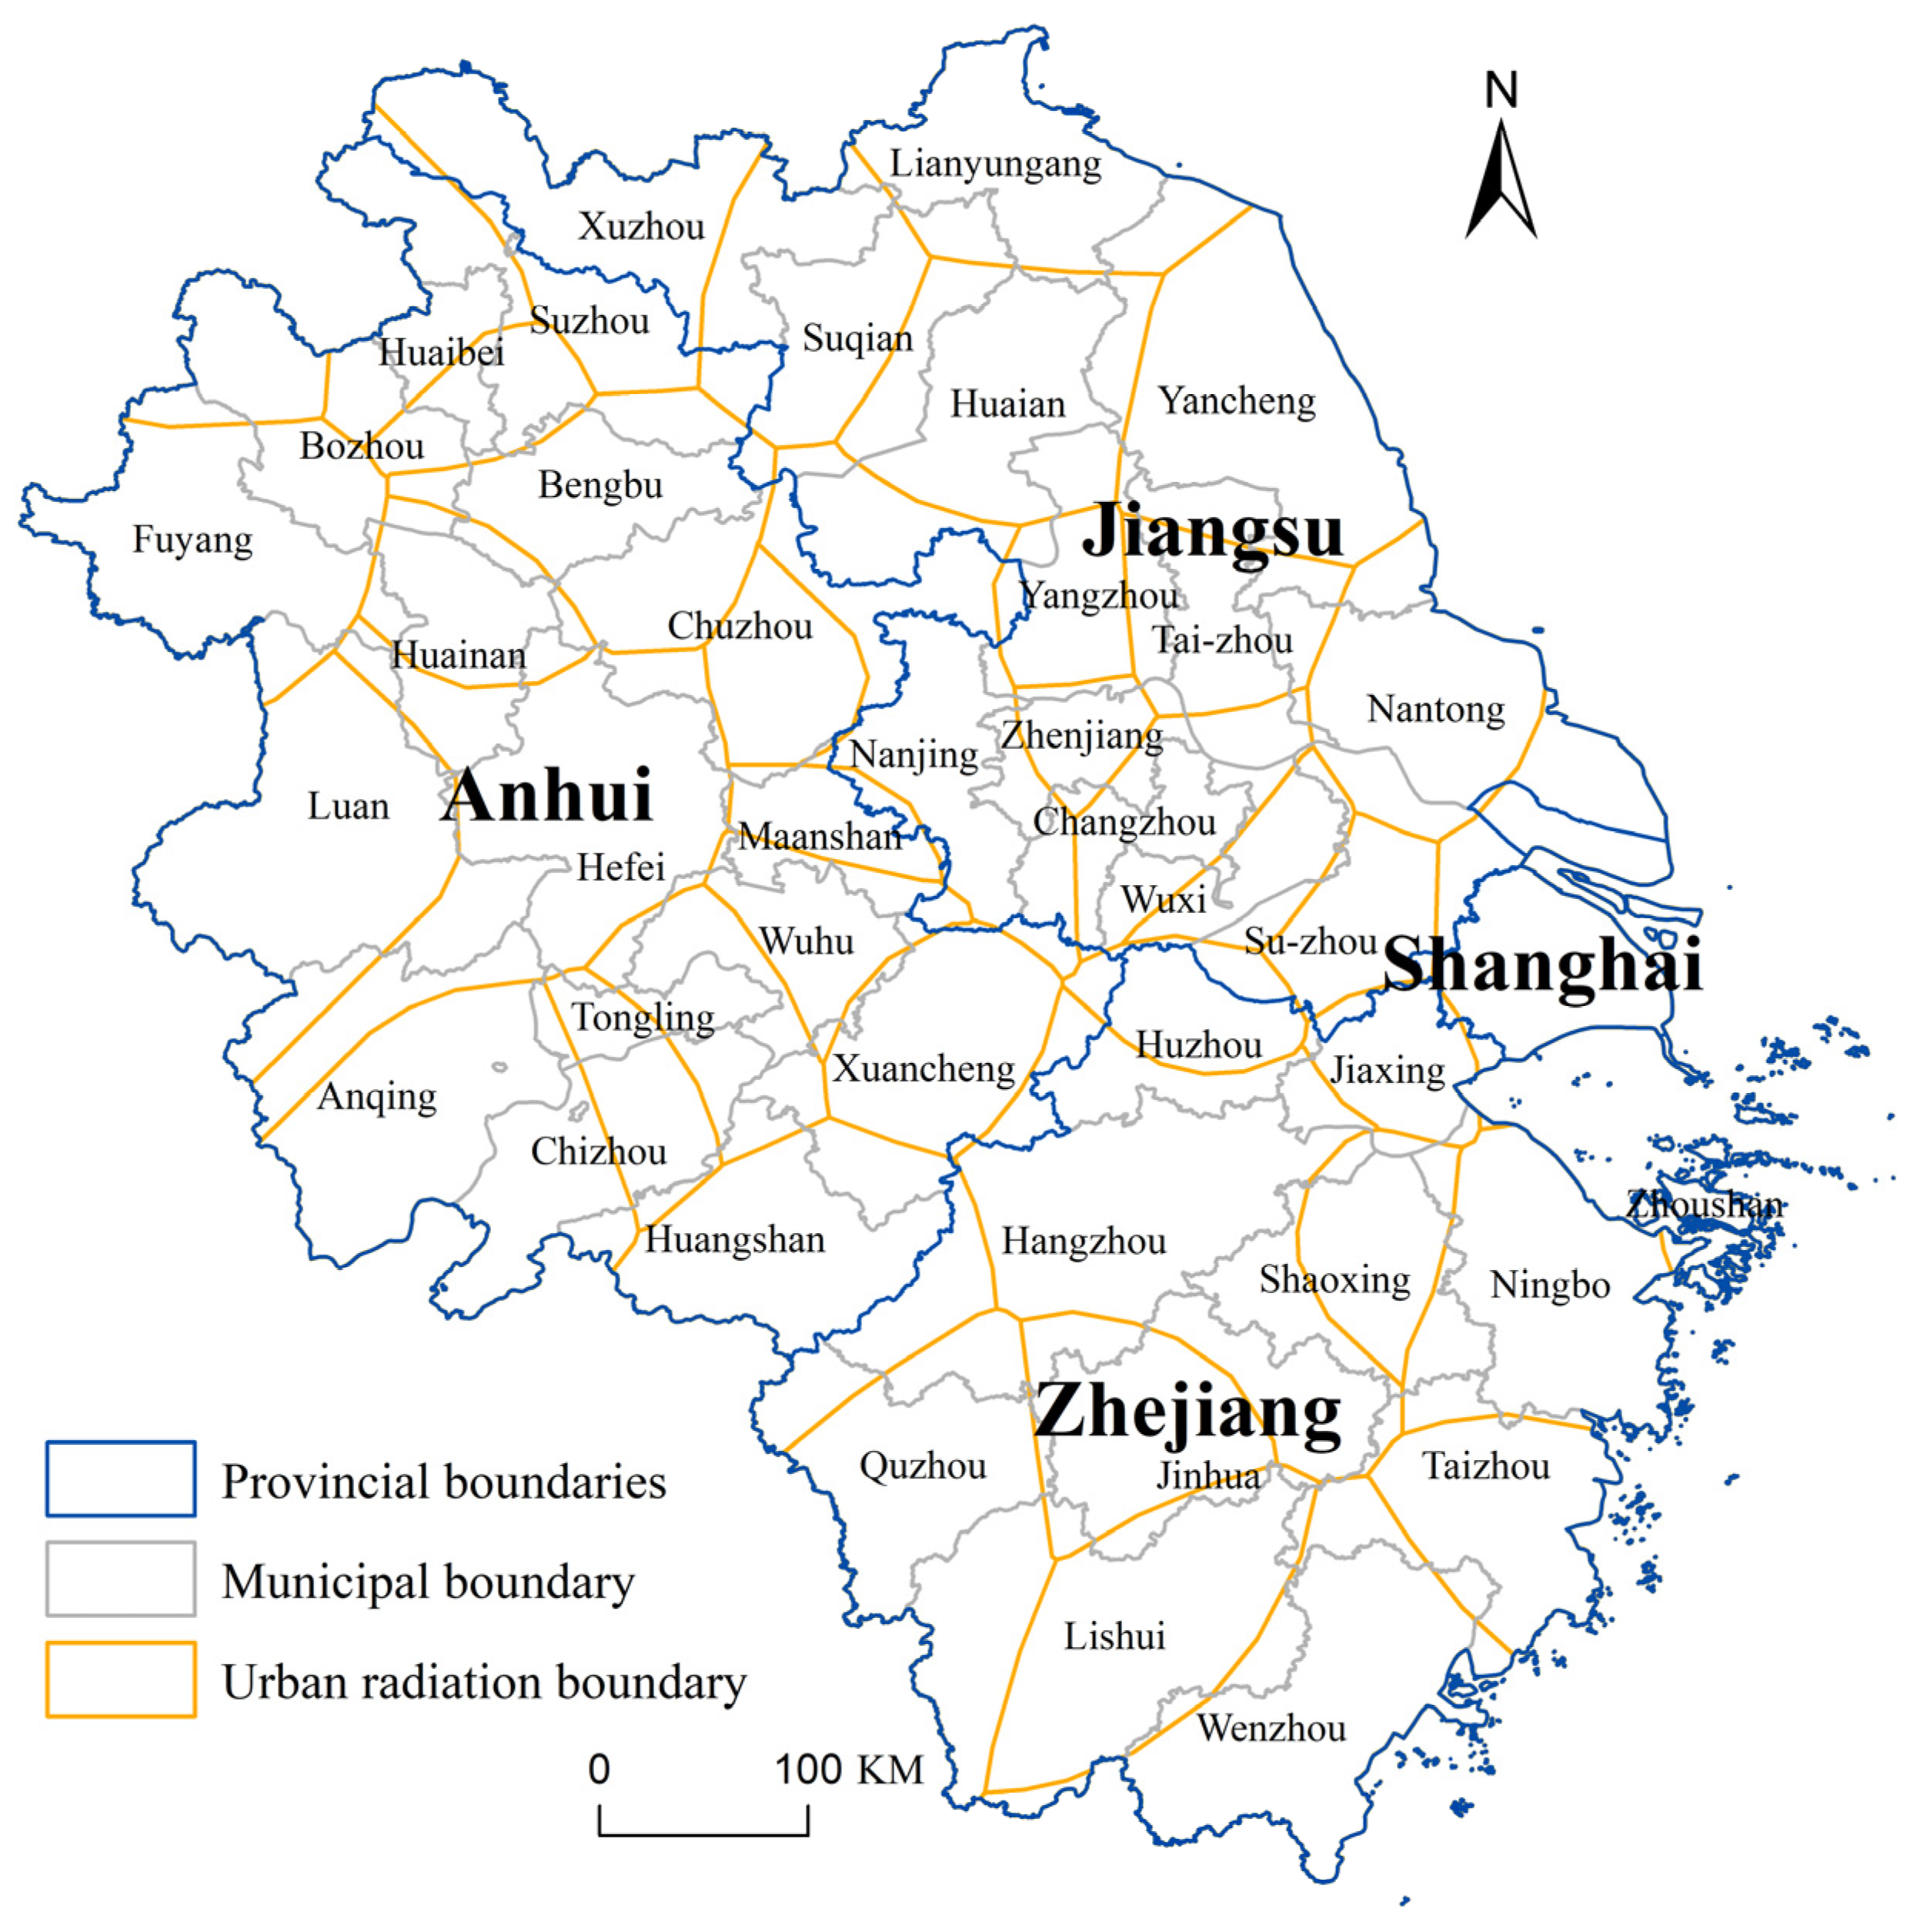
According to the calculation results of the ICC of each prefecture-level city in the YRD region, the geographical coordinate location of the city is set as the vertex, and the value of the ICC is assigned as the vertex weight. They use the weighted Voronoi diagram extension module of ArcGIS to process the weighted V-graph. The radiation scope of 41 municipal districts in 2020 can be visualized (
Figure 4), and the radiation coverage area of each municipality in the study area is obtained based on the weighted V-graph.
In terms of the spatial radiation range of the high-ICC and low-ICC cities, the cities with high-ICC located near the east–west central axis of the region show strong competition, and most cities choose to radiate and expand to neighboring cities with weak development levels based on obeying the direction of their administrative jurisdiction extension. The cities in the south of Jiangsu Province and Shanghai are typical of the contiguous areas of high-ICC values in the YRD region, and the urban spatial radiation direction of Shanghai, Nanjing, Suzhou, Wuxi, and Changzhou is mainly extended from north to south. The cities in the low-ICC agglomeration areas are easily affected by the radiation of the surrounding cities, and their urban radiation directions show disorder. There are many cities with low ICC in the northwest of Anhui Province, among which Huaibei, Suzhou, and Bozhou are affected by the spatial radiation of the surrounding cities, and their radiation extension direction is not consistent with the extension direction of the original administrative jurisdiction of the city.
Judging from the urban radiation situation of the three provinces, the urban radiation spatial scope of Jiangsu and Zhejiang provinces is more significant than that of Anhui Province. Nanjing has the broadest radiation range in Jiangsu Province, which covers many cities, such as Changzhou, Zhenjiang, Yangzhou, Huai’an, Suqian, Xuancheng, Ma’anshan, and Chuzhou. Nanjing, the provincial capital, has significant advantages over surrounding cities regarding economic strength, transportation infrastructure, and social welfare. Zhenjiang is the city with the smallest radiation area in Jiangsu Province. As the city with the smallest administrative area in the province, its comprehensive development level is not high; so, it is in a relatively inferior position in the competition, which is squeezed by the radiation of Nanjing and Changzhou. Hangzhou is the city with the largest radiation area in Zhejiang Province and even the YRD region, and its radiation range involves Huzhou, Jiaxing, Shaoxing, Jinhua, and Xuancheng. Huzhou and Jiaxing are affected by the radiation of the high-ICC cities on the north and south sides, and the leading radiation direction of Huzhou and Jiaxing tends to be closer to the east–west direction. Under the influence of Hangzhou and Ningbo, the radiation range of Shaoxing extends mainly in the north–south direction. Hefei, the capital of Anhui Province, radiates into the northwest and southwest. Most of the urban radiation range forms in the south and north of Anhui Province differ from their administrative ranges.
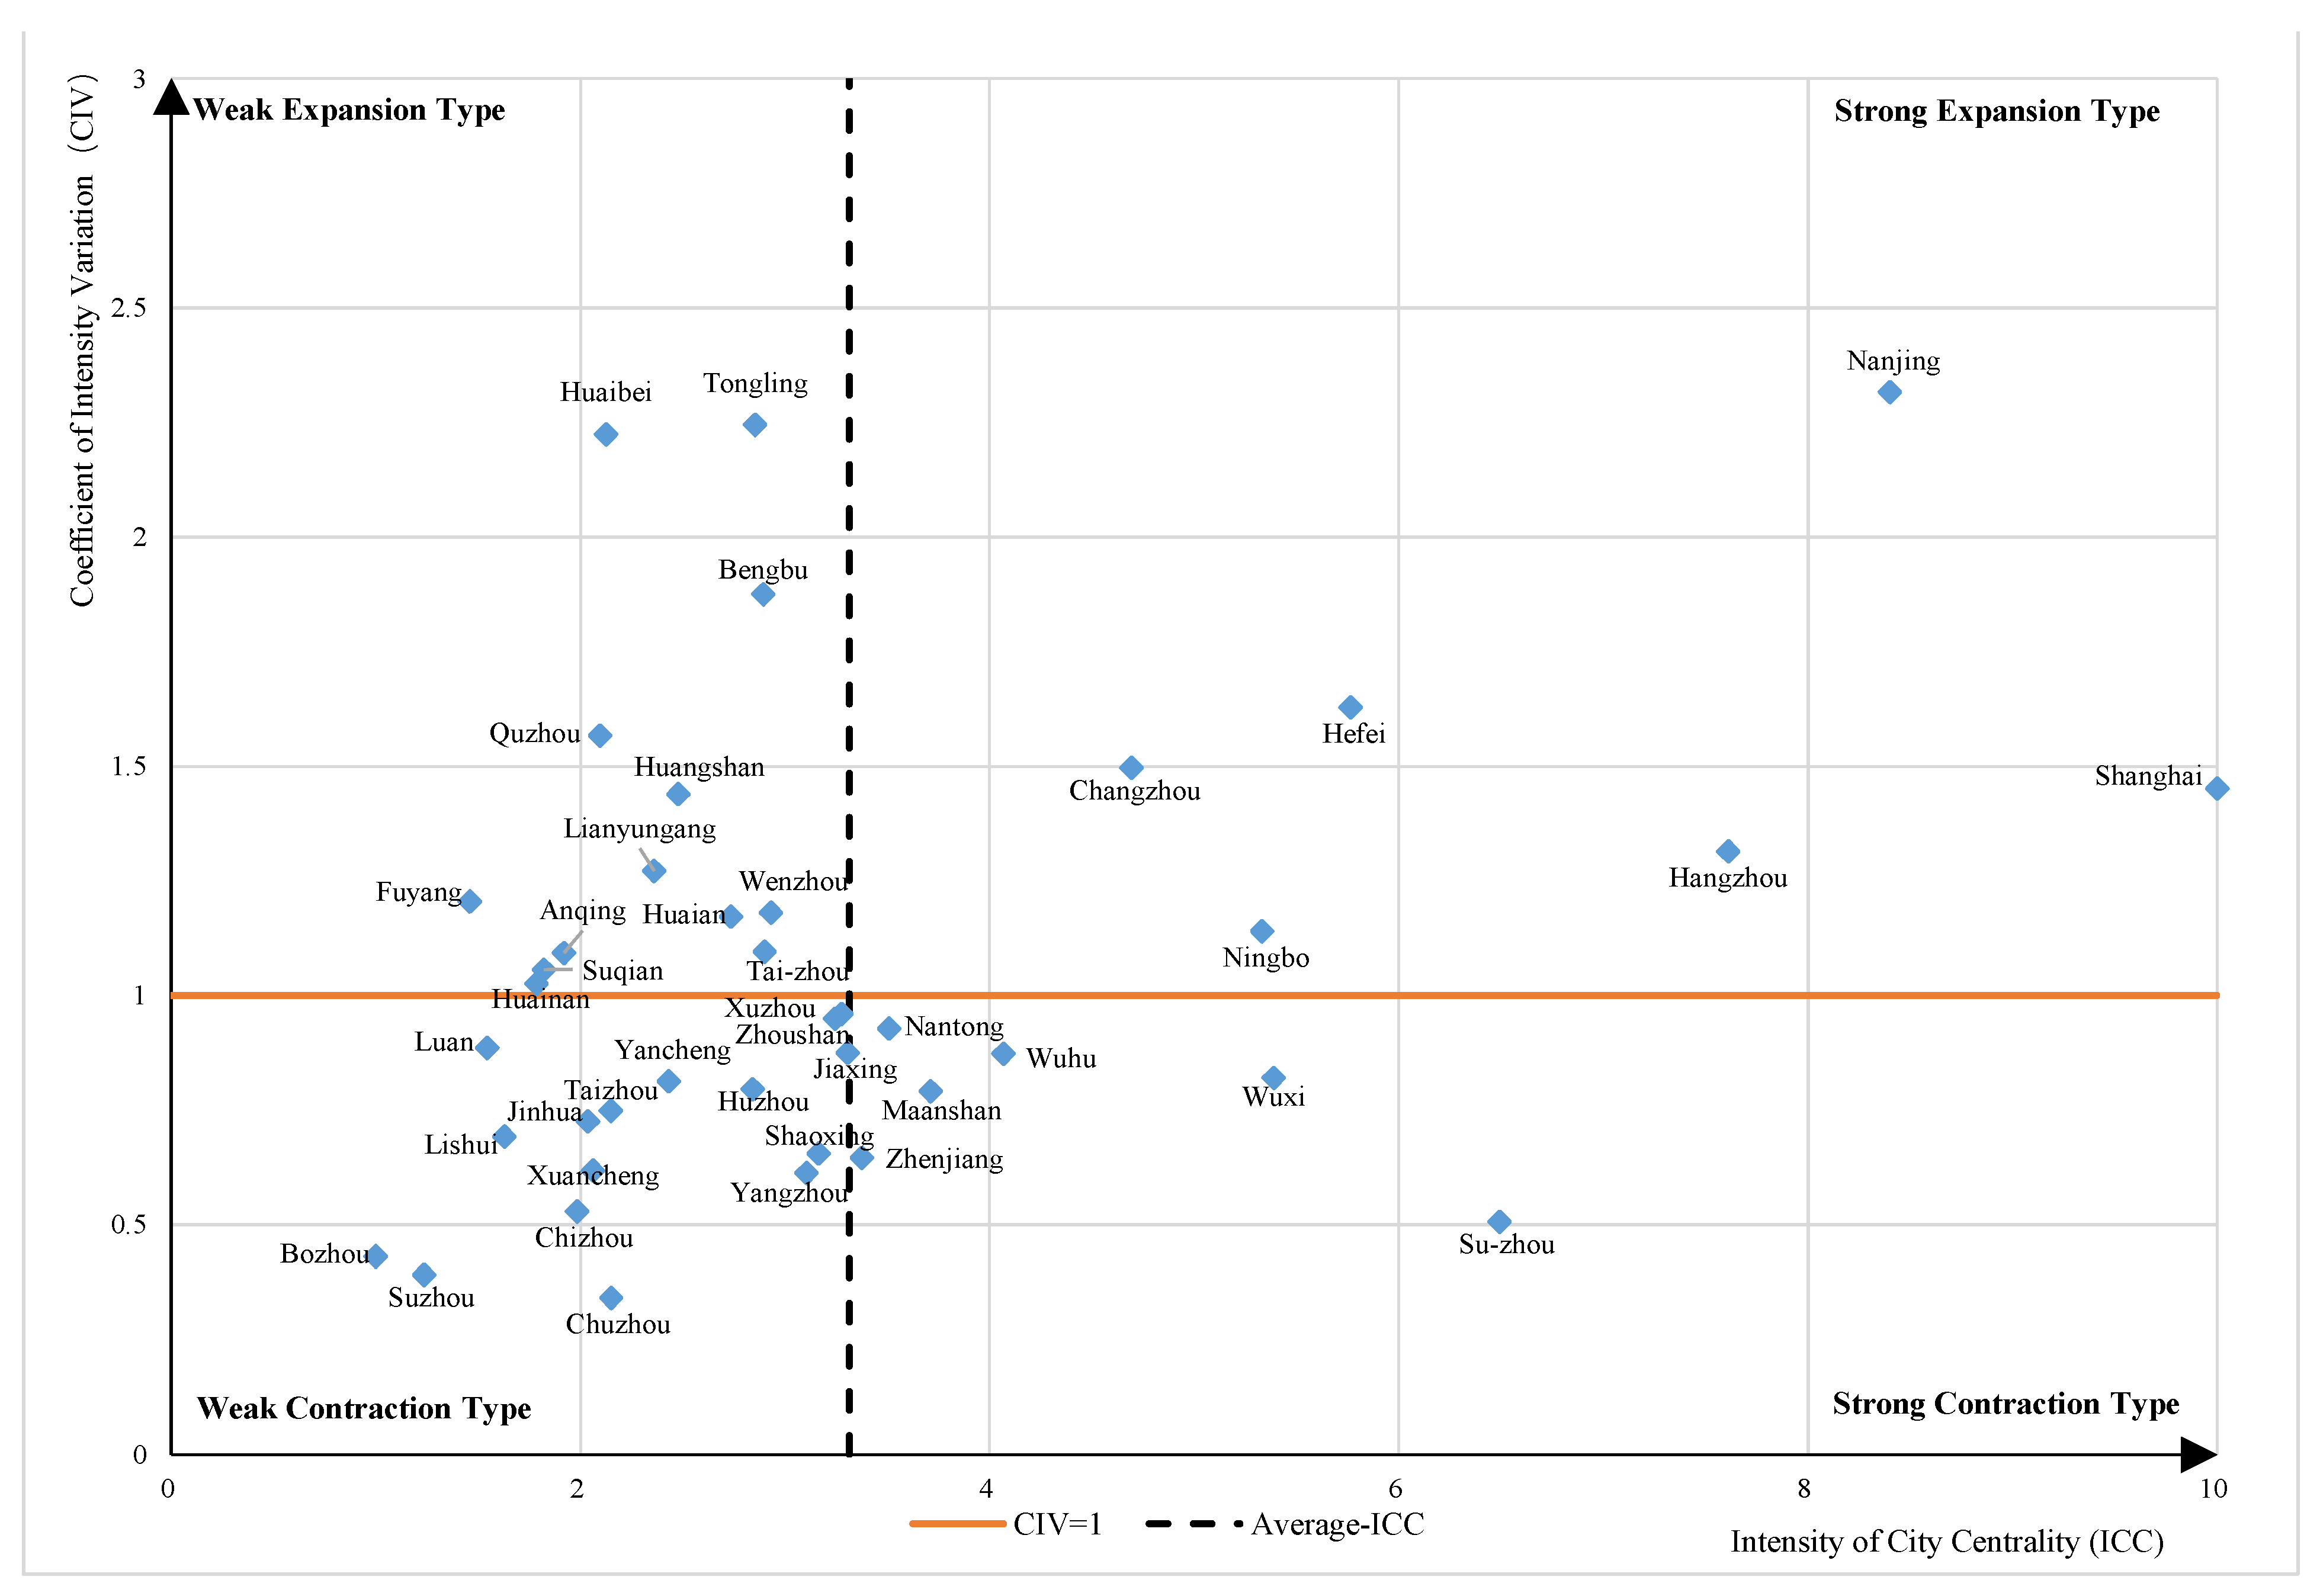
4.2. Type of Urban Radiaton Space Expansion
The ratio of the urban radiation area in the study area to the administrative area is defined as the coefficient of intensity variation (CIV). If the CIV is greater than 1, it is classified as expansion type, and if it is less than 1, it is classified as contraction type [
33]. In addition, the average ICC is taken as the measurement standard to further classify the types of urban radiation space expansion as strong or weak. The radiation area of the expanding city is larger than the administrative area. Cities with substantial expansion types have a higher than average ICC and an external solid radiation ability. Cities with weak expansion types have lower than average ICC, and the overall strength is weak. The radiation area of the contraction city is smaller than the administrative area. The muscular contraction cities have a total solid power, which is generally located in the continuous measurement of high ICC, and the overall development level of the region is relatively high. A weak contraction city has low external radiation ability and is easily affected by radiation from the surrounding cities. Based on the above definition of types, this paper divides the radiation space expansion types of all the cities in the YRD region in 2020 (
Figure 5).
The YRD region is dominated by contracting cities, of which strong expansion cities account for 14.63%, weak expansion cities account for 31.71%, strong contraction cities account for 14.63%, and invalid contraction cities account for 39.02%. The CIV of Shanghai is 1.436, and the average CIVs of Jiangsu, Zhejiang, and Anhui are 1.024, 0.985, and 0.967, respectively. Shanghai is an expanding solid city, and the strong external radiation capacity of Shanghai plays an essential role in the coordinated development of the YRD region. The type of urban radiation space expansion is affected by multiple factors, such as metropolitan administrative area, urban morphology, and comprehensive strength of adjacent cities. As far as Jiangsu Province is concerned, Nanjing and Changzhou belong to the substantial expansion cities; Su-zhou, Wuxi, Nantong, and Zhenjiang belong to the strong expansion cities; Tai-zhou, Huai’an, Lianyungang, and Suqian belong to the weak expansion cities. The remaining three cities belong to the weak contraction cities. As far as Zhejiang Province is concerned, Hangzhou and Ningbo belong to the strong expansion cities, Wenzhou and Quzhou belong to the weak expansion cities, and the other seven cities belong to invalid contraction cities. As for Anhui Province, Hefei belongs to the substantial expansion type; Wuhu and Ma’anshan belong to the strong contraction type; seven cities, such as Bengbu, belong to the weak expansion type; and six cities, such as Chuzhou, belong to the weak contraction type.
5. Analysis of Polycentric Structure
5.1. Determining the Central City of the Circles
There are hierarchies and differences among cities in the region, and the cities of different grades have different spatial radiation ranges. The radiation range of high-level cities usually covers low-level cities, forming a nested regional spatial system [
43]. The competition between high-level cities is more intense; so, it is necessary to analyze the urban radiation pattern from different spatial scales [
44].
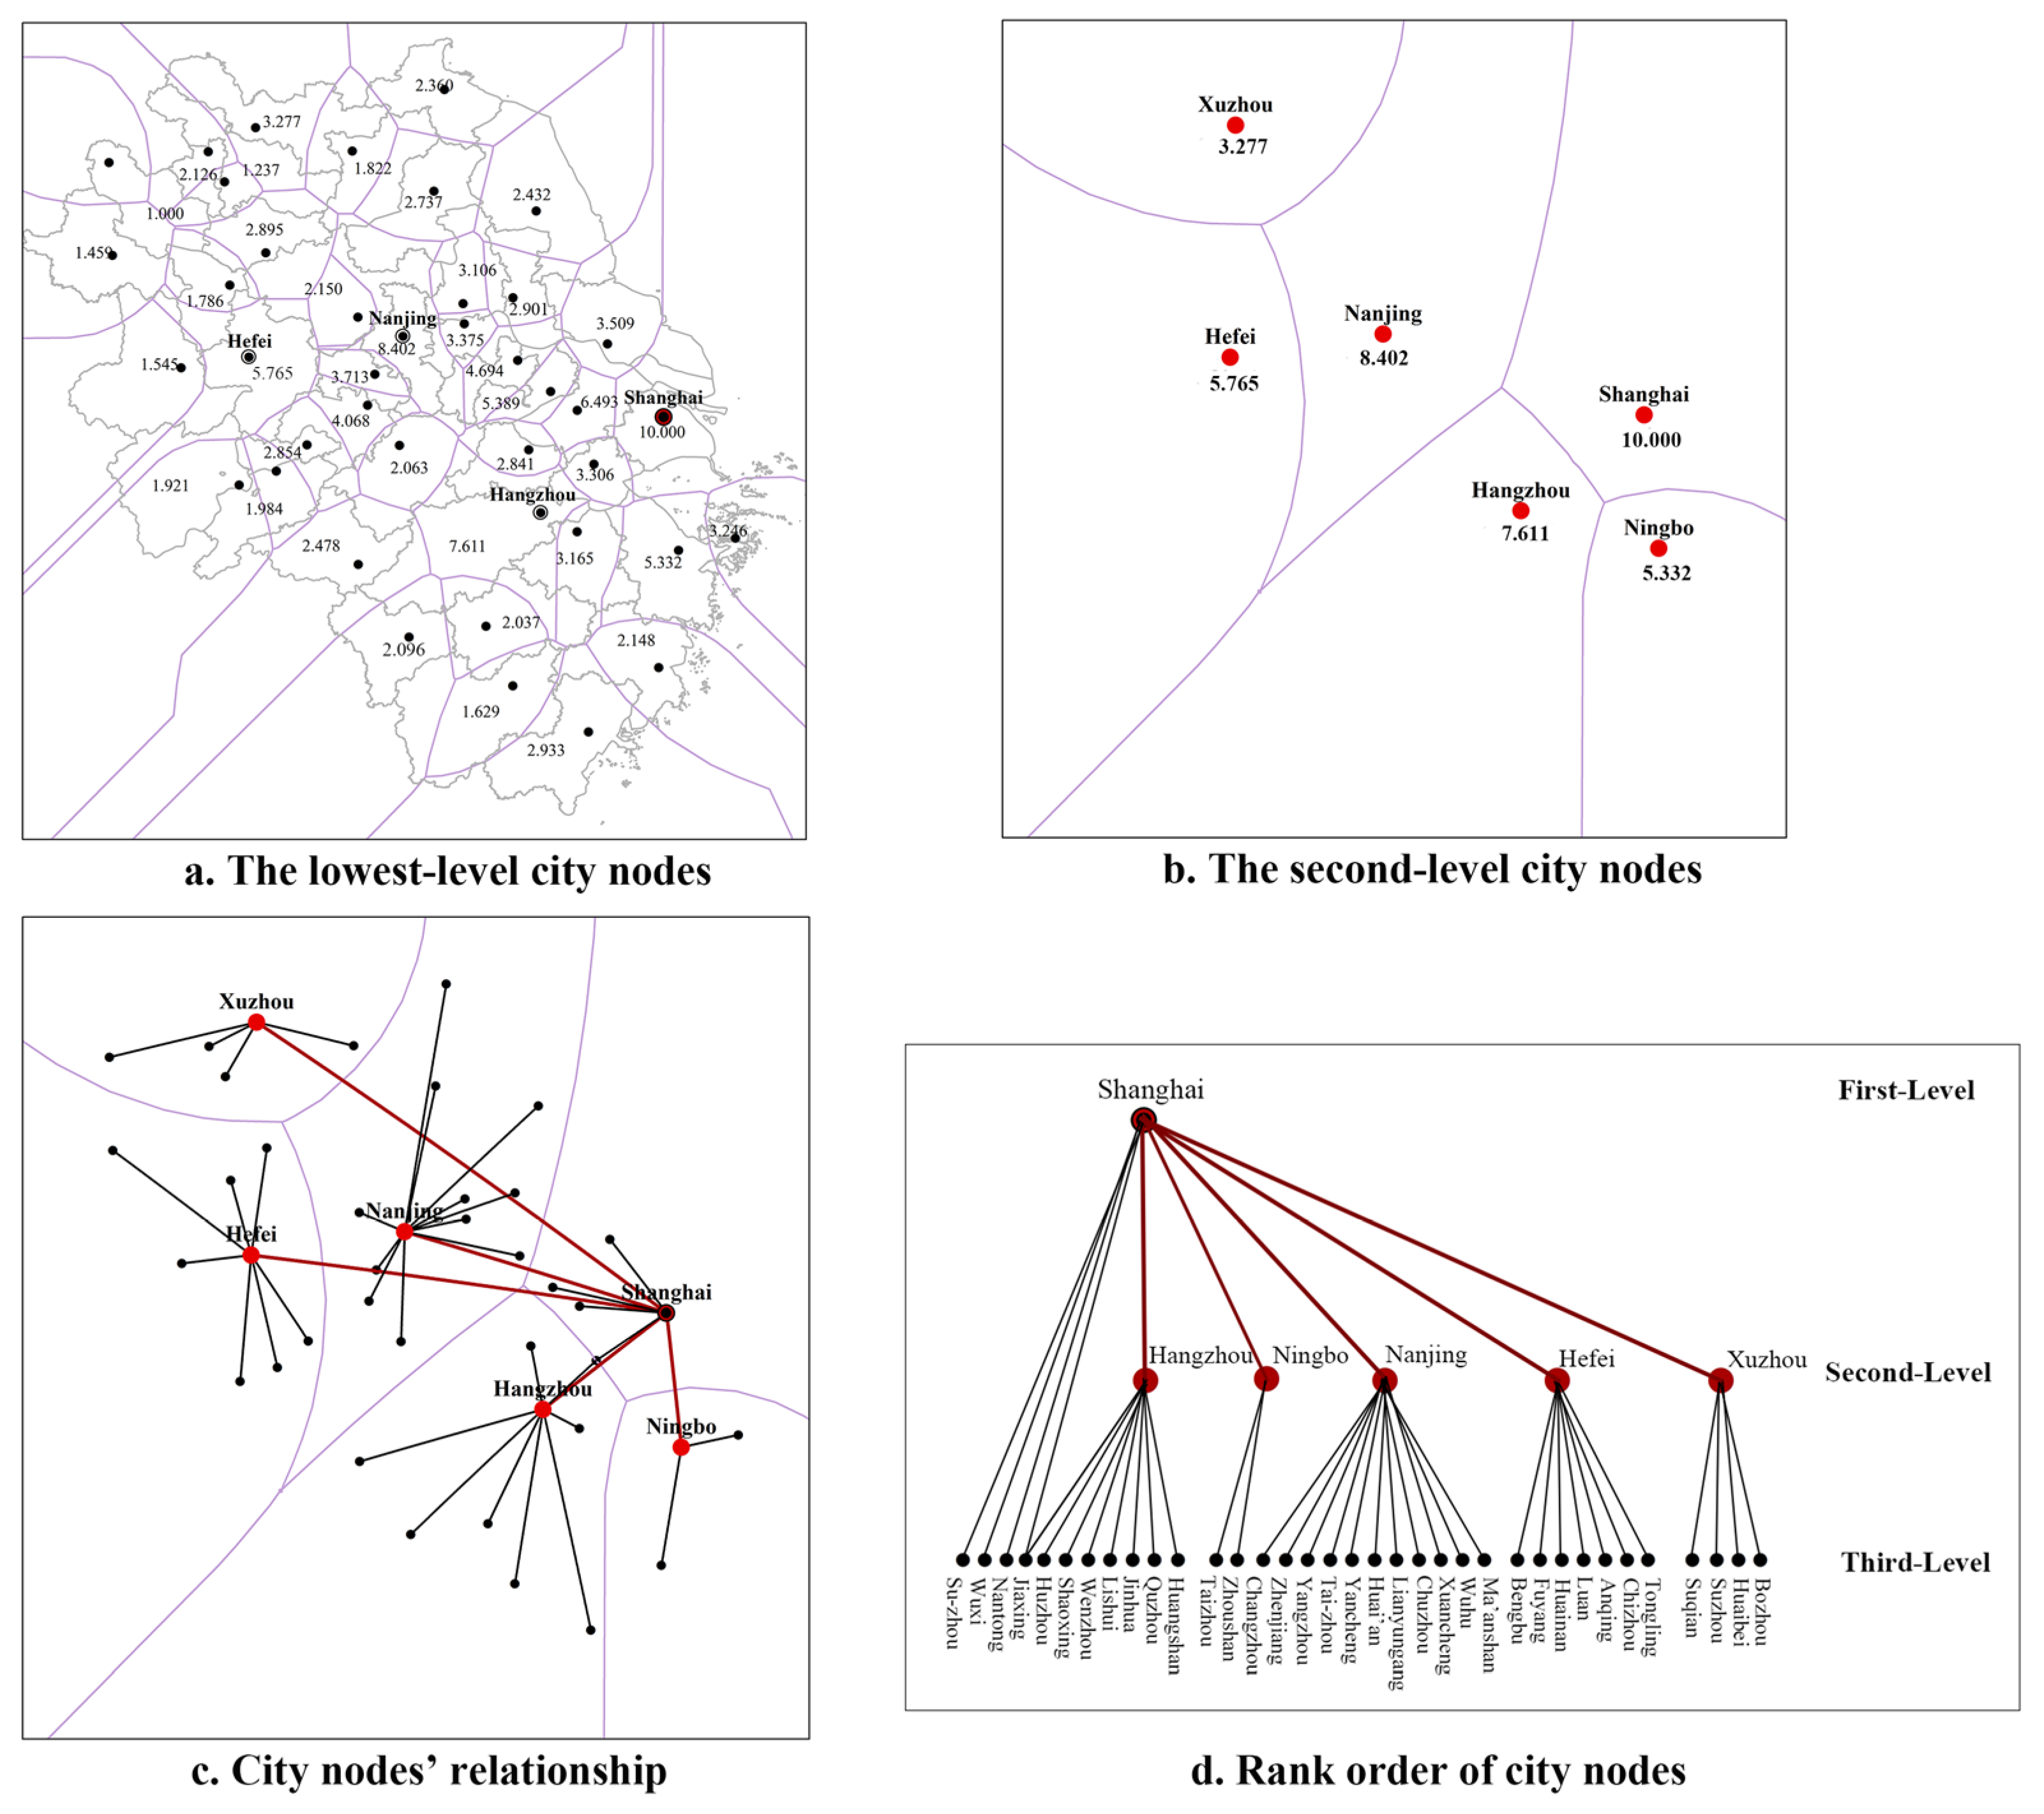
This paper adopts the hierarchical weighted V-graph to select the ICC values as the attribute data to divide the urban hierarchy in the YRD region.
Figure 6a shows the ICC values and the spatial distribution of all the cities in the YRD region, which facilitates a clear comparison of the ICC values between the neighboring cities. Firstly, the 41 cities are taken as the lowest-level city nodes, and the ICC of each city is compared to its neighboring cities. If the ICC of a city is greater than or equal to any other neighboring city, it will be regarded as a local central city of the higher level (namely, the second level). Considering the existence of Hangzhou Bay between Shanghai and Ningbo, the six cities of Shanghai, Nanjing, Hangzhou, Ningbo, Hefei, and Xuzhou are finally identified as the second level of local centers.
Figure 6b shows the second-level city nodes determined according to the above method. Secondly, using the above algorithm again for the six second-level city nodes, it is concluded that the higher central city of the six cities is Shanghai. Then connect cities at all levels within the city’s radiation range.
Figure 6c shows the relationship between the city nodes. Finally, the final rank order of the region is shown in
Figure 6d, forming the circle structure with Shanghai, Nanjing, Hangzhou, Ningbo, Hefei, and Xuzhou as the centers, respectively.
According to the algorithm of the hierarchical weighted V-graph, the urban hierarchy system is generally consistent with the spatial pattern of the original six metropolitan areas in the YRD region, but there are some differences. The three cities of Suzhou, Wuxi, and Changzhou have a high ICC, but they are not included in the second level because of the influence of Shanghai’s intense radiation. As the city with the highest ICC in the north of the YRD region, Xuzhou is a vital radiation center city in the northern part of the region; so, it is included as a second-level member.
5.2. Circles’ Radiation Spatial Morphology
Based on the principle of morphological dimension calculation, the geographical calculation function of ArcGIS is used to calculate the perimeter and area of each urban radiation range in the YRD region to establish the lnP-lnA double logarithmic relationship of the member cities in different circles. The results of the fitting equations for lnP and lnA in each process and their goodness-of-fit parameters (R2) and fractal dimension (D) are shown in
Table 2. The R2 value obtained by the regression model of the six circles is between 0.722 and 0.929, indicating that it has a good regression effect.
The ideal range value of D is between 1 and 2. The radiation space morphology of the Ningbo circle is simple and stable, and its D value is 0.683, which does not reach the ideal D. The D values of Shanghai, Nanjing, Hangzhou, Hefei, and Xuzhou are in the perfect range, which indicates that they objectively have a fractal relationship. From the perspective of the complexity of the radiation space form, the sequence of the spatial morphological complexity in each circle, from complex to simple, is Hangzhou circle, Shanghai circle, Xuzhou circle, Hefei circle, and Nanjing circle. The irregularity of the urban radiation spatial form is affected by multiple factors, such as the complexity of the regional topography and the tortuous degree of urban boundaries. From the perspective of the stability of the radiation space form, the order of the stability of the radiation space form of the different circles from strong to weak is consistent with the order of the above stability. The D values of the processes are mostly higher than 1.5, indicating that they are in highly complex forms. In this case, there is a positive relationship between the complexity and the stability of the urban radiation spatial morphology.
5.3. Coincidence of Circle and Metropolitan Area
By comparing the member cities of the six circles obtained by hierarchical division in this paper with the member cities of each metropolitan circle in the study area, it was found that the coincidence between the Shanghai circle and the Shanghai metropolitan area is 63.64%; the coincidence between the Nanjing circle and the Nanjing metropolitan area is 75%; the coincidence between the Hangzhou circle and the Hangzhou metropolitan area is 60%; the Ningbo circle and the Ningbo metropolitan area completely coincide; the coincidence between the Hefei circle and the Hefei metropolitan area is 62.5%; the Xuzhou circle replaces the Suzhou-Wuxi-Changzhou metropolitan area. The degree of coincidence between the member cities of each process and the corresponding metro area shows the characteristics of “overall coincidence and local deviation”. The “overall coincidence” indicates that the multi-center circle structure determined by the hierarchical weighted V-graph has particular practical significance, and the existing “local deviation” can provide direction for the future expansion and development of each metropolitan area.
Each metropolitan area’s specific development direction is explored using the SDE in the ArcGIS spatial statistics tool (
Figure 7). The elliptical angle θ of the Shanghai circle is 123.89°, and the ellipse’s long axis is from southeast to northwest, indicating that the radiation range of Shanghai extends inland along the northwest direction, which is the development direction of the Shanghai metropolitan area in the future. The elliptical angle θ of the Nanjing circle is 18.30°, and the long axis of an ellipse is from northeast to southwest. In the end, the Nanjing metropolitan area can continue to expand and develop into the cities in northeastern Jiangsu, such as Yancheng and Lianyungang. The elliptical angle θ of the Hangzhou circle is 19.24°, and the ellipse’s long axis is from northeast to southwest, and Hangzhou metropolitan area can continue to extend to Jinhua, Lishui, and other cities in southwest Zhejiang. The elliptical angle θ of the Ningbo circle is 25.34°; the extension direction of the ellipse’s long axis is similar to that of the Hangzhou circle; and the eastern coastal area of Zhejiang is the main direction for the Ningbo metropolitan area to extend. The elliptical angle θ of the Hefei circle is 155.88°, the ellipse’s long axis is southeast to northwest, and the Hefei metropolitan area can expand to northwest and southeast Anhui. The ellipse angle θ of the Xuzhou circle is 85.78°, and the ellipse’s long axis tends to the east and west direction. Northern Jiangsu and northern Anhui are the key development directions of the Xuzhou metropolitan area in the Yangtze River Delta in the future. The elliptical angle θ of Xuzhou circle is 85.78°, the ellipse’s long axis tends to be close to the east and west, and northern Jiangsu and northern Anhui are the key development directions of the Xuzhou metropolitan area.
6. Discussion
As the spatial form in the advanced stage of urbanization development, metropolitan areas are an essential engine to drive the high-quality growth of a regional economy. The central city in the metro area has substantial resource allocation and radiation-driving capability, which can effectively lead to the development of the surrounding cities. The construction and development of the metropolitan area should not only give full play to the radiating and leading role of the central city but also strengthen the radiative driving role as well as strengthen the active integration consciousness of other cities.
For the future development planning of each metropolitan area in the YRD region, this paper puts forward the following suggestions: the Shanghai metropolitan area should continuously expand its radiation scope in the inland area to realize resource agglomeration and function sharing in a larger space. At the same time, it will develop in concert with other metropolitan areas in the region, give full play to its leading role, and push the YRD region toward higher-quality integrated development. The Nanjing metro area spans the boundary of Anhui and Jiangsu provinces and plays an important strategic position in the integrated development pattern of the YRD region. It is necessary to enhance the radiation force of the central city of Nanjing and promote urban integration and the cross-regional coordinated development within the metropolitan area. Hefei metropolitan area should steadily promote the expansion and quality of the cities in northern and southern Anhui, strengthen coordination and linkage with the Nanjing metro area, and build a coordinated development model in the east and central regions. The Hangzhou metropolitan area should take industrial digitalization as a basic form of cooperation and continuously promote the construction of the Hangzhou metropolitan area to a new level. The Ningbo metropolitan area should focus on the advantages of land and sea coordination and create a new highland for opening up to the world. The Suzhou-Wuxi-Changzhou metropolitan area should pay attention to effective parallel management, give full play to the characteristics and advantages of each city, and actively integrate into the construction of the Shanghai metropolitan area and the Nanjing metropolitan area. In addition, the construction of the Xuzhou metropolitan area should be further promoted. It is worth mentioning that China’s metropolitan areas are still in the primary stage of development; all areas should respect the objective law, the self-contained development stage, and intensive and efficient development rather than blind expansion.
The exploration of the urban radiation pattern in this paper is to further deepen the understanding of the mutual relationship between cities. Using the extended breaking point model and the hierarchical weighted V-graph to study the external radiation patterns of single-level and multi-level cities in the YRD region, the radiation game relationship between the cities is visualized by integrating the ICC. The spatial proximity between cities, which helps to promote regional coordinated and balanced development through continuously optimizing the regional spatial structure and discussing the future development direction of metropolitan areas, has important theoretical significance and practical value. However, the division of the urban radiation range based on the ideal state by the extended breaking point model may have some deviation from the actual situation, and it is also necessary to comprehensively consider the influence of multiple factors, such as topography, traffic, culture, and policy among cities in reality. In addition, the boundary cities of the study area are not independent individuals as members of the YRD region. The possibility of the influence of neighboring towns and provinces outside the study area needs to be considered and needs to be further explored in future research.


