Abstract
The demand for humanitarian supply chains grows daily as the incidence of calamities rises. Typhoons cause thousands of casualties each year. As a result, policymakers and governmental authorities must develop effective readiness and response measures as part of pre-disaster plans. This paper proposed a stochastic model for multi-objective location-routing for creating a humanitarian network for pre-disaster response. The model aims to minimize the overall costs of the network’s setup, the time required to travel through it, and the number of vehicles necessary for transferring affected individuals to evacuation centers. The model concentrates on pre-disaster scenarios in uncertainty. The provided model was implemented in an actual scenario in one of the Philippines’ provinces and solved using Multi-Objective Particle Swarm Optimization (MOPSO), which is also contrasted with Multi-Objective Simulated Annealing (MOSA) and the ε-constraint approach. According to empirical findings, the model can be used to identify distribution hubs and evacuation centers and choose the best routes in unexpected and actual disaster scenarios. Given that the ideal number, location, and capacity of DCs and ECs are known in advance, government decision-makers can solve any potential shortages and problems during the disaster.
1. Introduction
Every year, people worldwide are impacted by disasters such as floods, earthquakes, storms, droughts, wars, and more. These natural disasters seriously harm nations all over the world. Each year, there are over 599 disasters that affect more or less 200 million people and result in the deaths of close to 75,000 individuals. [1]. Unfortunately, it is predicted that in the coming years, ecological and human-made disasters will increase five times [2]. Due to the increasing incidence of accidents, many scholars have set their sights on disaster management (DM). Disaster management is the art of efficiently planning for and acting in response to disasters [3]. Resources must be systematically arranged in order to lessen the harm caused by disasters. The management of the duties associated with disaster prevention, readiness, response, and recovery also entails a systematic approach. DM intends to assist at-risk individuals in mitigating or recovering from disaster consequences [4]. The four stages of DM are mitigation, preparedness, response, and recovery. Humanitarian logistics is one of the operations responsible for implementing the three stages of disaster management: preparation, response, and recovery. In the context of disaster prevention, humanitarian logistics refers to the process of transporting individuals from crisis-affected areas to secure locations. Emergency response planning has advanced significantly over time to lessen the effects of these catastrophes. Planning for safe shelters should begin before the crisis arises to protect the public from harm [5,6].
The Philippines ranks third among countries which are most susceptible to disasters because of its geographical location. The country usually experiences typhoons, earthquakes, floods, volcanic eruptions, landslides, and fires, to name just a few. Between 1900 and 2012, it experienced 531 catastrophes, affecting more than 160 million people and resulting in losses of USD 10.5 billion. In 2013, Typhoon Haiyan (Yolanda), which affected 26 million people and killed at least 8000 people, struck the Philippines and caused the most devastation. Typically, 20 tropical cyclones hit the waters of the Philippines yearly; typhoons are often the most devastating natural catastrophes to hit the nation [7].
Over the past few years, the Philippines has paid close attention to and made advancements in disaster risk reduction. Numerous organizations and stakeholders have spearheaded projects and activities to strengthen the initiatives. To reduce the socio-economic and ecological effects of disasters, especially those caused by climate change, Republic Act 10121, passed in May 2010, recognizes the need to implement a disaster risk reduction and management approach that is general, inclusive, cohesive, and practical. It also encourages the involvement and participation of all districts and stakeholders concerned at all tiers, particularly the residents [8]. After the onslaught of Typhoon Haiyan (Yolanda) in the Philippines in 2013, the government and aid organizations have concentrated on disaster risk reduction and preparedness.
With the frequency of typhoons in the country, the use of schools as evacuation shelters is prevalent in the Philippines. However, this is no longer advisable in light of the Department of Interior and Local Government (DILG) Memorandum Circular No. 122 series of 2018 [9]. It urges each local government unit (LGU) to prioritize the construction of robust, secure, and appropriately designed evacuation facilities. It must meet the nation’s building safety standards and be receptive to potential users’ needs. In response to this DILG Memorandum Circular, each LGU shall assign an evacuation center in each barangay in their municipality. However, most barangays allocated either the barangay hall or covered court as the designated evacuation center, which does not fulfill the national building safety regulations and needs to be more responsive to their potential users’ needs.
Despite the availability of many research studies related to humanitarian supply chains and humanitarian network designs, topics on facility location, network design, and evacuation planning are each dealt with separately, when in fact they should be treated with high degree of inclusivity. Also, the majority of models created to quantify decisions made in relation to evacuation travel take place in developed nations, where decision-making factors such as culture, capacity, and resources are different from those in developing nations [10]. Furthermore, very limited studies have been conducted in the Philippines on these topics. The majority of the literature on humanitarian logistics in the Philippines is concerned with the sustainability of the humanitarian supply chain, in general, as well as the study of evacuation travel behavior [10,11,12,13]. Gutierrez and Mutuc [14] proposed a model for humanitarian supply chain in Marikina City using linear programming, employing the Center of Gravity Method. Though the Center of Gravity Method locates the facilities where it displays similarity between volume and distance of demand throughout a network of consumer locations. Its application is limited to regions with no bodies of water. Further, it only considers the location of distribution hubs, not the location of evacuation centers or temporary shelters. This investigation was conducted under this framework. The number and location of local distribution centers must be decided upon before the start of the disaster. This pre-positioning action is a component of disaster preparedness [15]. At the same time, evacuation centers (or temporary shelters) and their locations need to be taken into account because they act as places where evacuees can get food, medical attention, and lodging [16]. These two facilities should be taken into account during the pre-disaster phase. In order to assist in pre-disaster preparation, the study establishes the number of distribution and evacuation centers as well as their locations depending on the context in the Philippine conditions.
This study suggested the utilization of the model in response to the need for practical mathematical modeling and how it might contribute to the sustainability of government initiatives for disaster response in the Philippines. Initially, the number of DCs and ECs to be constructed to reduce the infrastructure cost is determined. Should the government make a significant investment, it is crucial to ascertain how many of these facilities are needed at the location. Furthermore, the facility’s site must be secured and free from hazards. Second, the evacuation route must be planned to place the facilities in areas requiring the fewest response vehicles and have the shortest travel distances. Finally, various scenarios must be taken into account to consider the worst-case and most likely outcomes. The scenarios were developed based on the survey conducted [12], which showed that risk perception directly impacted preparedness intentions and actions. Similarly, this study considered the scenarios used by [17] where the scenarios reflect the various levels of disaster intensity. Hence, the scenarios were created based on the time and severity of the typhoon.
The metaheuristics technique is employed to achieve these objectives. The creation of heuristic optimization algorithms can be guided by a set of rules or strategies provided by a metaheuristic, an advanced, algorithmic framework independent of constraints. It applies a heuristic optimization technique to a particular problem in accordance with the rules of a metaheuristic framework [18]. Numerous other metaheuristics exist, but some noteworthy to mention are ant colony optimization, tabu search, simulated annealing, variable neighborhood search, and genetic/evolutionary algorithms. The most popular metaheuristics, according to Santana Robles [19], are simulated annealing (SA), particle swarm optimization (PSO), and genetic algorithm (GA). The goal of this study is to determine how well MOPSO handles location-routing problems for planning humanitarian evacuations. Additionally, the performance of the model and the MOPSO heuristic procedure is also evaluated with those of other broadly utilized methods.
This research paper is structured as follows: Section 2 reviews the studies on multi-objective models and humanitarian evacuation planning. Recent trends and issues on humanitarian supply chains (HSCs) were also discussed to establish the research gap. Section 3 discusses the development of the mathematical model and the solution method; Section 4 presents the empirical case, the numerical results and analysis, and some practical implications of the study; and Section 5 provides the conclusions and future research undertakings from the findings of the study.
2. Literature Review
According to Habib et al. [5], the three main areas of study in the field of humanitarian supply chain (HSC) are facility location, network design and relief distribution, and mass evacuation.
2.1. Humanitarian Supply Chain Facility Location
A relief distribution channel, consisting of warehouses, regional relief distribution centers, and central distribution hubs, is created with the intention of giving relief to the affected people following a disaster. The difficulty in this procedure is locating these facilities such that the needs of the entire disaster-affected area are met with the least amount of delivery cost and the highest degree of service. Some authors take into account resource allocation from central distribution hubs to depots and local distribution centers in addition to planning the location of the facility. These problems are referred to as location-allocation problems [5].
In order to maximize the coverage of relief supplies in the disaster target region, Dekle et al. [20] developed a model to position the disaster recovery facilities in the pre-disaster environment. A model for supply distribution in a municipal inundation disaster scenario was created by Chang et al. [21] with the goal of minimizing transportation costs, facility setup expenses, and hauling costs of rescue paraphernalia. The authors took into account the position of the depot, arrangement of facility distribution, scarcity, and excess penalties. A facility location problem was proposed by Balcik and Beamon [15] for the post-disaster situation. The problem is a maximal covering location model variant with economic and facility considerations. To accommodate the demand, they decided on a number of distribution center locations and the amount of relief goods needed at each location. The approach used by Abounacer et al. [22] was one of exact solutions. The authors created a way to deliver the assistance from and to the demand sites in a location-transportation problem by first determining the location and number of distribution facilities. A location-allocation model with goal programming was proposed by Barzinpour and Esmaeili [23] with the aims of expanding population collective coverage and reducing overall cost.
2.2. Humanitarian Supply Chain Network Design and Relief Distribution
In the domain of network design and relief distribution for the HSC, numerous mathematical models have been created with slight modifications in objective functions and constraints. In their study on the location-routing problem (LRP), some researchers took the routing problem and the distribution facility’s location into consideration [5]. LRP is a method that can address the problem of simultaneously resolving the locations of facilities and vehicle paths. LRP prevents the optimization process from becoming stuck in the sub-optimal solution brought on by choosing the locations of facilities and vehicle paths independently. Because LRP can combine facility location problems (FLP) and vehicle routing problems (VRP), it may be of interest to researchers [24]. A model for multiple-depot location-routing was proposed by Ahmadi et al. [25]. To get the relief supplies from local depots to the afflicted individuals, they identified the locations of local warehouses and created a routing model. They created a neighborhood search algorithm and added a feature for implications for network failure, such as highway destruction and costs associated with unmet needs. LRP models have been widely implemented in a variety of fields, including parcel delivery by Bruns et al. (2000) and Wasner and Zapfel (2004); telecom network design by Billionnet et al. (2005); medical by Pourreza (2018); and environment by Toro et al. (2017). In general, cost reduction is included as one of the objective functions in most LRP models in addition to the other criteria that must be satisfied.
According to Berger et al. [26], the LRP form of the problem, in which there are no facility or vehicle limits, is as follows:
Let J be the set of potential facility locations and I be the set of customer locations. A graph can be defined as G = (N, V), where N = I ∪ J or J ⊆ I the set of points and V = N × N is the set of edges. Along with Pj, which is the set of viable routes for facility j, we can define k as a feasible route that departs from facility j, travels to a subset of nodes, and then returns to facility j. The IP formulation for the problem is
where
: Fixed cost of facility j
: Cost of transportation in route k associated with facility j
: 1 if facility j is chosen, 0 otherwise
: 1 if route k is connected with facility j is chosen, 0 otherwise
: 1 if route k is connected with facility j visits client i, 0 otherwise.
When each client is supplied by a single facility (constraint 1), the objective function optimizes both the fixed costs and the routing costs, making sure that only routes of selected facilities are chosen (constraint 2).
Metaheuristic methods can be used to address complex problems using large amounts of information. The metaheuristic approach allows for the production of near-optimal solutions, or good enough solutions, even while finding an optimal solution is not guaranteed. However, because computing will be done more quickly when using metaheuristic approaches, time can be saved. As a result, metaheuristic methods are ideal for use in complex situations involving vast volumes of data.
There has been extensive use of metaheuristic techniques using LRP models. This is due to a model that is getting more complicated and has multiple constraints and data applied. Bouhafs et al. [27] decide the facilities to be opened using hybrid simulated annealing (SA) and ant colony optimization (ACO). They also determine the path to be traveled, which is determined by the ACO. Finally, Prins et al. [28] employ the randomized extended Clarke and Wright algorithm (RECWA) to build an initial solution. The memetic algorithm with population management (MA|PM) was then employed by the authors to get a conclusion.
One of the extensively used metaheuristic techniques is particle swarm optimization (PSO). According to Hussain et al. [29], PSO is frequently used since it is simple to apply and productive in both research and business. Marinakis [30] also used surveys on issues with vehicle routing to illustrate the applicability of PSO. The assessment of 100 publications yielded the conclusion that PSO can offer top-notch solutions for various VRP variants. Multi-objective particle swarm optimization (MOPSO) is one sort of PSO. A variant of the PSO known as MOPSO is used to handle multi-objective optimization problems (MOOP). Liu and Kachitvichyanukul [31] previously used MOPSO on MLRP cases and a Pareto base. According to the authors, MOPSO has a superior Pareto front quality compared to NSGA II.
2.3. Mass Evacuation
The majority of the mass evacuation area models were created for public transportation evacuation. In their model of an integrated emergency supply network, Sheu and Pan [32] took into account public evacuation. They took into account psychological cost, operational cost, and trip distance minimization in their approach. To establish a coordinated network for emergency supplies, they combined distribution, evacuation, and medical networks. Governments remove the populace from dangerous locations ahead of time whenever a disaster such as a flood is expected. The lack of an adequate supply of bus drivers is the main issue in such circumstances. In order to calculate how many extra drivers would be necessary during an emergency evacuation operation, Morgul et al. [33] proposed two stochastic models, with the aim of reducing the costs associated with both the unmet demand and the expenses associated with the hiring of additional board employees. In their bus-based evacuation model, Naghawi and Wolshon [34] also assessed how a transit bus-based evacuation might affect the functionality of a regional road network.
In light of the above literature, this study provided a multi-objective location-routing model to address the pre-disaster phase by optimizing the location of distribution and evacuation centers and managing mass evacuation within the required response time (golden time). It is accomplished through the use of several objective functions. The model’s objectives included minimizing investment costs for distribution hubs and evacuation centers and maximizing the coverage of these shelters to adjacent residential zones. The model ensured that evacuees are evacuated within the required response time during the evacuation process. This work aimed to offer a multi-objective, multi-level facility location-routing model for disaster management (DM) operations in the early aftermath of a disaster. The proposed model was divided into two stages: (1) identifying the ideal location of distribution hubs to allow for the shortest response time possible, followed by (2) determining the optimal allocation of individuals to evacuation centers with the shortest response time possible. In focus, the model’s objectives included minimizing the cost of creating distribution hubs and evacuation centers by selecting an adequate number of facilities. The second phase employed an optimization approach to identify the ideal location-allocation for evacuees in evacuation centers while maintaining the shortest response time possible, considering the evacuation centers’ capacity and the population of each community shown in Figure 1.
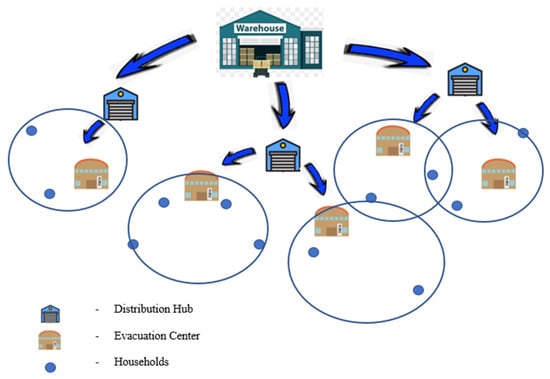
Figure 1.
Research paradigm.
The current study offers four contributions: it offers two different types of facilities, namely distribution hubs and evacuation centers, as its first contribution. Most studies only offer one specific type of facility. Second, the model aimed to create the humanitarian network with the shortest response time, both in terms of evacuation and relief distribution, at the lowest investment cost. Third, it takes both scenario-based and stochastic uncertainty into account at the same time. Finally, it is the only paper, to the best of our knowledge, that utilizes hazard map in modeling humanitarian facilities decisions.
3. Methodology
The succeeding sections explain the steps undertaken in this research to fit the purpose of the study.
3.1. Research Framework
The research methodology is displayed in Figure 2. In the first step, the fundamental infrastructures that will be affected by a typhoon are identified, and their interactions are established. The stochastic parameter distribution functions are then generated. The mathematical model for the pre- and post-disaster phases is presented in the second stage. In order to minimize costs, response times, and maximize vehicle usage, the location, allocation, and routing must be planned. The proposed stochastic mathematical model is then translated to a deterministic model as the next stage. Finally, MOPSO is used to solve and optimize the model. MOPSO’s solutions are evaluated with those of multi-objective simulated annealing (MOSA) and the -constraint approach. The Multi-Objective Simulated Annealing (MOSA) approach is a subset of simulated annealing extensions to multi-objective optimization that builds an estimated Pareto front by assembling nondominated solutions discovered while examining the feasible domain. An archive is seen as being used to maintain such effective solutions [35]. The ε-constrained method is an algorithm transformation technique that can change algorithms for unconstrained problems into algorithms for constrained problems by comparing search points based on their objective values and violations of constraints at the epsilon level [36].

Figure 2.
Research framework.
3.2. Mathematical Model
In this study, the proposed scenario-based multi-objective location-routing model is a hybrid of the facility location model (FLM) and vehicle routing problem (VRP). The model utilized the scenario-based approach to create a network design that locates and determines the minimum number of distribution centers and evacuation centers to minimize evacuation and relief distribution time.
3.2.1. Problem Description and Assumptions
The humanitarian network is presumptively made up of the following: (1) disaster-stricken areas; (2) safe shelters at evacuation centers (ECs); and (3) distribution centers (DCs). The flow is determined by the vehicles that take evacuees from the afflicted areas to ECs. This study considered the likelihood that the routes would be destroyed or closed after the typhoon. The likelihood that the routes may be destroyed or blocked by landslides, downed trees, or flooding will depend on how strong the typhoon is. This parameter’s values will change depending on the kind of scenario and the time and typhoon signal. After the disaster, there is a finite window of time within which the relief and rescue effort must be completed. This window is known as the “golden time” [37]. This study proposed the ideal location of distribution centers (DCs) and evacuation centers (ECs) for construction during the pre-disaster period. Additionally, the evacuation flow (from the afflicted area to the EC), the evacuation’s best paths (routes), and the distribution of vehicles to these flows are all determined by the model.
Before formulating the mathematical model, the following assumptions were made of the model:
- The infrastructure cost of the facilities is known and constant in all areas;
- Homogeneous fleet vehicle routing with a single type of vehicle and a constant capacity is taken into account;
- The pick-up point is the affected area where the victims are located;
- The likelihood that disruptions at individual edges are known a priori and independent of one another.
3.2.2. Model Formulation
There are provided sets and indices, which can be found in Table 1a-c.

Table 1.
(a) Sets and indices. (b) Parameters’ definition and metrics. (c) Decision variables and their definition.
The following are the mathematical derivation of the postulated multi-objective evacuation location model:
Subject to:
The objective function aims to minimize the expected value of the total expenditures associated with the network for humanitarian evacuation. It comprises the total cost (3) of pre-disaster actions, such as the infrastructure expenditures related to setting up distribution and evacuation centers and the expenses associated with transporting impacted individuals to the evacuation centers. The second objective function (4) reduces the network’s overall travel time, which includes the time it takes to transport evacuees from the afflicted area to the evacuation centers and to deliver aid from distribution centers to evacuation centers. The number of vehicles involved in the evacuation operation is minimized by the third objective function (5).
The use of non-existent pathways between two nodes is prohibited by constraint (6). Only a single evacuation path is picked between two nodes, as defined by constraint (7). Transportation in this scenario is only feasible between two sites, for example, between EC and the impacted area, or EC and DC given constraint (7) and the model’s structure. Therefore, it is unnecessary to include the restriction (sub-tour) separately in the problem. It is because the distribution of these places to vehicles is one-to-one, and at least three nodes are needed to create a sub-tour. Therefore, no loop construction in the route of the vehicles is feasible, given the nature of the problem, and it is evident in the findings. The capacity restriction for ECs is shown in constraint (8). The evacuation of all evacuees from the affected areas is guaranteed by constraint (9). More than one DC cannot be established at any node due to constraint (10). The development of a new EC is required according to constraint (11) before evacuees are transferred. Requirement (12) states that an EC must be opened before usage. According to constraint, the response time from demand location d to the facility assigned to it will always be shorter than the maximum response times allowed (13). Constraint (14) takes vehicle volume capacity into account. The total number of round trips in each affected area is guaranteed by constraints (15) for each scenario. Throughout the whole evacuation duration, each vehicle will only be used once, according to constraint (16). To put it another way, every vehicle involved in the evacuation operation has to decide how to get to the pick-up location. According to constraint, each affected place can be reached by vehicle for evacuation (17). The types of decision variables are indicated by the constraints (18) and (19).
3.2.3. Stochastic Chance Constraint Programming
In this study, stochastic models were transformed into deterministic models using the stochastic chance constraint programming approach. There have been several documented instances of this strategy being applied successfully [17].
Assume that k is the number of objective functions and that ~ is the symbol for an ambiguous parameter. Assume that at least one of the aij, hi, or cjk parameters is defined as a stochastic parameter. As a result, the uncertain model is taken into account as follows:
where the benefit ratio of the jth decision variable in the kth objective function is represented by ckj. The technology coefficients of the jth choice variable are shown by aij, hi, and yj, respectively.
The generic model’s deterministic outcome for the maximum and least states is as follows:
(Therefore,)
(Moreover,)
As constraint (26), the multi-objective chance constraint model can be transformed into a deterministic model at α% level:
where and are the mean and variance of normal distribution function estimated by simulation model, α shows normal distribution at confidence level (1 − α)%, and φ indicates standard normal distribution with zero mean and a unit variance.
3.3. Model Solution
Particle swarm optimization aims to find a single, global optimal solution. Comparatively, multi-objective particle swarm optimization seeks solutions that constitute the Pareto front. The non-dominated solutions from each iteration are archived for this purpose. A set of criteria that ensures diversity and coverage on the Pareto front must be used to select stored non-dominated solutions [38].
3.3.1. MOPSO
Algorithm Parameters
Before using the procedure, the initial parameters need to be set. From Liu and Kachitvichyanukul [31], who also addressed the same-scale multi-objective location routing problem, the initial settings for the MOPSO method were derived. The study also used Coello et al.’s [39] parameter’s values.
This study utilized the Taguchi approach to adjust several algorithmic parameters. The signal-to-noise ratio (S/N) of the experiment is investigated. The S/N value, or amount of scatter around a given value, demonstrates how our conclusions have changed due to numerous studies. The Taguchi method mechanism also focuses on the solution. The result of this technique was grouped into three categories: lower is better, higher is better, and insignificant is better. The recommended mathematical model employed the first category to control the algorithm’s parameters because minimization is the objective function. The following equation shows the S/N ratio value used in this study:
where n is the orthogonal array and y represents the solution’s value.
Since the objective function scale for each example varies, they could not be used interchangeably. Each model uses the relative percent deviation to address this issue (RPD). The RPD value for the data is calculated using the following equation:
The MOPSO algorithm’s optimal set of parameter values are summarized in Table 2.

Table 2.
MOPSO parameter settings.
MOPSO Algorithm
By incorporating Pareto dominance and using the external archive to store non-dominated solutions, Coello et al. [39] created the MOPSO to handle MOOPs. This model’s complexity necessitates the use of an efficient algorithm that is capable of solving MOOPs. Algorithm 1 displays the algorithm’s pseudocode. This is implemented by Wang et al. [40].
| Algorithm 1: MOPSO | |
| Input: Number of particles (NoP), the external archive’s capacity (Acap), inertial weight (ω), Personal learning (c1), global learning (c2), mutation rate (γ), maximum number of iteration (imax) | |
| Output: Particles that are non-dominated in the external archive | |
| Steps: |
|
Particle Updating
Each particle in the MOPSO algorithm denotes a potential solution and is described by its present position and velocity. Based on their personal best (pbest) and the global best (gbest) of the entire swarm, the particles seek the solution space. Equations (29) and (30) update the particle p’s velocity vp,i and position xp,i at iteration i.
where the best positions of particle p and the entire swarm at ith iteration are represented by the variables pbestp,i and gbestp,i, respectively. The constants and are used to describe the particle’s acceleration toward xpbest,i and xgbest,i. The random numbers r1 and r2 range from 0 to 1. The trade-off between the global and local search capabilities is adjusted by the inertial weight, or ω. Following are the calculations for the decreasing linear inertial weight:
where i and stand for the algorithm’s current iteration and its maximum number of iterations, respectively. The lower and upper bounds of inertial weight are and . The MOPSO algorithm has several critical challenges that must be solved, including identifying the leadership throughout the search process, retaining the non-dominated solution to acquire the optimal Pareto front, and maintaining the diversity of the particle swarm to jump out a local optimal [40].
Selection of pbest and Nondominated Sorting
Because the pbest and gbest have a significant impact on the search, the selection of leaders is an essential step in MOPSO. The particle with the best position in the swarm is the leader in a single objective optimization problem. The best solutions to problems with multiple objectives, however, are a collection of nondominated Pareto front solutions. If and are supposed to be two particles in a bi-objective minimization problem, the objective values in function are . If u1 < v1 and u2 < v2, then u dominates v and vice versa. The particle u is a nondominated solution if there are no other particles in the swarm that dominate it.
The decision is best summed up as follows. If xpbest,i outperforms xpbest,i−1, then xpbest,i−1 will take its position, and vice versa. If there is no dominance relationship between them, then the pbest is randomly selected from among them. From among the nondominated solutions found by nondominated sorting, the gbest is chosen.
The jth particle uses two vectors [f1, f2] to organize the swarm into categories and focus the search on Pareto optimum solutions. Pareto optimum solutions constitute a Pareto front, and the Pareto optimal solutions shown in blue circles (p1, p2, p3) in the entire swarm are not dominated by any other solutions. The feasible solutions, which dominated Pareto optimum solutions in the first front, make up the solutions in the second front (p4, p5, p6). Similar to the blue circles, the green circles represent solutions (p7, p8, p9) that predominate in the second front. Algorithm 2, which is implemented by Wang et al. [40], presents the specific phases of nondominated sorting in detail.
| Algorithm 2: Nondominated sorting | |
| Input: Particle swarm P = { p1, p2, p3, …, pj}, rank counter r | |
| Output: R and a collection of particles with various rankings | |
| Steps: |
|
External Archive Updating and Gbest Selection
The MOPSO method produces nondominated particles, which are frequently stored in an external archive. The choice of gbest involves choosing a nondominated particle from the archive to serve as xgbest,i. By computing the relative density j of nondominated particles in the external archive, MOPSO employs crowding distance for archive update and xgbest,I selection [41]. Equation (32) gives the definition of the particle j’s crowding distance.
where and are the mth objective function of particle j + 1 and j − 1, and and represent maximum and minimum values of mth objective function, respectively. Algorithm 3, implemented by Wang et al. [40], presents the external archive updating algorithm.
| Algorithm 3: External archive updating | |
| Input: New particle swarm P = { p1, p2, p3, …, pj}, External archive Ai−1, Acap. | |
| Output: Ai external archive that has been updated. | |
| Steps: |
|
In Algorithm 3, each new particle is individually compared to each particle already present in the external archive. The archive needs to be updated with the new particle; however, if any particle in the archive dominates the new particle, then the new particle cannot be saved in the archive. The archive capacity inevitably increases as more nondominated particles are added, decreasing the search efficacy and raising the algorithm’s computing cost. In order to prevent archive capacity from exceeding the set value, crowding distance is introduced. To keep the swarm’s diversity, particles in a region with a high density have a tendency to be removed. The nondominated particle in the archive with the highest CD value is identified as the gbest.
Elitist Learning Strategy (ELS)
An ELS is used to assist particles in escaping the local optima, enhancing the MOPSO’s ability to perform a global search in order to prevent the particles from converging to the local optima during optimization [42,43]. The ELS modifies the gbest and directs it to a more advantageous area. The remaining particles in the archive go to the new region after xgbest,i. The particles in the external archive have changed as a result.
The same probability is used by the ELS to choose one dimension from the gbest at random. Using Gaussian perturbation, the ELS is carried out as follows:
where is the dth dimension of gbest, and and are the lower and upper bounds of the optimized problem in the dth dimension. is a Gaussian distribution random number with a mean μ = 0 and standard deviation γ, shown as Equation (34).
where the elitist learning rate, denoted by the symbol γ, declines linearly with iterations; and are the learning rate’s lower and upper boundaries, respectively; i is the number of iterations currently being used; and imax is the maximum number of iterations.
3.3.2. MOSA
Numerous multi objective simulated annealing (MOSA) frameworks have been put out in the literature, all of which recommend that an adaptation of a particular composite energy be thought of as a linear arrangement of the considered objective functions. An iterative approach to the Pareto solutions set has been demonstrated for a particular selection of acceptance probability [44].
Any solution that is not dominated by the existing solution can be accepted under the Pareto Simulated Annealing (PSA) method that Czyzak and Jaszkiewicz [45] have proposed. PSA is a population-based metaheuristic that borrows ideas from genetic algorithms and considers a group of created solutions to be potentially progressed at each temperature. Each answer from the sample is modified so that the new, acceptable solution should be far from the one that is most similar to the old one. In this method, the weights of the objectives that the nearest solution is better than the recent solution are increased while the weights of the objectives that the nearest solution is better than the recent solution are decreased. The next iteration’s evaluations phase and probabilistic acceptance will both employ the updated weights combination. The PSA technique is presented in Algorithm 4, which is implemented by Amine [35].
| Algorithm 4: PSA | |
| Input: | An initial memory M ← S, a cooling schedule τ, a starting sample of the developed solutions S, and a starting temperature T ← T0 |
| Output: The set of approximate Pareto solutions is archived in this repository M. | |
Steps:
| |
When enhancing the sample of developed solutions, PSA makes an effort to maintain some homogeneity. In other words, every cycle of improving solutions connected to a particular solution from the initial sample should be separated from other series of improving solutions connected to the other initial sample elements. This should indicate sample clustering reduction and allow for a limit on the quantity of efficient solutions that are returned. Parallelization is also feasible because PSA deals with a sample of probable solutions at each temperature. When PSA is parallel, sample elements are all updated simultaneously trying to get better results every parallel annealing process.
4. Computational Results and Analysis
This section analyzes and evaluates the implementation of the proposed model. The model was executed in a case in Quezon province. The following subsections detail the results of the proposed model.
4.1. Case Developed
Quezon Province is located in the CALABARZON region. With an area of 8706.60 square kilometers, Quezon is the sixth-biggest province in the Philippines and the largest in the region (53.21%). The part comprises 39 municipalities, including Tayabas (a component city) and Lucena (a highly urbanized city). Four (4) congressional districts are further subdivided into 1242 small localities (barangays).
Because of its position and diverse topography, Quezon is vulnerable to geological and hydro-meteorological hazards such as storm surges, flooding, tsunami, volcanic risks, and earthquake- and earthquake-triggered landslides. From 2014 to 2017, the province is expected to have suffered losses and damages of PHP 10.16 billion due to typhoons. Typhoon Glenda in 2014 caused the most damages and losses among the typhoons that impacted the region over the same period, amounting to PHP 8.88 billion. Disasters affected several industries at the micro-level, even if the losses and damages they caused were insufficient to stop the province’s economy from growing. The enormous crop and fishery production losses caused by Typhoon Glenda are evidence of how much it affected the agriculture industry.
Just recently, two super typhoons devastated the province. On 25 September 2022, Super Typhoon Karding (international name: Noru), which caused damage in Quezon province, cost PHP 186.5 million. The wrath of the extreme weather event resulted in the displacement of a total of 50,435 people, or 13,973 families, according to the Provincial Disaster Risk Reduction and Management Office (PDRRMO). The province’s first district, which includes the five island communities of Polillo, Burdeos, Panukulan, Jomalig, and Patnanungan, is home to at least 8619 families, or 31,701 people. After almost a month, on 29 October 2022, Typhoon Paeng cost the province a total of PHP 281,390,091.83 in damages to farming and fishing. It was estimated that about 23,902 families, or 82,385 people, were affected.
4.2. Test Instances
All necessary primary and secondary data were collected, analyzed, and summarized, including information from the interview with the Provincial Disaster Risk Reduction and Management Council’s head, staff, and employees (PDRRMC). Data on municipalities and barangays (small communities) were obtained. Each barangay is considered the network node, and each road connecting these barangays is the link. Since there is a total of 1242 barangays in Quezon Province, the network has 1242 nodes and 11,868 links. The island group (Panukulan, Burdeos, Patnanungan, Polillo, and Jomalig) is considered another network since there is no road connecting any barangay to other barangays in the nearby municipality.
The initial 1242 × 1242 matrix of transit times between all barangays was generated using Google Maps’ API matrix tool. A matrix entry denotes the travel time between the cluster centers of each pair of barangays in minutes.
The scenarios used in this investigation and their likelihood of occurring are displayed in Table 3. The frequency and intensity of typhoons that have hit Quezon during the past 20 years are used to calculate the probability that each scenario would occur.

Table 3.
Scenarios used in the case study.
Based on the typhoon’s strength and the time it occurred, eight scenarios were considered in this study. Disasters in the evening typically result in more severe states than disasters that occur during the day since it is easier to move during the day than at night. In the Philippines, a typhoon’s intensity is defined by the typhoon signal.
Table 4 describes the meteorological condition and the response of DRRMC in each typhoon classification. As explained in the table, disaster preparedness agencies/organizations alert their communities during typhoon signal no. 2; hence signal no. 1 is not included in the scenarios.

Table 4.
Typhoon classification in the Philippines.
4.3. Selection of Candidate Points
The risk categorization of the barangay serves as the qualifying criterion for selecting the candidate barangay to acquire the facility. It was developed using Project NOAH’s Risk Map (National Operational Assessment of Hazards). The red-colored barangays depict locations considered highly hazardous to landslides, floods, subsurface faults, and storm surges. These locations were assigned M (a vast number) as the travel time, so these areas will not be selected as candidate locations for the facility. Only barangays classified as green or yellow were considered candidate barangays for a facility (see Appendix A).
Among the 1242 barangays in Quezon, only 618 barangays became the possible locations for the facilities. The rest were considered highly susceptible to flood, landslide hazards, storm surge advisory level 4, and underground faults.
4.4. Computational Experiments
The MOPSO algorithm is used to determine the Pareto front of the model after its effectiveness has been demonstrated. Both the metaheuristics’ algorithm and the ε-constraint method are coded and implemented using Python 3.11.2. It runs on a desktop computer with CPU: 3.60 GHz, with an AMD Ryzen 5 3600 6-Core processor and 16 GB of installed RAM.
4.4.1. Comparison of MOPSO, MOSA, and ε-Constraint Method
The findings were contrasted with the results obtained using the MOSA and ε-constraint approach in order to confirm the proposed model and the effectiveness of the proposed algorithm. The first objective function is regarded as the major objective function and the second as the secondary objective function in the ε-constraint approach. For each problem, a total of sixteen (16) Pareto points are produced. The problems are resolved independently in order to establish the Pareto points depending on each objective function.
The Pareto boundaries for the MOPSO, MOSA, and ε-constraint methods are contrasted in Figure 3. The graph clearly shows that the Pareto boundaries generated by the MOPSO algorithm are comparable to those generated by the MOSA and exact ε-constraint approach. Large-scale problems, however, are now inaccessible to the ε-constraint approach. Due to the need to take into account more facilities, Scenarios 5 to 8 no longer generate solutions. The outcome is similar to that of Ghasemi et al. [17], who remarked that the ε-constraint approach is only capable of handling small-scale and medium-scale problems, whereas metaheuristics algorithms can solve even large-scale problems.
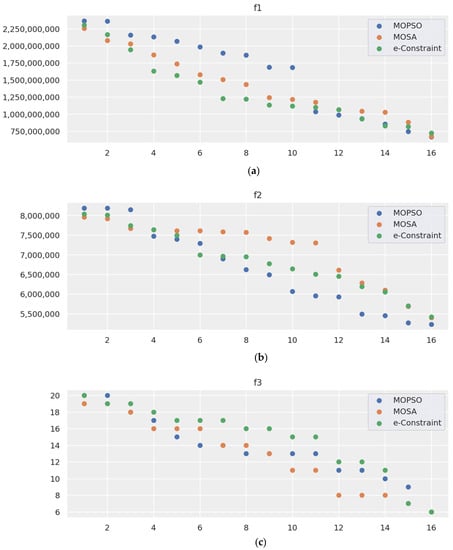
Figure 3.
Comparison of Pareto fronts for (a) objective function 1, f1, (b) objective function 2, f2, and (c) objective function 3, f3 between MOPSO, MOSA, and ε-constraint method.
Table 5 presents further comparison and analysis. Columns 2 through 4 compare the Pareto fronts of the overall costs (f1) for each of the three solution approaches, whereas columns 5 through 7 display the Pareto fronts of the travel times (f2), and the number of vehicles (f3) are shown in columns 8 through 10. The relative error is displayed in the subsequent columns after comparing the values of the e-constraint to those of MOPSO and MOSA, respectively.

Table 5.
The comparison of errors for MOPSO, MOSA, and ε-constraint.
The relative errors of MOPSO and MOSA for the three objective functions are −0.18824, −0.08363, 0.03555, −0.03831, 0.07123, and 0.14332, respectively. Therefore, MOPSO displays smaller relative error than MOSA for the second and third objective functions. MOPSO only performs not as good as that of MOSA in the first objective function.
Other metrics, such as the mean of ideal distance (MID), spacing metric (SM), diversification metric (DM), and algorithm running time (CPU T), which are presented in Figure 4, are intended be used to compare the solutions of MOPSO with MOSA and ε-constraint. However, since Scenarios 5 through 8 no longer give solutions using the ε-constraint, only Scenarios 1 through 4 can be compared.
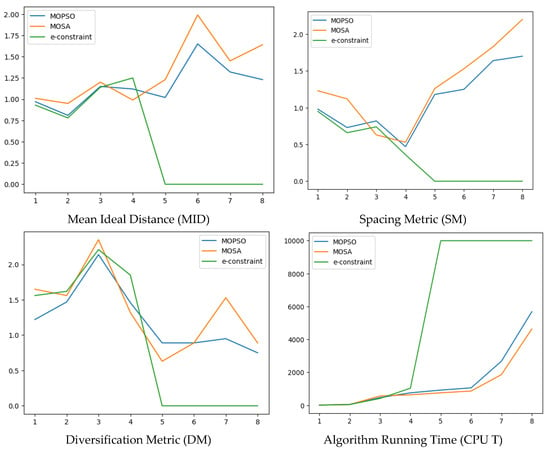
Figure 4.
Comparison of various metrics for MOPSO, MOSA, and ε-constraint method.
The graphs reflect the same investigation, showing that MOPSO performs satisfactorily across all metrics and is quite near to the exact solution approach. Thus, it is confirmed that MOPSO is a suitable approach for dealing with large-scale problems. It is crucial to take note of how long it takes to solve each complex problem. The epsilon-constraint technique is unable to keep up with the MOPSO as a result of the exact solution method’s drastically increasing time requirement as the problem’s size grows. The problem can be solved significantly faster using the metaheuristic approach. As a result, the MOPSO algorithm has excellent performance and is capable of handling complex problems.
4.4.2. Results of Case Study
Table 6 shows the minimum number of distribution centers, evacuation centers, and service vehicles needed to serve the needs of the homeless people if a disaster strikes in the province. As expected, the number of facilities increases, respectively, as the situation aggravates. Mainly, as the typhoon signal escalates, more people are being affected and need to be evacuated; hence, more facilities must be provided. However, the result shows that there is only a small effect on the number of facilities when a typhoon happens. Regardless of whether the typhoon occurs during the day or night, the facilities needed are almost the same.

Table 6.
Minimum number of facilities.
It was also determined how many vehicles would be needed to shuttle affected individuals from the disaster zone to the safest evacuation centers. Because the algorithm always allows the vehicle to select the shortest path between the facilities, it has led to faster evacuation times and more trips, reducing the number of vehicles needed.
Table 6 also shows an interesting contrast that can be noted. Consideration is given to Scenario 0, which takes no likelihood into account. If the typhoon’s time and intensity are not considered in the model, the number of facilities will almost be doubled. It is notable that this is caused by evaluating the probability that a typhoon will hit the particular area at a given time in a particular scenario.
Table 7 summarizes the distribution of evacuees in the evacuation centers for each scenario. As discussed previously, as the typhoon intensifies (as defined by the scenarios), more people get affected. They need to be evacuated to be safe. More ECs need to be provided. The number of evacuees in each EC for each scenario must be maximized to 600 persons. Furthermore, ECs nos. 4, 5, 6, and 7 are the most utilized ECs since these areas are usually struck by a typhoon and are more populated than the other areas.

Table 7.
Number of homeless people allocated to each evacuation center under each scenario.
Finally, Figure 5 illustrates the areas covered by each facility. For illustrative convenience, we only displayed the figure for Scenario 1. Scenario 1 resulted in having a minimum of seven evacuation centers (red square) and three distribution hubs (yellow triangle). As seen in the figure, the model consolidated almost entirely in the demand groups and distributed facilities consistently throughout the study region. The circles in Figure 5 indicate the covered region of each facility. The yellow circles identifies the covered regions for the distribution centers. It minimizes the time in distributing the relief items to the evacuation centers and affected areas. Table 8 shows the specific location of each facility.
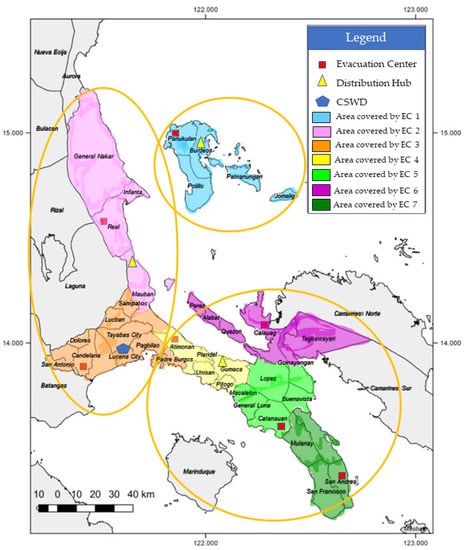
Figure 5.
Areas covered for the facilities in Scenario 1.

Table 8.
Location of facilities (Scenario 1).
These regions were also noted as being outside the Quezon hazard map areas designated particularly vulnerable to flooding, landslide risk, storm surge alert level 4, and subterranean faults. As a result, these areas are suitable for constructing DM facilities.
4.4.3. Sensitivity Analysis
A sensitivity analysis is carried out to determine how sensitive the infrastructure cost is to EC capacity. The capacity affects the number of ECs that must be built, as can be drawn from Table 6. The capacity expansion of one EC prevents the creation of a new EC. Consequently, the construction’s fixed costs will decrease.
Figure 6 illustrates the relationship between the EC’s capacity and its construction cost. Generally, the highest cost appears in Scenario 8. It is more cost-effective to install ECs with higher capacity that will be spread out across the network. The establishment of fewer evacuation centers, however, might lengthen the evacuation process. However, the cost lines of all the scenarios converge somewhere in the middle, suggesting that the infrastructure costs are slightly different between scenarios at a given capacity.
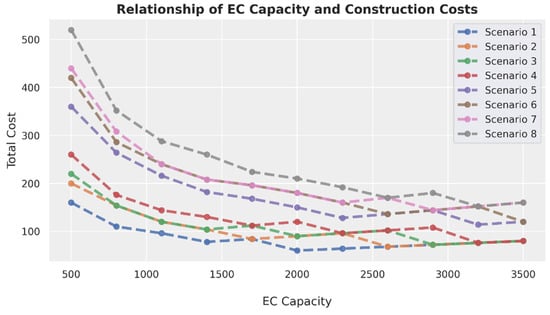
Figure 6.
Relationship between EC capacity and construction cost.
Figure 7 shows the sensitivity analysis of the network’s overall travel time EC capacity. Because there will be fewer ECs dispersed throughout the network, as was already mentioned, the travel time increases as the number of ECs increase.
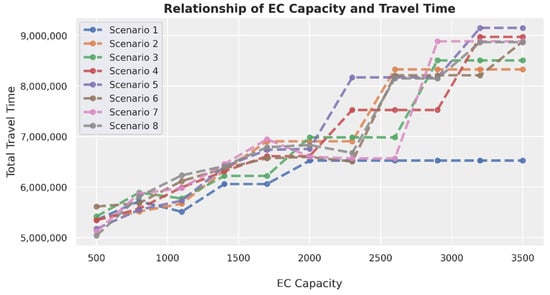
Figure 7.
Relationship of EC capacity and total travel time.
The number of the vehicle (objective function 3) is not particularly sensitive to EC capacity. As we increase EC capacity, the impact is relatively minimal. The reason for this is that, in other scenarios, idle time might still be employed to move the homeless people from the afflicted locations to the EC. As the EC’s capacity rises, the number of trips each vehicle can make effectively rises.
4.5. Practical Implications
Even though the idea of sustainability is not new, it has only lately been discovered how to apply it to humanitarian supply chains. Generally, the foundation of a sustainable system is a constant understanding that sustainability goals are being achieved. Building long-term capacity from a holistic standpoint is essential to enhancing response and the efficacy of humanitarian interventions. The development of long-term capacity is key to the effectiveness of temporary relief efforts. As a result, long-term capacity building is essential for creating sustainable humanitarian supply chains (HSCs). Sustainability has been a controversial issue and is the most crucial factor in the current situation.
As part of the long-term capacity building in the Philippines, this study helps by determining the number of distribution hubs and evacuation centers and their locations that optimize the total construction cost for the facilities and maximize the coverage of these facilities to adjacent residential zones. The model ensures that evacuees are evacuated within the required response time during the evacuation process.
5. Conclusions and Future Research
This paper proposed a stochastic multi-objective location-routing mathematical model for creating a humanitarian network for disaster response. The proposed model was applied to a case study in Quezon Province, which comprises 1242 barangays and is regularly hit by typhoons. This also considers the strategic and tactical strata of decision-making in crisis response. The selection of the quantity and location of ECs and DCs and the distribution of available capacity are referred to as strategic decisions. Operations considerations include choices regarding the number of vehicles to be used, the route to take, and the transfer of impacted individuals to ECs.
The proposed model had three objectives: minimizing the network’s infrastructure’s total cost, the amount of time spent traveling through it, and the number of vehicles. The Multi-objective Particle Swarm Optimization (MOPSO) technique was used to resolve the model. A sensitivity analysis was used to compare the suggested model’s efficiency to the EC’s capacity. The findings implied that constructing more ECs with less capacity is preferable when a typhoon becomes more severe. The province’s ECs are significantly dispersed throughout the network. On the other hand, less powerful storms call for the construction of fewer ECs with more capacity.
This study will aid policymakers and government officials in strategic and tactical decision-making before and after a disaster. Government decision-makers can address potential shortages and issues during the crisis as the optimum number of DC and EC, their location, and capacity are defined in advance. During typhoons, there is also a chance that roads could be destroyed or blocked. Therefore, it is advised that decision-makers strengthen the primary pathways. The strength of the routes leading to probable locations for ECs and DCs should also be considered, as well as the absence of barriers. It can significantly lower the possibility of a failed evacuation.
The following issues of interest can still be investigated in future work: (1) it is recommended to generate more accurate evacuation plans combined with the congestion of roads, since the road uncertainty covered in this study is only related to roads being blocked or damaged, while road traffic was not considered; (2) the evacuee arrival distribution can be taken into account to make the model more dynamic (i.e., the use of queuing analysis to make the probability distribution more accurate); (3) only one vehicle type was considered in the evacuation; it is a vital topic to extend the model to heterogeneous fleet cases; and lastly, (4) a cooperative game and simulation can be utilized to consider the behavior aspect of evacuees during evacuation.
Author Contributions
Conceptualization, M.R.D.d.V. and A.A.N.P.R.; methodology, M.R.D.d.V. and A.A.N.P.R.; supervision, M.N.Y.; writing—original draft, M.R.D.d.V.; writing—review and editing, A.A.N.P.R., R.R.M.III, S.F.P. and Y.T.P. All authors have read and agreed to the published version of the manuscript.
Funding
The authors would like to thank Directed Research for Innovation and Value Enhancement (DRIVE) of Mapua University for funding this study.
Institutional Review Board Statement
Not applicable.
Informed Consent Statement
Not applicable.
Data Availability Statement
The study did not report any data.
Acknowledgments
The authors thank Mapua University and Southern Luzon State University for supporting this research.
Conflicts of Interest
The authors declare no conflict of interest.
Appendix A
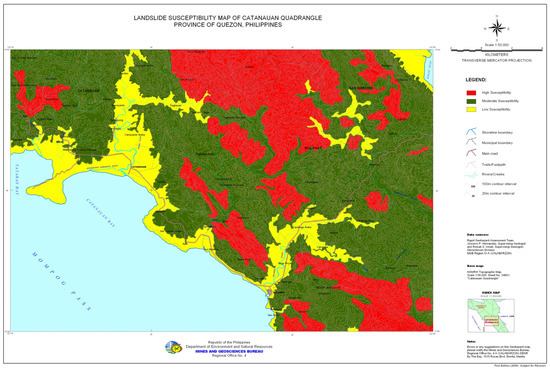
Figure A1.
Susceptibility Map of Catanauan Quadrangle in Quezon.
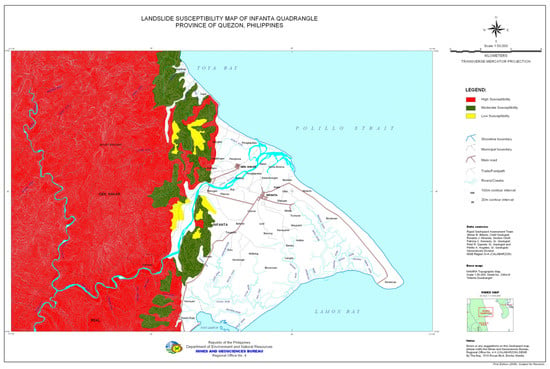
Figure A2.
Susceptibility Map of Infanta Quadrangle in Quezon.
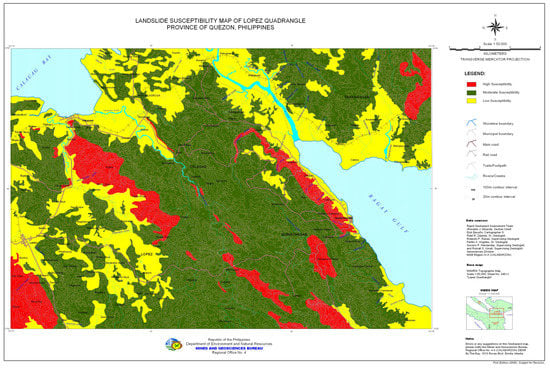
Figure A3.
Susceptibility Map of Lopez Quadrangle in Quezon.
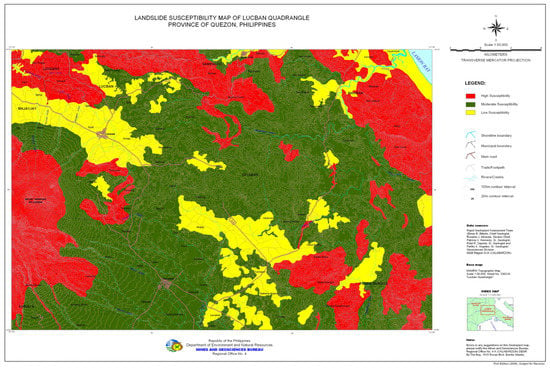
Figure A4.
Susceptibility Map of Lucban Quadrangle in Quezon.
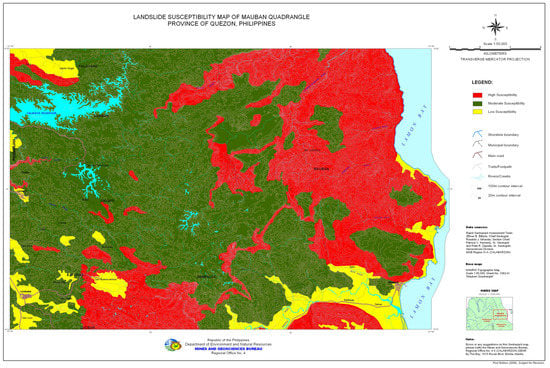
Figure A5.
Susceptibility Map of Mauban Quadrangle in Quezon.
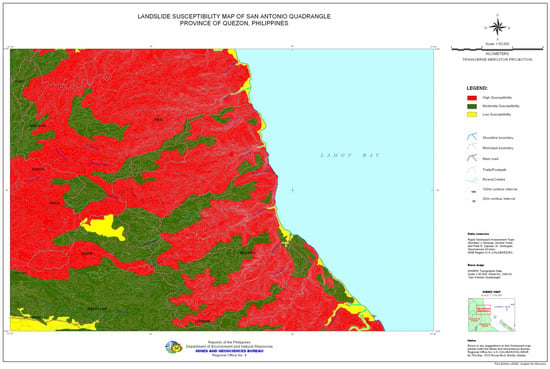
Figure A6.
Susceptibility Map of San Antonio Quadrangle in Quezon.
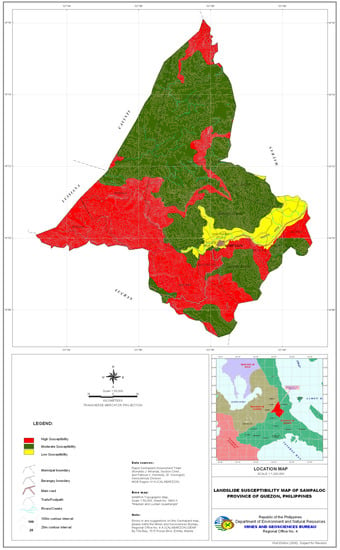
Figure A7.
Susceptibility Map of Sampaloc Quadrangle in Quezon. Source: https://sheltercluster.org/philippines/documents/risk-map-region-iv-quezon (accessed on 18 August 2022).
References
- Brimberg, J.; Juel, H. A bicriteria model for locating a semi-desirable facility in the plane. Eur. J. Oper. Res. 1998, 106, 144–151. [Google Scholar] [CrossRef]
- Sadeghi, M.E.; Khodabakhsh, M.; Ganjipoor, M.R.; Kazemipoor, H.; Nozari, H. A New Multi Objective Mathematical Model for Relief Distribution Location at Natural Disaster Response Phase. Int. J. Innov. Eng. 2021, 1, 22–47. [Google Scholar] [CrossRef]
- What is Disaster Management? Understanding Emergencies from Prevention to Mitigation”. Available online: http://publichealth.tulane.edu (accessed on 3 September 2021).
- Akgün, İ.; Gümüşbuğa, F.; Tansel, B. Risk-based facility location by using fault tree analysis in disaster management. Omega 2018, 52, 168–179. [Google Scholar] [CrossRef]
- Habib, M.S.; Lee, Y.H.; Memon, M.S. Mathematical Models in Humanitarian Supply Chain Management: A Systematic Literature Review. Math. Probl. Eng. 2016, 2016, 3212095. [Google Scholar] [CrossRef]
- Sauer, A. Humanitarian Supply Chain Performance Management: Development and Evaluation of a Comprehensive Performance Measurement Framework Based on the Balanced Scorecard. Doctoral Dissertation, Munich Business School, München, Germany, 2016. [Google Scholar]
- Philippines: Disaster Management Reference Handbook, March 2018. Available online: https://reliefweb.int/report/philippines/philippines-disaster-management-reference-handbook-march-2018 (accessed on 20 July 2022).
- National Disaster Risk Reduction and Management Plan (NDRRMP) 2011–2028. Available online: https://www.adrc.asia/documents/dm_information/Philippines_NDRRM_Plan_2011-2028.pdf (accessed on 20 July 2022).
- Statistics Sweden. Design Your Questions Right: How to Develop, Test, Evaluate and Improve Questionnaires 2004. Available online: http://www.scb.se/statistik/_publikationer/OV9999_2004A01_BR_X97OP0402.pdf (accessed on 5 June 2020).
- Lim, M.B.B.; Lim, H.R.; Piantanakulchai, M.; Uy, F.A. A household-level flood evacuation decision model in Quezon City, Philippines. Nat. Hazards 2015, 80, 1539–1561. [Google Scholar] [CrossRef]
- Medel, K.; Kousar, R.; Masood, T. A collaboration–resilience framework for disaster management supply networks: A case study of the Philippines. J. Humanit. Logist. Supply Chain Manag. 2020, 10, 509–553. [Google Scholar] [CrossRef]
- Paciarotti, C. Humanitaria logistics and supply chain standards. Literature review and view from practice. J. Humanit. Logist. Supply Chain. Manag. 2021, 11, 550–573. [Google Scholar] [CrossRef]
- Lim, H.R.; Lim, M.B.B.; Rojas, A.W.M. Towards modelling of evacuation behavior and planning for emergency logistics due to the Philippine Taal Volcanic eruption in 2020. Nat. Hazards 2022, 114, 553–581. [Google Scholar] [CrossRef]
- Gutierrez, M.E.; Mutuc, J. A Model for Humanitarian Supply Chain: An Operations Research Approach. In Proceedings of the 7th International Conference on Building Resilience, Using Scientific Knowledge to Inform Policy and Practice in Disaster Risk Reduction, ICBR2017, Bangkok, Thailand, 27–29 November 2017. [Google Scholar]
- Balcik, B.; Beamon, B.M. Facility location in humanitarian relief. Int. J. Logist. Res. Appl. 2008, 11, 101–121. [Google Scholar] [CrossRef]
- Bayram, V.; Yaman, H. A stochastic programming approach for Shelter location and evacuation planning. RAIRO Oper. Res. 2018, 52, 779–805. [Google Scholar] [CrossRef]
- Ghasemi, P.; Goodarzian, F.; Abraham, A. A new humanitarian relief logistic network for multi-objective optimization under stochastic programming. Appl. Intell. 2022, 52, 13729–13762. [Google Scholar] [CrossRef] [PubMed]
- Sörensen, K.; Glover, F. Metaheuristics. In Encyclopedia of Operations Research and Management Science; Gass, S.I., Fu, M., Eds.; Springer: New York, NY, USA, 2013; pp. 960–970. [Google Scholar]
- Robles, F.S.; Hernández-Gress, E.S.; Hernández-Gress, N.; Macias, R.G. Metaheuristics in the Humanitarian Supply Chain. Algorithms 2021, 14, 364. [Google Scholar] [CrossRef]
- Dekle, J.; Lavieri, M.S.; Martin, E.; Emir-Farinas, H.; Francis, R.L. A Florida County Locates Disaster Recovery Centers. INFORMS J. Appl. Anal. 2005, 35, 133–139. [Google Scholar] [CrossRef]
- Chang, M.-S.; Tseng, Y.-L.; Chen, J.-W. A scenario planning approach for the flood emergency logistics preparation problem under uncertainty. Transp. Res. Part E Logist. Transp. Rev. 2007, 43, 737–754. [Google Scholar] [CrossRef]
- Abounacer, R.; Rekik, M.; Renaud, J. An exact solution approach for multi-objective location–transportation problem for disaster response. Comput. Oper. Res. 2014, 41, 83–93. [Google Scholar] [CrossRef]
- Barzinpour, F.; Esmaeili, V. A multi-objective relief chain location distribution model for urban disaster management. Int. J. Adv. Manuf. Technol. 2013, 70, 1291–1302. [Google Scholar] [CrossRef]
- Parayoga, R.; Sri Asih, A.M. Empirical Study of MOPSO and NSGA II comparison in multi-objective location routing problem incorporating the service level of delivery. In Proceedings of the Second Asia Pacific International Conference on Industrial Engineering and Operations Management, Sukarta, Indonesia, 14–16 September 2021. [Google Scholar]
- Ahmadi, M.; Seifi, A.; Tootooni, B. A humanitarian logistics model for disaster relief operation considering network failure and standard relief time: A case study on San Francisco district. Transp. Res. Part E Logist. Transp. Rev. 2015, 75, 145–163. [Google Scholar] [CrossRef]
- Berger, R.T.; Coullard, C.R.; Daskin, M.S. Location-Routing Problems with Distance Constraints. Transp. Sci. 2007, 41, 29–43. [Google Scholar] [CrossRef]
- Bouhafs, L.; Hajjam, A.; Koukam, A. A Combination of Simulated Annealing and Ant Colony System for the Capacitated Location-Routing Problem. In Knowledge-Based Intelligent Information and Engineering Systems: 10th International Conference, KES 2006, Bournemouth, UK, 9–11 October 2006. Proceedings, Part I 10; Springer: Berlin/Heidelberg, Germany, 2006; Volume 4251, pp. 409–416. [Google Scholar]
- Prins, C.; Prodhon, C.; Calvo, R.W. A Memetic Algorithm with Population Management (MA|PM) for the Capacitated Location-Routing Problem; Springer: Berlin/Heidelberg, Germany, 2006; pp. 183–194. [Google Scholar] [CrossRef]
- Hussain, K.; Salleh, M.N.M.; Cheng, S.; Shi, Y. Metaheuristic research: A comprehensive survey. Artif. Intell. Rev. 2018, 52, 2191–2233. [Google Scholar] [CrossRef]
- Marinakis, Y.; Marinaki, M. Particle Sward Optimization for the Vehicle Routing Problem: A Survey and a Comparative Analysis. In Proceedings of the Conference LOT 2014: Logistics, Optimization and Transportion, Britvegen, Molde, Norway, 1–2 September 2014; pp. 1163–1196. [Google Scholar]
- Liu, J.; dan Kachitvichyanukul, V. A pareto-based particle swarm optimization algorithm for multi-objective location routing problem. Int. J. Ind. Eng. Theory Appl. Pract. 2015, 22, 314–329. [Google Scholar]
- Sheu, J.-B.; Pan, C. A method for designing centralized emergency supply network to respond to large-scale natural disasters. Transp. Res. Part B Methodol. 2014, 67, 284–305. [Google Scholar] [CrossRef]
- Morgul, E.F.; Cavus, O.; Ozbay, K.; Iyigun, C. Modeling of Bus Transit Driver Availability for Effective Emergency Evacuation in Disaster Relief. Transp. Res. Rec. J. Transp. Res. Board 2013, 2376, 45–55. [Google Scholar] [CrossRef]
- Naghawi, H.; Wolshon, B. Performance of Traffic Networks during Multimodal Evacuations: Simulation-Based Assessment. Nat. Hazards Rev. 2012, 13, 196–204. [Google Scholar] [CrossRef]
- Amine, K. Multiobjective Simulated Annealing: Principles and Algorithm Variants. Adv. Oper. Res. 2019, 2019, 8134674. [Google Scholar] [CrossRef]
- Yang, Z.; Cai, X.; Fan, Z. Epsilon constrained method for constrained multiobjective optimization problems: Some preliminary results. In Proceedings of the GECCO Comp ’14: Proceedings of the Companion Publication of the 2014 Annual Conference on Genetic and Evolutionary Computation, Vancouver, BC, Canada, 12–16 July 2014. [Google Scholar]
- Sawalha, I.H. Behavioural response patterns: An investigation of the early stages of major incidents. Foresight 2018, 20, 337–352. [Google Scholar] [CrossRef]
- Schaffer, J.D. Multi-Objective Optimization with Vector Evaluated Genetic Algorithms. In Proceedings of the First International Conference on Genetic Algorithms, Pittsburg, CA, USA, 24–26 July 1985; pp. 93–100. [Google Scholar]
- Coello, C.A.C.; Pulido, G.T.; Lechuga, M.S. Handling Multiple Objectives with Particle Swarm Optimization. IEEE Int. Conf. Ind. Eng. Eng. Manag. 2004, 8, 256–279. [Google Scholar] [CrossRef]
- Wang, Y.; Zhe, J.; Wang, X.; Sun, Y.; Wang, H. Collaborative Multidepot Vehicle Routing Problem with Dynamic Customer Demands and Time Windows. Sustainability 2022, 14, 6709. [Google Scholar] [CrossRef]
- Govindan, K.; Jafarian, A.; Khodaverdi, R.; Devika, K. Two-echelon multiple-vehicle location–routing problem with time windows for optimization of sustainable supply chain network of perishable food. Int. J. Prod. Econ. 2014, 152, 9–28. [Google Scholar] [CrossRef]
- Lim, W.H.; Isa, N.A.M. An adaptive two-layer particle swarm optimization with elitist learning strategy. Inf. Sci. 2014, 273, 49–72. [Google Scholar] [CrossRef]
- Ding, S.; Chen, C.; Xin, B.; Pardalos, P.M. A bi-objective load balancing model in a distributed simulation system using NSGA-II and MOPSO approaches. Appl. Soft Comput. 2018, 63, 249–267. [Google Scholar] [CrossRef]
- Villalobos-Aria, M.; Coello, C.; Hernandez-Lerma, O. Asymptotic convergence of a simulated annealing algorithm for multiobjective optimization problems. Math. Methods Oper. Res. 2006, 64, 353–362. [Google Scholar] [CrossRef]
- Czyzak, P.; Jaszkiewicz, A. Pareto simulated annealing metaheuristic technique for multiple-objective combinatorial optimization. J. Multi-Criteria Decis. Anal. 1998, 7, 34–47. [Google Scholar] [CrossRef]
Disclaimer/Publisher’s Note: The statements, opinions and data contained in all publications are solely those of the individual author(s) and contributor(s) and not of MDPI and/or the editor(s). MDPI and/or the editor(s) disclaim responsibility for any injury to people or property resulting from any ideas, methods, instructions or products referred to in the content. |
© 2023 by the authors. Licensee MDPI, Basel, Switzerland. This article is an open access article distributed under the terms and conditions of the Creative Commons Attribution (CC BY) license (https://creativecommons.org/licenses/by/4.0/).