Article

Automatic Method for Distinguishing Hardware and Software Faults Based on Software Execution Data and Hardware Performance Counters

Department of Computer Science and Engineering, Ewha Womans University, Seoul 03760, Korea
*
Author to whom correspondence should be addressed.
Electronics 2020, 9(11), 1815; https://doi.org/10.3390/electronics9111815
Submission received: 14 August 2020 / Revised: 6 October 2020 / Accepted: 7 October 2020 / Published: 2 November 2020
(This article belongs to the Special Issue Advanced Embedded HW/SW Development)

Abstract

:
Debugging in an embedded system where hardware and software are tightly coupled and have restricted resources is far from trivial. When hardware defects appear as if they were software defects, determining the real source becomes challenging. In this study, we propose an automated method of distinguishing whether a defect originates from the hardware or software at the stage of integration testing of hardware and software. Our method overcomes the limitations of the embedded environment, minimizes the effects on runtime, and identifies defects by obtaining and analyzing software execution data and hardware performance counters. We analyze the effects of the proposed method through an empirical study. The experimental results reveal that our method can effectively distinguish defects.

1. Introduction

Embedded software is often initially developed in a simulation environment and later mapped onto a real target or an evaluation board. As the simulation environment, evaluation board, and real target have different purposes and require different interfaces, various types of fault may occur [1].
Defects detected in the simulation environment are software faults. These defects occur during operations that are irrelevant to the hardware. The causes of these defects can be easily detected using various debuggers [2].
After the software is integrated into the evaluation board or real target, many defects can occur owing to the difference between the development and execution environments. When software is ported in accordance with the execution environment using a cross-compiler and linker, various defects related to memory, performance, and inter-process communication (IPC) can be generated through the different scheduling methods and resources used by the memory and central processing unit (CPU). These defects occur in situations where the software and hardware are intricately connected, which makes it challenging to identify which of the two is causing the defect.
Transient or intermittent faults generated by hardware can alter signal transfers or stored values, which may lead to incorrect program execution [3]. These faults lead to the same results as software malfunctions or faults, such as hanging or crashing. When the symptoms of hardware faults are shown as software malfunctions, the consequences of faults tend to be observed in different processes or applications irrelevant to the hardware that caused these faults [4]. Hangs caused by lower voltage margins are difficult to reproduce, as the timing of their occurrence is non-deterministic [5]. Even if a crash occurs, it is difficult to distinguish whether it is caused by invalid memory access in the software or an exception in the CPU pipeline [6]. In these cases, a developer might incorrectly determine that these faults are related to the software and potentially waste a considerable amount of time before detecting the actual cause of the faults.
Theoretically, hardware and software should be integrated and verified in parallel after development is complete. However, due to problems with development conditions, software development can be performed even after the hardware and software are integrated. If a new fault occurs in this situation, a software developer may not be able to determine whether it is caused by the newly developed software or by the integration. In this context, a method is required to determine whether a fault in an environment containing integrated hardware and software is generated by the hardware or software.
To develop a solution for distinguishing hardware and software faults, we consider the restrictions of embedded systems. In an embedded system, the hardware and software are intricately connected; furthermore, resource use is limited. Therefore, the software should be tested while prohibiting changes to software targeted at testing, maintaining a runtime state, and minimizing performance overhead [7]. Moreover, the original runtime environment should be maintained. For example, a print statement that is added to the source code earmarked for debugging might prevent fault detection. In addition, a fault that did not initially occur in the simulation environment or evaluation board could appear in the target.
In this study, we propose a method that efficiently discriminates between hardware and software faults using execution data and a hardware performance counter when a defect is detected and debugged in the hardware and software integration test stage of an embedded system. Non-permanent (transient or intermittent) hardware malfunctions and software timing errors, which we define as hardware or software integration faults, are usually challenging to distinguish but can be identified using our approach. Distinguishing between hardware and software faults requires monitoring both. Faults can be accurately detected only when aspects of both the hardware and software are considered in the process of fault detection [8,9,10].
For debugging, the debugger first must determine where the defect occurred. To find the location of the defect, the execution log is traced or, if a log does not exist, execution is repeated until the defect occurs. At this point, monitoring tools are used to detect the defect. Tools and methods for monitoring faults in embedded systems continue to be examined by researchers. However, available methods for detecting faults by monitoring all execution information destroy the real-time execution environment, while those that monitor performance within certain intervals lead to a decrease in the accuracy of the monitored information [11]. Thus, the effects on the real-time execution environment should be minimized when data are obtained to determine the faults.
Our method obtains minimal data from the execution and performance counters related to the operation of a system call by hooking the system call of the kernel accessing the hardware in order to distinguish whether the defect originates from the hardware or software. We analyze the data to distinguish hardware and software faults and to identify the hardware that caused the fault (if the fault is determined to be a hardware fault). This solution can detect faults through simple processes in a runtime environment where hardware and software are integrated for operation (e.g., evaluation boards or real targets).
The following are the main contributions of this paper: (1) the proposed method effectively identifies whether faults in the embedded system are generated by the hardware or software during integration; (2) use of the proposed technique minimizes the influence of fault classification on the system; (3) the proposed method is automated to monitor faults in an embedded system without using an additional hardware device. Various malfunctions can occur in environments where hardware and software are integrated. However, to explain the core principle of our method clearly, we focus on transient or intermittent faults in the CPU and software faults caused by the interface and timing.
This paper is structured as follows: Section 2 provides an overview of the relevant research. In Section 3, we describe our approach for distinguishing hardware and software faults, followed by a report of the experimental results in Section 4. In Section 5, we discuss our conclusions and future work.

2. Background and Related Research

2.1. Faults Caused by the Integration of Hardware and Software

Typical faults generated in hardware [12] are summarized in Table 1. Hardware malfunctions are classified as either permanent or non-permanent faults (transient or intermittent faults), where permanent faults are caused by external impacts, heat, and manufacturing defects, while transient or intermittent faults result from temporary voltage fluctuations, magnetic fields, and radiation. Permanent faults that are repeatedly generated at the same location can easily be detected and distinguished from software faults. In contrast, the occurrence and location of transient or intermittent faults are irregular, and these faults are unlikely to recur as they occur only under certain conditions. Furthermore, these faults are difficult to correct as they are not easily distinguishable from software faults.
Software faults [13] are more common than hardware faults and are triggered by different events as summarized in Table 2. In the case of a defect in the software, there are several types of symptoms, such as crashes, hangs, and malfunctions. When these defects are reproduced in the same environment, it is easy to distinguish between them. In the case of a crash or malfunction, it is possible to determine whether it is a hardware or software defect using defect detection tools or crash logs supported by the operating system (OS). However, in the case of a hang, reproducing the problem is problematic as the occurrence of the defect is not deterministic and the symptom appears similar to a hardware defect. Therefore, it is not easy to distinguish whether the cause of the defect is the hardware or software. In the case of an interface or timing problem (see Table 2), if a defect occurs when the hardware and software are integrated, a hang may appear when the hardware seems to be stopped [14].
As such, transient or intermittent faults due to hardware and interface or timing faults caused by software do not occur at a certain time or location, which poses difficulties in identifying these faults based on the accompanying conditions. Furthermore, determining the causes of faults that are unlikely to recur is generally time-consuming.

2.1.1. Transient or Intermittent Faults in the CPU

Transient or intermittent faults can be generated by various hardware devices, such as the CPU, memory, and bus. In this study, we focus on transient or intermittent faults that occur in the CPU. CPU transient or intermittent faults are generated by temporary voltage fluctuations, magnetic fields, and radiation in different parts of the CPU, such as data registers, address registers, the data-fetching unit, control registers, and the arithmetic logic unit. CPU intermittent faults occur due to unstable or marginal semiconductors [12]. When transient or intermittent faults occur in the CPU, bit flipping occurs in the data that are controlled and processed by the CPU. A bit flip might not affect the execution of the program but can lead to a system downstate in severe cases. Moreover, as the conditions under which a bit flip occurs are similar to those under which a value is modified by a software fault, the cause of the fault is difficult to identify.

2.1.2. Interface or Timing Problems in Software

Interface faults are generated during calls between different layers. The locations of interface faults are uniform. In contrast, timing faults occur when a task to be performed within a set amount of time is inappropriately executed; therefore, timing faults are not deterministic in terms of location. For example, when data loss occurs during communication between two processes, an idle state of waiting for data is maintained in the reception process. During symmetric communication, this idle state of waiting for the result of data processing is also maintained during the transmission process. The state in which the system seems to stop operating is known as hanging [15]. When a crash occurs, the system shuts down. However, when a hang occurs, the system either partially or completely stalls and most services become unresponsive or respond to user inputs with obvious latency. When a fault that leads to hanging is generated, external input for debugging cannot be supplied. Therefore, identifying whether the software stopped operating because of a problem caused by the software or hardware that stopped operating is challenging.

2.2. Related Research

2.2.1. Detection of Transient or Intermittent Faults

Several previous studies have sought to develop methods to determine whether a fault is a transient or intermittent fault in the CPU. These methods are based on adding logic to determine whether the fault is caused by the hardware or software.
Examples of this approach can be found in the works of Bower et al. [16] and Constantinides et al. [17]. The method proposed by Bower et al. [16] adjusts the logic of the CPU processor to monitor the execution of instructions and recognize malfunctions caused by incorrect instructions. However, the limitation of this method is that it only works in CPUs designed to detect faults. The approach proposed by Constantinides et al. [17] identifies CPU malfunctions by adjusting the instruction set. However, the limitation of this method is that faults can be detected only in a CPU with an adjusted instruction set, as demonstrated in the method of Bower et al. [16]. In addition, this method regularly interrupts CPU execution for testing and debugging, disrupting the real-time execution environment.
The method proposed by Rashid et al. [10] detects transient or intermittent faults by monitoring the software execution. This method works by backtracking the state of the application based on a crash dump when a system crash occurs due to a transient or intermittent fault. However, although this method can obtain information on the execution of software and registers before the fault occurs, it cannot simultaneously identify the execution environment. Furthermore, as transient or intermittent faults do not always lead to a system crash, the application of this method is limited.
Methods for detecting transient or intermittent faults by simultaneously monitoring both hardware and software have also been developed. For example, Li et al. [18] proposed a co-operative hardware–software solution to detect CPU malfunctions. This approach detects faults that can recur, such as transient faults in the hardware. However, as non-deterministic hardware faults generated during the execution of hardware are unlikely to recur, this method is inappropriate.

2.2.2. Detection of Hang or Timing Faults in the Software

Runtime faults in the software can be detected using a variety of methods based on kernel dumping, shadow memory, capture and replay, and trace [19]. However, these methods rarely detect malfunctions that lead to hanging, as hanging occurs irregularly. In addition, a fault is not considered as such in the system unless it occurs during hanging. Various studies [20,21] have focused on detecting software outages, but these outages are for one application and do not detect any faults that appear to have crashed the entire system.
The primary method for detecting faults that lead to hanging is based on tracing all execution information [22,23]. A system hang detector [22] uses the counter of an instruction executed during a context switch. This method, which determines the system to be hanging when the value of the counter exceeds a maximum value, can be applied only when a process or the OS stop operating. In [23], hardware instrumentation is used to monitor the hardware and to obtain software counters for the OS code. As this method uses hardware, it has a low performance overhead. However, hanging cannot be detected if the event under investigation arises in an OS that has stopped operating.

2.2.3. Distinguishing Hardware and Software Faults

Few studies on the discrimination of faults generated by hardware or software have been reported. Methods to detect intermittent faults in the CPU and faults that lead to hanging depend on knowledge of the existence of faults in the hardware and software. Dadashi et al. [24] proposed a framework for integrating hardware and software to diagnose intermittent faults. In the hardware framework, all information on the execution of instructions is obtained. When a crash occurs due to a fault, the system is rebooted using the software. In addition, representation information is used to identify whether a crash is caused by an intermittent fault in the CPU or a software problem.
The method proposed by Dadashi et al. is the most similar to our approach in that it identifies whether an intermittent fault generated in the CPU is caused by the hardware or software. This approach does not require any adjustment of the hardware or software. However, its limitation is that only faults leading to a system crash can be detected.

3. Method Distinguishing Between Hardware and Software Faults

In this study, we propose a new method to identify whether a fault that occurred after the integration of hardware and software originated from the hardware or software, as well as determining the hardware (if applicable) that caused the fault. Our approach requires information on the hardware and software execution. To collect the data, the overhead in the real-time environment must be minimized. As shown in Figure 1, our method only collects optimized information in the real target, whereas the analysis is performed in the development environment. The Data Logging module mounted on the test target hooks the system when collecting data. This makes it possible to log only the minimum amount of data needed at the most optimized location for fault classification. In the Distinguishing Faults module, data collected from the target are analyzed to distinguish whether the defect originated from the hardware or software.
The proposed method can be applied to various OSs and CPUs, but in order to clearly demonstrate the core principle of the approach, Linux and Cortex A15 based on ARMv7-a architecture are used as examples. As mentioned in Section 2, we focus on distinguishing CPU intermittent faults from software faults. We also focus on distinguishing the faults caused by software hangs from those caused by the hardware. Our method can distinguish between hardware and software defects without a separate hardware device.
Our method distinguishes whether the defect is a CPU defect or a software defect in an embedded system which has been confirmed to have a defect. The following assumptions are required:
  • Assumption 1—The target system has already been confirmed to have defects during integration testing. Our approach is not to detect faults, but to identify where the cause of a fault (or faults) is in a system where it has already been detected.
  • Assumption 2—There are no defects in the hardware and OS, other than the CPU.
  • Assumption 3—Applications do not contain excessive input/output (I/O) waits or excessive memory accesses.
  • Assumption 4—The faults to be identified cannot be analyzed with software fault detection tools or hardware debuggers such as trace32 or probes. Furthermore, the location of the defect changes each time or the defect is not reproducible.

3.1. Data Logging

If we collect all available data on system execution, the overhead is significant. Therefore, we collect data for fault identification only when a hardware device is accessed. Specifically, an application should call the system call of the kernel to access a hardware device in Linux. The device driver for the hardware is created in the kernel and the application is accessed by calling a system call to access the device driver. As depicted in Figure 2a, the application can access a hardware device through the virtual file system of the kernel when the system call is executed. Moreover, sys_read(), sys_write(), and sys_ioctl() are among the most frequently used system calls for hardware access. In this study, these three calls are hooked to obtain the necessary data for fault diagnosis only when they are executed.

3.1.1. Kernel Module for System Call Hooking

System call hooking indicates that a kernel module called the Shark agent executes a hooking system call instead of the original system call (see Figure 2a). When this agent is initialized, the value of sys_call_table is adjusted and the hooking system calls (i.e., hook_sys_read(), hook_sys_write(), and hook_sys_ioctl()) are executed instead of sys_read(), sys_write(), and sys_ioctl(). The hooking system call functions as an existing system call and perform hardware and software data logging to identify the faults. In terms of hook_sys_write(), the data required before or after its original sys_write() is called are obtained and stored in the log file.

3.1.2. Software and Hardware Data for Distinguishing Faults

The minimal data obtained for distinguishing faults consist of software and hardware data (Figure 2b).
  • Data obtained from software include system call results, parameters, values loaded from the memory, and the call stack. The values loaded from the memory and the values of the CPU performance counters are used to determine the occurrence and location of data errors.
  • The data obtained from the CPU hardware include the CPU ID and performance counters. The CPU ID indicates in which CPU the instruction was processed when a system call was executed. The performance counters that can be collected by the CPU depend on the type of CPU. Typically, there are various performance counters. In this study, faults are distinguished based on transient or intermittent faults generated in the CPU that seem to be caused by incorrect software operation. Thus, only performance counters related to this situation are obtained.
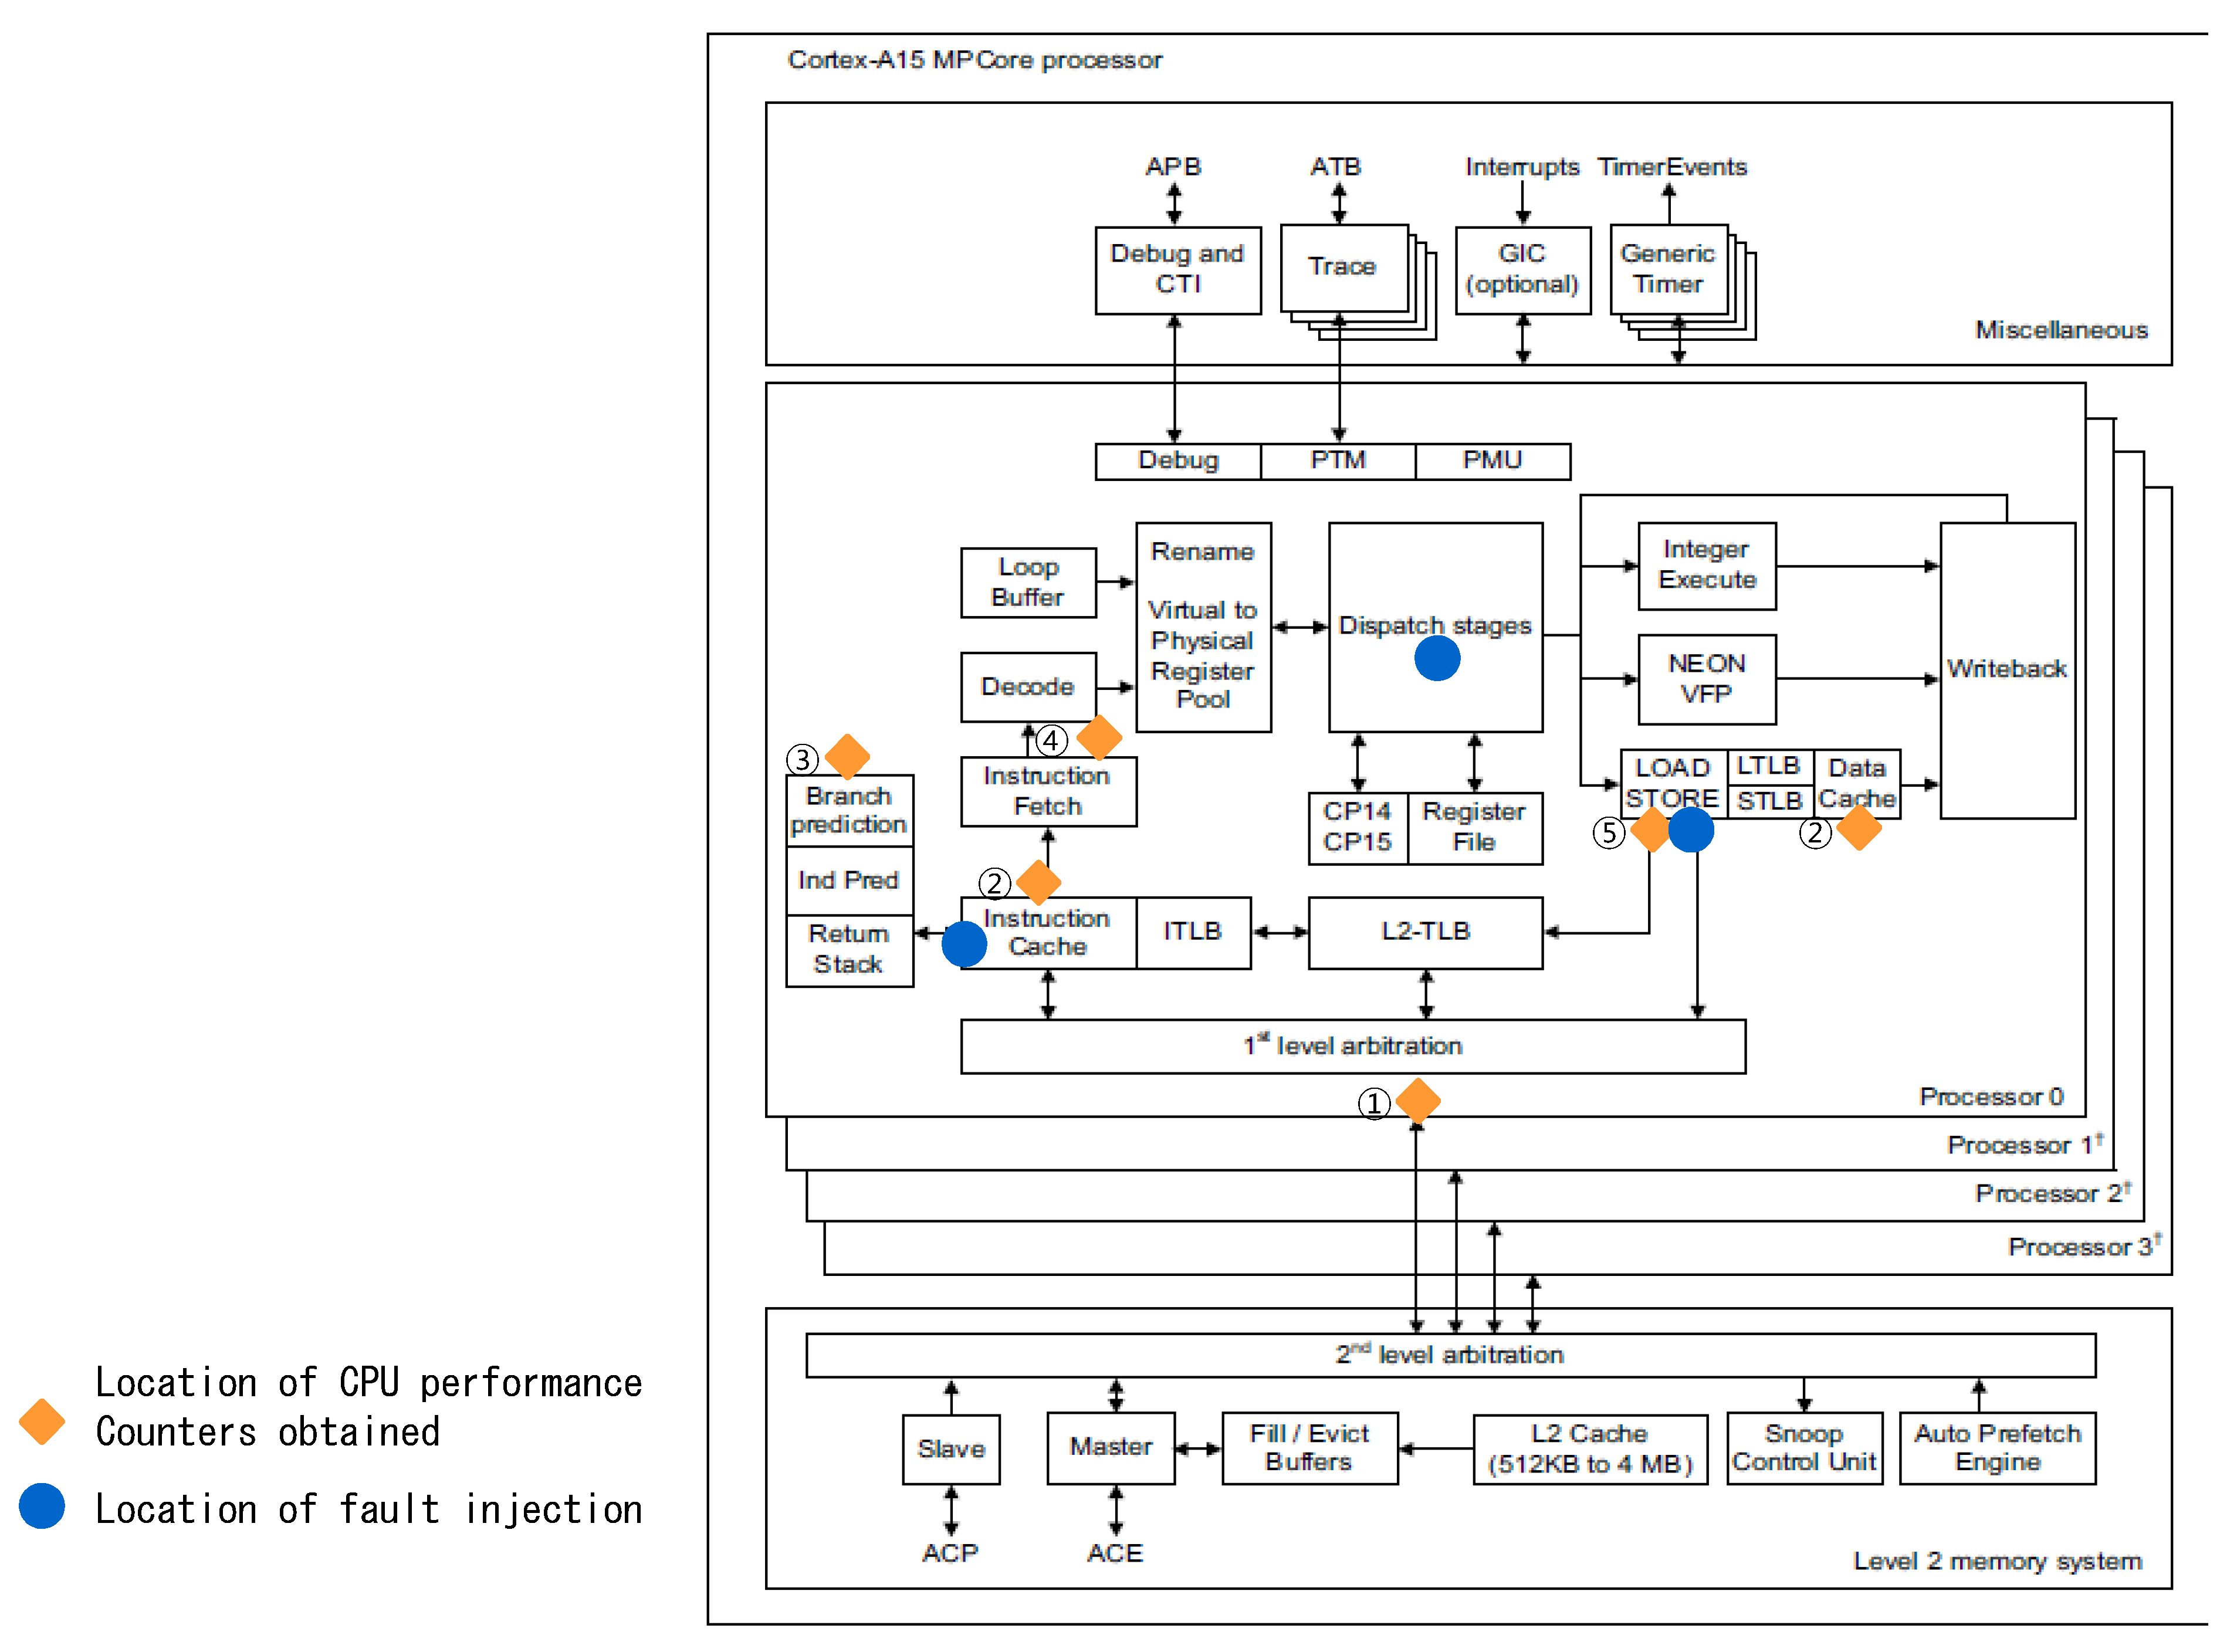
Figure 3 shows the location of the data for performance counters obtained from the Cortex-A15 CPU and the location of faults artificially injected to conduct an experiment using our method. Further details on fault injection are provided in Section 4. The existence and types of performance counters vary according to the type of CPU. The performance data required in this study were obtained from ARM CPUs.
  • For the Cortex-A15 CPU, performance counters such as the CPU cycle counter, L1/L2 cache access/refill/miss counters, BPU access/refill/miss counter, stall counter, and error counter were obtained.
Figure 3 ① shows the CPU cycle counter, which is a performance counter that counts CPU clock cycles. Figure 3 ② and ③ are performance counters related to the L1 cache and BPU, respectively. The L1 cache miss ratio is measured using the L1 cache access/refill/miss counter, while the BPU miss ratio is measured using the BPU access/refill/miss counter. The L1/L2 cache and BPU counters are used to determine whether the CPU has processed an instruction or a retry has occurred. Figure 3 ④ shows a stall counter, which monitors the number of stalls generated in the CPU. A stall in the CPU means that the command processing pipeline stops operating for a certain reason. Such a stall is generated when a crash occurs due to a lack of resources in the CPU, such that a task is suddenly switched to another during pipelining, or where the result of the previous command depends on the current command [25]. Even if a retry or stall occurs, not all of them lead to defects. However, as a retry or stall can occur due to CPU faults, relevant performance data are obtained. Figure 3 ⑤ shows an error counter, which indicates the number of errors generated in the internal memory of the CPU.

3.2. Fault Classification and Diagnosis of Factors Leading to CPU Faults

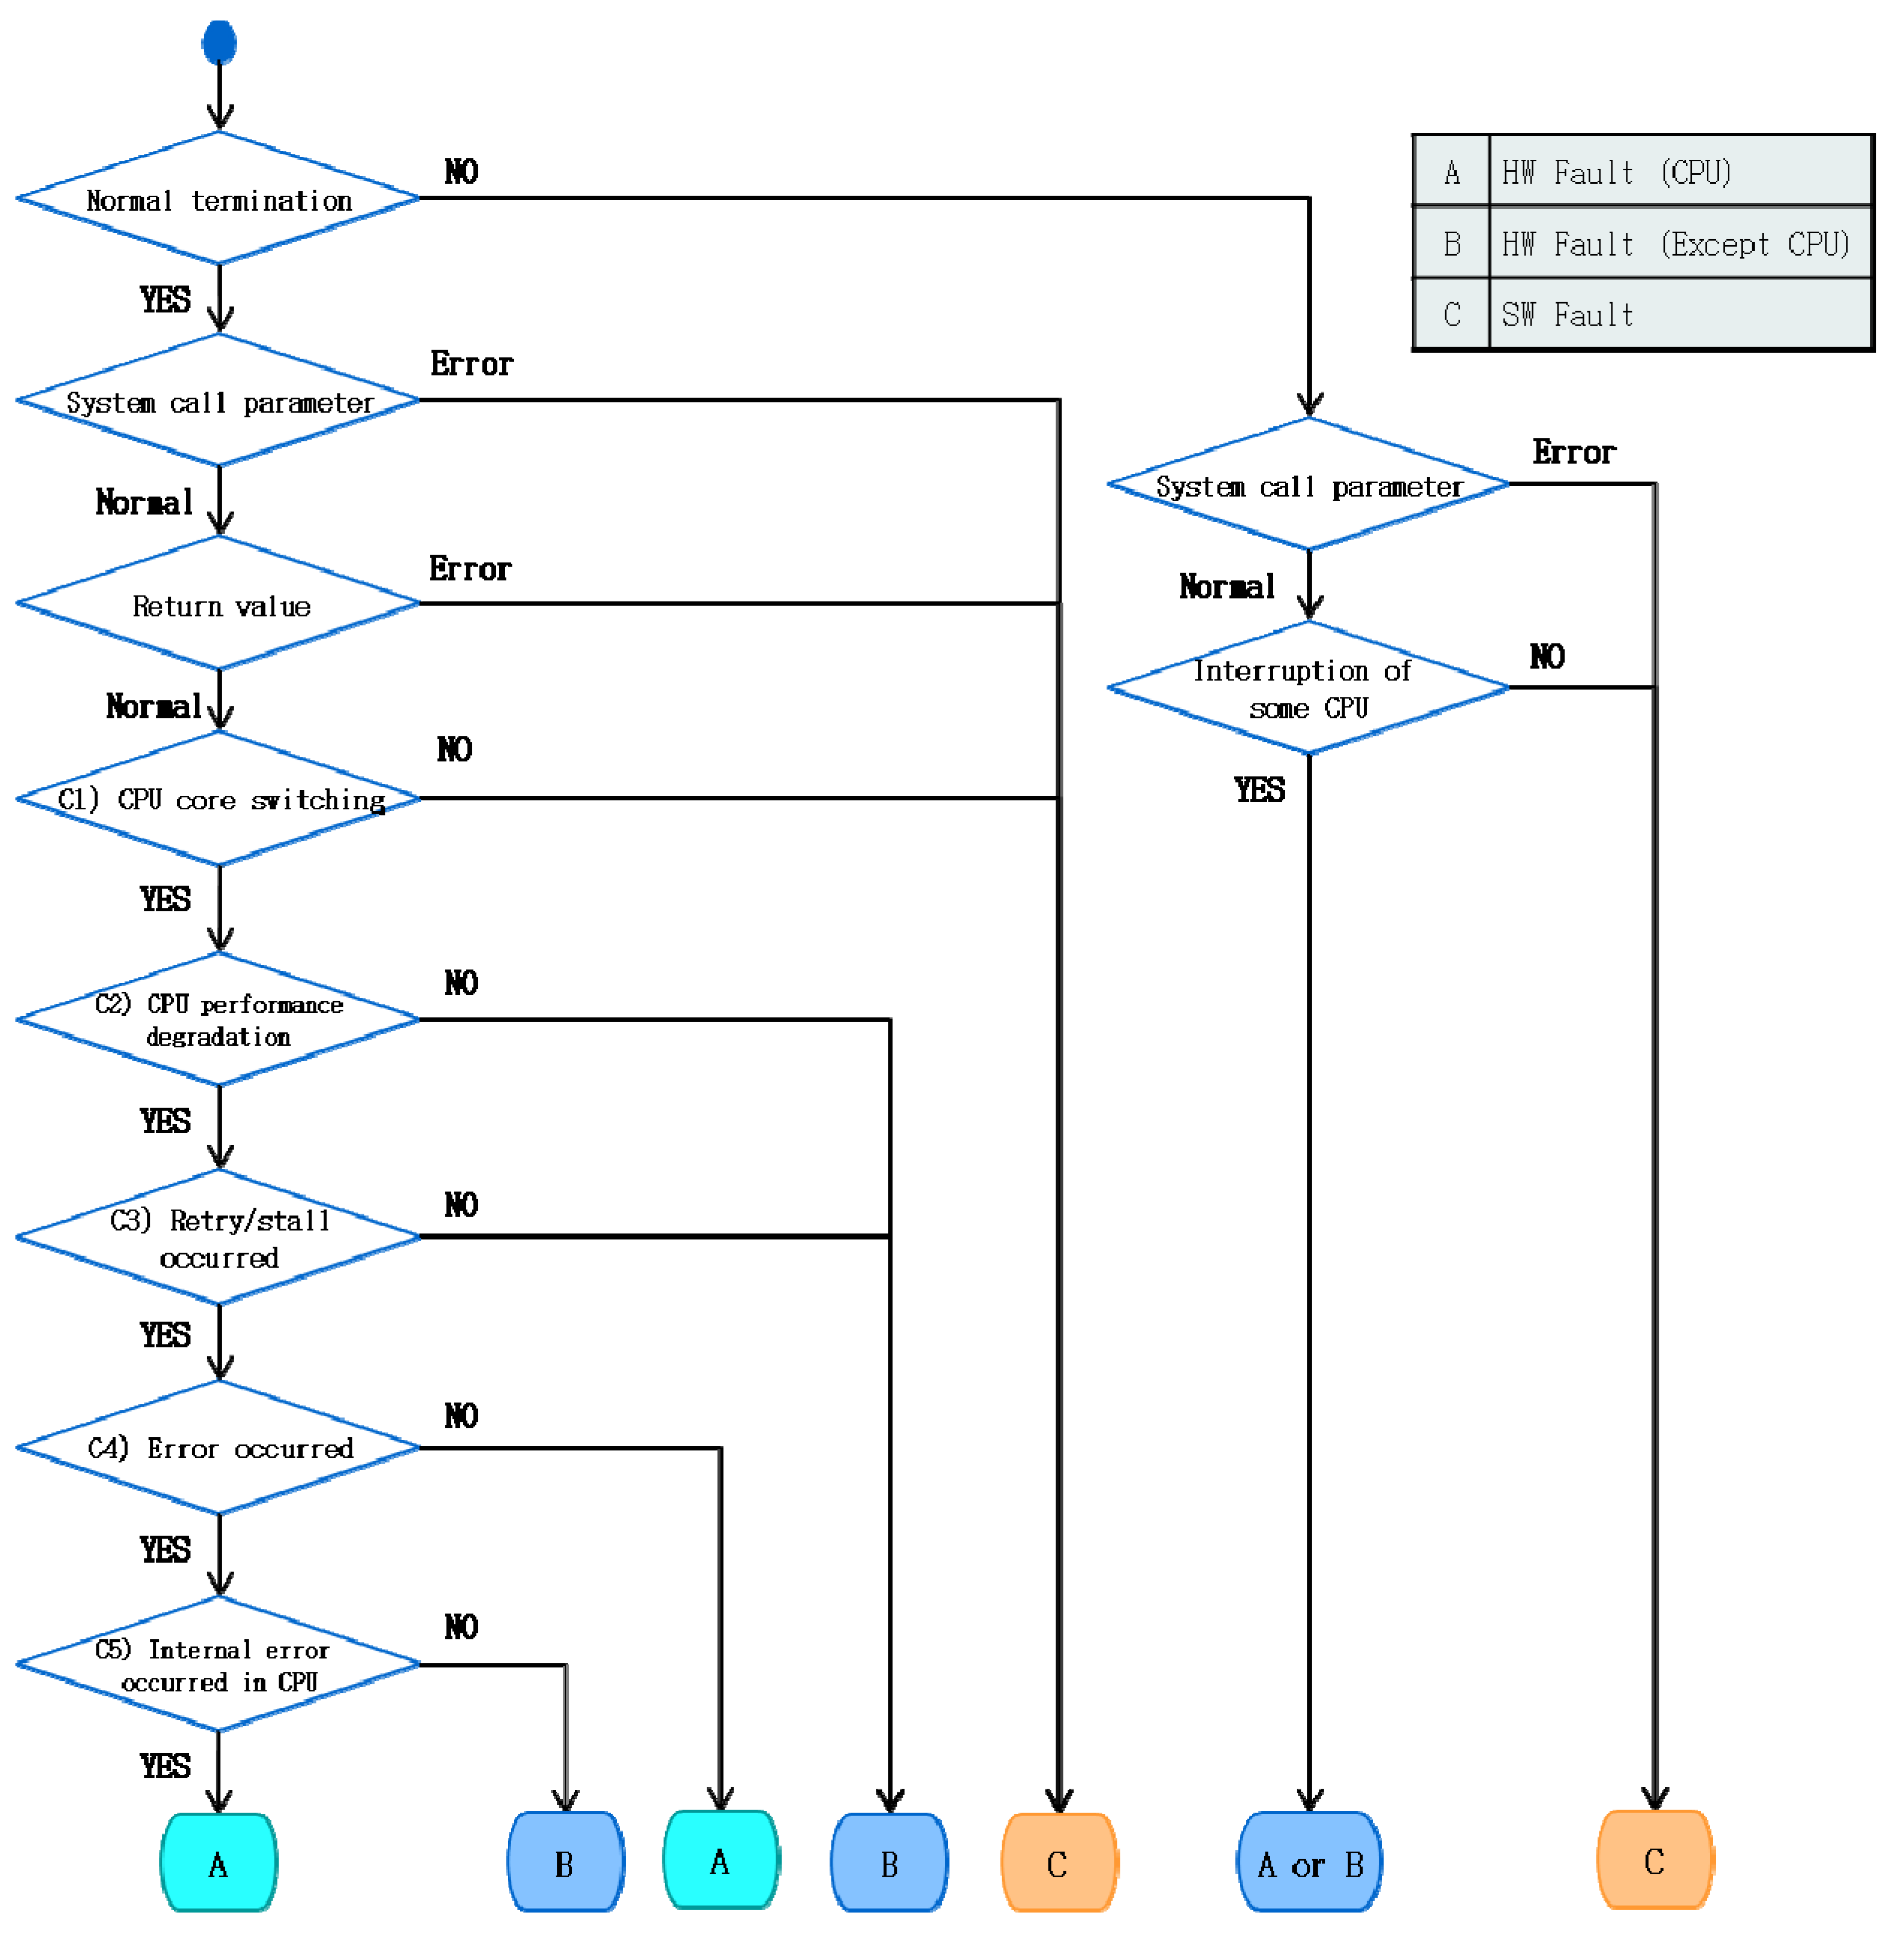
The second important contribution of our method relates to the extent to which our method can classify a detected fault as being either a hardware or software fault by analyzing the data, as shown in Figure 2b, obtained by the system call-hooking agent presented in Figure 2a. The process of distinguishing faults varies according to the normal termination of the system. Figure 4 illustrates the process of distinguishing a fault and diagnosing the cause of a CPU fault. It is assumed that faults already exist in the target system of fault classification.

3.2.1. Normal Termination of Applications

When an application is terminated normally, the method identifies whether the detected fault is a software fault. If this is not the case, the method determines whether the fault is a hardware fault. If it is a hardware fault, our approach assesses whether it is a CPU fault.
(a) Identification of software faults
First, using the execution result of the hooking target system call to access the hardware, our method distinguishes whether the detected fault is a software fault. The hooking target system call occurs when the software accesses the hardware through the virtual file system of the kernel. The hooking target system calls in Linux include sys_read(), sys_write(), and sys_ioctl(). If an incorrect value is input into a parameter before a system call occurs, this can be determined as being due to the software. Thus, in this case, the fault is identified as a software fault. Another point of assessment is whether the incorrect parameter depends on the system call. In addition, even if the parameter has a normal value, the fault is identified as a software fault if the return value is an error value of a type included among software faults.
(b) Identification of hardware faults and diagnosis of causes of CPU faults
When the detected fault is not clearly recognized as a software fault in the first stage, it can be determined to be a hardware fault. This can be done by applying the five criteria indicated below based on the CPU ID, hardware performance counters, and values loaded from the memory (except for the software data). At this point, the hardware that generated this fault can be identified.
(C1) Occurrence of CPU core switching such that performance is consistently maintained
Changes in the CPU cycle are monitored to ensure that CPU cycles remain within a certain range of values, where the CPU ID is checked to determine the occurrence of CPU core switching. It is checked whether the CPU cycle is within the range of Expression (1). The range of values that needs to be kept depends on the type of CPU or type of application. The constant α is calculated based on the CPU cycles of a normally running system and not on the faulty system (see Section 4.2.3 for further details):
(1 − α)AC ≤ (1 + α)A,
where
A: mean value until the current CPU cycle;
C: CPU cycle counter;
α: constant that varies according to the CPU/application type.
CPU core switching is supported by the kernel and does not indicate a fault. However, after CPU core switching, if no operation is performed on the previously used CPU ID or if the CPU cycle fluctuates rapidly, it is determined that a fault may have occurred. The CPU cycle may fluctuate due to an event and, thus, other performance counters are checked to determine it as a fault. If the method is run on a single CPU, C1) is omitted and C2) is applied.
(C2) Performance degradation of CPU
An increase in the number of CPU cycles increases the amount of time required for operation processing, leading to a decrease in CPU performance. Performance degradation in a CPU occurs when the CPU cycle is beyond the range of the expression in Criterion 1. Such degradation occurs for various reasons, such as delayed processing due to an interruption during task processing in the CPU or delayed data load or store tasks. Thus, the detected fault cannot be recognized as a CPU defect based only on performance degradation in the CPU. However, CPU performance tends to decrease before a fault occurs [26]. Therefore, a CPU fault is identified when Criteria 3 and 4 are both satisfied. If a fault is generated when the performance of the CPU is maintained, the fault is determined to be caused by other hardware, such as memory.
(C3) Occurrence of retry or stall
A retry or stall can occur if the CPU cannot perform an operation normally or if it takes a long time to load/store data. The occurrence of a retry or stall is determined using the BPU miss ratio and stall counter. If the BPU miss ratio and stall counter are outside the ranges of their average value, it is determined that a retry/stall has occurred. A fault cannot be determined based only on the occurrence of a retry or stall; however, the occurrence of a retry or stall can be used to determine whether the detected fault is a CPU fault. If a retry or stall did not occur, we deduce that some hardware other than the CPU reduced the CPU performance and generated the fault.
(C4) Occurrence of errors
An examination is performed to determine whether an error was generated in the data exchanged between the CPU, memory, and external devices. For this purpose, an error type returned from the system call and an error counter are used. If the error type is less than 0 or the error counter ≠ 0, we conclude that an error has occurred. If an error was not generated despite a decrease in the CPU performance and the occurrence of a retry and stall, our analysis indicates that the detected fault is a CPU fault caused by an internal CPU program rather than a problem resulting from data processing.
(C5) If an error is confirmed to have occurred by Criterion 4, the error counter and values stored in the memory are used to determine whether the error was generated in the internal CPU. The error counter increases when an error occurs in the cache data in the CPU. Accordingly, an increase in the error counter indicates that the cache in the CPU includes a fault. If the error counter increases and the value stored in the memory is incorrect (data), the analysis indicates that a fault has occurred in other hardware, such as the memory, rather than in the internal CPU.

3.2.2. Abnormal Termination of Applications

When an application is terminated abnormally due to crashing, aborting, or hanging, the return values or error numbers caused by the errors cannot be identified. In this case, faults are distinguished using the system call parameters, CPU ID, and call stack. A fault is recognized as a software fault if the parameter value of the system call is incorrect, such as for a fault occurring during the normal termination of an application.
When the system call parameter has a normal value, the fault is identified according to the CPU operation. If a program (e.g., Daemon) is executed in another CPU after an application has terminated abnormally, the fault is identified as a software fault; otherwise, it is distinguished as a hardware fault.
It is difficult to distinguish between a crash caused by an exception in CPU pipeline due to a CPU transient/intermittent defect and a crash due to invalid memory access. If a crash occurs due to invalid memory access by the software, it can be detected with memory fault detection tools or debuggers and can be reproduced. Thus, according to Assumption 4, such a situation is excluded.

3.3. Automation

The solution proposed in Section 3.1 and Section 3.2 was developed as a tool named Shark, which currently supports Linux based on ARM Architecture. Shark consists of a Shark agent and a test monitor (Figure 5).
(1) Shark agent: This kernel module is implemented to enable the solution proposed in Section 3.1 to operate in the target system, in order to conduct the test. It consists of the following three components:
  • Initializer: This module initializes the other components (SharkDriver and Logger) of the Shark agent and hooks the system call table in the kernel to execute the system call of SharkDriver instead of the original system call.
  • SharkDriver: This kernel library module executes the system call, which is adjusted to obtain data to distinguish faults.
  • Logger: This module logs the data obtained through SharkDriver.
(2) Test monitor: This program implements the fault classification solution proposed in Section 3.2 to operate in the host computer. It distinguishes a fault that occurs in the system as either a hardware or software fault by analyzing the data logged in the Shark agent. Then, it informs the user about the types and occurrence times of the faults, CPU ID, and process ID. When the detected fault is identified as a hardware fault, the program identifies the hardware—including the CPU and memory—responsible for causing the fault. However, in this study, we focus only on CPU faults.
Shark is executed by the following five-step process:
  • Step 1. When the Shark agent is applied to the target system for testing, the initializer operates the SharkDriver module and Logger module in the kernel.
  • Step 2. SharkDriver examines the system call table and switches the system call from accessing hardware to a hooked system call.
  • Step 3. When the system call targeted for hooking is called in the application, the corresponding hooked system call is executed to obtain the necessary hardware and software data to distinguish faults.
  • Step 4. The Logger stores the data obtained in a log file.
  • Step 5. The Shark test monitor identifies the fault by analyzing the log file and displays the types and occurrence times of the fault, CPU ID, and process ID.

4. Empirical Study

In our empirical study, which analyzes the effectiveness of our method, we address the following three research questions:
  • RQ1. How accurately can the proposed method detect faults?
  • RQ2. How accurately can the proposed method distinguish hardware faults from software faults?
  • RQ3. How much overhead does the proposed method generate?

4.1. Experimental Environment

Although the method proposed in this study applies to all test stages after the integration of the hardware and software, in our experiment, the method was applied to the testing stage of the embedded system. Moreover, we assumed that the hardware and software did not have faults themselves in order to verify how accurately our method could distinguish artificial faults injected in the hardware.
The experiment was conducted on the evaluation board ODROID-XU3 and in the GEM5 simulator [27,28]. The Exynos5422 system on a chip in ODROID-XU3 has an octa-core processor consisting of Cortex A15 and Cortex A7 [29,30,31]. The GEM5 simulator is a full-system simulator that models computer processors, memory, and other devices. As it supports various architectures, such as ARM, x86, and Alpha, Shark—an ARM-based automated tool—was readily accommodated. In the case of ODROID-XU3, Ubuntu 16.04 and Linux kernel 3.10 were installed as a 32-bit system. In the case of the GEM5 simulator, 64-bit Ubuntu 20.04 and Linux kernel 5.4 were installed.
The Princeton Application Repository for Shared-Memory Computers (PARSEC) benchmark was used in the experiment [32]. Among the 13 applications of the PARSEC benchmark, six ported in the ARM-based system for operation were applied in ODROID-XU3 and the GEM5 simulator to perform the system test in the experiment (Table 3). However, canneal, dedup, raytrace, swaption, vips, and x264 were excluded from the applications of the PARSEC benchmark as they either did not have the libraries required for porting to an ARM-based system or they required source code modification. Bodytrack, which was ported based on ARM, was also excluded, given that it terminated due to an error that occurred when this application was executed in the system.
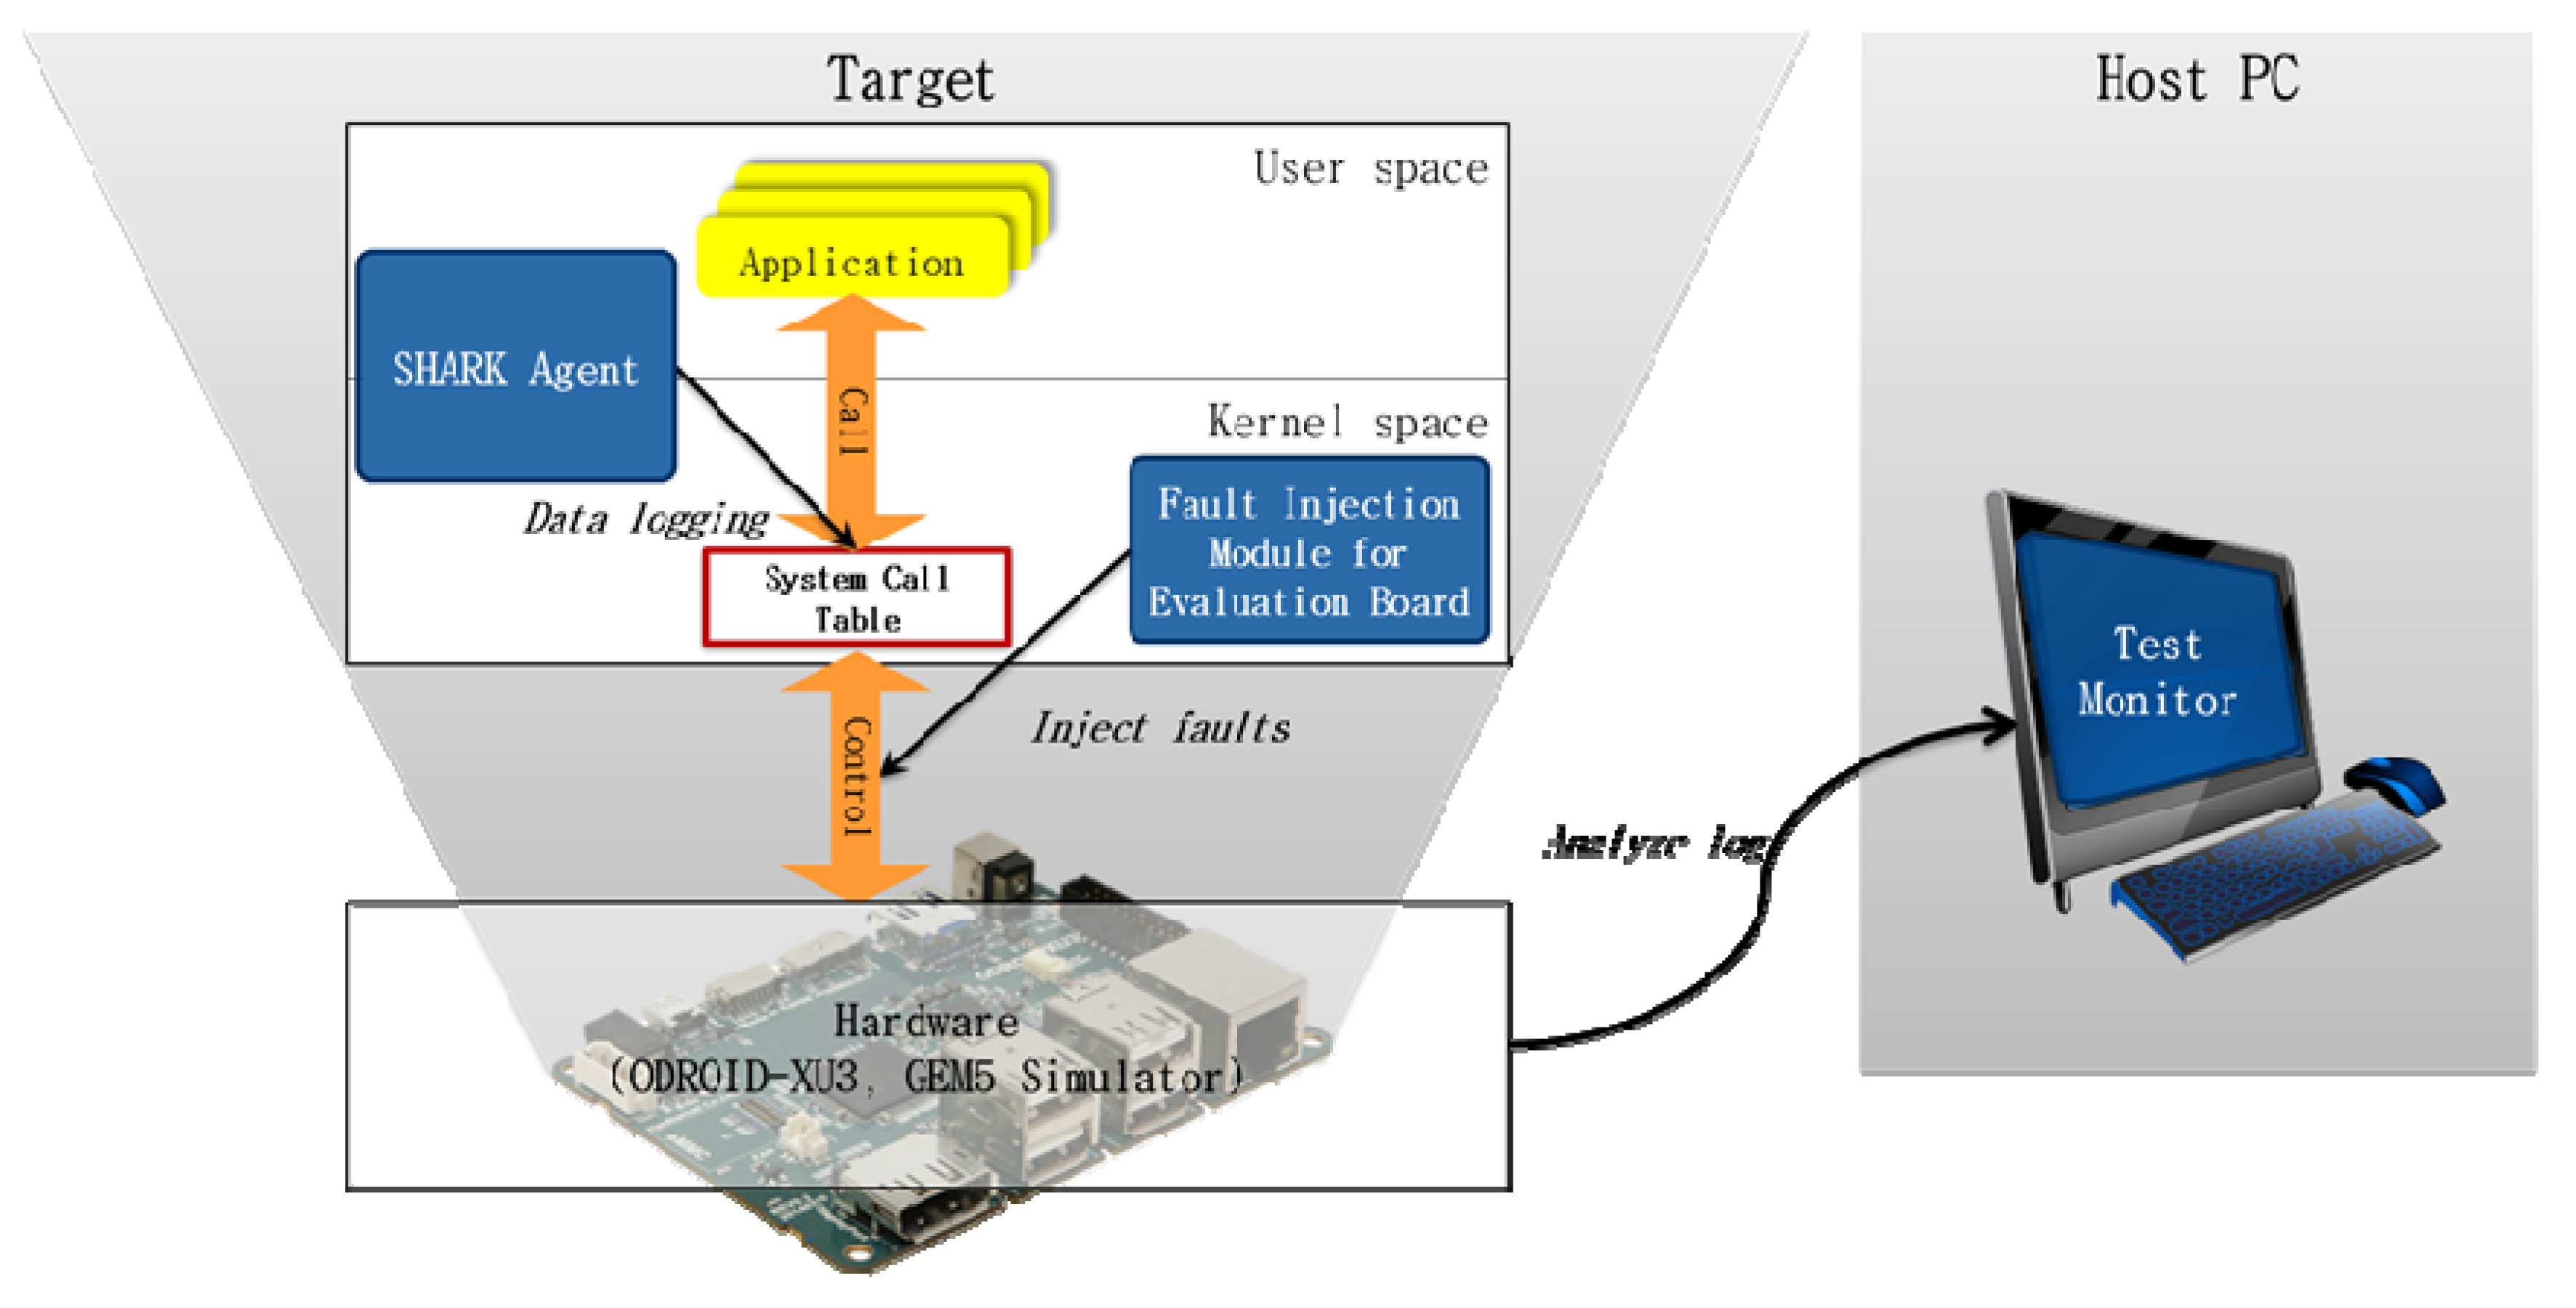
Figure 6 shows the experimental environment in which the Shark agent was applied to the target systems, ODROID-XU3, and GEM5 simulators to perform the system test. The log collected by the Shark agent was analyzed by executing the test monitor on the host computer. This experiment was conducted by artificially injecting faults into the hardware and software. In the case of ODROID-XU3, as the hardware was only modified to a limited extent, faults were injected using the fault injection module. The fault injection module is a software module that artificially injects faults while the system under test is operating. In the case of the GEM5 simulator, as the code related to the internal operation of the CPU could be modified, faults were injected directly into the code. The types of faults that were artificially injected for the experiment and the methods used to inject them are described in detail in Section 4.2.

4.2. Experimental Design

To artificially generate faults that can occur after hardware and software integration, hardware and software faults were injected into the target system. The experimental results were then analyzed in order to examine whether the method proposed in this study successfully identified the injected faults in practice.

4.2.1. Design of the Injected Faults

Hardware and software faults have diverse effects on the state and operation of a system, such as detailed registers and flow of program control [12]. In particular, CPU transient or intermittent faults and faults that cause software to hang should be avoided in order to minimize sophisticated and non-deterministic effects.
(1) CPU intermittent faults
We considered all the processes that involve the processing of instructions in the CPU as the target of fault injection. Both ODROID-XU3 and the GEM5 simulators are based on ARM architectures; thus, the injection target was the same. Components related to instruction processing are instruction fetch, instruction decode, instruction dispatch, integer execute, and load/store unit. We injected faults into the instruction fetch, instruction dispatch, and load/store units, as shown in Figure 3. Other components were excluded as the target for fault injection, as adjustment of the register value—which is required for fault injection—could not be performed on these components and as they are protected by ECC [30].
(2) Software faults that lead to hanging
As indicated in Section 2.1, correctly distinguishing faults that lead to hanging as either hardware or software faults is difficult in an environment where the hardware and software are integrated [33]. Among the types of software faults described in Table 2, interface or timing problems can cause hanging. However, these problems do not always occur alongside hanging. To select the faults to be injected, we analyzed the time of fault occurrence and hanging according to the causes of faults, as shown in Table 4.
When a timing fault is generated by an incorrect input and output timing or data loss, hanging can occur. This fault results in an idle state of constantly waiting for data due to the data loss that occurs during data transfer. The timing fault is irregular in terms of occurrence time and location [14]; this non-deterministic characteristic makes it complicated to accurately identify the occurrence time of the fault. Moreover, when this fault occurs, the hardware or software seems to stop operating, leading to difficulty in fault classification. Therefore, this fault was considered appropriate to verify the effectiveness of our method. However, as the target program in this experiment operated independently, timing faults due to data loss—which are frequently generated when more than two processes or threads communicate—were unlikely to occur. Thus, in this experiment, we injected a timing fault generated by incorrect input/output (I/O) timing.
Most faults related to the interface do not lead to hanging. Moreover, they are generated in a consistent location as they are caused by the interface based on a function call relation. For these reasons, these faults are easily distinguished from hardware faults, excluding them from consideration as target faults to be injected.

4.2.2. Hardware and Software Faults and Fault Injection Methods

Table 5 specifies the four types of hardware and software faults that we selected through the fault design process detailed in Section 4.2.1. The period and method of artificially generating these faults through injection were as follows:
  • Hardware CPU faults were injected into the instruction fetch, instruction dispatch, and load/store unit. These faults were injected by performing bit flipping on the register values corresponding to the CPU components, as shown in Figure 7a. Upon injection of a CPU intermittent fault into the evaluation board, the fault injection module was used to inject the fault immediately before a system call occurred. Injection of a fault into the simulator modified the code directly and the fault was injected randomly.
  • Software faults were I/O timing faults interrupting the reception of appropriate responses when an I/O request occurred. This fault was injected to generate a time-out event in the CPU by converting the running state of a process or thread into a wait state before a system call related to I/O is executed (see Figure 7b). As an I/O timing fault leads to hanging, it was injected only once before a system call occurred.

4.2.3. Variables for Determining Experimental Results

The criteria for determining faults were established in Section 3.2. The value α in the equation, which is used to indicate whether the CPU performance decreases or a retry or stall occurs, varies according to the type of CPU or type of application. When the value of the constant α decreases, the rate at which performance is determined to be degraded increases (even though the performance did not degrade). Similarly, when the value of the constant α increases, a fault is not detected, although the performance decreases.
To accurately detect faults in our experiment, the false-positive rate was measured by adjusting the value of α within the allowable range of a CPU cycle and retry or stall occurrence. The false-positive rate was measured by adjusting the mean value of the CPU cycle at intervals of 5% in the range of 20 to 60%. The measured results indicate that the false-positive rate was the lowest (at 2%) when the mean value of alpha was 45% (Figure 8a). Figure 8b presents the results of measuring the false-positive rate according to the occurrence of retry or stall when α = 0.45 for the CPU cycle. As the difference according to the change in the mean value was insignificant, we selected a random value (0.25) to determine the occurrence.

4.2.4. Experimental Measurements

The accuracy of detecting faults related to RQ1 was measured based on the proportion of injected faults that were detected. The fault detection ratio was calculated based on the ratio of the number of faults detected by Shark to the number of practically executed faults among the injected faults (Equation (2)):
F a u l t   d e t e c t i o n   r a t i o   =   N u m b e r   o f   f a u l t s   d e t e c t e d N u m b e r   o f   f a u l t s   e x e c u t e d   d u r i n g   t h e   b e n c h m a r k   a m o n g   t h e   i n j e c t e d   f a u l t s × 100
Fault classification related to RQ2 was determined by examining how accurately the proposed method identified the injected fault as a hardware or software fault. The fault classification ratio was calculated as the ratio of the number of faults correctly distinguished as either hardware or software faults to the total number of detected faults (Equation (3)):
F a u l t   c l a s s i f i c a t i o n   r a t i o = N u m .   o f   f a u l t s   c o r r e c t l y   d i s t i n g u i s h e d   a s   h a r d w a r e   o r   s o f t w a r e   f a u l t s N u m b e r   o f   d e t e c t e d   f a u l t s × 100
The overhead related to RQ3 was calculated by measuring the system performance delay ratio and code increase ratio, according to the proposed method (Equations (4) and (5)):
P e r f o r m a n c e   d e l a y   r a t i o = P r o g r a m   e x e c u t i o n   t i m e   i n   c a s e   o f   t o o l   a p p l i c a t i o n P r o g r a m   e x e c u t i o n   t i m e P r o g r a m   e x e c u t i o n   t i m e
C o d e   i n c r e a s e   r a t i o = P r o g r a m   c o d e   s i z e   i n   c a s e   o f   t o o l   a p p l i c a t i o n P r o g r a m   c o d e   s i z e P r o g r a m   c o d e   s i z e

4.2.5. Number of Injected Faults

Four types of hardware and software faults (Table 5) were artificially generated in the experiment. Figure 6 indicates that the four types of faults were artificially injected when the system calls of each application occurred. These faults could be generated every time these system calls were executed (Table 5). Repeated injection of the same faults in the fault injection experiment increased the probability of detecting these faults. However, in this study, the faults were injected only once while each application was running, in order to enable the fault detection ratio to be measured accurately.
  • A hardware CPU fault was injected into the evaluation board when the system calls of sys_read(), sys_write(), and sys_ioctl() were first called in the applications. Although system calls were executed several times in the applications, hardware intermittent faults occurred at sporadic intervals. Thus, faults were injected when the system calls first occurred instead of considering every system call executed in this experiment.
  • Injection of a hardware CPU fault into the simulator resulted in the code related to instruction processing being directly modified, regardless of the system call; thus, it was necessary to only inject the fault once (at random).
  • Both the evaluation board and simulator injected faults into the software in the same way. The first injected fault caused the system to hang; consequently, system calls that occurred after the first fault were not executed. In this regard, faults were injected when system calls were first executed and completed when faults were injected into the hardware.
Even if the same application were to be executed in the same environment, the occurrence of a fault would depend on whether a daemon was executed or whether an application was running in the background; thus, the experiments were performed repeatedly. Execution and termination of an application were repeated 50 times during hardware fault injection in order to ensure that the entire CPU was used. During software fault injection, execution and termination of an application were repeated 10 times.

4.3. Experimental Results

Table 6 and Table 7 presents the results obtained when injecting hardware and software faults during the experiment.

4.3.1. RQ1: How Accurately Can the Proposed Method Detect Faults?

Among the faults that were injected during the execution of an application, the number of faults detected by the Shark tool (i.e., the fault detection ratio) was measured. In the streamcluster application, sys_ioctl() was not called. Thus, 3790 faults were injected into six applications. Shark identified 3758 of these faults, with a fault detection ratio of 99.06%. More specifically, Shark detected 3259 faults among 3450 injected hardware faults, demonstrating a fault detection ratio of 94.46% (Figure 9a). In addition, it detected all 340 software faults.
The fault detection ratio was between 70% and 99.22% for the existing methods for detecting intermittent CPU faults in hardware [10,16,17,18,24] and between 70% and 95% for software fault detection methods. This implies that Shark can more accurately detect faults compared with the existing methods.
Figure 9a indicates that the ratio of detecting CPU intermittent faults was below 100% for the blackscholes, streamcluster, and fluidanimate applications. The faults that were not detected in these applications are presented in Figure 9b. This figure reveals that these faults were mainly injected into the instruction caches, except for one fault that was injected into the dispatch stage of the blackscholes application. The CPU loads and executes commands from the instruction cache or main memory.
It appears that the faults injected into the instruction cache were not detected because the CPU loaded commands from the main memory and so the commands including the injected faults were not executed. Furthermore, the injected faults in the dispatch stage or the instruction cache were not detected when they did not affect the execution of the software or system, both of which were normally terminated.

4.3.2. RQ2: How Accurately Does the Proposed Method Identify Whether the Fault is A Hardware or Software Fault?

The fault classification ratio was measured to identify the extent to which the proposed method was able to accurately distinguish whether the detected fault was a hardware or software fault. Shark was not only designed to indicate where the fault was detected, but also to determine whether the fault was caused by the hardware or software. As listed in Table 6 and Table 7, Shark accurately identified 3599 out of 3758 faults, achieving a hardware fault classification ratio of 95.77%. The ratio of correctly determined injected hardware faults was 95.35% and all software faults were correctly distinguished. Figure 10 illustrates the accuracy of our method in terms of its ability to distinguish the faults for each application.
The applications streamcluster, ferret, and freqmine caused the system to crash when hardware faults were injected. The proposed method was able to distinguish these faults with accuracy values of 100%, 97.33%, and 99.83%, respectively. For the blackscholes and facesim applications, the hardware performance before the system call differed significantly from the performance afterwards (i.e., including the injected faults), although the system did not crash. Thus, for these two applications, the proposed method was able to distinguish faults with high accuracy, at 98.06% and 100%, respectively. However, for fluidanimate, the reduction in CPU performance and the occurrence of retry or stall after the system call was insignificant, compared with before the system call and including the injected fault, leading to a low fault-distinguishing accuracy of 78.13%. This result was attributed to the fact that the fault classification method proposed in this work uses data related to the hardware performance when a system call occurs.
With respect to hardware faults, our method failed to correctly distinguish 159 of the 3259 faults injected into the instruction cache, dispatch stage, and load/store unit, resulting in fault classification ratios of 92.30%, 92.72%, and 99.91%, respectively. However, our method exhibited a higher fault classification ratio than that proposed by Dadashi et al. [24], which resulted in a fault classification ratio of 71% in the instruction fetch queue (including the injected faults) and 95% in the load/store queue. Certain faults injected into the instruction cache or dispatch stage were incorrectly distinguished in our experiment as the return value of the system call was established as abnormal, considering that a value above 0 is a normal return value for sys_read(). However, the return of a negative value indicated that the proposed method incorrectly determined the detected fault to be a software fault.

4.3.3. RQ3: How Much Overhead is Generated by the Proposed Method?

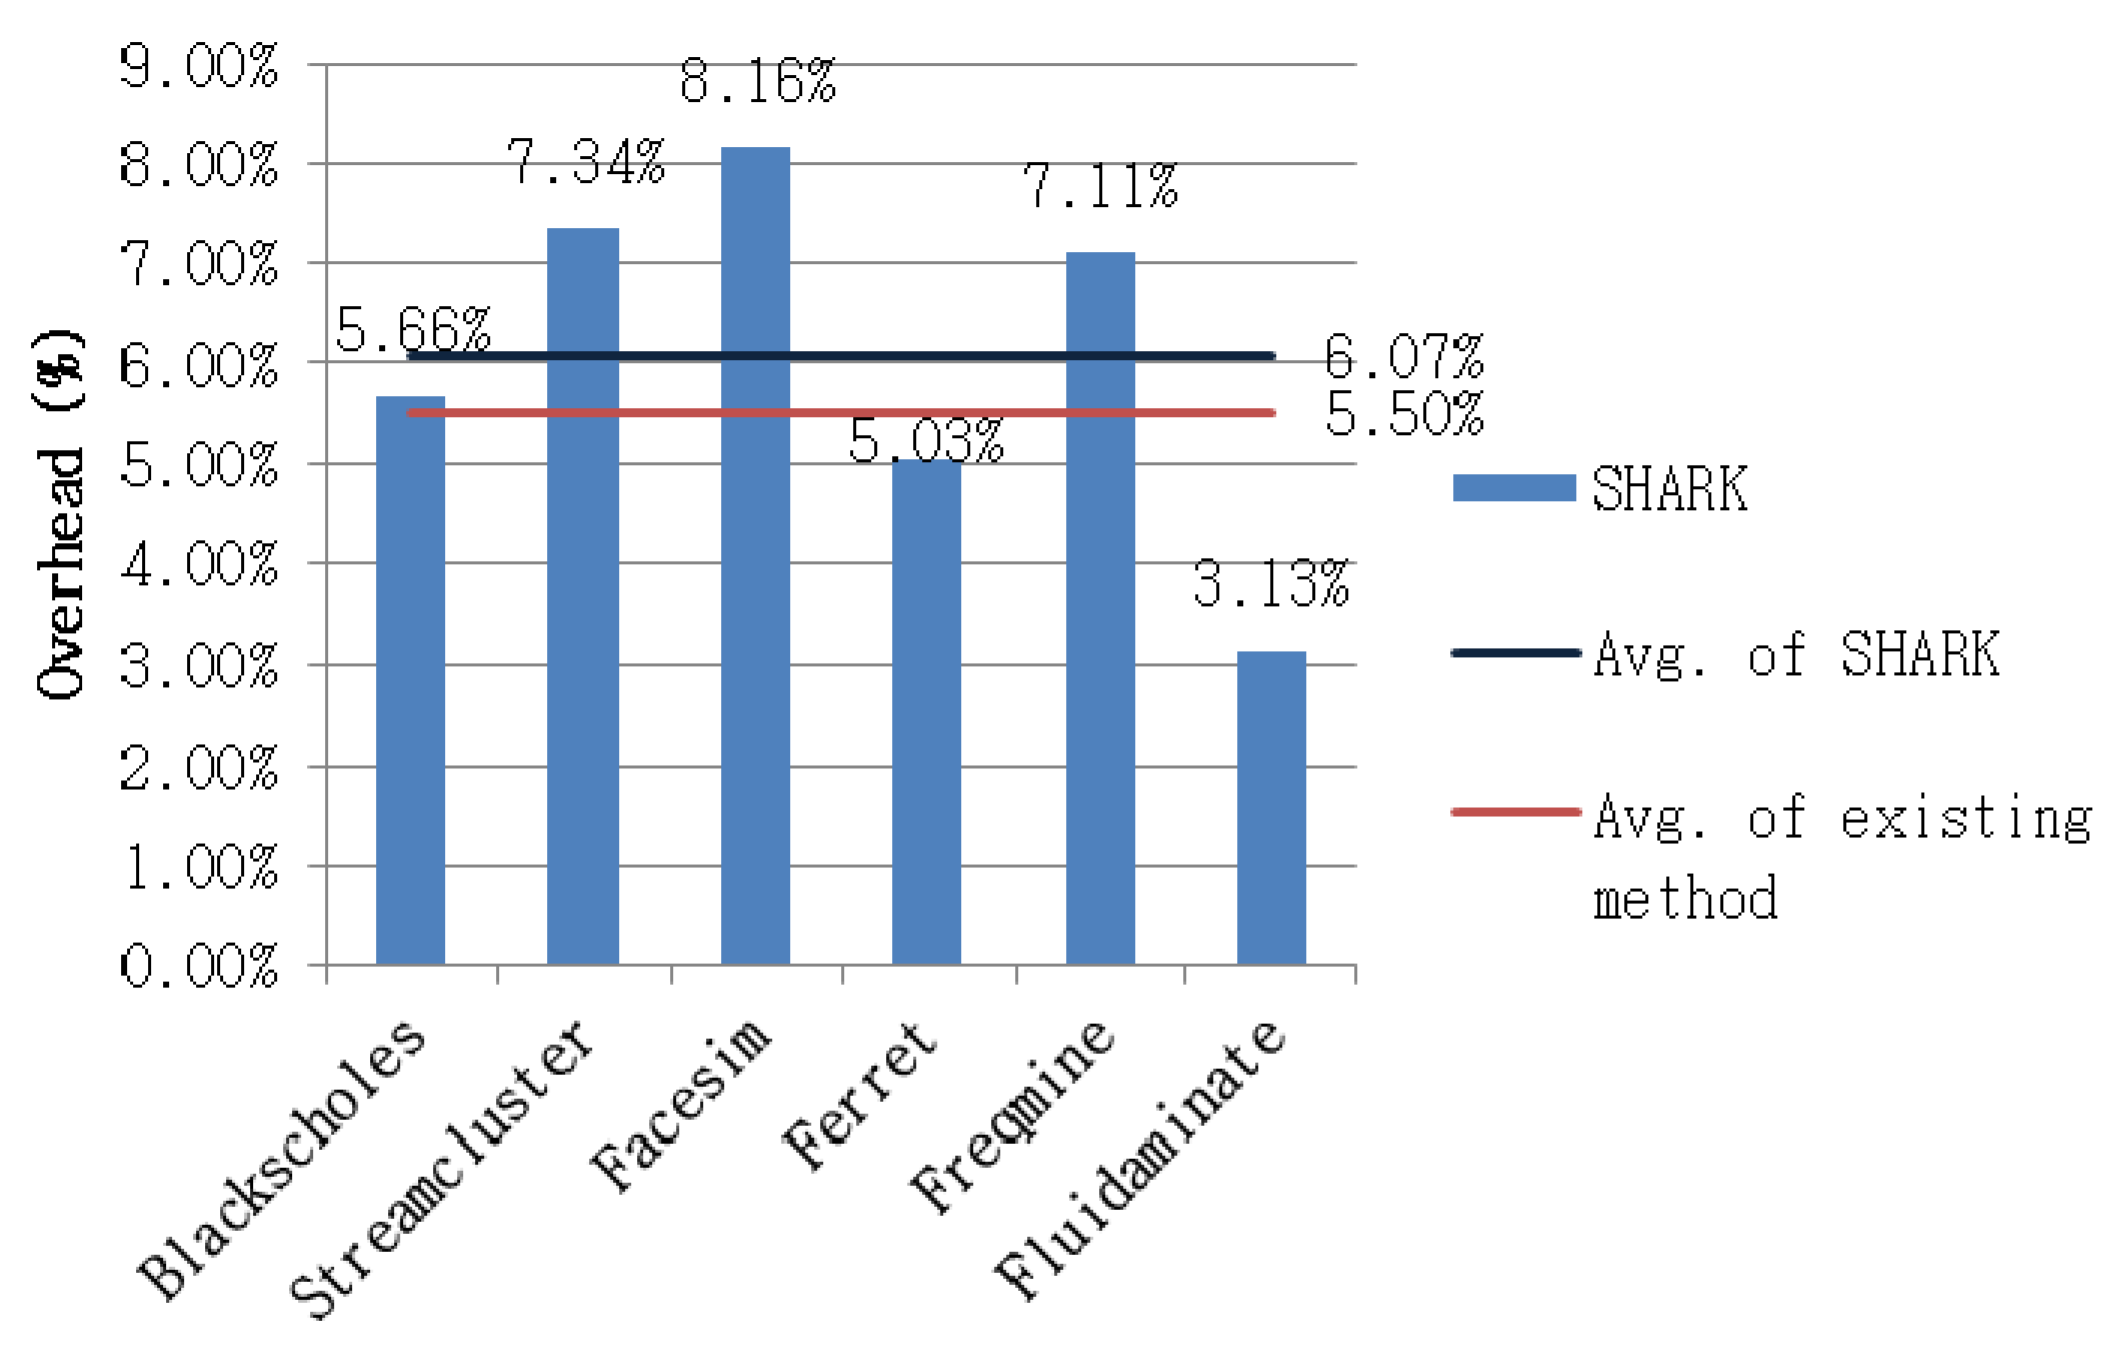
Figure 11 depicts the performance overhead measured by the Shark agent in the experiment. The operation of the Shark test monitor in the host environment did not affect the performance of the target system for testing; therefore, its contribution was excluded from the process of measuring the overhead. In the case of the GEM5 simulator, the overall operating speed of the simulation was slow because of hardware modeling; thus, it was also excluded from the performance overhead measurement. Therefore, performance overhead was measured only in the ODROID-XU3 environment.
When the Shark agent was not applied, the mean time required for the execution of the application was 1.81 ms. When the agent was applied, the mean time increased to 1.92 ms. Therefore, the average time attributable to performance overhead was 0.11 ms, such that the average performance delay ratio was 6.07%. The existing method for detecting intermittent CPU faults exhibited a performance overhead of 5.5% [16,17]. However, the previous method has the critical problem of requiring logic to be added to the hardware. As our method uses software, it performs the test and exhibited performance close to that of the existing method using hardware.
Among the benchmark applications, facesim led to a high performance overhead of 8.16%. This result was due to I/O occurring several times due to the frequent memory access by facesim, increasing the number of executed system calls and amount of obtained data.
The size of the Shark agent applied to the system was 5.99 KB. In practice, this agent does not adjust the software code by operating in the system. Therefore, unlike other methods that obtain data through changes to the code, our method did not generate any memory overhead due to an increase in the amount of software code [19,22]. However, the size of the log when a system call was executed was 128 bytes.

4.3.4. Experimental Limitations

The results of our study demonstrated that Shark can effectively detect and distinguish faults using the hooking method on the system call to access the hardware and obtain the necessary data for distinguishing faults while minimally affecting the real-time execution environment. The CPUs we used in the experiment were based on ARM architecture. The command sets or architecture and the rates of fault detection and classification may vary, depending on the characteristics of the CPU. Therefore, in further research, the validity of the experiment should be determined by analyzing the results when injecting faults into other types of CPUs.
The experimental results indicate that a fault occurred through the application of fluidanimate and that the accuracy of distinguishing faults decreased when the performance of the system slightly decreased. This phenomenon occurred because the system performance was reduced when a fault occurred during a state when the performance was already low, owing to the high CPU usage of the application. Thus, to increase the fault classification accuracy of our method, the reduction in CPU performance and the occurrence of retry or stall should be determined by considering the type of CPU and normal execution performance of applications through comparison.

5. Conclusions and Further Research

The method proposed in this study determines whether a fault generated in an environment where hardware and software are integrated is a hardware or software fault. In addition, if the fault is determined to be a hardware fault, our method can also identify the hardware responsible for the fault. This approach primarily uses minimal information from the hardware performance counter and software execution, without the need for an additional hardware device to detect faults, thus minimizing the effects on the execution environment.
The proposed strategy was implemented in the form of Shark, an automated tool that operates on a Linux platform based on ARM. In addition, experiments to verify the efficiency of our method were conducted using Shark. Faults that occurred after integration of the hardware and software were selected and randomly injected into the system targeted for testing, in order to examine whether Shark was capable of distinguishing such faults. The experimental results indicated that 99.06% of the injected faults were identified by Shark and that 95.77% of them were successfully classified as either hardware or software faults. Moreover, Shark exhibited a performance delay rate of 6.07% on average, with the advantage that it did not require adjustment of the system targeted for testing. This rate was close to the performance delay rate of 5.5% reported for other hardware fault detection methods with which the method proposed in this study was compared. However, our method is significantly more lightweight: Whereas other methods require hardware logic to be adjusted, our method only requires an additional software agent for logging.
Although the method proposed in this paper is limited to intermittent CPU faults and timing faults in the software, it should also apply to faults in other hardware, such as the memory or power management unit. As such, we will conduct further research on the application of this method to other hardware beyond the CPU and investigate how to increase the fault classification ratio based on a database of faults that have occurred in practice.

Author Contributions

J.P. and B.C. contributed to the design and implementation of the research, to the analysis of the results and to the writing of the manuscript. B.C. supervised the findings of this work. All authors have read and agreed to the published version of the manuscript.

Funding

This research received no external funding.

Acknowledgments

This work was supported by the industry-academic project with Samsung Electronics, “Development of test technology and establishment of test automation platform for Android system” in 2014.

Conflicts of Interest

The authors declare no conflict of interest.

References

  1. Kang, B.; Kwon, Y.-J.; Lee, R. A design and test technique for embedded software. In Proceedings of the Third ACIS Int’l Conference on Software Engineering Research, Management and Applications (SERA’05), Mount Pleasant, MI, USA, 11–13 August 2005; Institute of Electrical and Electronics Engineers (IEEE): Piscataway Township, NJ, USA, 2005; pp. 160–165. [Google Scholar]
  2. Hangal, S.; Lam, M.S. Tracking down software bugs using automatic anomaly detection. In Proceedings of the 24th international conference on Software engineering—ICSE ’02, Orlando, FL, USA, 25 May 2002; Association for Computing Machinery (ACM): New York, NY, USA, 2002; p. 291. [Google Scholar]
  3. Reis, G.; Chang, J.; Vachharajani, N.; Rangan, R.; August, D. SWIFT: Software implemented fault tolerance. In Proceedings of the International Symposium on Code Generation and Optimization, New York, NY, USA, 20–23 March 2005; IEEE Computer Society: Washington, DC, USA, 2005; pp. 243–254. [Google Scholar]
  4. Park, J.; Kim, H.-J.; Shin, J.-H.; Baik, J. An embedded software reliability model with consideration of hardware related software failures. In Proceedings of the 2012 IEEE Sixth International Conference on Software Security and Reliability, Gaithersburg, MD, USA, 20–22 June 2012; pp. 207–214. [Google Scholar] [CrossRef]
  5. Shye, A.; Moseley, T.; Reddi, V.J.; Blomstedt, J.; Connors, D.A. Using process-level redundancy to exploit multiple cores for transient fault tolerance. In Proceedings of the 37th Annual IEEE/IFIP International Conference on Dependable Systems and Networks (DSN’07), Edinburgh, UK, 25–28 June 2007; 2007; pp. 297–306. [Google Scholar] [CrossRef]
  6. Moreira, F.B.; Diener, M.; Navaux, P.O.A.; Koren, I. Data mining the memory access stream to detect anomalous application behavior. In Proceedings of the Computing Frontiers Conference on ZZZ—CF’17, Siena, Italy, 15–17 May 2017; Association for Computing Machinery: New York, NY, USA, 2017; pp. 45–52. [Google Scholar] [CrossRef]
  7. Seo, J.; Choi, B.; Yang, S. A profiling method by PCB hooking and its application for memory fault detection in embedded system operational test. Inf. Softw. Technol. 2011, 53, 106–119. [Google Scholar] [CrossRef]
  8. Chen, Y.-Y.; Leu, K.-L.; Kun-Chun Chang, K.-C. Datapath error detection using hybrid detection approach for high-performance microprocessors. In Proceedings of the 12th WSEAS international conference on Computers, Heraklion, Greece, 23–25 July 2008. [Google Scholar]
  9. Wagner, I.; Bertacco, V. Engineering trust with semantic guardians. In Proceedings of the 2007 Design, Automation & Test in Europe Conference & Exhibition, Nice, France, 16–20 April 2007; pp. 1–6. [Google Scholar]
  10. Rashid, L.; Karthik, P.; Sathish, G. Dieba: Diagnosing intermittent errors by backtracing application failures. In Proceedings of the Silicon Errors in Logic-System Effects, Champaign, IL, USA, 27–28 March 2012. [Google Scholar]
  11. Bruckert, W.; Klecka, J.; Smullen, J. Diagnostic Memory Dump Method in a Redundant Processor. U.S. Patent Application 10/953,242, 2004. [Google Scholar]
  12. Han, S.; Shin, K.; Rosenberg, H. DOCTOR: An integrated software fault injection environment for distributed real-time systems. In Proceedings of the 1995 IEEE International Computer Performance and Dependability Symposium, Erlangen, Germany, 24–26 April 1995; pp. 204–213. [Google Scholar]
  13. IEEE. IEEE Standard Classification for Software Anomalies; IEEE Std.: Piscataway Township, NJ, USA, 1994; pp. 1044–1993. [Google Scholar]
  14. Madeira, H.; Costa, D.; Vieira, M. On the emulation of software faults by software fault injection. In Proceedings of the International Conference on Dependable Systems and Networks (DSN), New York, NY, USA, 25–28 June 2000; pp. 417–426. [Google Scholar]
  15. Zhu, Y.; Li, Y.; Xue, J.; Tan, T.; Shi, J.; Shen, Y.; Ma, C. What is system hang and how to handle it? In Proceedings of the 2012 IEEE 23rd International Symposium on Software Reliability Engineering, Dallas, TX, USA, 27–30 November 2012; pp. 141–150. [Google Scholar]
  16. Bower, F.A.; Sorin, D.J.; Ozev, S. Online diagnosis of hard faults in microprocessors. ACM Trans. Arch. Code Optim. 2007, 4. [Google Scholar] [CrossRef]
  17. Constantinides, K.; Mutlu, O.; Austin, T.; Bertacco, V. Software-based online detection of hardware defects: Mechanisms, architectural, and evaluation. In Proceedings of the 40th Annual IEEE/ACM International Symposium on Microarchitecture, Chicago, IL, USA, 1–5 December 2007; pp. 97–108. [Google Scholar]
  18. Li, M.-L.; Ramachandran, P.; Sahoo, S.K.; Adve, S.V.; Adve, V.S.; Zhou, Y. Understanding the propagation of hard errors to software and implications for resillant system design. ASPLOS XIII: Proceedings of the 13th International Conference on Architectural Support for Programming Languages and Operating Systems; Association for Computing Machinery: New York, NY, USA, 2008. [Google Scholar]
  19. Mickens, J.W.; Elson, J.; Howell, J. Mugshot: Deterministic capture and replay for JavaScript applications. In Proceedings of the NSDI, San Jose, CA, USA, 28–30 April 2010; Volume 10, pp. 159–174. [Google Scholar]
  20. Ting, D.; He, J.; Gu, X.; Lu, S.; Wang, P. Dscope: Detecting real-world data corruption hang bugs in cloud server systems. In Proceedings of the ACM Symposium on Cloud Computing, Carlsbad, CA, USA, 11–13 October 2018; pp. 313–325. [Google Scholar]
  21. Brocanelli, M.; Wang, X. Hang doctor: Runtime detection and diagnosis of soft hangs for smartphone apps. In Proceedings of the Thirteenth EuroSys Conference, Porto, Portugal, 23–26 April 2018; pp. 1–15. [Google Scholar]
  22. Wang, L.; Kalbarczyk, Z.; Gu, W.; Iyer, R.K. Reliability MicroKernel: Providing application-aware reliability in the OS. IEEE Trans. Reliab. 2007, 56, 597–614. [Google Scholar] [CrossRef]
  23. Sultan, F.; Bohra, A.; Smaldone, S.; Pan, Y.; Gallard, P.; Neamtiu, I.; Iftode, L. Recovering internet service sessions from operating system failures. IEEE Internet Comput. 2005, 9, 17–27. [Google Scholar] [CrossRef]
  24. Dadashi, M.; Rashid, L.; Pattabiraman, K.; Gopalakrishnan, S. Hardware-software integrated diagnosis for intermittent hardware faults. In Proceedings of the 2014 44th Annual IEEE/IFIP International Conference on Dependable Systems and Networks (DSN), Atlanta, GA, USA, 23–26 June 2014; pp. 363–374. [Google Scholar]
  25. Tiwari, V.; Malik, S.; Wolfe, A. Power analysis of embedded software: A first step towards software power minimization. IEEE Trans. Very Large Scale Integr. (VLSI) Syst. 1994, 2, 437–445. [Google Scholar] [CrossRef] [Green Version]
  26. Woo, L.L.; Zwolinski, M.; Halak, B. Early detection of system-level anomalous behaviour using hardware performance counters. In Proceedings of the 2018 Design, Automation & Test in Europe Conference & Exhibition (DATE), Dresden, Germany, 19–23 March 2018; pp. 485–490. [Google Scholar]
  27. ODROID-XU3. Available online: http://www.hardkernel.com/ (accessed on 5 October 2020).
  28. GEM5 Simulator. Available online: http://www.gem5.org/ (accessed on 5 October 2020).
  29. Exynos5422. Available online: https://www.samsung.com/semiconductor/minisite/exynos/products/mobileprocessor/exynos-5-octa-5422/ (accessed on 5 October 2020).
  30. ARM. ARM. Cortex-a15 MPCore Processor Technical Reference Manual; ARM: Cambridge, UK, 2013. [Google Scholar]
  31. ARM. ARM. Cortex-a7 MPCore Technical Reference Manual; ARM: Cambridge, UK, 2013. [Google Scholar]
  32. Bienia, C.; Kumar, S.; Singh, J.P.; Li, K. The PARSEC benchmark suite: Characterization and architectural implications. In Proceedings of the 17th International Conference on Parallel Architectures and Compilation Techniques, Toronto, ON, Canada, 25–29 October 2008; pp. 72–81. [Google Scholar]
  33. Silva, L.; Batista, V.; Silva, J.G. Fault-tolerant execution of mobile agents. In Proceedings of the International Conference on Dependable Systems and Networks (DSN), New York, NY, USA, 25–28 June 2000; pp. 135–143. [Google Scholar]
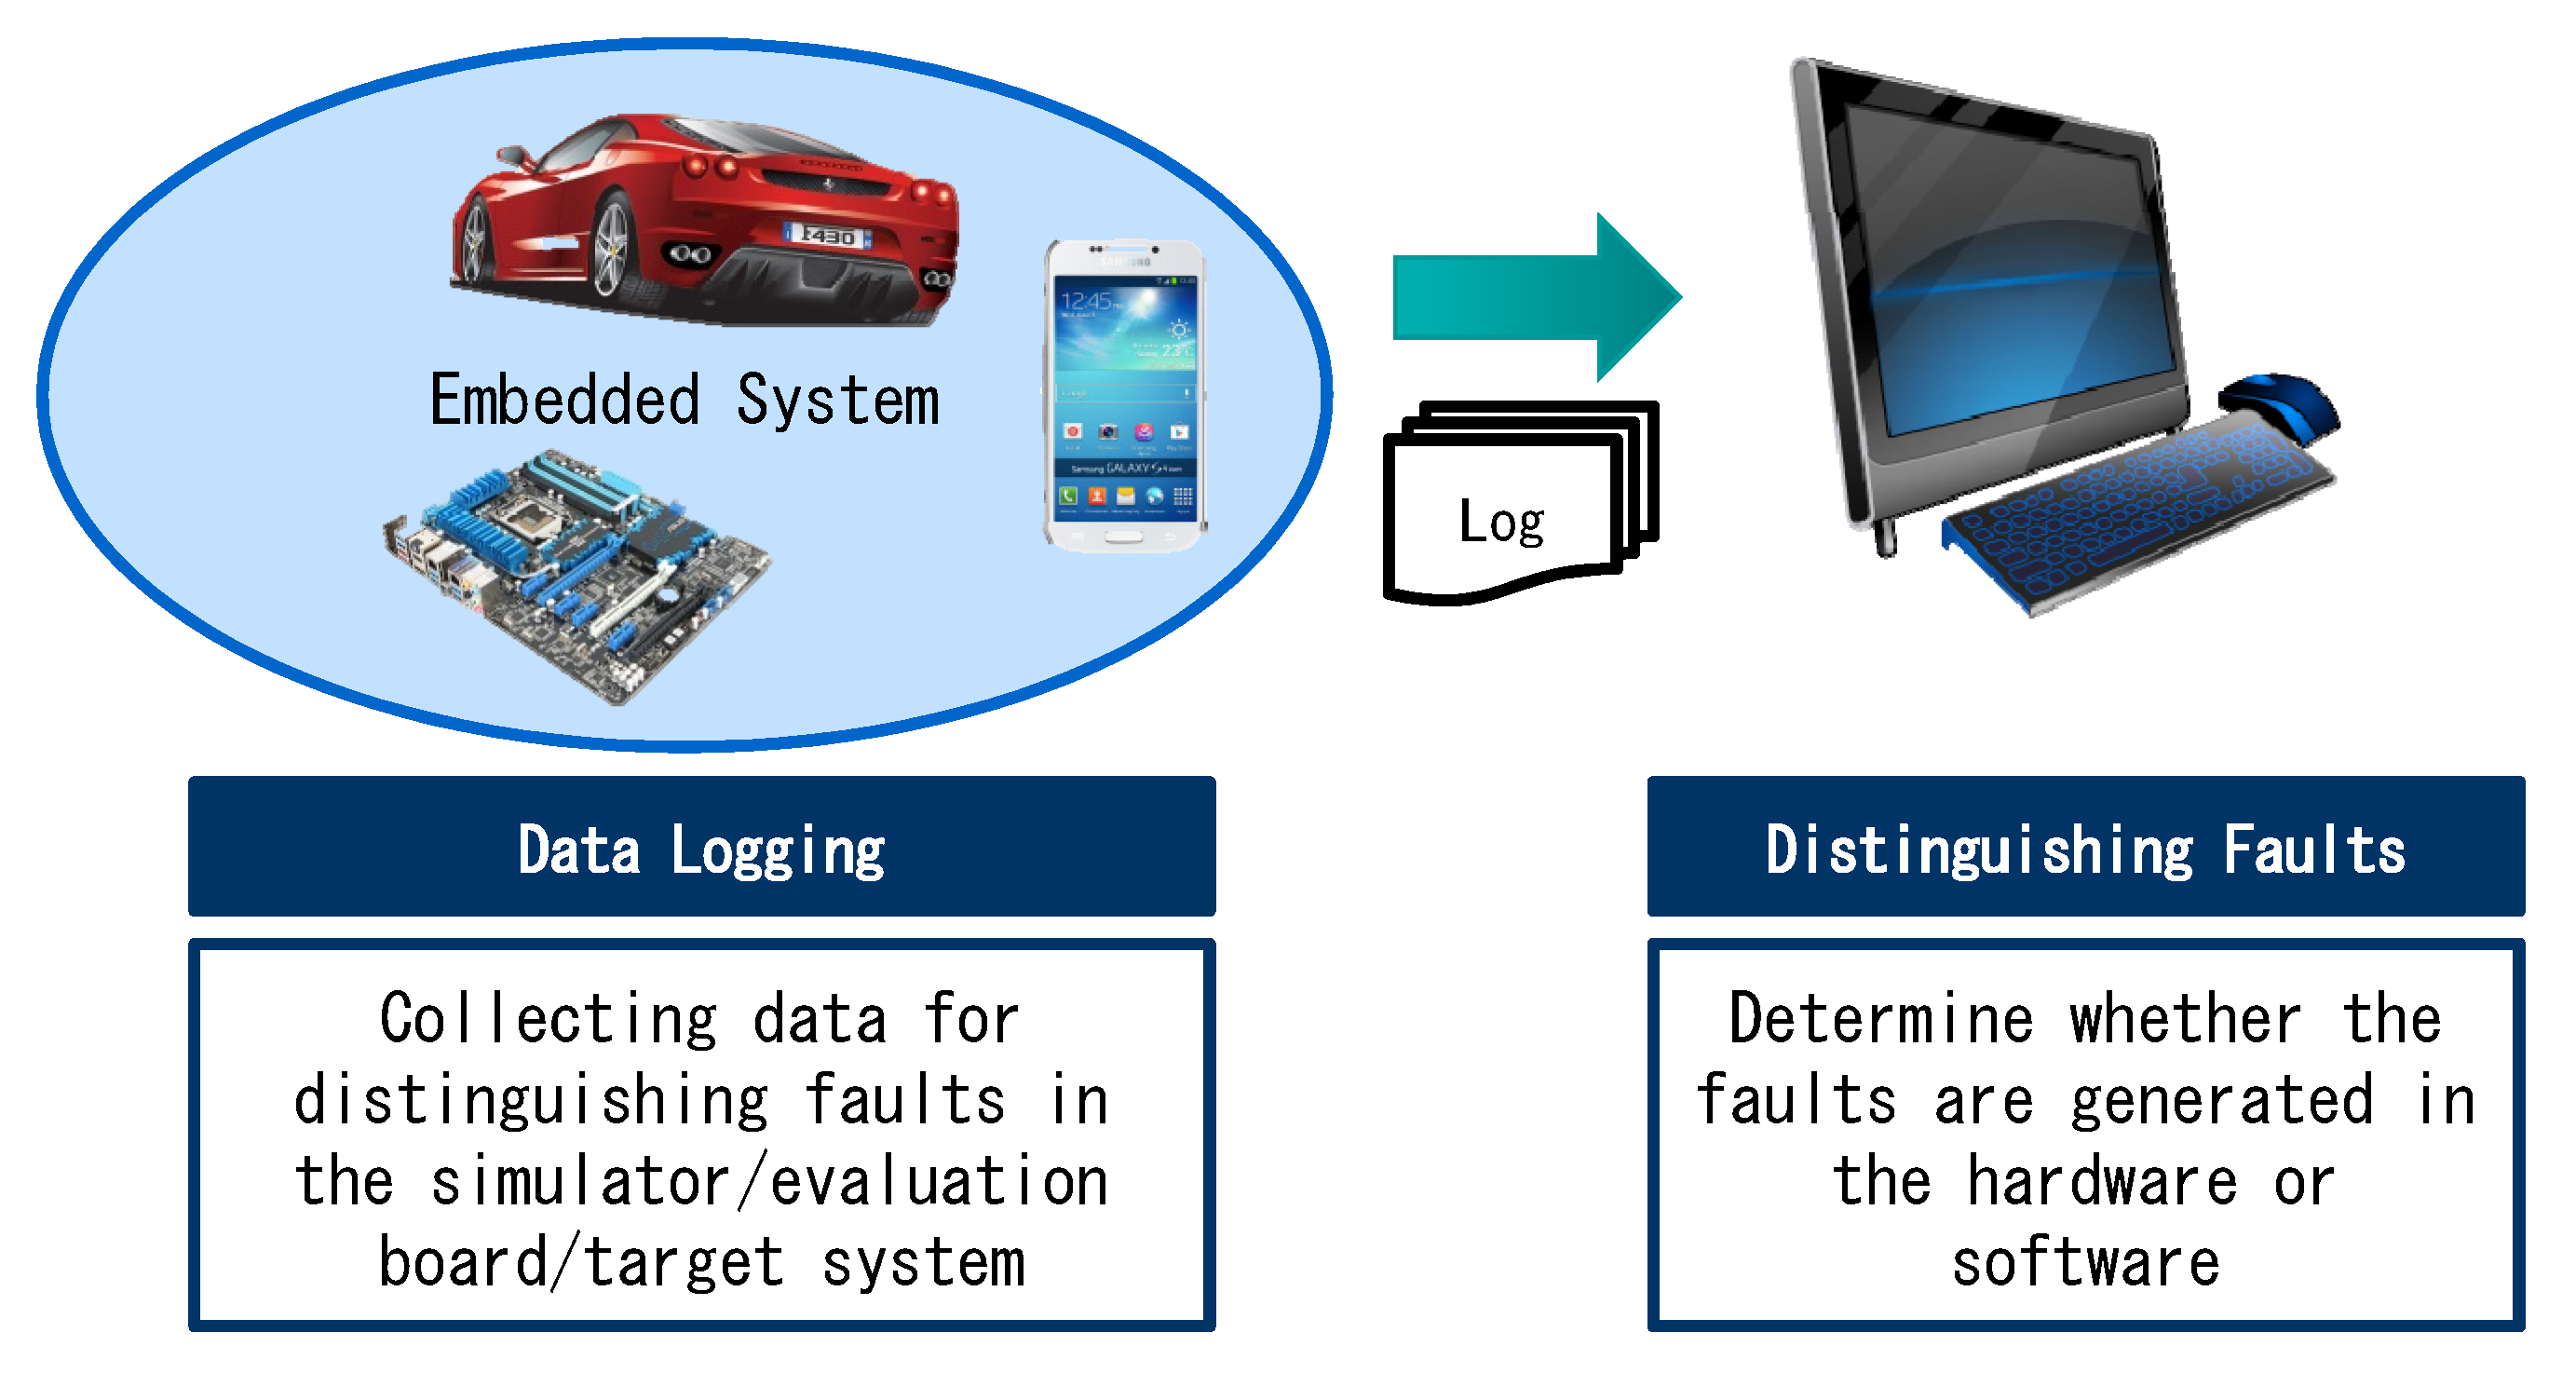
Figure 1. Overview of the proposed method for distinguishing hardware and software faults.
Electronics 09 01815 g001
Figure 2. Data logging for distinguishing faults. (a) Kernel hooking module; (b) Monitoring data
Electronics 09 01815 g002
Figure 3. Locations of CPU performance counters and fault injection.
Electronics 09 01815 g003
Figure 4. CPU fault diagnosis criteria.
Electronics 09 01815 g004
Figure 5. Overview of Shark and flow chart of tool execution.
Electronics 09 01815 g005
Figure 6. Experimental environment.
Electronics 09 01815 g006
Figure 7. Fault injection methods. (a) Hardware fault injection; (b) Software fault injection
Electronics 09 01815 g007
Figure 8. False-positive rate according to the alpha (α) value. (a)False positive rate according to the CPU cycle; (b) False positive rate according to the occurrence of retry/stall when α = 45% for the CPU cycle.
Electronics 09 01815 g008
Figure 9. Fault detection ratio of the proposed method. (a) Fault detection ratio; (b) Number of undetected faults.
Electronics 09 01815 g009
Figure 10. Fault classification ratio of the proposed method. (a) Fault classification ratio; (b) Number of incorrectly distinguished faults and fault classification ratio.
Electronics 09 01815 g010
Figure 11. Performance overhead.
Electronics 09 01815 g011
Table 1. Types of hardware faults.
FaultCause of Fault
Permanent faultDamageExternal impacts and heat
FatigueExtended use
Improper manufacturingIncorrect hardware logic
Transient faultTemporary environmental condition (e.g., cosmic rays, electromagnetic interference)
Intermittent faultUnstable hardware
Marginal hardware
Table 2. Types of software faults.
Fault TypeCause of Fault
Logic ProblemForgotten case or steps, duplicate logic, extreme conditions neglected, unnecessary truncation, misinterpretation, missing condition test, checking the wrong variable, or iterating the loop incorrectly.
Computational
Problem
Equation insufficient or incorrect, missing computation, incorrect equation operand, incorrect equation operator, parentheses used incorrectly, precision loss, rounding or truncation fault, mixed modes, or sign conversion fault.
Data ProblemSensor data incorrect or missing, operator data incorrect or missing, embedded data in tables incorrect or missing, external data incorrect or missing, output data incorrect or missing, or input data incorrect or missing.
Interface/Timing
Problem
Interrupts handled incorrectly, incorrect input/output timing, timing fault causes data loss, subroutine/module mismatch, wrong subroutine called, incorrectly located subroutine called, or inconsistent subroutine arguments.
Documentation
Problem
Ambiguous statement or incomplete, incorrect, missing, conflicting, redundant, confusing, illogical, non-verifiable, or unachievable items.
Data Handling
Problem
Data initialized incorrectly, data accessed or stored incorrectly, flag or index set incorrectly, data packed/unpacked incorrectly, incorrectly referenced wrong data variable, data referenced out of bounds, scaling or units of data incorrect, data dimensioned incorrectly, variable type incorrect, incorrectly subscripted variable, or incorrect scope of data.
Document Quality ProblemApplicable criteria not met, not traceable, not current, inconsistencies, incomplete, or no identification.
Table 3. System and applications targeted for the experiment.
EnvironmentSystemCPU ArchitectureNo. of CPU Cores
Evaluation BoardODROIC-XU3ARM v7-a architecture8
SimulationGEM5 SimulatorARM v8-a architecture4
ProgramDescriptionLOCSize (KB)
Blackscholes:Computational finance application (Pseudo application)1751712
Streamcluster:Machine learning application (Kernel process)18251371
Facesim:Computer animation application (Pseudo Application)37,26519,702
Ferret:Similarity search engine (Pseudo Application)10,9842728
Freqmine:Data mining application (Pseudo Application)20271469
Fluidanimate:Computer animation application (Pseudo Application)28311363
Table 4. Interface or timing problems in software.
FaultCause of FaultTime Fault was GeneratedHanging Occurrence
Major CategoryMinor Category
Interface/Timing ProblemTimingInput/output timing incorrectRuntimeO
Timing fault causes data lossRuntimeO
InterfaceInterrupts handled incorrectlyRuntimeX
Subroutine/module mismatchCompile timeX
Wrong subroutine calledRuntimeX
Incorrectly located subroutine calledRuntimeX
Inconsistent subroutine argumentsCompile timeX
Table 5. Hardware and software faults.
Fault TypeTargetInjection PeriodFault Injection Method
Hardware fault (CPU fault)Instruction FetchODROID-XU3Just before executing a system callBit flipping is performed on the value of the loaded L1 instruction cache register and the value of the L1 instruction cache register is overlaid with the value obtained through bit flipping
GEM5RandomCode modification related to instruction fetch
Instruction DispatchODROID-XU3Just before executing a system callBit flipping is performed on the value of the loaded instruction dispatch register and the value of the instruction dispatch register is overlaid with the value obtained through bit flipping
GEM5RandomCode modification related to instruction dispatch
Load/store UnitODROID-XU3Just before executing a system callBit flipping is performed on the value of the loaded L1 data cache register and the value of the L1 data cache register is overlaid with the value obtained through bit flipping
GEM5RandomCode modification related to load/store unit
Software faultI/O TimingAllJust before executing a system callThe sleep() function is called to block the thread being currently executed
Table 6. Results of experimental data (Evaluation board).
ApplicationFaultSystem CallNo. of Injected Faults No. of Detected Faults No. of Classified Faults ApplicationFaultSystem CallNo. of Injected FaultsNo. of Detected Faults No. of Classified Faults
BlackscholesHWInstruction cacheWrite503828StreamclusterHWInstruction cacheWrite505050
Ioctl504949Ioctl---
Read504242Read504747
Dispatch stagesWrite505050Dispatch stagesWrite505050
Ioctl505050Ioctl---
Read504949Read505050
Load/store queueWrite505050Load/store queueWrite505050
Ioctl505050Ioctl---
Read505050Read505050
SWI/O timingWrite101010SWI/O timingWrite101010
Ioctl101010Ioctl---
Read101010Read101010
FacesimHWInstruction cacheWrite505050FerretHWInstruction cacheWrite505050
Ioctl505050Ioctl505042
Read505050Read505046
Dispatch stagesWrite505050Dispatch stagesWrite505050
Ioctl505050Ioctl505050
Read505050Read505046
Load/store queueWrite505050Load/store queueWrite505050
Ioctl505050Ioctl505050
Read505050Read505050
SWI/O timingWrite101010SWI/O timingWrite101010
Ioctl101010Ioctl101010
Read101010Read101010
FreqmineHWInstruction cacheWrite505050FluidanimateHWInstruction cacheWrite504936
Ioctl505050Ioctl505033
Read505050Read505032
Dispatch stagesWrite505050Dispatch stagesWrite505032
Ioctl505050Ioctl505032
Read505049Read505031
Load/store queueWrite505050Load/store queueWrite505050
Ioctl505050Ioctl505050
Read505050Read505050
SWI/O timingWrite101010SWI/O timingWrite101010
Ioctl101010Ioctl101010
Read101010Read101010
SumHardware fault255025242394
Software fault170170170
Total272026942564
Table 7. Results of experimental data (Simulator).
ApplicationFaultSystem CallNo. of Injected FaultsNo. of Detected FaultsNo. of Classified FaultsApplicationFaultSystem CallNo. of Injected FaultsNo. of Detected FaultsNo. of Classified Faults
BlackscholesHWInstruction cache-504443StreamclusterHWInstruction cache-505050
Dispatch stages-505050Dispatch stages-505050
Load/store queue-505050Load/store queue-505050
SWI/O timingWrite101010SWI/O timingWrite101010
Ioctl101010Ioctl---
Read101010Read101010
FacesimHWInstruction cache-505050FerretHWInstruction cache-505050
Dispatch stages-505050Dispatch stages-505050
Load/store queue-505050Load/store queue-505050
SWI/O timingWrite101010SWI/O timingWrite101010
Ioctl101010Ioctl101010
Read101010Read101010
FreqmineHWInstruction cache-505050FluidanimateHWInstruction cache-505041
Dispatch stages-505050Dispatch stages-505032
Load/store queue-505050Load/store queue-505049
SWI/O timingWrite101010SWI/O timingWrite101010
Ioctl101010Ioctl101010
Read101010Read101010
SumHardware fault900894865
Software fault170170170
Total107010641035
Publisher’s Note: MDPI stays neutral with regard to jurisdictional claims in published maps and institutional affiliations.