Article

Ad-Hoc Shallow Neural Network to Learn Hyper Filtered PhotoPlethysmoGraphic (PPG) Signal for Efficient Car-Driver Drowsiness Monitoring

by
Francesco Rundo
1,*,
Concetto Spampinato
2 and
Sabrina Conoci
1
1
STMicroelectronics ADG Central R&D, 95121 Catania, Italy
2
Department of Electrical, Electronic and Computer Engineering, University of Catania, 95131 Catania, Italy
*
Author to whom correspondence should be addressed.
Electronics 2019, 8(8), 890; https://doi.org/10.3390/electronics8080890
Submission received: 3 July 2019 / Revised: 25 July 2019 / Accepted: 8 August 2019 / Published: 13 August 2019
(This article belongs to the Section Electrical and Autonomous Vehicles)

Abstract

:
In next-generation cars, safety equipment related to assisted driving systems commonly known as ADAS (advanced driver-assistance systems) are of particular interest for the major car-makers. When we talk about the “ADAS system”, we mean the devices and sensors having the precise objective of improving and making car driving safer, and among which it is worth mentioning rain sensors, the twilight sensor, adaptive cruise control, automatic emergency braking, parking sensors, automatic signal recognition, and so on. All these devices and sensors are installed on the new homologated cars to minimize the risk of an accident and make life on board of the car easier. Some sensors evaluate the movement and the opening of the eyes, the position of the head and its angle, or some physiological signals of the driver obtainable from the palm of the hands placed in the steering. In the present contribution, the authors will present an innovative recognition and monitoring system of the driver’s attention level through the study of the photoplethysmographic (PPG) signal detectable from the palm of the driver’s hands through special devices housed in the steering of the car. Through a particular and innovative post-processing algorithm of the PPG signal through a hyper-filtering framework, then processed by a machine learning framework, the entire pipeline proposed will be able to recognize and monitor the attention level of the driver with high accuracy and acceptable timing.

1. Introduction

The continuous technological progress has seen, in recent years, modern cars become real traveling laboratories equipped with electronic driver assistance systems developed to protect the safety of the driver and passenger as much as possible. These electronic aids are indicated with the acronym ADAS, that is, Advanced Driver Assistance Systems, and with this acronym, identify all the devices present in the car to increase driving comfort and safety levels. Therefore, in the field of car safety, the driver drowsiness level monitoring systems are of particular interest for obvious considerations both in relation to the social impact and in reference to the costs of the automotive industry and in general for the automotive market.
Drowsiness of a vehicle driver (before and during driving) may adversely affect driving safety. Driver’s drowsiness may cause serious road traffic accidents involving vehicles. The possibility to detect an attention state of a driver may facilitate evaluation of his/her fitness to drive a vehicle, facilitating the prevention of road accidents. It is known that a correlation exists between drowsiness and heart rate variability (HRV), that is, a measure of heart activity over a beat-to-beat interval, so that estimating HRV of, for example, a driver, may permit obtaining useful information concerning possible drowsiness [1]. The scientific studies of drowsiness allowed to understand that it is reflected in the activity of the central nervous system as well as of the autonomic nervous system (ANS). Thus, a simple method to estimate drowsiness is to monitor ANS activity. Specifically, heart rate variability (HRV), which recent studies confirmed having high signal-to-noise ratio in biological signals, besides the fact that its measurement is non-invasive, reflects ANS activity [1]. Many researchers have over time deepened the study and the correlation between HRV and the level of human attention. In the work of [2], the authors proposed an interesting pipeline for monitoring drowsiness of a car-driver by means of ElectroCardioGraphic (ECG) signal alterations analysis, which clearly has a repercussion in the measure of HRV. Through a pipeline composed by filters, ECG signal stabilization, and classificatory based on classical linear discriminant analysis, the authors of [2] were able to discriminate the drowsy driver from wakeful ones. The authors of [3] proposed an interesting approach for detecting fatigue and sleep onset. Specifically, the authors showed a method to discriminate activity, drowsiness, and sleep starting from the LF/HF ratio detected over the R-R tachogram computed from frequency analysis of the ECG. The results obtained by the authors in [3] are interesting and can be used to develop a drowsiness detection system for ADAS applications. A very interesting approach has been proposed by the authors of [4]. The authors monitored specific changes in sleep condition reflected over the ANS and then on the related HRV. In order to detect specific HRV dynamics, the authors proposed eight hand-crafted HRV signal features to be processed using a multivariate statistical process framework for ad hoc anomaly detection. The authors confirmed their ability on the drowsiness detection by means of standard confirmation based on the usage of electroencephalographic signal (EEG) [4]. Anyway, the main issue of the drowsiness detection approaches based on HRV detection is the ECG sampling inside the passenger compartment of the car, as it is widely known in the medical literature that in order to correctly acquire a subject’s ECG signal, it is necessary to have at least three electrodes in contact with the human skin according to the minimum configuration known as Einthoven’s Triangle [5]. This requires the driver to always have the two hands placed in the steering wheel where the two electrodes of the ECG signal sampling system are usually placed. Then, there is always the problem of the third electrode that is usually placed in the driver’s seat. This clearly involves a problem of driver ergonomics as well as the robustness of the ECG signal sampling system from which the HRV signal descends [5]. For this reasons, many authors have proposed the adoption of methods based on the photoplethysmgraphic (PPG) signal analysis rather than on ECG. The PPG signal can be considered as a non-invasive method to monitor cardiovascular system, in particular, the heart pulse rate. Both heart pulse and respiratory rate as well as vascular and cardiac disorders may be monitored by means of ad hoc analysis of such PPG signal features [6]. Through the PPG signal, we are able to have a non-invasive measure of the blood volume changes. A classical PPG waveform comprises a pulsatile (‘AC’) physiological signal, which is correlated to cardiac-synchronous changes in the blood volume (in sync with heart-beat) superimposed with a slowly varying (‘DC’) component containing lower frequency sub-signals, which is correlated to respiration, thermoregulation, and skin tissues (in which the PPG sensor is adapted). For each cardiac cycle, the heart pumps blood to the periphery with a specific pressure enough to distend the arteries and arterioles in the subcutaneous tissue. By means of a device composed by a light-emitter and a detector attached over the skin, a pressure pulse can also be seen from the venous plexus, as a small secondary peak. The change in volume caused by the heart pressure pulse can be detected by illuminating the skin and then by measuring the amount of light either transmitted or reflected to a detector [6]. More detail about PPG signal formation can be found in the work of [6]. Figure 1 shows a classical PPG compliant waveform.
Figure 2 shows the physiological phenomena underlying PPG waveform(s) formation, as previously described.
The authors of [7] proposed a solution for determining HRV from the PPG signal in order to analyze parasympathetic nervous activities and classify drowsiness level of the subjects. The results confirmed the effectiveness of the proposed approach based on the use of a low-power PPG probe. In the work of [8], an interesting indicator coming from the PPG signal has been analyzed and proposed. The authors [8] proposed an algorithm based on PRV (pulse rate variability) data processing as measure of the ANS activity, and then the drowsiness of the subject. The results reported [8] seem very promising. An interesting approach has been proposed in the work of [9], in which the authors projected a flexible sensor array composed of red organic light-emitting diodes (OLEDs) and organic photodiodes (OPDs) for detection of the photoplethysmographic (PPG) signal. The reported test benchmarks in the work of [9] confirmed that the proposed flexible PPG sensor was able to estimate the drowsiness with more accuracy with respect to the classical PPG probe. Anyway, for drowsiness detection, the authors also had to acquire the ECG signal as well as perform such a complex analysis in the frequency domain.
Anyway, recent approaches based on the use of deep learning have been proposed in the literature in order to estimate the drowsiness of a subject from his/her bio-signals and imaging. In the works of [10,11], such similar pipelines have been proposed in order to estimate the car-driver drowsiness by analyzing the “eye states” or “face expressions” of the driver through such image processing methods. The approach seems fine, but like all methods based on the acquisition of video frames, it requires sufficient illumination of the passenger compartment as well as eye-tracking problems if, as in the case of the algorithm proposed in the works of [10,11], the driver should wear dark glasses. As introduced, recent deep learning advances in automotive applications allow such innovation in the field of drowsiness detection systems, as confirmed by the pipeline proposed in the work of [12]. The authors proposed an intelligent algorithm that combined the wavelet packet transform (WPT) and a functional-link-based fuzzy neural network (FLFNN) to provide early detection of car-driver drowsiness. As for the proposed approach, the bio-sensors are supposed to be placed over the car steering. The drowsiness analysis is based on the HF/LF analysis [12]. A similar approach was proposed in another paper [13], where a support vector machine (SVM) approach has been successfully used to classify the car-driver physiological data coming from an array of bio-sensors placed over the steering. However, recent advances in the field of deep learning have prompted some authors to study algorithms for recognizing drowsiness by means of “data fusion”, specifically, by processing both visual and physiological data coming from the car-driver. In this sense, an interesting work has been published in the work of [14]. The authors in this work proposed a system based on multimodal deep learning that recognizes both visual and physiological changes in the state of attention of the driver. As it uses different kinds of data, the authors proposed the usage of a generative model to homogeneously represent the data to be processed. After that, they used a deep learning framework consisting of long short-term memory (LSTM) to classify the driver’s condition based on both visual and physiological data properly pre-processed. The results confirmed the robustness of the proposed approach even though it requires also visual information of the car driver, which, as we have previously mentioned, requires adequate lighting conditions in order to have adequate information content.
In order to properly address the limitations of the methodologies described up to now (computational load, integration of visual and physiological data, analysis in the frequency domain, sampling difficulty in the passenger compartment of the car), based on the use of the ECG signal or of the PPG and ECG signal or visual data often combined with physiological data, the authors intend to propose a methodology based on the sampling of the PPG signal only, which is able to discriminate the driver’s drowsiness through an appropriate analysis in the time domain and without the need to match visual data. The results that we will show in the following paragraphs confirm the robustness of the proposed method. The article will be organized in the following way. Preliminarily, we will present the hardware framework that we have realized to be able to acquire the PPG signal, as well as the sensor probe we have installed in the steering of the car in order to acquire the PPG signal while driving (from the palm of the driver’s hand). Then, we will present the processing pipeline of the acquired PPG data, and finally, the machine learning framework that will deal with classifying the appropriately processed PPG waveforms will be described. Thereafter, we will describe the results of the validation of our system conducted under strict control of expert physiologists in a dataset of suitably selected subjects.

2. Materials and Methods

For the proposed pipeline, the authors used the PPG sampling device based on the usage of a silicon photomultiplier sensor [15,16]. The proposed PPG probes includes large area n-on-p silicon photomultipliers (SiPMs) fabricated at STMicroelectronics (Catania, Italy) [17]. The SiPMs array device used has a total area of 4.0 × 4.5 mm2 and 4871 square microcells with a 60 µm pitch. The devices have a geometrical fill factor of 67.4% and are packaged in a surface mount housing (SMD) with about 5.1 × 5.1 mm2 total area [6]. We propose the usage of Pixelteq dichroic band-pass filter with a pass band centered at about 540 nm with a full width at half maximum (FWHM) of 70 nm, and an optical transmission higher than 90%–95% in the pass band range was glued on the SMD package using a Loctite 352 TM adhesive.
With the dichroic filter at 3V-OV, the SiPM has a maximum detection efficiency of about 30% at 565 nm and a PDE of about 27.5% at 540 nm (central wavelength in the filter pass band). Furthermore, a careful analysis confirmed that the dichroic filter reduces the absorption of environmental light by more than 60% when the detector works in the linear range in Geiger mode above its breakdown voltage (~27 V). As described, the PPG detector needs a light emitter together with the introduced detector based on SiPM technology. We successfully used the OSRAM LT M673 LEDs in SMD package emitting at 529 nm and based on InGaN technology [6].
The used LEDs devices have an area of 2.3 × 1.5 mm2, viewing angle of 120°, spectral bandwidth of 33 nm, and lower power emission (mW) in the standard operation range. The authors, in order to make the PPG probe easy to use, have designed a printed circuit board (PCB) handled by a user-interface by means of NI (national instruments) instrumentation.
The PCB is populated by a 4 V portable battery, a power management circuits, a conditioning circuit for output SiPMs signals, several USB connectors for PPG probes, and related SMA output connectors. Regarding the hardware used, more implementation details can be found in the works of [6,17]. The following figure shows some details of the proposed hardware system for sampling the PPG signal.
In Figure 3, an overview of the used PPG acquisition system is shown. The PPG sensor probe is composed by the SiPM sensor with the described LEDs. The PPG sensor probes were placed in the steering of the car at positions where statistically it is more likely that the driver rests his/her hands. Please note that to acquire the PPG signal, it is necessary that a single driver’s hand is placed on top of the PPG sensor probe in order to trigger the detecting of the signal. In this way, we have already overcome the first issue related to the use of the ECG signal, which—as widely known in the medical literature—requires at least three points of contact according to the configuration of the Einthoven Triangle. As showed in Figure 3, the acquired PPG raw signal trough the implemented hardware motherboard will be processed by a national instrument (NI) based framework, in which we have several ADC (Analog to Digital Converter) with 24 bits of precision. Specifically, in the following figure, more details about the used hardware motherboard for sampling the PPG signal are presented.
In Figure 4, we report a snapshot of the implemented PPG data acquisition motherboard. The PPG sensor probe will be managed by USB connectors, while an ad hoc power management circuit will be able to manage the power consumption of the SiPM device. More details about that can be found in the literature [15,16,17]. The acquired PPG raw data will be fed into the NI device through the SMA connectors. The following figure shows the implemented hardware framework based on the use of the NI device.
In Figure 5, we report an overview of the proposed PPG sampling hardware/software pipeline. The data acquired on the PPG sensor probes placed on the car steering will be processed by the NI device, which internally includes a Windows-based operating system with a LabView software framework [6]. A pipeline for acquiring and processing raw PGG data through the 24 bits ADC plugged into the NI device was developed as schematized in Figure 5. After the PPG raw data are acquired through the 24 bits ADC, the LabView algorithm we implemented is able to perform some preliminary pre-processing of the PPG raw data; specifically, we apply ad hoc FIR (finite impulse response) filtering, both low-pass and high-pass. Moreover, we perform such a pre-processing operation in the filtered PPG signal, such as the first and second derivatives for computing minimum and maximum values for each waveforms and so on. This operation is suitable to prepare the PPG signal to be rendered on the monitor attached to the NI device, as shown in Figure 5. More implementation details regarding the NI-LabView framework can be found in the works of [6,15].
Therefore, we are interested in the exported PPG raw data (see raw data log block in Figure 5) as we developed the proposed pipeline under MATLAB framework running in an external PC (or embedded device), as will be explained in the validation section of this paper. In Figure 6, we report the overview of the PPG signal processing pipeline developed in this work in order to detect and monitor the drowsiness level of the car-driver (from which we are sampling the PPG signal during the driving).
The PPG waveforms (raw data) of the car driver will be collected as per the scheme reported in Figure 5. Each of the blocks of the pipeline reported in Figure 6 will be described in the next paragraphs.

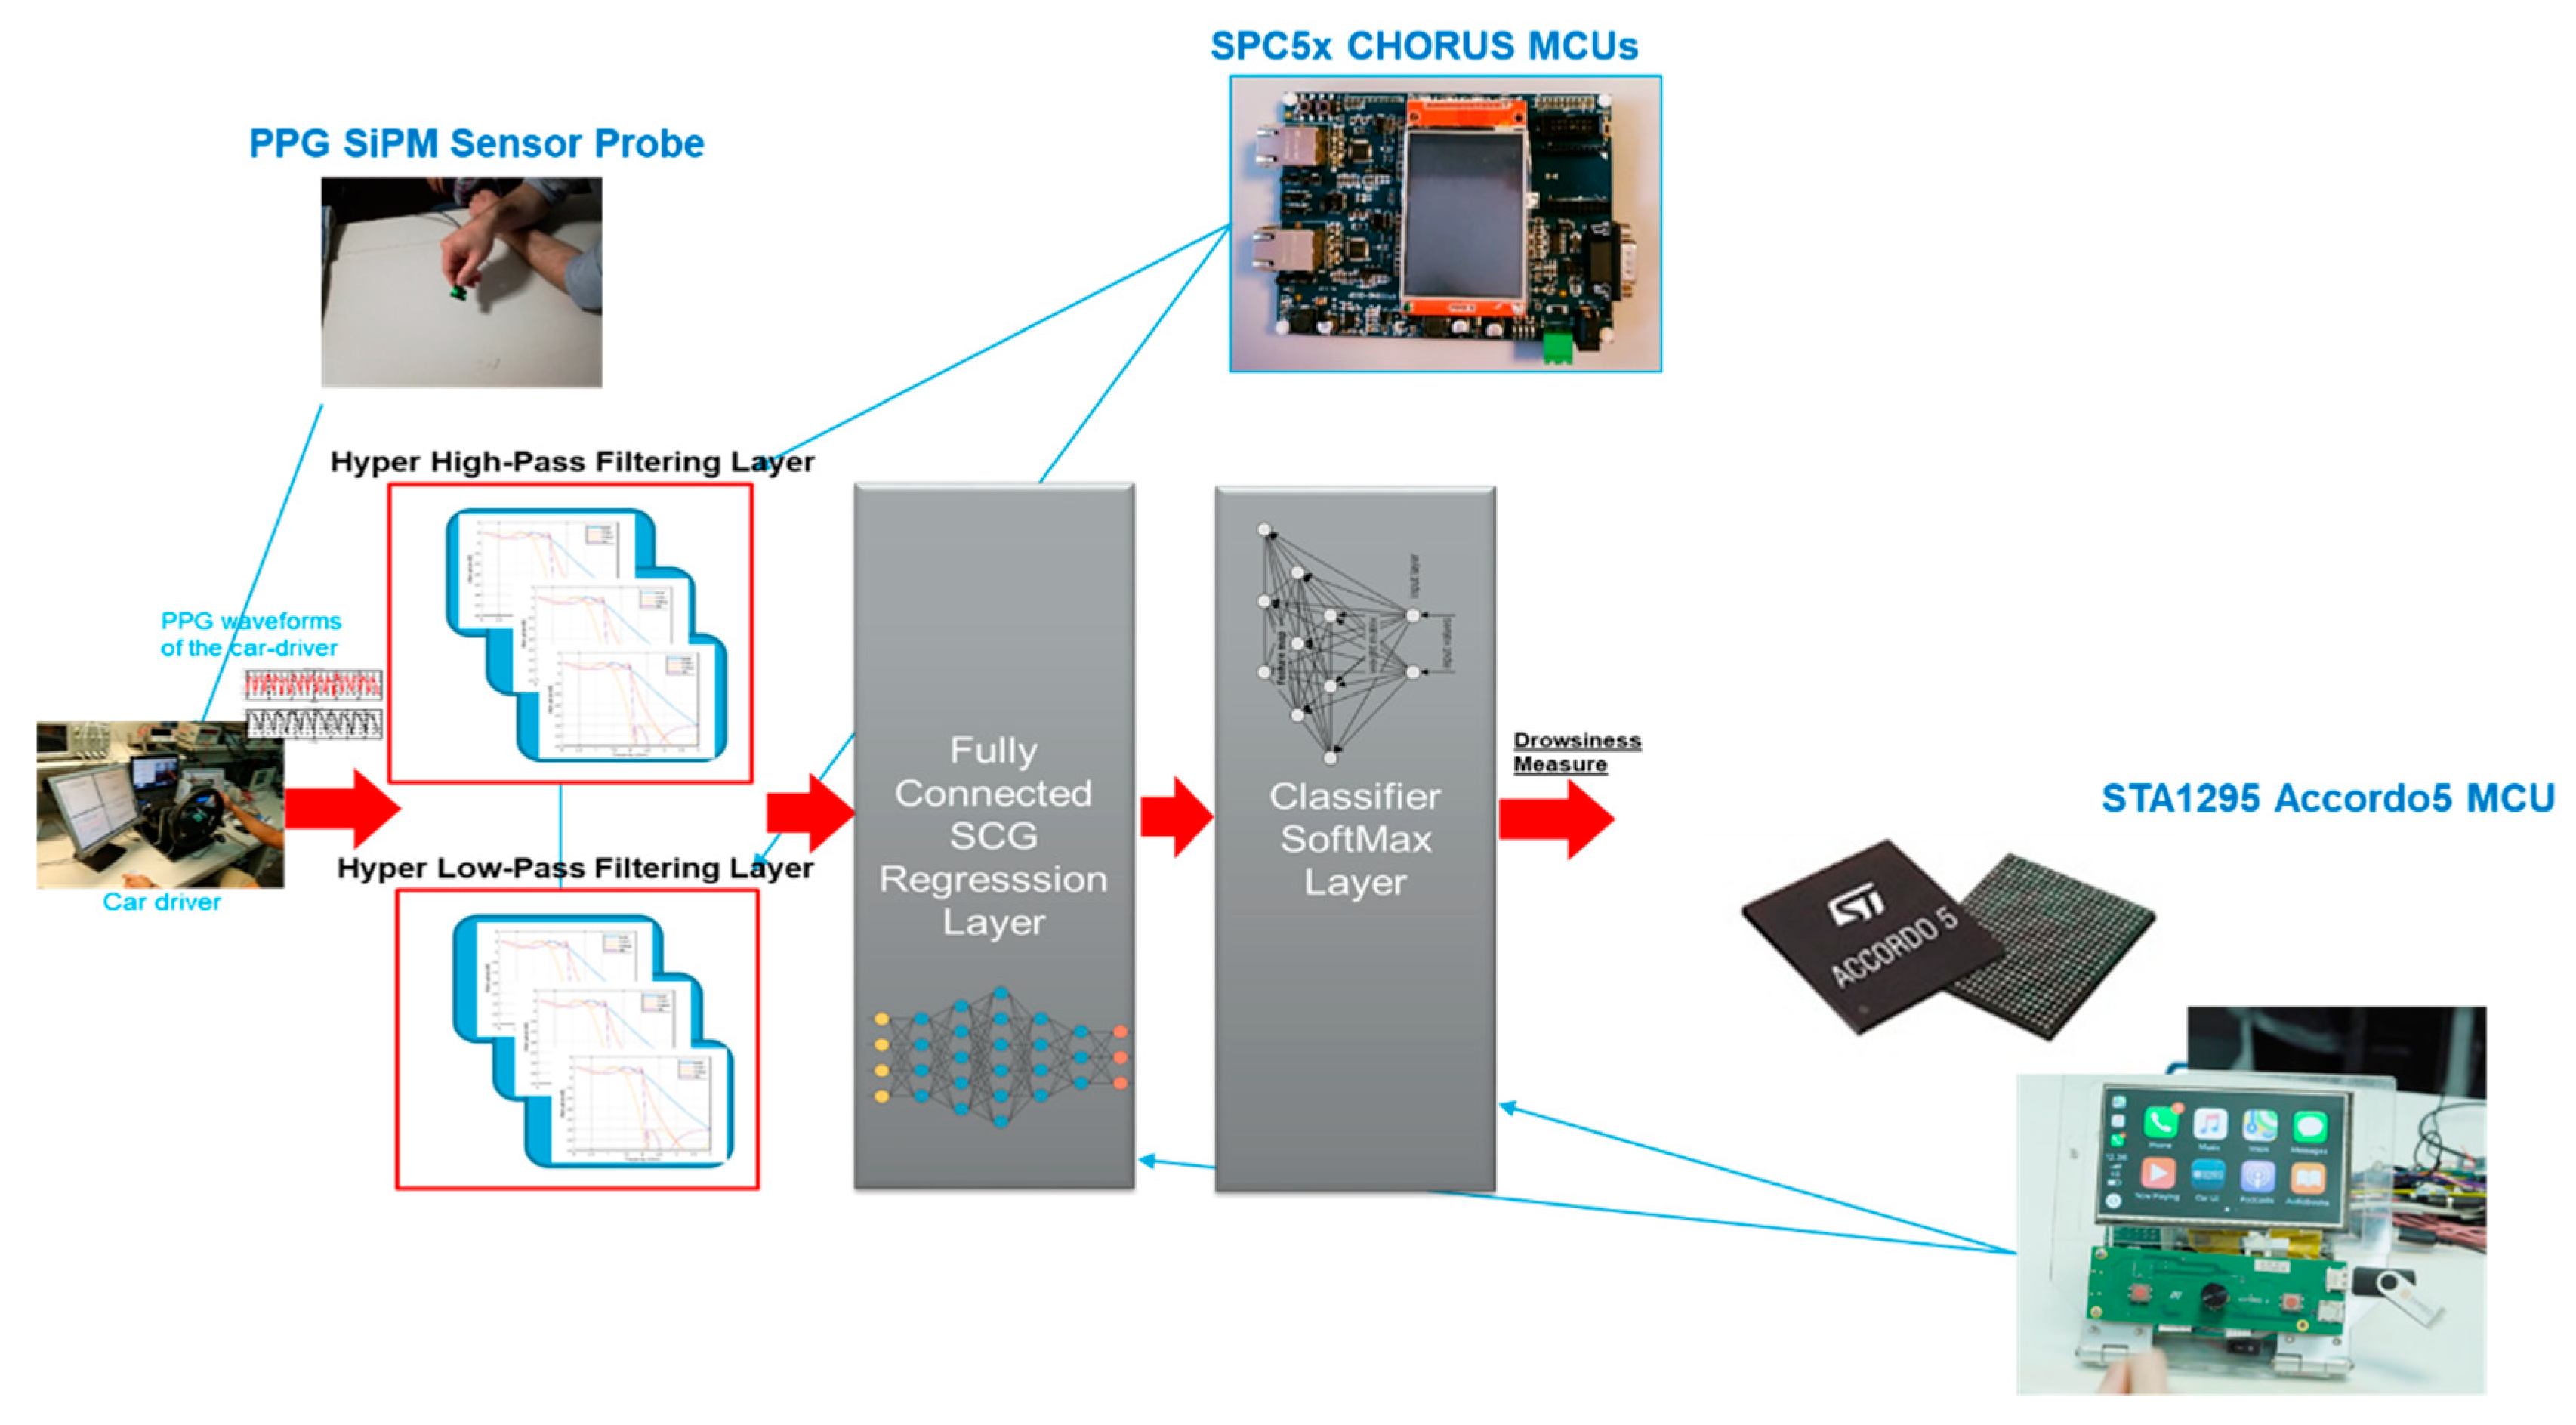
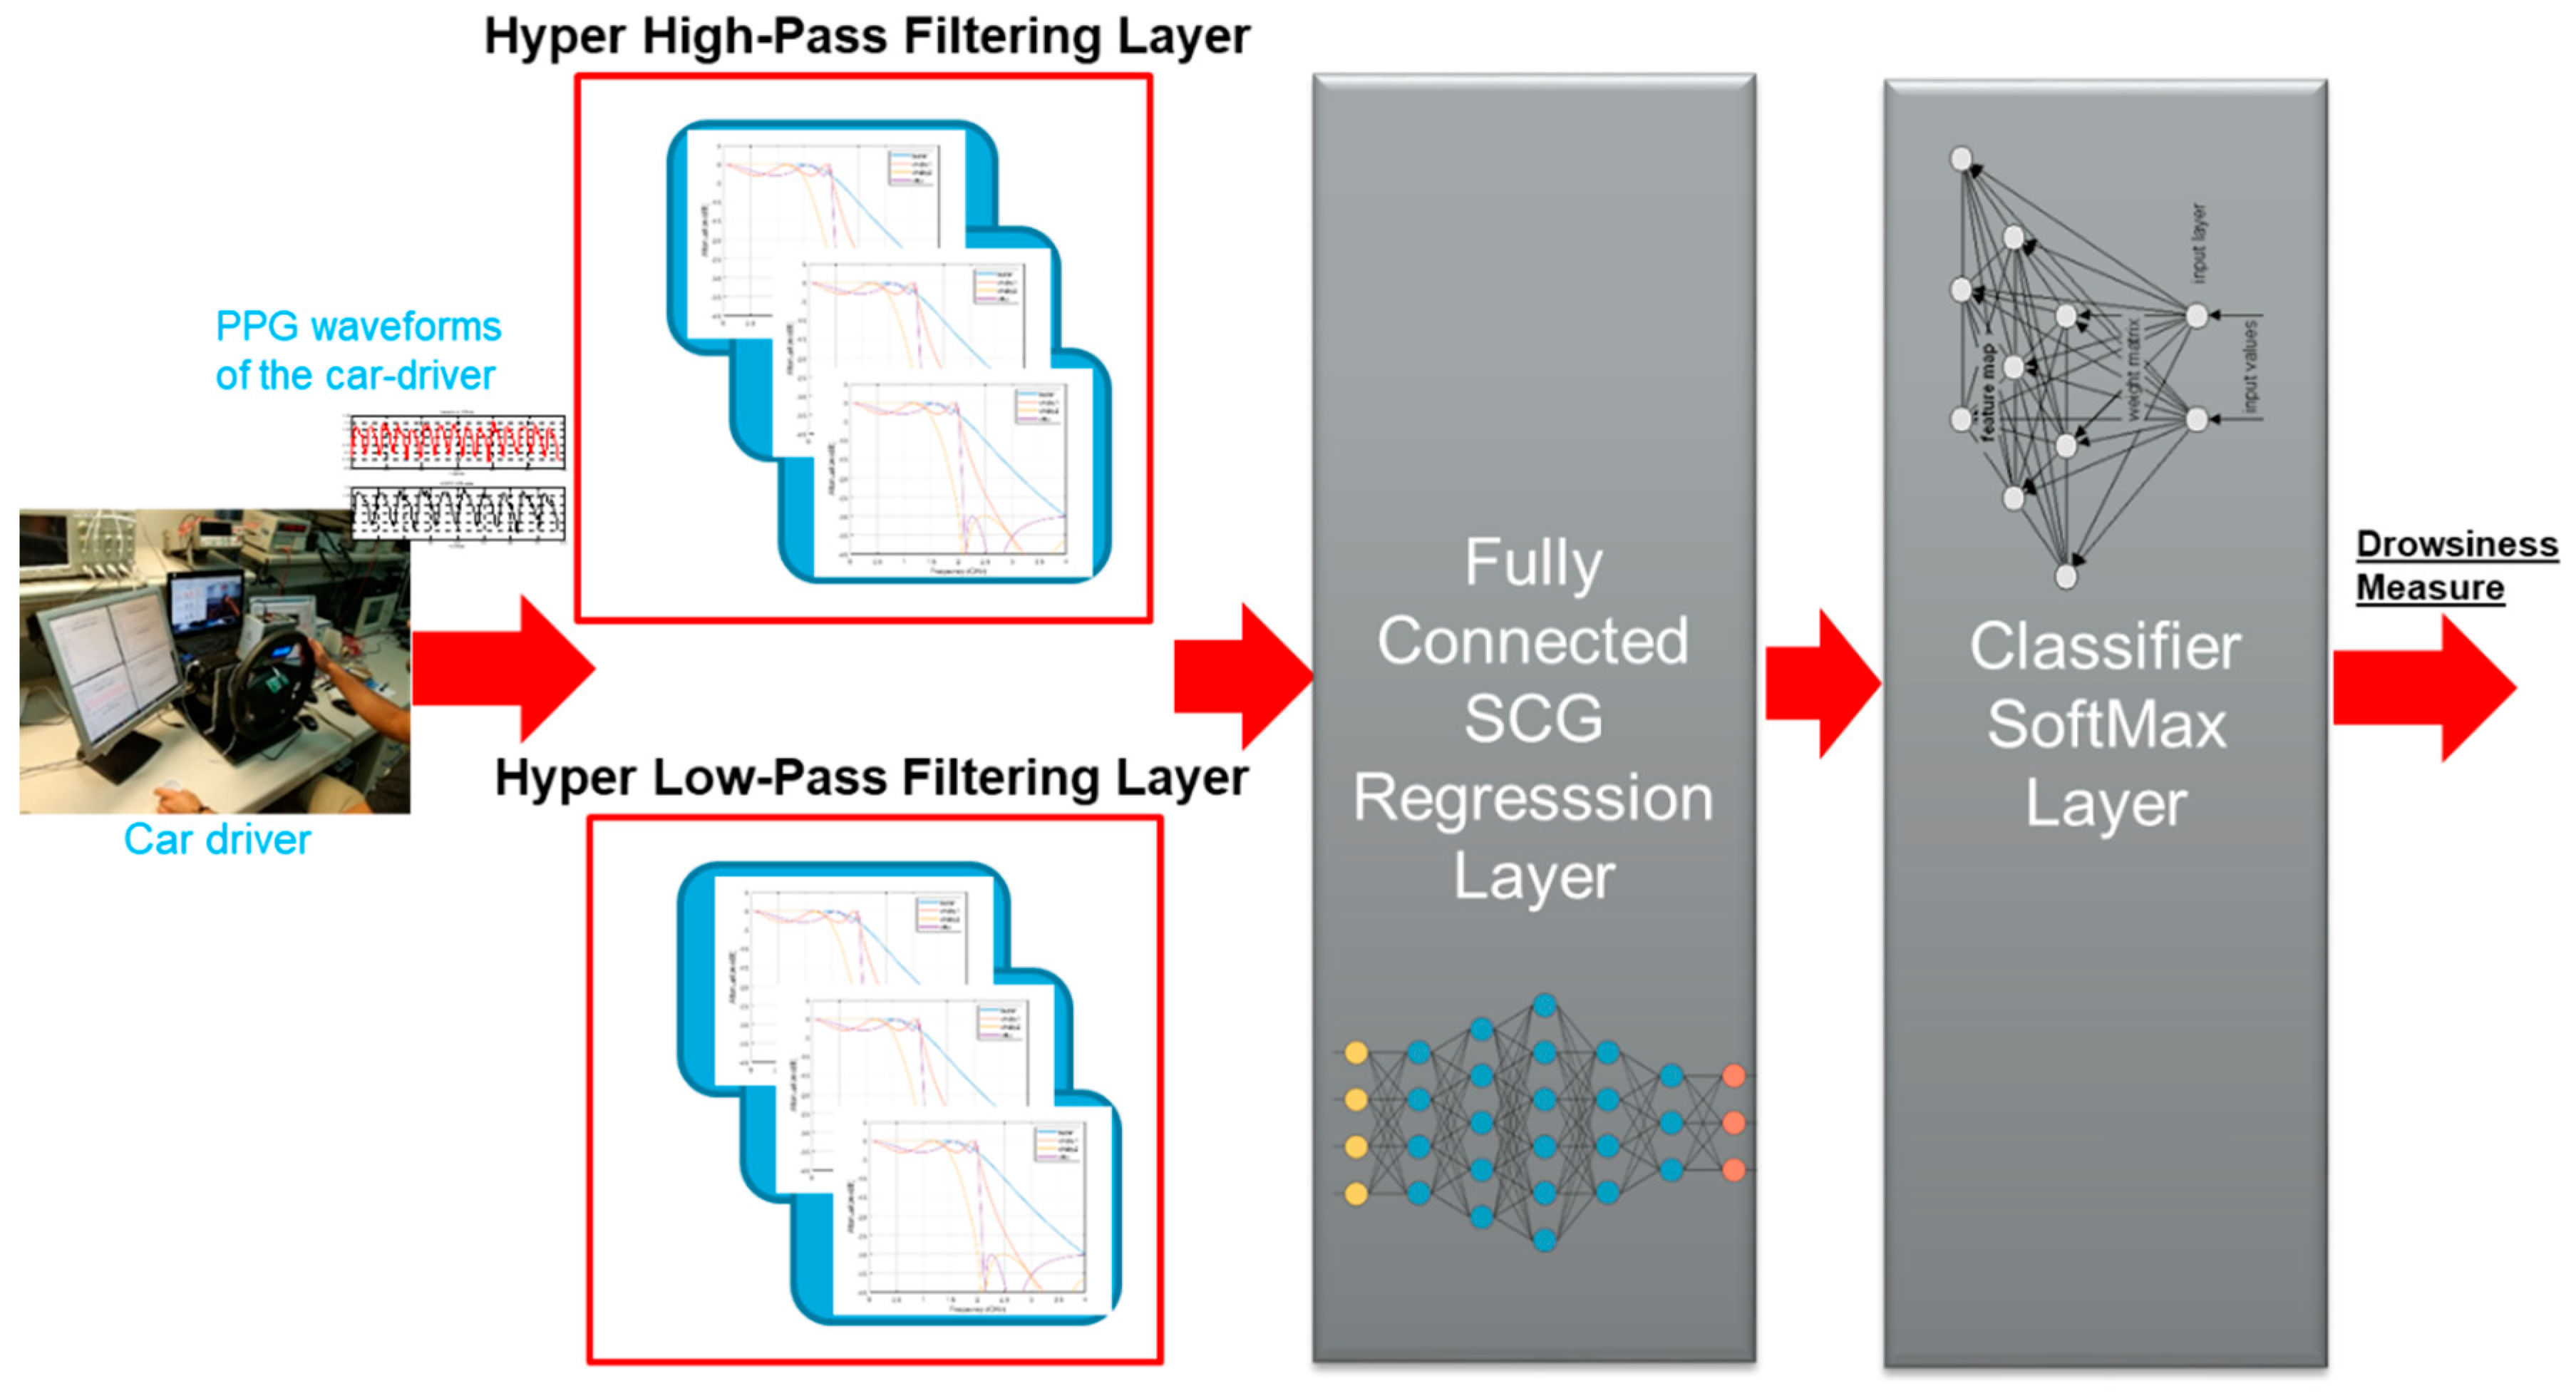
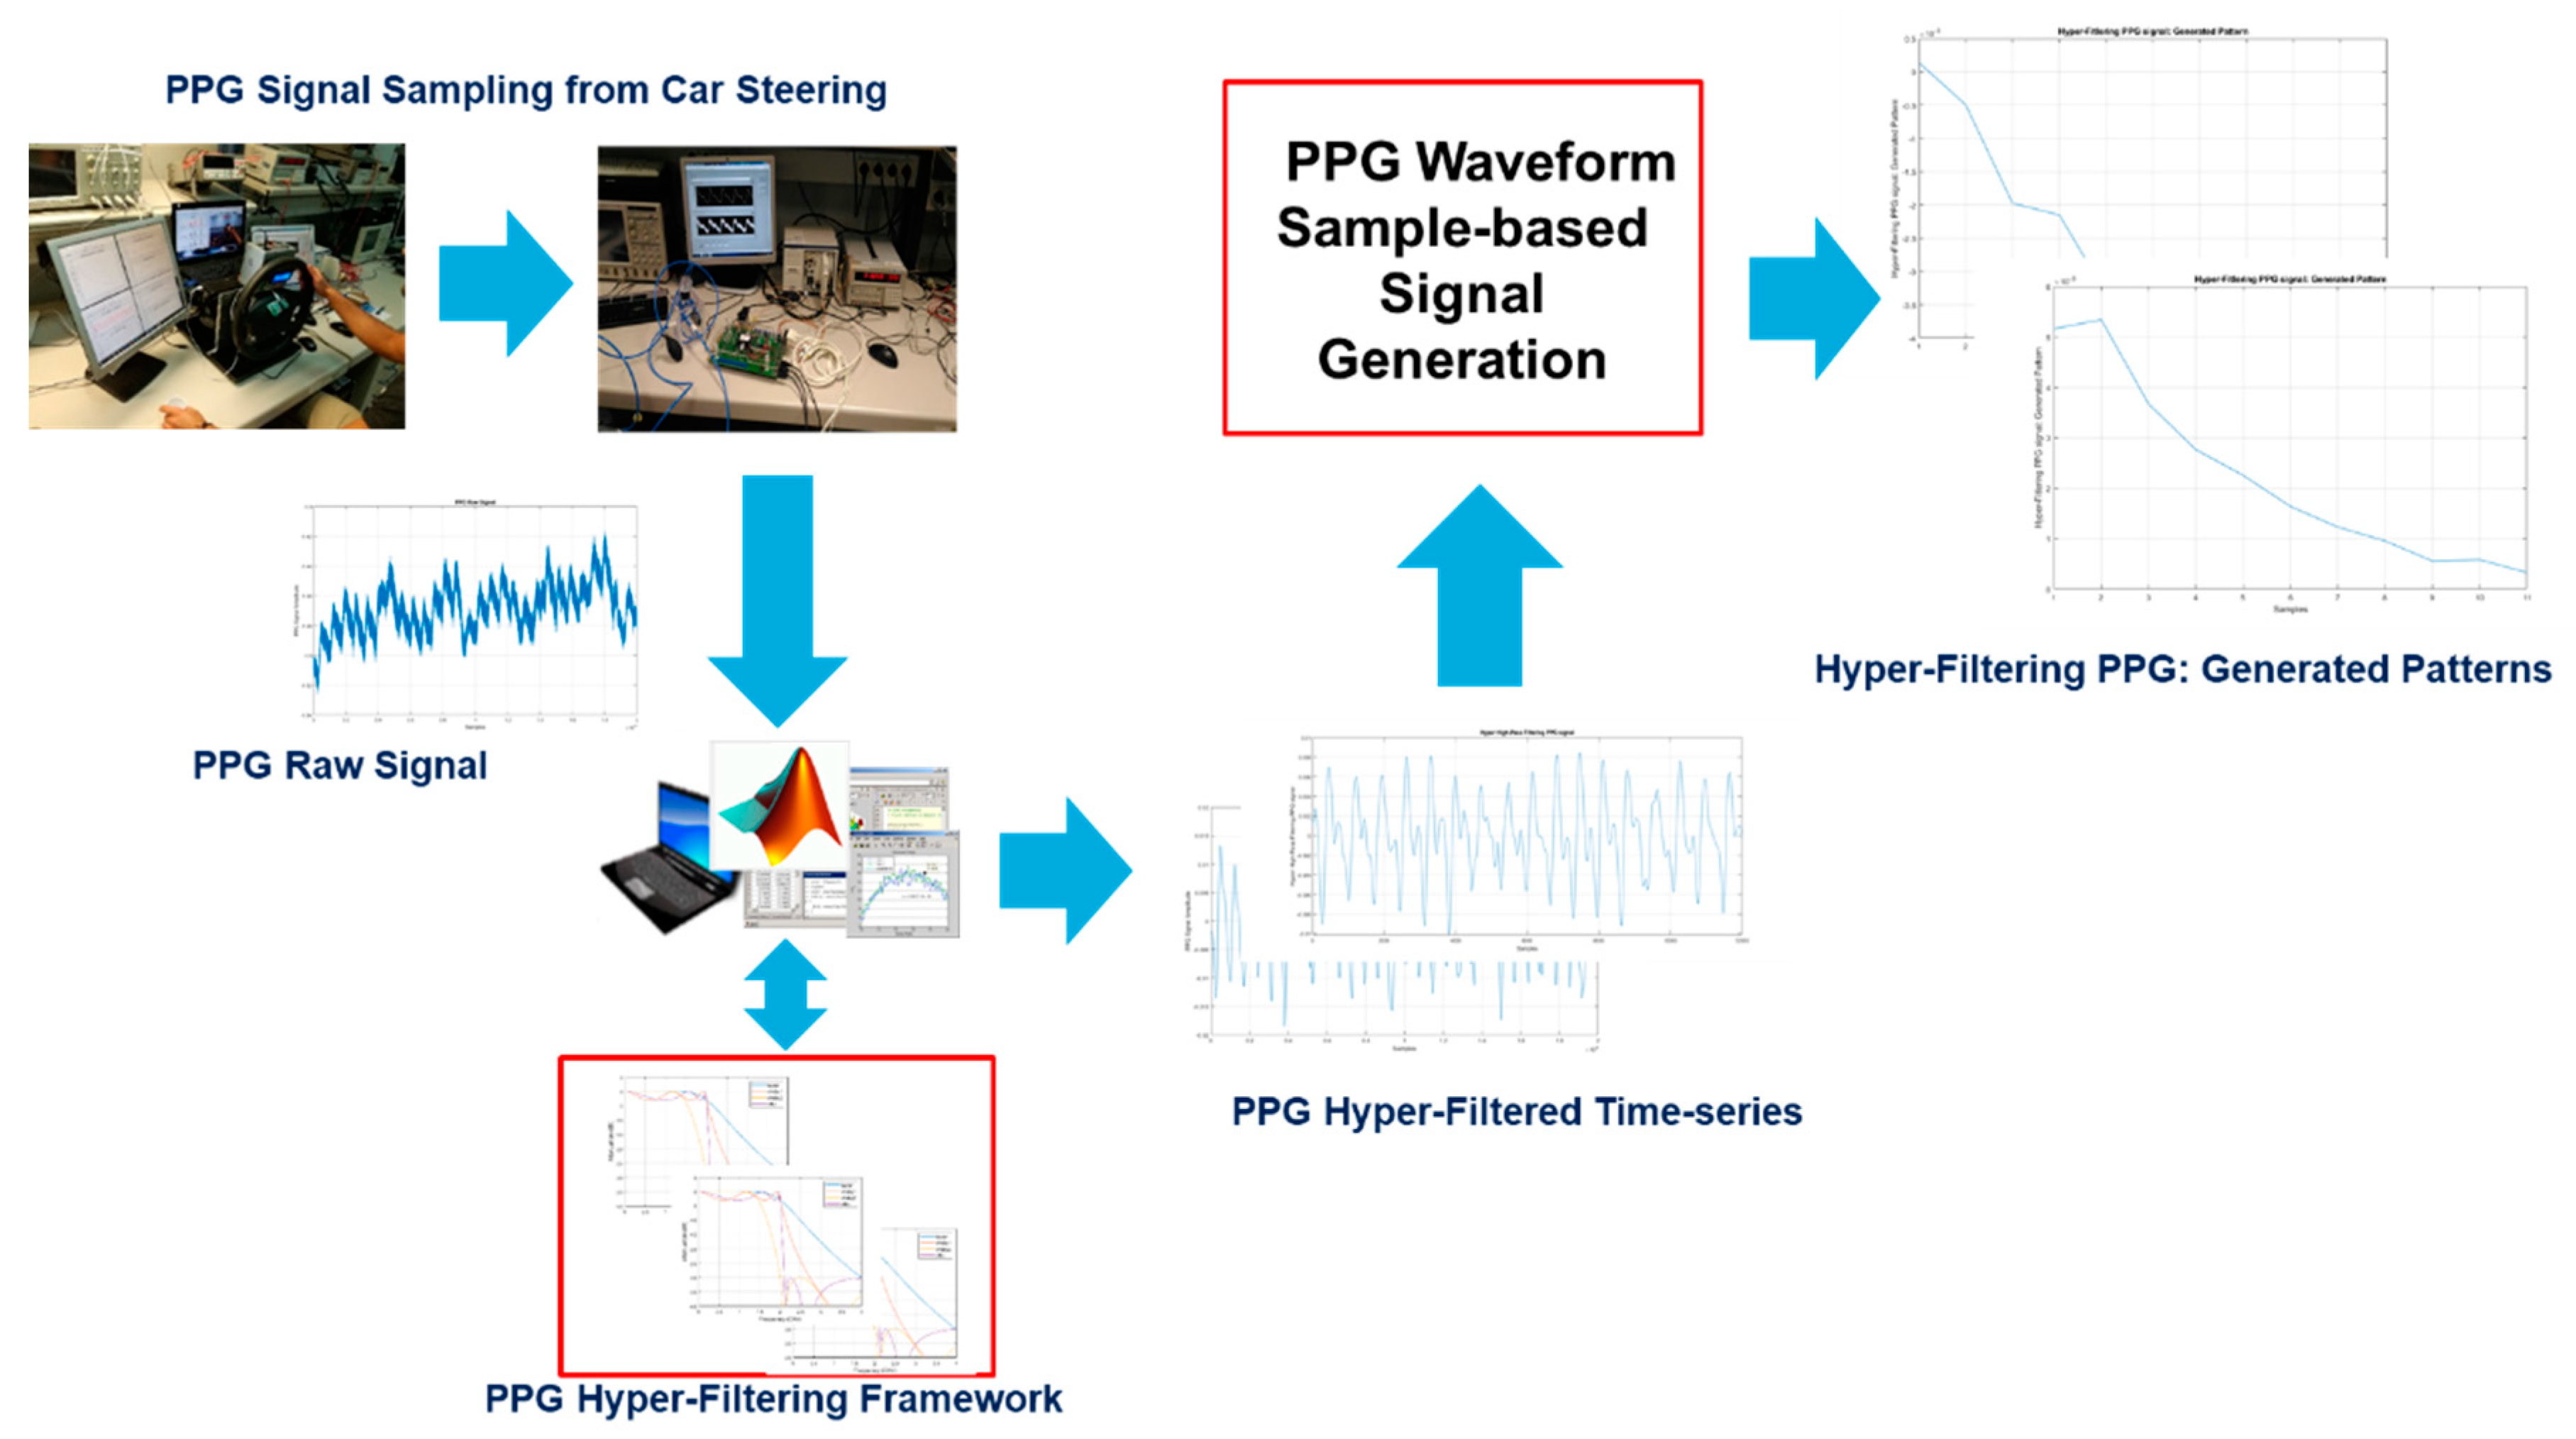
2.1. The Hyper Filtering Layers

As described in the work carried out by the authors in [6], the PPG signal in raw format requires a frequency filtering that allows us to filter the components that are not very useful for our objective (in addition to the classic harmonics of electronic noise and due to power). Moreover, considering the real scenario related to driving on the road, it is plausible to assume the presence of disturbances due to the movement of the driver’s hands or to the vibrations due to the road mandate or to the car engine. To this end, both in terms of frequency filtering and signal stabilization, the authors proposed a bio-inspired pipeline that allows excellent results to be obtained, as widely documented in the work reported in [6] and then later in [15,16,17]. Taking up only what is of interest for the pipeline objective described here, the following is the range of filter frequencies that are usually proposed in scientific literature in relation to the PPG signal [6].
Specifically, a set of FIR filters are configured to work as low/high-pass filters for filtering at the range of 1–10 Hz, allowing the removal of the 50 Hz power line frequency noise, as well as such artifacts previously mentioned. A bio-inspired algorithm completes the stabilization of the PPG signal, as described in the work of [6]. In detail, the authors developed a near real-time stabilization system of the filtered PPG signal. The FIR filters used both for low frequencies (low pass) and for high frequencies (high pass) perform a classic filtering (with frequency values similar to those shown in Table 1) represented by the following classical discrete-time equation:
y P P G [ n ] = i = 0 N o δ i · x [ n i ] ,
in which we have defined N0 as the order of the used filter, while δ i represents the filter coefficients and n the number of samples of the processed raw PPG signal x[k]. Clearly, the signal y P P G [ n ] represents the filtered PPG waveforms.
Obviously, this is not enough to make the PPG signal stable for subsequent processing. It was necessary to stabilize the signal using an innovative bio-inspired model. As mentioned, the activity of the ANS correlated to the subject’s attention level influences cardiac activity, specifically the two phases of the cardiac cycle, namely the systole and the diastole, which are reflected in the PPG signal patterns (see Figure 1). The authors hypothesized to model the two phases of the systole–diastole cardiac cycle at the phases of a physical reaction-diffusion (RD) model, that is, the reaction phase combined with the diastole phase and the diffusion phase with the systolic phase. For this purpose, the authors proposed the following mathematical model for the mentioned RD system:
x 1 t = x 1 + ( 1 + μ ) y 1 β y 2 + ρ 1 x 2 t = x 2 + ( 1 + μ ) y 2 + β y 1 + ρ 2 y j = 1 2 ( | x j + 1 | | x j 1 | )   ;   j = 1 , 2 μ = 0.5 ;   ρ 1 = 0.3 ;   ρ 2 = 0.3 ;   β = 1 ;   x 1 ( 0 ) = 0.1 ;   x 2 ( 0 ) = 0.08
in which the variables x1 and x2 represent the reaction-diffusion (RD) dynamic properly characterized by the parameters β , ρ 1 , ρ 2 [6]. The following figure shows the dynamic of the x2 variable of the model reported in (2). It is clear that the dynamics of the variable x2 shown in Figure 7 is very similar to a classical PPG time series, confirming that the adopted RD model is well suited to modeling this dynamic.
Through the analytical study of the dynamics of the first and second derivative of the PPG signal combined with the correlation study between the PPG waveforms of the filtered signal and that of the RD model (variable x2), we were able to stabilize the acquired PPG signal, obtaining a robust time series that contains only PPG waveforms that conform to the photoplethysmographic signal standard. A more detailed description of the adopted stabilization pipeline is reported in the work of [6]. This stabilization pipeline is needed to confirm that the PPG signal being acquired is correct, and thus can be used for further processing related to the driver’s analysis of drowsiness.
Filtering with FIR filters using the frequencies shown in Table 1 is in fact the de-facto standard for the PPG signal. In this contribution, the authors intend to propose a different solution in relation to the filtering of the raw PPG signal. This idea will be better described in the next sections.
In the pipeline described herein, we replace this filters setup with another set of properly configured hyper-filtering layers. The idea that we intend to propose in this work takes hold of the already established idea of hyper-spectral processing usually applied to 2D imaging [18]. Hyperspectral imaging, like other spectral imaging, collects visual information from across the electromagnetic spectrum. The goal of hyperspectral imaging methodology is to retrieve the so-called “frequency spectrum of each pixel” in order to address the classical imaging issues such as objects recognition, materials identification, and so on [18]. Well, trying to imitate the same approach, the authors investigated the utility of applying the same approach to the study and analysis of 1D signals. In concrete terms, the authors investigated whether, by collecting the information deriving from a “hyper-filtering” to more than one frequency range of the original 1D signal (PPG, in this case), we could obtain useful information to characterize the “frequency spectrum of each signal sample”, that is, the information useful to address the problem for which the signal is analyzed—in our case, the detection of the driver’s level of attention (drowsiness monitoring).
For this reason, instead of applying a single filter set (low pass and high pass) to a well-defined frequency, we analyzed a range of frequencies that would allow us to better characterize the value of the single signal-sample as the filtering frequency varies. Considering that the useful frequency range, which allows to obtain an information component of the PPG signal, is included in the 1–10 Hz set, we have investigated the possibility of appropriately subdividing this frequency range in sub-intervals determining the frequencies cutting to be applied to simulate the phenomenon of hyper-filtering. Considering that, in the case of the PPG signal, it is necessary to apply both a low-pass and a high-pass filtering (therefore, a band-pass filter is required to be exact), we opted for two layers of hyper-filtering—one that varied the frequencies in the low-pass regime maintaining instead the cut-off frequency of the high-pass filter (hyper low-pass filtering layer) and, vice versa, one that varied the cut-off frequencies of the high-pass filter while maintaining constant the frequency of the low pass filter (hyper high-pass filtering layer). When we refer to the static filter setup, we will refer to the setup of frequencies shown in Table 1. Furthermore, considering the need to have filters that do not create distortions or modulations in the bandwidth, we decided to opt for the use of Butterworth filters in both layers of hyper-filtering. As is known, Butterworth filters are the simplest electronic filters usable for signal processing applications. The strength of the Butterworth filter is precisely to keep the frequency response module in the passband as flat as possible—exactly the feature we are looking for. Butterworth filters are all systems whose transfer function H ( j ω ) contains a Butterworth polynomial both in the denominator and/or numerator:
H ( j ω ) = B ( n ) ( j ω ω 0 ) B ( m ) ( j ω ω 0 ) ,
where B ( k ) ( j ω ω 0 ) represents a Butterworth polynomial of k-order and ω 0 the related cut-off frequency. More details about Butterworth filters can be found in the work of [19].
At this point, we used a classical “trial-and-error” approach that would first search for the best number of sub-intervals in the 1–10 Hz frequency range. Specifically, after a series of heuristic tests in which we verified the detecting ability of the driver’s drowsiness depending on the number of filter sub-bands, we reached a value equal to 11 sub-intervals as the best trade-off between computational load and discriminative capacity. In practice, in our experiments, we found that when using a smaller number of frequency sub-bands (<11), the detection performance of the drowsiness level of the entire system decreased a lot. Meanwhile, increasing the number of sub-bands (>11), the performances remained almost stable, although the computational load of the whole algorithm obviously increased. Therefore, in order to find a correct trade-off between performance and computational load, we established that 11 sub-bands were enough to properly discriminate the level of attention of the driver.
Therefore, for each hyper-filtering layer, we proceeded to subdivide the range of applicable frequency in 11 specific sub-bands. Once the number of sub-bands was set, we put together a reinforcement learning algorithm structured as follows:
  • We defined an action at as the sub-band frequency value between 0 Hz and cut-off frequency (frequency pass on Table 1) according to the type of filtering (low-pass or high-pass);
  • We defined an Agent select the action at;
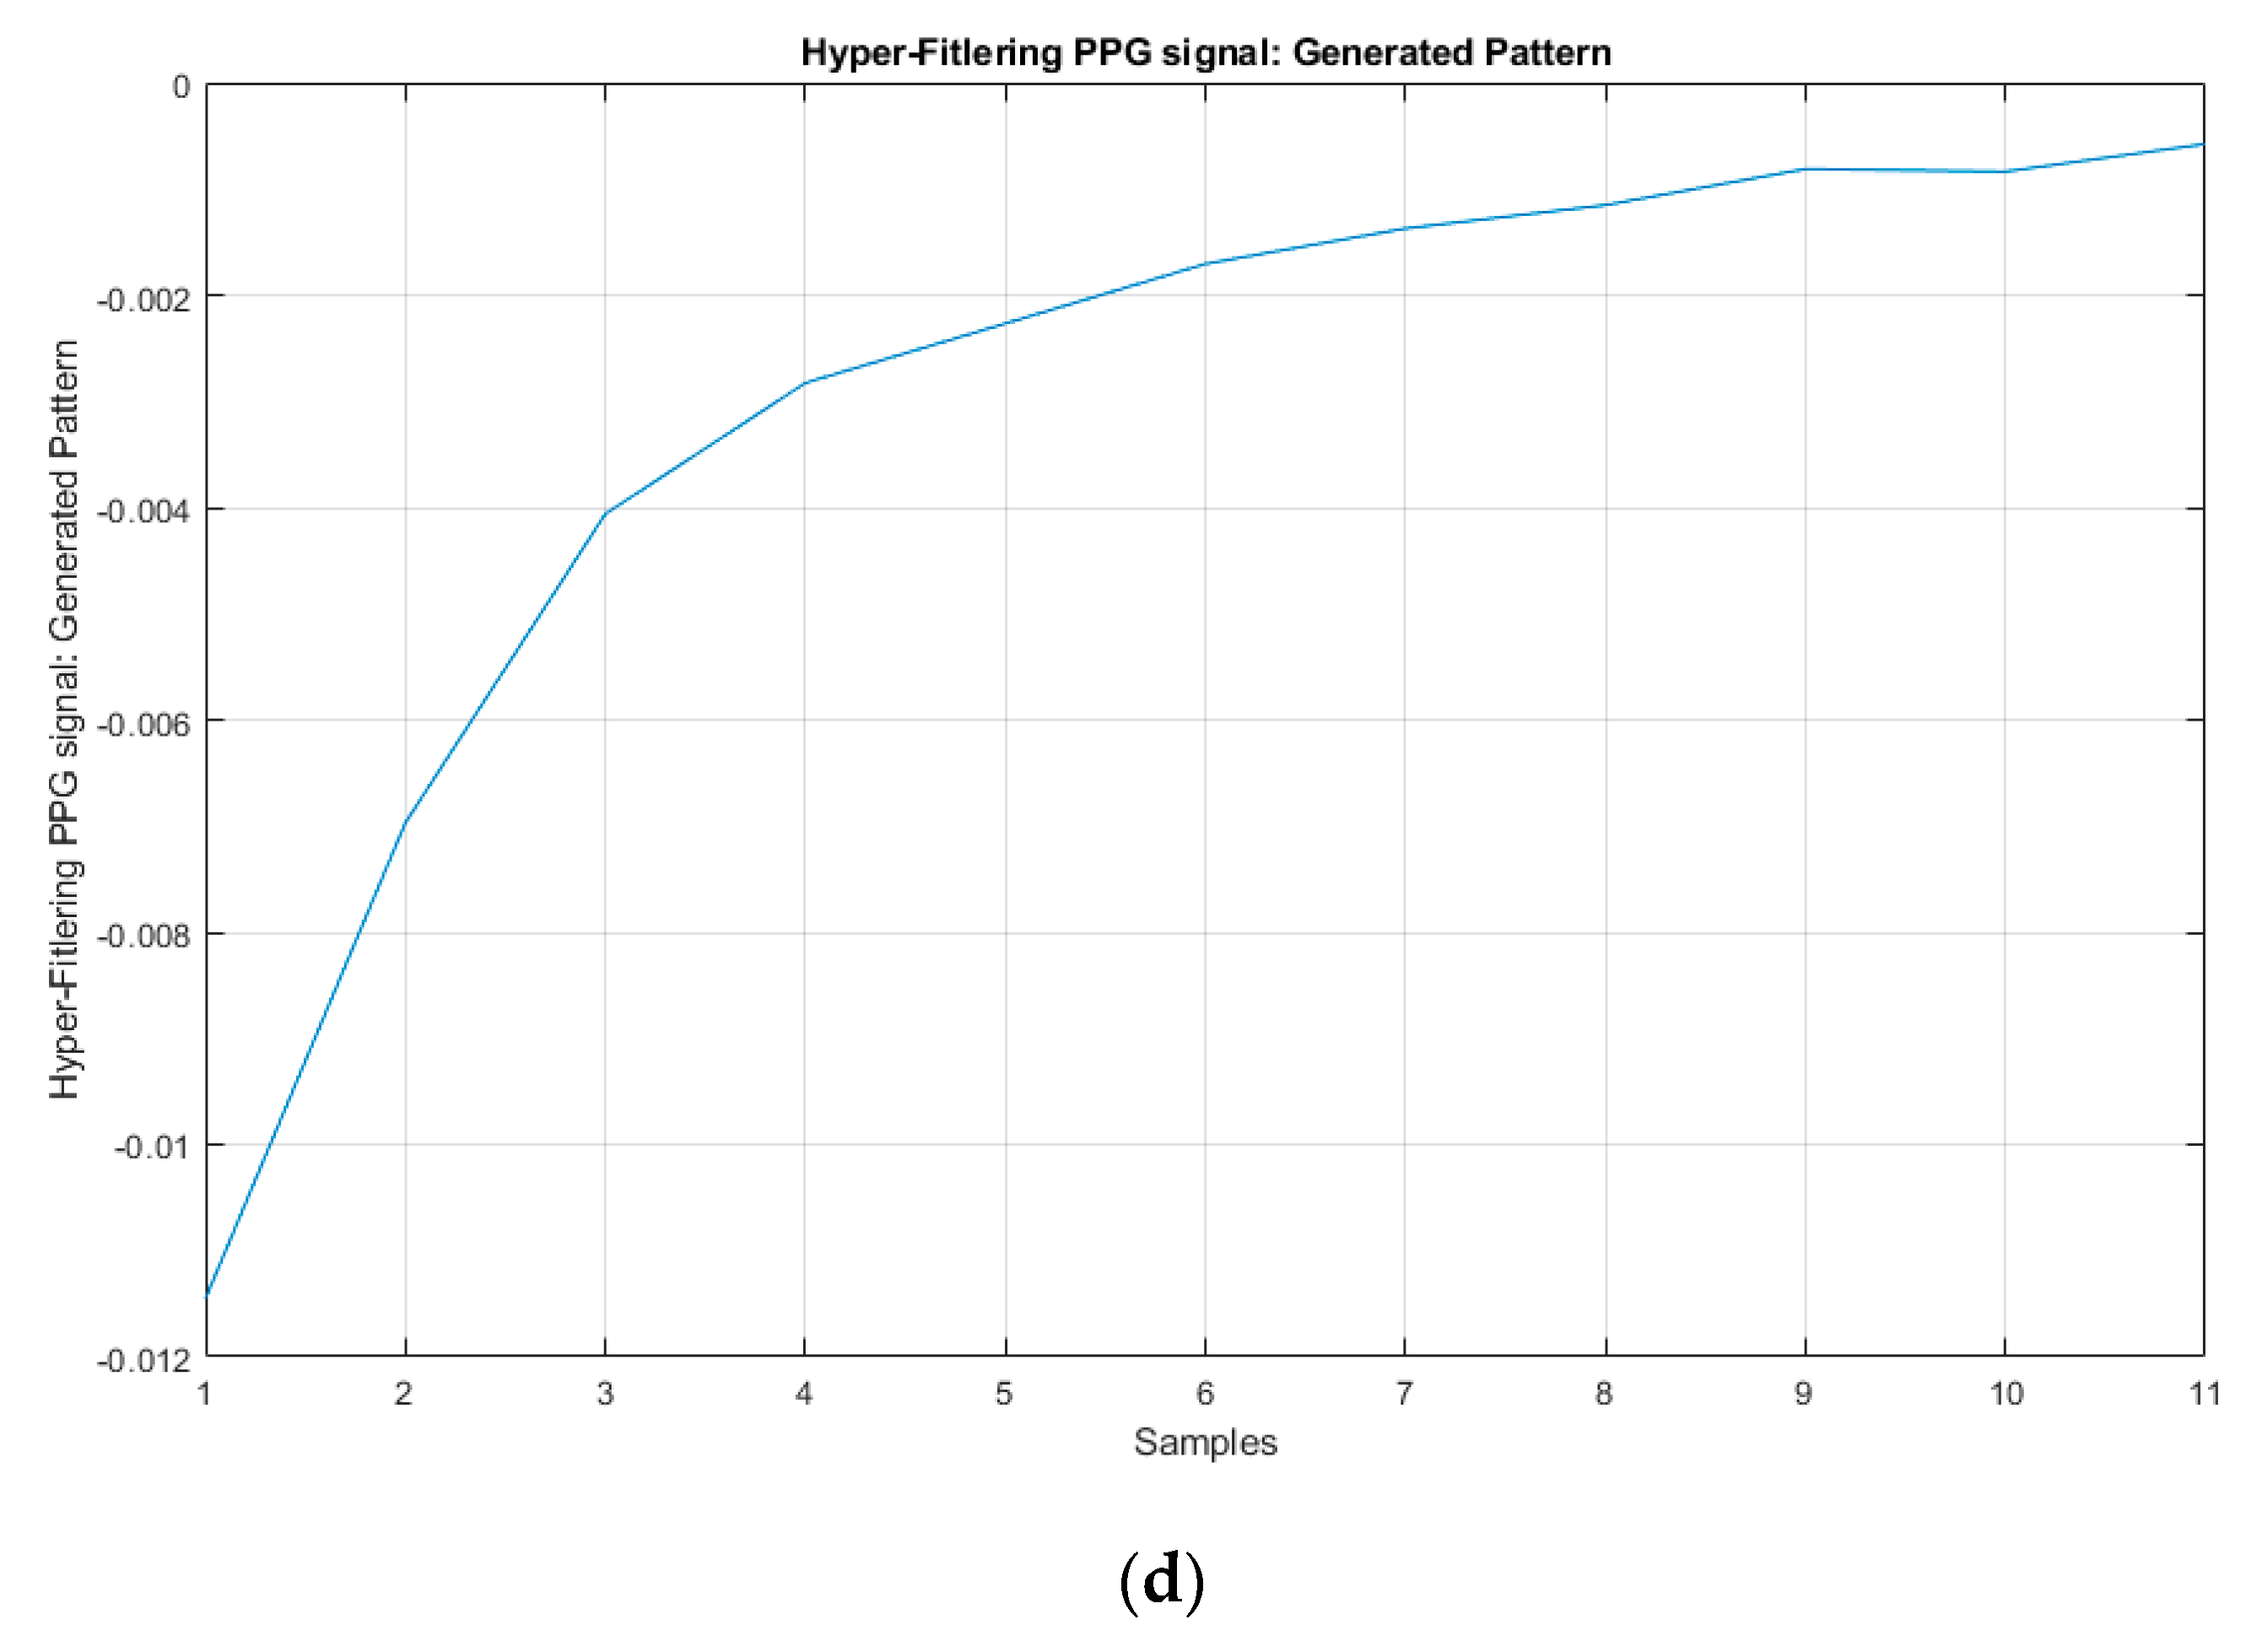
  • We defined a next state St+1 as a set of pre-processed signals obtained collecting the value of each input PPG samples (in a windows of 5 sec sampling at 1 KHz as sampling frequency) of the filtered PPG raw signal at specific sub-band frequency of the action at;
  • We define an environment Reward as R(.|st,at), i.e., a measure of drowsiness of the car driver. We defined as R(.|st,at) the distance of the output of the machine learning system (regression layer plus SoftMax classification as per Figure 6) with respect to the actual level of attention of the car-driver (confirmed by the analysis of the simultaneously acquired EEG signal, as described in the next sections of the paper)
We are interested to determine the optimal policy Po that minimizes the cumulative discount reward:
P o = a r g m a x P o   E [ t 0 γ t R ( . | s t , a t ) | P o   ] ,
where γ is a proper discounted coefficient in (0, 1). In order to evaluate the the goodness of a state st and the goodness of a state-action couple (st, at), we defined the value function and the Q-value function, respectively, as follows:
V P 0 ( s t ) = E [ t 0 γ t R ( . | s t ) | P o   ] ,
Q P 0 ( s t , a t ) = E [ t 0 γ t R ( . | s t , a t ) | P o   ] .
By solving the above models through classical Q-learning algorithms [20], we found the following set of sub-band frequency for each hyper-filtering layer.
Once we have identified the optimal frequency setup using the described RL algorithm in order to proceed to the hyper filtering of the PPG signal, the latter will be disconnected from the pipeline as it is no longer needed for the operation of the proposed system concerning the discrimination and monitoring of the driver’s level of drowsiness. Therefore, the RL algorithm served us simply as a “one-spot” optimization algorithm to be used only in the search phase of the filtering frequency setup, and thus it will no longer be used by the proposed pipeline. Obviously, we could have used different optimization methods to find the optimal frequency values (genetic algorithms, multi-objective optimization, and so on), although we decided to use RL as we believe it is more easily extensible if we decide to revise to the proposed pipeline.
At this point, once the frequency sets of the two hyper-filtering layers have been identified, the PPG raw signal that is gradually acquired will be processed accordingly.
Formally, if we indicate with x(k) the acquired raw PPG signal, for each frequency setup, we obtain the following hyper-filtered time series:
φ H L P i ( k ) = B u t t e r w o r t h ( f L i   , f H   , x ( k ) ) i = 1 , 2 , 11   ; k = 1 , 2 , . n ,
φ H H P i ( k ) = B u t t e r w o r t h ( f L   , f H   i , x ( k ) ) i = 1 , 2 , 11   ; k = 1 , 2 , . n ,
where φ H H P i ( k ) and φ H L P i ( k ) represent the set of hyper-filtered time series coming from hyper-filtering high-pass and low-pass layers, respectively. The function B u t t e r w o r t h represents the filter processing performed by the configured Butterworth filter, while f L , f H represent the fixed cut-off frequencies and f H   , i f L i the variable ones as per Table 2 and Table 3. Now, for each sample of the single waveform of the source PPG, a dataset of signals will be created, each having a temporal dynamics represented by the value of the single sample of the PPG waveform after the relative filtering, that is, by the corresponding sample value of the each hyper-filtered signal φ H H P i ( k ) and φ H L P i ( k ) for i = 1, 2, …, 11. Figure 8 shows the further processing performed by the proposed pipeline.
Formally, if we indicate with W P P G i ( t k ) the single segmented waveform of each hyper-filtered PPG time series, we proceed computing for each sample s(tk) of the waveform a signal-pattern depending on how that signal sample s(tk) varies in intensity in the various hyper-filtered time series φ H H P i ( k ) and φ H L P i ( k ) for i = 1, 2, …11. In this way, we will obtain a fairly large dataset of signals whose length will thus be equal precisely to the number of filtering frequencies, that is, 11 in this case. The following equations show how we obtain the signal-patterns ζ H P k ( s ( t k ) ) and ζ L P k ( s ( t k ) ) for each sample of the acquired PPG waveforms:
ζ H P k ( s ( t k ) ) = [ φ H H P 1 ( t k ) , φ H H P 2 ( t k ) , φ H H P 11 ( t k ) ]   k = 1 , 2 , . n ,
ζ L P k ( s ( t k ) ) = [ φ H L P 1 ( t k ) , φ H L P 2 ( t k ) , φ H L P 11 ( t k ) ]   k = 1 , 2 , . n .
The following figures show some instances of the hyper-filtering PPG time series φ H H P i ( k ) and φ H L P i ( k ) , as well as related generated signal pattern ζ H P k ( s ( t k ) ) and ζ L P k ( s ( t k ) ) .
In Figure 9, we report some instances of the hyper-filtered PPG time series, both high and low-pass configuration, as per Table 2 and Table 3, that is, some instance of the time-series φ H H P i ( k ) and φ H L P i ( k ) . It is clear that varying the frequency setup of the used filters the dynamic is quite different with respect to classical PPG dynamic, so that it is suitable to highlight further information of the source raw signal. In Figure 10, some instances of the generated signal-patterns ζ H P k ( s ( t k ) ) and ζ L P k ( s ( t k ) ) are reported. The dynamic of the signal-patterns ζ H P k ( s ( t k ) ) and ζ L P k ( s ( t k ) ) shows how the single sample of the acquired PPG time series varies according to the applied frequency filtering. The study of these generated signal-patterns allows us to characterize with extreme precision the variations in dynamics of the source PPG signal and, therefore, of the level of attention related to it. We collected several signal-patterns as we performed the analysis of each sample of the hyper-filtered PPG time series in a proper timing window after the car-driver placed their hand over the steering wheel in the part where the PPG sensor probe is positioned. The below figures report the data acquired by the proposed system hardware (described in the previous paragraphs) which will be imported on a software framework as described in Figure 5 and Figure 6. The generated signal-patterns will be fed into the machine learning block, as described in the following sub-section.

2.2. The Machine Learning Block

As described in the overall scheme of the proposed pipeline reported in Figure 6, the signal-patterns generated by the previous block will be fed into a regression network learned through a modified back-propagation (BP) method, known as the scaled conjugate gradient (SCG) BP algorithm.
The core idea of the SCG algorithm is included on the classical conjugate gradient methods (CGM), that is, a class of optimization techniques that allow for minimizing the second derivative of the used learning performance error function [21,22]. From a general point of view, the neural network learning procedure is similar to minimize such performance error function dependent on the weights of the network. Depending on the number of layers and thus on weights, the algorithmic complexity of the learning phase can be high, which is why optimization algorithms are needed. Most of the mentioned optimization methods are based on the same strategy, that is, they try to minimize the performance error function by means of a local iterative process suitable to search a minimum of the performance error function. Basically, for each interaction “k”, the learning algorithm determines a search direction for which the global performance error function, at interaction “k”, is lower with respect to the previous value at interaction “k-1”.
Once the search direction was found, the optimization algorithm determines how far to go in the specified search direction, that is, a step size for the next iteration. Some algorithms propose to set the search direction to the negative gradient direction, as applied in the classical back-propagation learning algorithms [22].
The recalled conjugate gradient methods (CGM) are also based on the above general strategy, with the only exception being the choice of the search direction and step size are performed using information from the second order Taylor expansion approximation of the performance error (Hessian matrix). This means that the performance error is basically a quadratic function. The CGM algorithms assures that the global minimum is detected in a reduced number of iterations with respect to a classical gradient descent-BP algorithm. Anyway, for each learning iteration, the Hessian matrix has to be computed.
In the SCG algorithm, the complexity related to the Hessian computation is reduced by means of an estimation and approximation of the Hessian matrix, for which it will no longer be necessary to calculate each matrix coefficients at each iteration, but rather it will be possible to proceed with an estimation, evaluating in any case the goodness of this approximation by means of some heuristic parameters and checks. This result can be obtained by applying the Levenberg-Marquardt [23] approach to the conjugate gradient methods [21,22]. Obviously, for these reasons, the SCG algorithm requires only O(N) memory usage and O(NlogN) of learning complexity (against O(N2) and O(N logN) of classical BP algorithm, respectively), where N is the number of used neural weights in the network [22].
For the pipeline herein proposed, a SCG BP neural network composed of 11 neurons in the input layer (the length of each signal-pattern), 360 neurons in the hidden layer, and 1 classification layer based on the usage of a SoftMax architecture. About the classification layers based on the use of SoftMax, more details can be found in the work of [24].
The neural network framework output is the predicted drowsiness level of the car-driver, from which the pipeline acquires the PPG. Consequently, it generates the signal-patterns used as the input for the neural learning framework. To be precise, the classification layer has one output whose value will be considered indicative of adequate attention if it is included in the range [0–0.5], while on the other hand, it will be considered indicative of a low attention level in the case that the value will be in the range [0.51–1].
As confirmed by the results reported in the next section, the proposed deep learning framework is able to correctly estimate the level of drowsiness of the driver with high precision.

3. Results

In order to test and validate the proposed pipeline, we collected several PPG measurements of different subjects in different scenarios: drowsy driver versus wakeful driver. The PPG acquisitions were made under physiologists’ directive. We collected data from more than 70 patients with different ages, sex, and so on. During the testing acquisition of the PPG signals of the subject, we also collect the EEG signal simultaneously in order to confirm the attention level (drowsy subject versus wakeful ones). Specifically, through the simultaneous acquisition of the EEG signal, we had precise confirmation of the subject’s attention level by searching for the presence of alpha and beta waves, respectively, as known in the literature and moreover illustrated in the previous work carried out by the authors in relation to their correlation between EEG and drowsiness [24].
As described in the work of [24], in order to confirm that the subject is in a state of drowsiness or attention, we analyzed the EEG signal acquired simultaneously to the PPG one. This analysis is rooted in the classical approach of searching for the presence of alpha waves (typically centered in a frequency range 8–14 Hz) to confirm the state of drowsiness or beta waves (typically aperiodic) in the case of a high level of attention. Therefore, for each sampling session of the PPG signal, we simultaneously post-processed the corresponding acquired EEG signal to confirm the state of attention associated with each time series of acquired PPG signal. To confirm the presence or not of alpha/beta waves, we analyzed the EEG frequency spectrum [24]. The following figure shows the frequency spectrum of an EEG signal of a drowsy subject with respect to a wakeful one.
A comparison between Figure 11a,b shows the discriminative use of the EEG signal in confirming whether or not the corresponding PPG signal was acquired in a state of high attention or drowsiness. In Figure 11a, the presence in the acquired EEG signal of alpha waves is evident as the spectrum exposes a peak in the area 10.8–10.9 Hz, which characterizes a low level of attention, and thus drowsiness. In Figure 11b, a frequency spectrum of an aperiodic EEG signal is instead showed in which it is evident a typical dynamic of the presence of beta waves characterizing high level of attention.
We sampled the PPG signal of the subject using the hardware setup described in this paper with a sampling frequency of 1 KHz. For each condition (drowsy versus wakeful), we collected 5 minutes of PPG signals. All acquired PPG time-series for each level of attention and subject were collected and divided as 70% for the training phase of the machine learning framework, with the remaining 15% being used for validation and 15% for the final testing of the proposed pipeline. Obviously, the data used for testing the proposed pipeline were never fed to the network nor in the training session nor in validation. The method for improving generalization of the neural network used is the classical early stopping method. As said, the dataset is divided into three subsets (70% training, 15% validation, and 15% testing). In the training set, the proposed SCG algorithm performs the gradient and updating of the weights and biases (with fixed learning rate), while concurrently, the error on the validation set is monitored. The validation error normally decreases during the initial phase of training, but when the network begins to show overfitting behavior, the error on the validation set typically begins to rise. When the validation error increases for a specified number of iterations (we set 30 iterations), the learning is stopped, and the weights and biases at the minimum of the validation error are frozen and then used for the testing phase.
Moreover, in order to validate the robustness of the proposed approach, we built ad hoc PPG signals composed of parts of the signal acquired in a state of low attention and signal pieces corresponding to adequate attention levels. In this way, we were able to verify whether the algorithm was able to discriminate the attention levels in a robust and efficient way.
The following figures show the performance of the proposed pipeline in a scenario composed as described by time intervals in which the driver showed little attention (drowsy driver) from temporal moments in which instead the driver showed an adequate level of attention (wakeful driver). We consider such an interval of about 8 sec of PPG acquisition in order to show the high-speed capability of the proposed approach in discriminating a drowsy driver from wakeful ones.
Figure 12 and Figure 13 report two classification instances performed by the proposed method on two driver-subjects belonging to the dataset used to train the system. Specifically, Figure 12 shows the confusion matrix of the entire training/validation phase and subsequent testing of a PPG signal of about 8 sec (sampling frequency equal to 1 KHz) composed of various pieces of the PPG signal of the same subject acquired both during drowsiness and attention; similarly for the confusion matrices shown in Figure 13, although referring to another subject belonging to the dataset of patients monitored for this research. As it is possible to see from the overall performance (all confusion matrix and test confusion matrix) of the two analyzed subjects, the performances oscillate in the range 94%–97%, thus confirming the high discriminative capability of the proposed algorithm. In Figure 14, we report an instance of the ROC (Receiver operating characteristic) curve (for the subject reported in Figure 12) confirming the generalization capability of the proposed neural framework.
The overall average accuracy of the proposed approach tested in all the collected dataset is about 95.21%, confirming the high effectiveness of the proposed method in recognizing and discriminating the attention level of the driver. Moreover, considering the time interval selected for the tested scenarios (8 s), the obtained results confirm the robustness of the method in providing an estimate of the attention level in adequate times for the automotive sector.
The testing and validation phase was performed over a Intel 16-Cores Server with MATLAB release 2018b full-toolboxes running with a CUDA support provided by a NVIDIA GeForce RTX 2080 GPU included in the graphics card of the server used. While the learning and training phase required a few minutes, the testing and validation performed in feed-forward mode was able to provide results (estimation of car-driver drowsiness) in a time range near to real time.

4. Discussion and Conclusions

The results reported in the previous section confirmed, beyond any reasonable doubt, the capability of the proposed method in the early discrimination of the level of attention of the driver. The competitive advantage of the method herein described with respect to the methods proposed in the literature lies in the fact that it does not require any data analysis in the frequency domain, as it happens in the methods based on the use of the HRV indicator. In fact, as known in the literature, to obtain an estimation of the HRV indicator, it is necessary to process the original signal (usually ECG) both in the time domain and subsequently in the frequency domain. In particular, it is necessary to preliminary acquire and filter the ECG signal and then identify the dynamics of the R-R peaks intervals of the sampled ECG signal. Finally, it is needed to switch to the frequency domain and perform a frequency analysis usually through the calculation of the power spectral density (PSD) or, better still, of the Lomb–Scargle (LS) periodogram. This processing, although it allows obtaining a good estimation of the subject’s level of attention, is nevertheless computationally expensive as it requires the computation of the PSD or the LS periodogram, as well as considerable buffering data, as confirmed by the works reported in the scientific literature [1,2,3]. The proposed approach does not require any post-processing in the frequency domain nor any calculation of the PSD or the LS periodogram, drastically reducing the computational load needed to obtain an estimation of the driver’s drowsiness level. At the same sampling frequency (fs = 1KHz), we found that to determine the level of attention of the driver subject from the analysis of his/her HRV by means of the LS periodogram, it takes a few minutes of ECG buffering/processing [1,2,3], against a considerably reduced time needed for the proposed system.
Furthermore, the proposed method does not require sampling of the ECG nor EEG signals of the driver, which in fact are particularly difficult to acquire inside the car’s passenger compartment. It is true that the main method for determining the level of attention is certainly the analysis of the EEG signal, but this is not easily sampled inside a vehicle. In fact, to acquire the EEG signal even from a single channel, it is necessary to position electrodes in the subject’s head, and it is thus clear that its sampling is rather invasive and not very comfortable for the driver. Moreover, EEG sampling through electrodes placed in the subject’s head of the driver would require a series of safety checks and compatibility with automotive standards for the car and for the driver, not making it easy to use inside a car. In addition, some drivers may be reluctant to wear helmets or sensors for sampling the EEG signal. For these reasons, we prefer to use a method that is non-invasive for the driver and that allows obtaining an excellent level of estimation of drowsiness.
As described, the proposed method requires sampling only the PPG signal, which can be easily sampled by the described hardware system positioned in the steering of the car. As demonstrated by the performed tests, the proposed pipeline requires only a few seconds of acquisition to correctly discriminate the attention level of the driver. The level of accuracy achieved is optimal if one considers that the method must obviously be combined with other methods of recognition of the level of attention, such as the imaging methods in the visible and infrared spectrum. The machine learning framework with which the proposed method is equipped has proven to be adequate for the task of learning data (signal-patterns) generated by the pre-processing of the waveforms of the acquired PPG signal. In fact, the ability to discriminate the attention level has proven to be high in the large training set, which, as mentioned, included several minutes of PPG signal acquisition in more than 70 subjects in both scenarios (drowsy versus wakeful). The basic idea of discriminating the level of attention of the driver through an hyper-filtering technique of the PPG signal originated, as anticipated in the introductory section, from the intuition to contextualize the hyper-spectral approach successfully applied in the solution of problems in the imaging/video field. Moreover, the authors wanted to better investigate the variation of the information content of the PPG signal for different frequency filtering sets, trying to understand if these dynamics could be useful in the characterization of the “naked” variations that are anyway present in the PPG signal every time a variation of attention occurs in the analyzed subject. In practice, with this method, we wanted to emulate another approach widely known in the video/imaging field, that is, “motion magnification”, in which the authors are able to highlight the dynamics of motion that best characterize the analyzed scenario, opportunely amplifying some range of frequencies apparently not visible to the naked eye. Similarly, through the generation of the various signal-patterns in the proposed article, we tried to study the “micro-variations” of the information content of the PPG signal, thus determining if these patterns could be predictive of variations in the level of drowsiness. The excellent results obtained and reported in the confusion matrixes shown in Figure 12 and Figure 13 confirmed that both intuitions were correct and well suited for monitoring the driver’s level of drowsiness by analyzing only the PPG signal.
We prefer to use the machine learning approach instead of classical methods (such as K-nearest approach, support vector machine, or random forest), because the authors believe it performs better than these classic methods and because it is more easily extendable as well as portable in the embedded devices with which the latest generation cars are equipped.
The machine learning algorithm is currently being ported to an embedded system based on the SoC STA1295 ACCORDO 5 based platform produced by STMicroelectronics (software environment with embedded Linux), which is equipped with several ARM Cortex cores as well as a GPU for 3D graphics and a video and image dedicated pipeline [25]. Moreover, the part of the proposed pipeline that takes care of acquiring and processing the PPG signal appropriately is being ported to a hardware/software environment based on SPC5x CHORUS microcontroller technology released by STMIcroelectronics [26].
Figure 15 shows the hardware setup on which the pipeline is being ported.
Currently, the authors are investigating further extending the pipeline produced, including the use of modern convolutional neural networks with dilation (D-CNNs), especially for applications in the medical sector, where promising results have already been obtained [27,28]. Interesting results (increase in the drowsiness monitoring performance and further reduction of the computational load) were obtained by the authors by combining the features obtained through the hyper-filtering system proposed in this article with ad hoc hand-crafted features [29] combined with a study of the PPG signal auto-correlation [30]; both have already been successfully used in other applications in the medical field. These results will be presented in a future article on the same subject. Moreover, we are investigating the approach described in the work of [31], which offers a solution to acquire the ECG signal through a single point of contact, being able to integrate the information of the electrocardiographic signal in the pipeline proposed by us.

5. Patents

F. Rundo, S. Conoci, Combined Hyper Butterworth Filtering and Machine Learning for Efficient High-speed Time-based Drowsiness Detection in Next-Generation Cars, IT Patent Nr. 102019000005868, 16 April 2018;
F. Rundo, F. Trenta, S. Battiato, S. Conoci, Advanced Motion-Tracking System with Multi-Layers Deep Learning Framework for Innovative Car-Driver Drowsiness Monitoring, IT Patent Nr. 102019000000133, 07 January 2019

Author Contributions

Conceptualization, Methodology, Software, F.R.; Validation, F.R.; Formal Analysis, F.R. and S.C.; Investigation, F.R.; Writing—Original Draft Preparation, F.R.; Writing—Review and Editing, S.C., C.S., and F.R.; Supervision, S.C.

Funding

This research was funded by from the National Funded Program 2014-2020 under grant agreement n. 1733, (ADAS + Project).

Conflicts of Interest

The authors declare no conflict of interest.

References

  1. Igasaki, T.; Nagasawa, K.; Murayama, N.; Hu, Z. Drowsiness estimation under driving environment by heart rate variability and/or breathing rate variability with logistic regression analysis. In Proceedings of the IEEE International Conference on Biomedical Engineering and Informatics (BMEI), Shenyang, China, 14–16 October 2015. [Google Scholar]
  2. Vicente, J.; Laguna, P.; Bartra, A.; Bailón, R. Detection of driver’s drowsiness by means of HRV analysis. In Proceedings of the IEEE Computing in Cardiology, Hangzhou, China, 18–21 September 2011. [Google Scholar]
  3. Szypulska, M.; Piotrowski, Z. Prediction of fatigue and sleep onset using HRV analysis. In Proceedings of the IEEE the 19th International Conference Mixed Design of Integrated Circuits and Systems—MIXDES, Warsaw, Poland, 24–26 May 2012. [Google Scholar]
  4. Fujiwara, K.; Abe, E.; Kamata, K.; Nakayama, C.; Suzuki, Y.; Yamakawa, T.; Hiraoka, T.; Kano, M.; Sumi, Y.; Masuda, F.; et al. Heart rate variability-based driver drowsiness detection and its validation with EEG. IEEE Trans. Biomed. Eng. 2019, 66, 1769–1778. [Google Scholar] [CrossRef] [PubMed]
  5. Abi-Saleh, B.; Omar, B. Einthoven’s triangle transparency: A practical method to explain limb lead configuration following single lead misplacements. Rev. Cardiovasc. Med. 2010, 11, 33–38. [Google Scholar] [PubMed]
  6. Rundo, F.; Conoci, S.; Ortis, A.; Battiato, S. An Advanced Bio-Inspired PhotoPlethysmoGraphy (PPG) and ECG Pattern Recognition System for Medical Assessment. Sensors 2018, 18, 405. [Google Scholar] [CrossRef] [PubMed]
  7. Xu, Y.J.; Ding, F.; Wu, Z.; Wang, J.; Ma, Q.; Chon, K.; Clancy, E.; Qin, M.; Mendelson, Y.; Fu, N.; et al. Drowsiness control center by photoplythesmogram. In Proceedings of the IEEE 38th Annual Northeast Bioengineering Conference (NEBEC), Philadelphia, PA, USA, 16–18 March 2012. [Google Scholar]
  8. Kurian, D.; Radhakrishnan, K.; Balakrishnan, A.A. Drowsiness detection using photoplethysmography signal. In Proceedings of the IEEE Fourth International Conference on Advances in Computing and Communications, Kochi, India, 27–29 August 2014. [Google Scholar]
  9. Ryu, G.S.; You, J.; Kostianovskii, V.; Lee, E.B.; Kim, Y.; Park, C.; Noh, Y.Y. Flexible and printed PPG sensors for estimation of drowsiness. IEEE Trans. Electron Devices 2018, 65, 2997–3004. [Google Scholar] [CrossRef]
  10. Hong, T.; Qin, H. Drivers drowsiness detection in embedded system. In Proceedings of the IEEE International Conference on Vehicular Electronics and Safety, Beijing, China, 12–15 October 2007. [Google Scholar]
  11. Alshaqaqi, B.; Baquhaizel, A.S.; Ouis, M.E.A.; Boumehed, M.; Ouamri, A.; Keche, M. Driver drowsiness detection system. In Proceedings of the IEEE 8th International Workshop on Systems, Signal Processing and their Applications (WoSSPA), Algiers, Algeria, 12–15 May 2013. [Google Scholar]
  12. Sari, N.N.; Huang, Y.P. A two-stage intelligent model to extract features from PPG for drowsiness detection. In Proceedings of the IEEE International Conference on System Science and Engineering (ICSSE), Puli, Taiwan, 7–9 July 2016. [Google Scholar]
  13. Cheon, S.P.; Kang, S.J. Sensor-based driver condition recognition using support vector machine for the detection of driver drowsiness. In Proceedings of the IEEE Intelligent Vehicles Symposium (IV), Redondo Beach, CA, USA, 11–14 June 2017. [Google Scholar]
  14. Choi, H.T.; Back, M.K.; Lee, K.C. Driver drowsiness detection based on multimodal using fusion of visual-feature and bio-signal. In Proceedings of the International Conference on Information and Communication Technology Convergence (ICTC), Jeju Island, Korea, 17–19 October 2018. [Google Scholar]
  15. Vinciguerra, V.; Ambra, E.; Maddiona, L.; Romeo, M.; Mazzillo, M.; Rundo, F.; Fallica, G.; di Pompeo, F.; Chiarelli, A.M.; Zappasodi, F.; et al. PPG/ECG multisite combo system based on SiPM technology. Lect. Notes Electr. Eng. 2019, 539, 105–109. [Google Scholar]
  16. Mazzillo, M.; Maddiona, L.; Rundo, F.; Sciuto, A.; Libertino, S.; Lombardo, S.; Fallica, G. Characterization of sipms with nir long-pass interferential and plastic filters. IEEE Photonics J. 2018, 10, 1–12. [Google Scholar] [CrossRef]
  17. Conoci, S.; Rundo, F.; Fallica, G.; Lena, D.; Buraioli, I.; Demarchi, D. Live Demonstration of portable systems based on silicon sensors for the monitoring of physiological parameters of driver drowsiness and pulse wave velocity. In Proceedings of the IEEE Biomedical Circuits and Systems Conference (BioCAS), Cleveland, OH, USA, 17–19 October 2018. [Google Scholar]
  18. Chang, C.I. Hyperspectral Imaging: Techniques for Spectral Detection and Classification; Springer Science & Business Media: Berlin, Germany, 2003; ISBN 978-0-306-47483-5. [Google Scholar]
  19. Bianchi, G.; Sorrentino, R. Electronic Filter Simulation & Design; McGraw-Hill Professional: New York, NY, USA, 2007; ISBN 978-0-07-149467-0. [Google Scholar]
  20. Sutton, R.S.; Barto, A.G. Reinforcement Learning: An Introduction; MIT Press: Cambridge, MA, USA, 1998. [Google Scholar]
  21. Moller, M.F. A Scaled Conjugate Gradient Algorithm for Fast Supervised Learning. Neural Netw. 1993, 6, 525–533. [Google Scholar] [CrossRef]
  22. Rundo, F.; Trenta, F.; di Stallo, A.L.; Battiato, S. Grid Trading System Robot (GTSbot): A Novel Mathematical Algorithm for Trading FX Market. Appl. Sci. 2019, 9, 1796. [Google Scholar] [CrossRef]
  23. Rundo, F.; Conoci, S.; Banna, G.L.; Ortis, A.; Stanco, S.; Battiato, S. Evaluation of Levenberg–Marquardt neural networks and stacked autoencoders clustering for skin lesion analysis, screening and follow-up. IET Comput. Vis. 2018, 12, 957–962. [Google Scholar] [CrossRef]
  24. Rundo, F.; Rinella, S.; Massimino, S.; Coco, M.; Fallica, G.; Parenti, R.; Conoci, S.; Perciavalle, V. An Innovative Deep Learning Algorithm for Drowsiness Detection from EEG Signal. Computation 2019, 7, 13. [Google Scholar] [CrossRef]
  25. STMicroelectronics ACCORDO 5 Automotive Microcontroller. Available online: https://www.st.com/en/automotive-infotainment-and-telematics/automotive-infotainment-socs.html?icmp=tt4379_gl_pron_nov2016 (accessed on 2 July 2019).
  26. STMicroelectronics SPC5 MCUs. Available online: https://www.st.com/en/automotive-infotainment-and-telematics/automotive-infotainment-socs.html?icmp=tt4379_gl_pron_nov2016 (accessed on 2 July 2019).
  27. Rundo, F.; Petralia, S.; Fallica, G.; Conoci, S. A nonlinear pattern recognition pipeline for PPG/ECG medical assessments. Lect. Notes Electr. Eng. 2019, 539, 473–480. [Google Scholar]
  28. Banna, G.L.; Camerini, A.; Bronte, G.; Anile, G.; Addeo, A.; Rundo, F.; Zanghi, G.; Lal, R.; Libra, M. Oral metronomic vinorelbine in advanced non-small cell lung cancer patients unfit for chemotherapy. Anticancer Res. 2018, 38, 3689–3697. [Google Scholar] [CrossRef] [PubMed]
  29. Conoci, S.; Rundo, F.; Petralta, S.; Battiato, S. Advanced skin lesion discrimination pipeline for early melanoma cancer diagnosis towards PoC devices. In Proceedings of the IEEE European Conference on Circuit Theory and Design (ECCTD), Catania, Italy, 4–6 September 2017. [Google Scholar]
  30. Ortis, A.; Rundo, F.; Di Giore, G.; Battiato, S. Adaptive Compression of Stereoscopic Images, ICIAP 2013, Lecture Notes in Computer Science; Springer: Berlin/Heidelberg, Germany, 2013; Volume 8156. [Google Scholar] [CrossRef]
  31. ECG-1L. Available online: https://www.knowledge-share.eu/en/patent/ecg-watch-elettrocardiografo-da-polso/ (accessed on 25 July 2019).
Figure 1. Compliant standard normalized photoplethysmgraphic (PPG) waveform in which some key points related to cardiac activity have been highlighted: systolic, diastolic, and dicrotic peak.
Electronics 08 00890 g001
Figure 2. The physiological phenomena underlying photoplethysmgraphic (PPG) pattern formation.
Electronics 08 00890 g002
Figure 3. The PPG sampling system for the proposed drowsiness monitoring pipeline.
Electronics 08 00890 g003
Figure 4. The PPG sampling motherboard.
Electronics 08 00890 g004
Figure 5. The PPG signal sampling hardware/software pipeline overview. NI, national instrument; FIR, finite impulse response.
Electronics 08 00890 g005
Figure 6. The proposed PPG drowsiness monitoring pipeline based on the use of Hyper-filtering layers and SCG (Scaled Conjugate Gradient) regression network.
Electronics 08 00890 g006
Figure 7. The dynamic of the x2 variable of the proposed reaction-diffusion (RD) model reported in Equation (2).
Electronics 08 00890 g007
Figure 8. Hyper-filtering high-pass/low-pass implemented system setup.
Electronics 08 00890 g008
Figure 9. (a,b) Instances of the hyper-filtered high-pass PPG time series φ H H P i ( k ) ; (c,d) instances of the hyper-filtered low-pass PPG time series φ H L P i ( k ) .
Electronics 08 00890 g009aElectronics 08 00890 g009b
Figure 10. Instances of the generated signal-patterns: (a), (b) ζ H P k ( s ( t k ) ) ; (c), (d) ζ L P k ( s ( t k ) ) .
Electronics 08 00890 g010aElectronics 08 00890 g010b
Figure 11. (a) Electroencephalographic (EEG) signal frequency spectrum of a drowsy subject (alpha wave at 10.8–10.9 Hz); (b) EEG signal frequency spectrum of a wakeful subject (beta wave: there is no specific frequency peak).
Electronics 08 00890 g011
Figure 12. Confusion matrices for the tested scenario: drowsy driver (0) versus wakeful ones (1). Each of the confusion matrices report the performance of the proposed pipeline in discriminating drowsy/wakeful drivers for a selected subject from the collected dataset. For this subject-driver, the pipeline showed 94.5% of discrimination accuracy during the testing phase.
Electronics 08 00890 g012
Figure 13. Confusion matrices for the tested scenario: drowsy driver (0) versus wakeful ones (1). Each of the confusion matrices report the performance of the proposed pipeline in discriminating drowsy/wakeful drivers for a selected subject from the collected dataset. For this subject-driver, the pipeline showed 97.5% of discrimination accuracy during the testing phase.
Electronics 08 00890 g013
Figure 14. ROC curve related to a tested scenario reported in Figure 12.
Electronics 08 00890 g014
Figure 15. The overall embedded platform for the proposed pipeline.
Electronics 08 00890 g015
Table 1. Low-pass and high-pass filter design for the photoplethysmgraphic (PPG) raw signal.
TypeFrequency Pass (Hz)Frequency Stop (Hz)Passband Attenuation (dB)Stopband Attenuation (dB)
Low-pass3.87.210.001100
High-pass 10.30.0140
Table 2. Hyper low-pass filtering setup (in Hz).
FilterFc-pass-1Fc-pass-2Fc-pass-3Fc-pass-4Fc-pass-5Fc-pass-6Fc-pass-7Fc-pass-8Fc-pass-9Fc-pass-10Fc-pass-11
High-pass0.5//////////
Low-pass1.001.342.092.3213.093.444.24.235.25.526.87
Table 3. Hyper High-pass filtering setup (in Hz).
FilterFc-pass-1Fc-pass-2Fc-pass-3Fc-pass-4Fc-pass-5Fc-pass-6Fc-pass-7Fc-pass-8Fc-pass-9Fc-pass-10Fc-pass-11
High-pass0.501.52.22.753.123.654.14.4875.235.36.11
Low-pass7//////////

