Article

Comprehensive Study on Dynamic Parameters of Symmetric and Asymmetric Ultracapacitors

Department of Electrical/Electronic Engineering, Ariel University, Ariel 40700, Israel
*
Author to whom correspondence should be addressed.
Electronics 2019, 8(8), 891; https://doi.org/10.3390/electronics8080891
Submission received: 16 July 2019 / Revised: 6 August 2019 / Accepted: 7 August 2019 / Published: 13 August 2019
(This article belongs to the Section Circuit and Signal Processing)

Abstract

:
Electrical storage components such as ultracapacitors (UC) have received significant attention from various industrial sectors, from electric vehicles to renewable power plants. This article presents the investigations on dynamic properties of asymmetric Li-ion hybrid (CPQ2300S: 2300 F, 2.2–3.8 V, JSR Co., Tokyo, Japan) and symmetric double-layer (BCAP3400: 3400 F, 2.85 V, Maxwell Technologies Co., San Diego, CA, USA) ultracapacitors. The internal resistance and capacitance of both UCs were slightly changed with respect to current and voltage alterations, but these changes were more prominent for the Li-ion UC. The internal resistance of the Li-ion UC became five times larger and its capacitance decreased significantly when the temperature decreased from +25 °C to −20 °C. More importantly, the double-layer UC exhibited nearly constant capacitance for a wide range of temperature changes (0 °C to −40 °C), although internal resistance increased somewhat. Electrochemical impedance spectroscopy analysis of both UCs was performed for the frequency range of 1 Hz–1 kHz and in the temperature range from −15 °C to +30 °C. It was observed that the temperature effects were much more pronounced for the asymmetric Li-ion UC than that of the symmetric double-layer UC. This work also proposes an improved equivalent circuit model based on an infinite number of resistance-capacitance (r–C) chains. The characteristic behavior of symmetric UCs can be explained precisely by the proposed model. This model is also applicable to asymmetric UCs, but with less precision.

1. Introduction

Many novel technologies, such as electrical transportation, communication, renewable energies, and others, require efficient energy storage devices. The current status of energy storage technologies is far from the required demands. Ever-increasing energy demands from various industries challenge the research community to make breakthroughs in the performance of energy storage devices to reach a higher level. These circumstances have led to the development of new storage technologies as well as to the enhanced performance of existing energy storage devices.
Various research groups have undertaken the development of ultracapacitors (UCs) for applications in which significant energy is needed in pulse form [1,2,3]. One of the specific applications is temporary electrical storage in order to improve the quality of electricity distribution lines connected with photovoltaic (PV) solar power generation facilities. UCs are gaining popularity in many industries as a reliable energy storage device because of their specific properties: larger capacitance, high power density, high energy density, and fast charging. Among existing UC-based storage technologies [4,5,6,7,8,9,10], symmetric double-layer UCs [5] and asymmetric Li-ion hybrid UCs [6,7,8] exhibit superior behavior to that of others. Alizadeh et al. showed that the application of UCs improves the performance of microgrid frequency regulation as a result of improved virtual system inertia [11]. Li-ion and similar asymmetric UCs are also applicable to pulsed electric power sources [12,13]. Piórkowski et al. presented a case study about the application of UCs in hybrid systems including an engine start module (ESM), a photovoltaic (PV) module, a battery, and an internal combustion engine (ICE) [14]. In continuation, the hybrid model control strategy was proposed for a double active bridge-based supercapacitor energy storage system [15]. More importantly, the service lifetime of UCs is three times higher compared to electrochemical storage batteries (e.g., Li-ion or lead-acid) although UCs are relatively bulky and voluminous [16]. Consequently, there is a lack of accurate information regarding the ability of Li-ion UCs to provide voltage and current during charge–discharge cycles. Previously, a significant number of experimental investigations were carried out [16,17,18,19,20,21,22] in order to understand the characteristic behavior of UCs. Different direct measurement methods for the evaluation of UC parameters were also proposed [16,17,18,19,20]. A comprehensive review of characterization methods for supercapacitor modeling and general parameter identification techniques were also discussed [21,22].
A significant amount of effort has been made to describe dynamic UC behavior using different types of equivalent circuits [23,24,25,26,27,28,29,30]. Some works presented modeling approaches based on electrochemical explanations of UC performance [31,32,33,34,35]. Significant attention has been paid to the use of electrochemical impedance spectroscopy (EIS) methods in order to establish equivalent circuits and to estimate their parameters [36,37]. However, the previously proposed equivalent circuits did not consider exact physical phenomena which determine the electrical properties of UCs. As a result, these equivalent circuits can only describe UC behavior in a narrow range of parameters. These methods did not show changes in the UC parameters during the charge–discharge process, temperature variations, and transformation of functionality. In the real world, an engineer dealing with the development of specific electrical/electronic appliances prefers to use the familiar method of equivalent circuits. Design engineers require accurate information regarding these parameters as well as appropriate data for the successful implementation of such systems. Additionally, two major UC parameters (internal impedance and capacitance) defining dynamic behavior are not yet determined for a full range of UC applicability.
This article presents investigations on the dynamic properties of two types of capacitors: symmetric double-layer UC and asymmetric Li-ion UC. Both have a complicated electrochemical nature. Experimental results were used for the assessment of internal resistance and capacitance using a UC equivalent circuit. This article comprises three sections: the first describes the methodology of experimental investigation, another represents results with a simplified equivalent circuit, and the last provides a discussion and conclusions. The obtained results may be interesting and important for the wide electrical engineering society dealing with the development and exploitation of electrical storage facilities using different types of UCs.

2. Experimental Setup and Methods

Experimental investigations included measurements of capacitance (C), internal resistance (Rint) using repetitive charge/discharge cycles, and electrochemical impedance spectroscopy (EIS). Investigations were carried out on two types of UCs: symmetric double-layer (BCAP3400: 3400 F, 2.85 V, Maxwell Technologies Co. [38]) and asymmetric Li-ion hybrid (CPQ2300S: 2300 F, 2.2–3.8 V, JSR Co. [39]).

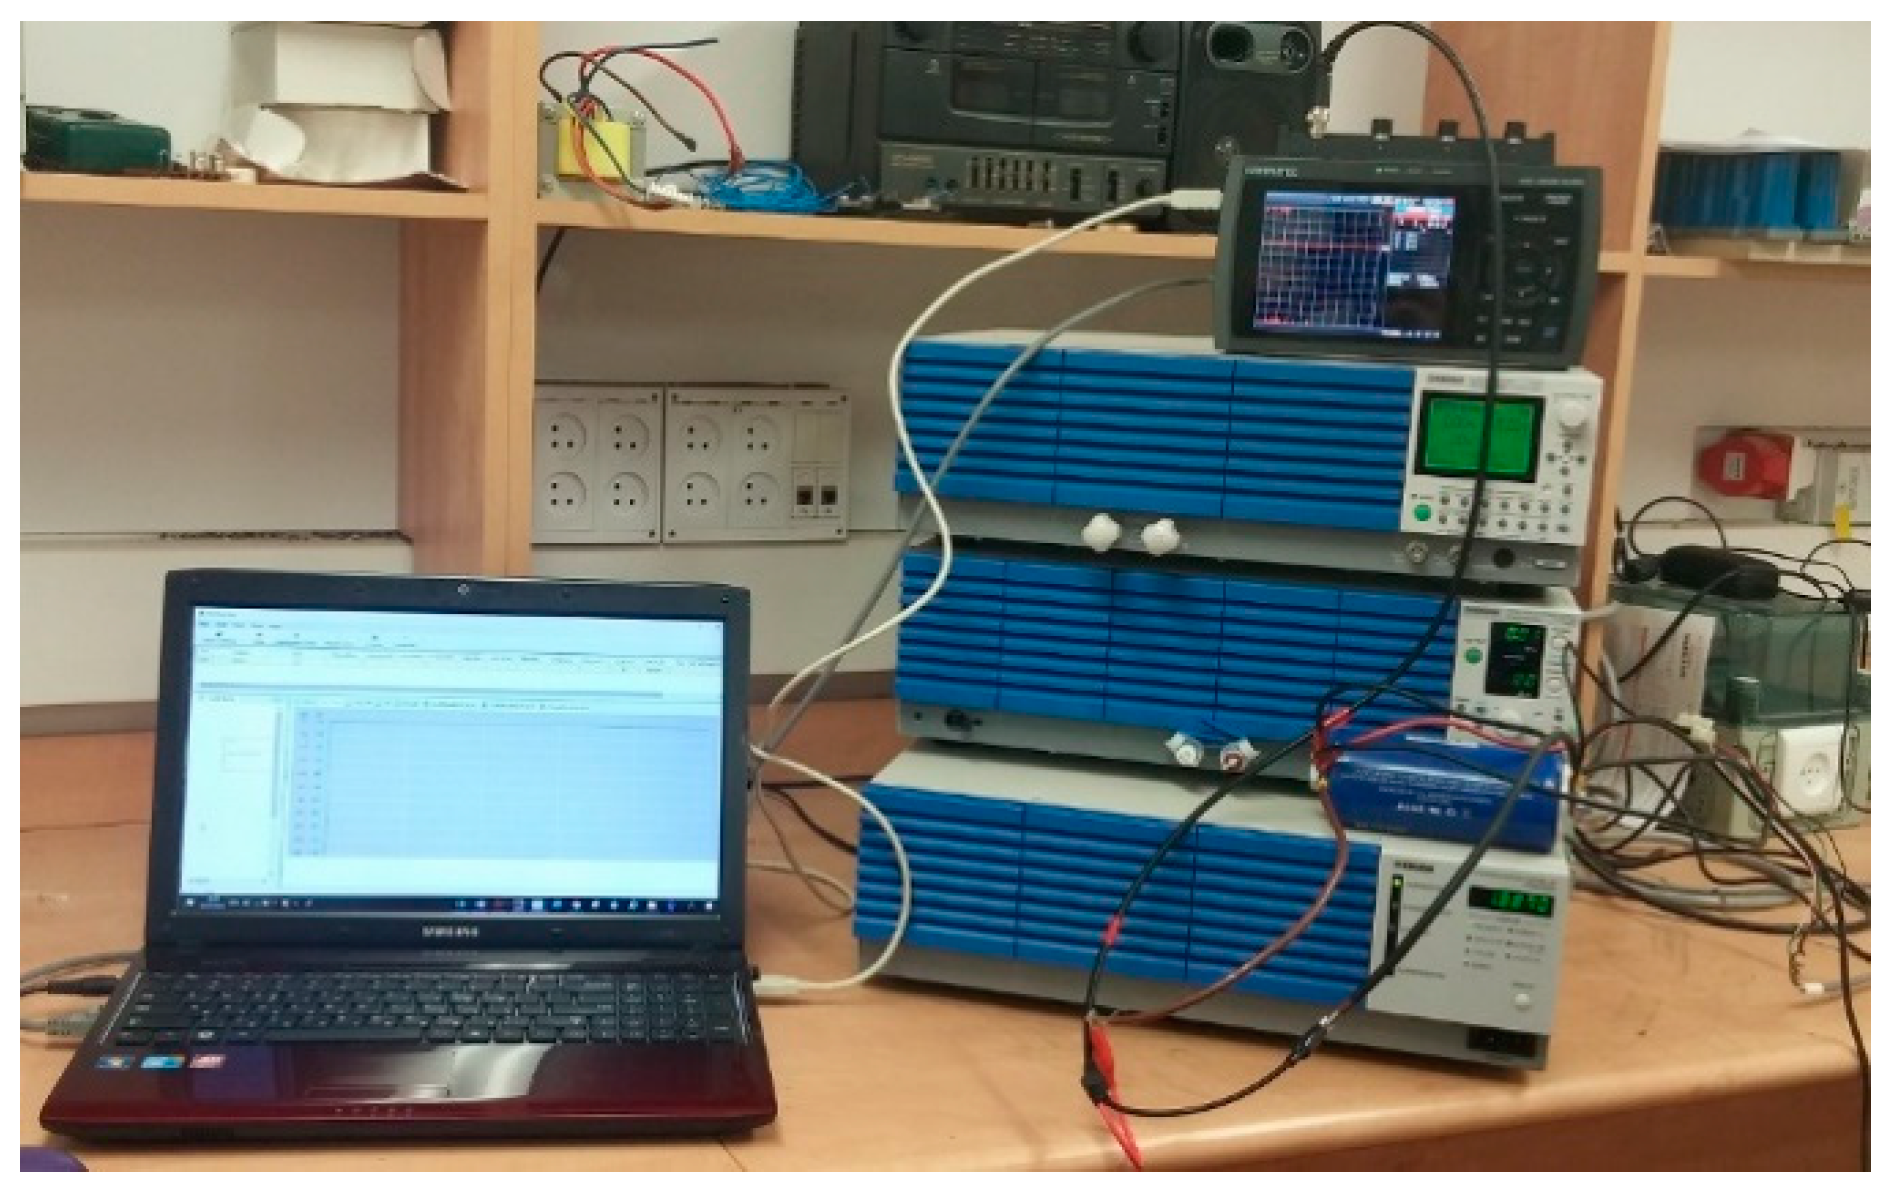
2.1. Charge–Discharge Cycling

In this work, a regulated DC power supply (PWR1600L, Kikusui Co., Yokohama, Japan), electronic load (PLZ1004W, Kikusui Co., Yokohama, Japan) and CHG/DISH system controller, (PFX2532, Kikusui Co., Yokohama, Japan, [40]), and midi-logger GL900 (Graphtec Co., Yokohama, Japan, [41]) were used for charge–discharge cycling experiments. The workbench is shown in Figure 1; it also included a computer to control the charge–discharge process and data collection.
In order to estimate internal resistance and capacitance, the discharging or charging procedure with a pulsed repetitive constant current was applied until the UC voltage changed from maximum to minimum (discharging) and from minimum to maximum (charging) magnitudes. During both charge and discharge processes, a constant current was applied for a two second time duration with an interval of two seconds. Figure 2 demonstrates the typical voltage vs. time curve during the discharge process. Both parameters (Rint and C) were also calculated during the charging process [42]. The charge cycle started from the minimum allowable or achievable up to the maximum permissible voltage. Some restrictions regarding minimum achievable voltage in the double-layer UC were considered during experiments. Therefore, the minimum voltage of the UC was not less than 1 V, even for the double-layer UC (BCAP3400).
The initial (discharging mode) and final voltage drops (charging mode) both determine internal resistance. The internal resistance is calculated using the time-derivative of voltage during the discharge mode. The internal resistance (Rint) value was calculated in accordance with:
R i n t = Δ V 1 I disch ,
Whereas the capacitance (C) was assessed as:
C = I disch ( Δ V 2 Δ t ) ,
where ΔV1 is an estimated initial voltage drop, V; ΔV2t is the rate of voltage change, V/s; and Idisch is the constant discharge current, A. A similar approach was applied for the calculation of Rint and C during the charging process. Experiments were also performed at different charge–discharge currents (20, 50, and 75 A) as well as for several voltages of their nominal magnitudes.

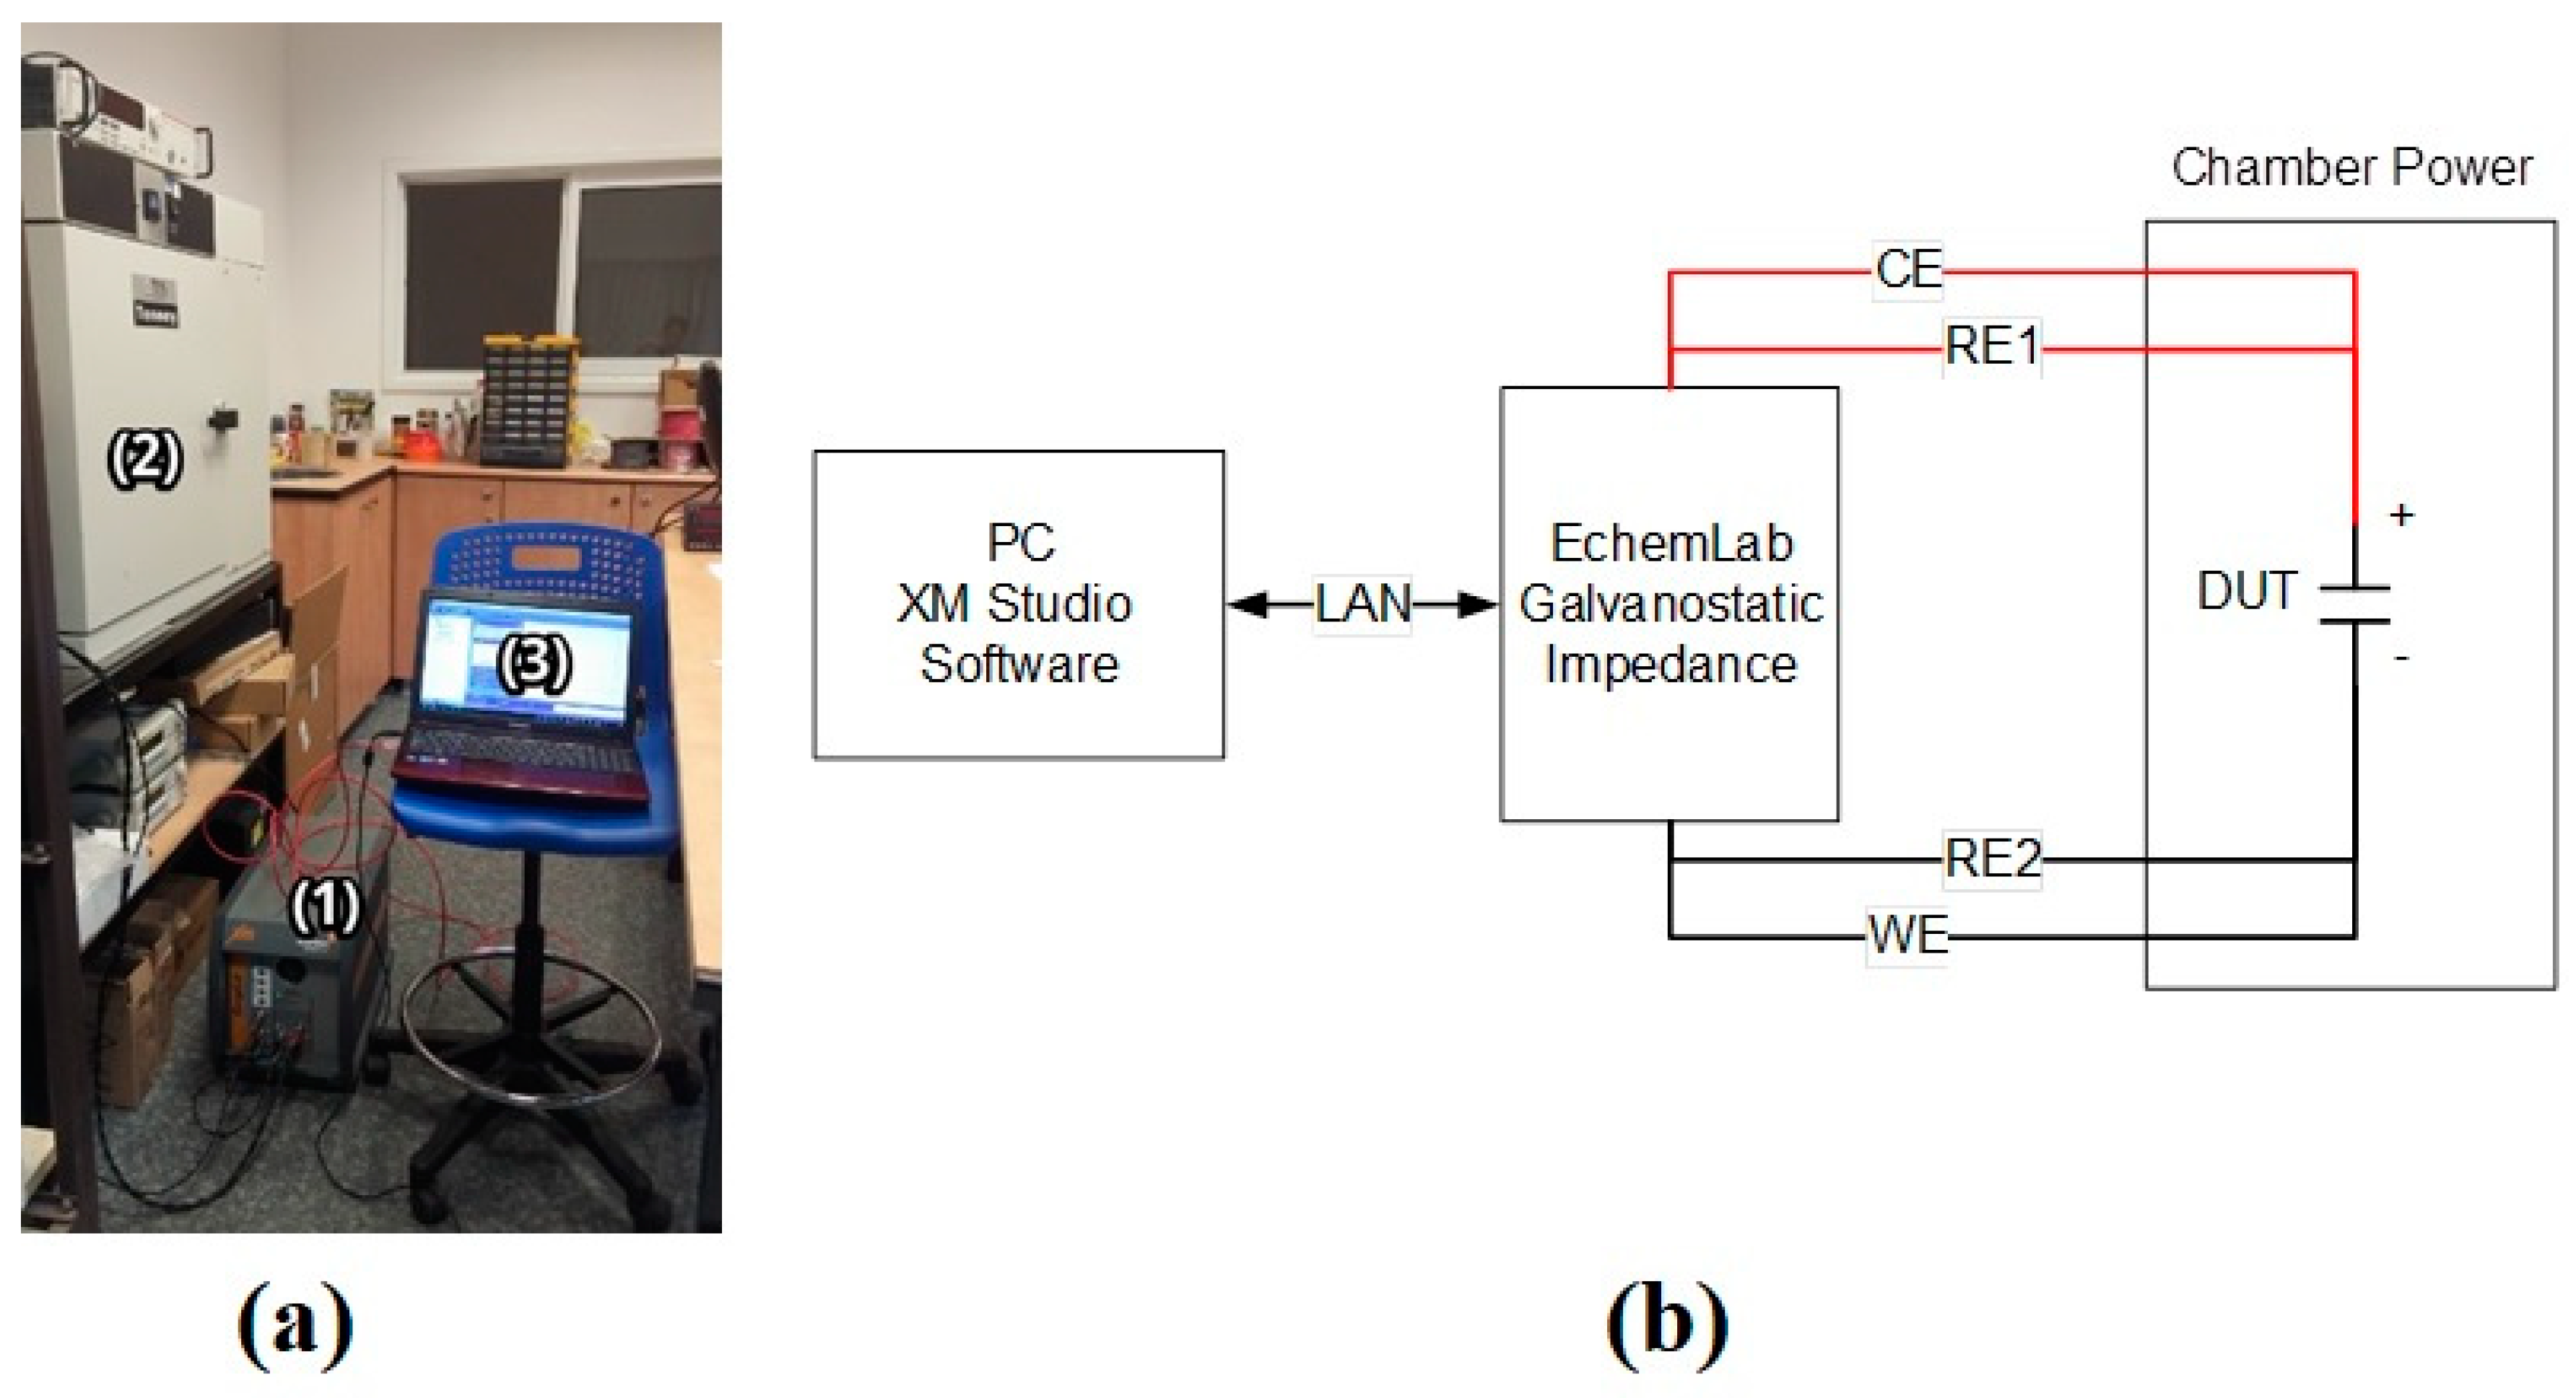
2.2. EIS Measurements

Electrochemical impedance spectroscopy is a well-suited technique to characterize capacitor performance. Figure 3a demonstrates the experimental setup for the EIS studies. Experiments were carried out using a potentiostat/galvanostat analyzer (EchemLab, Xm Solartron Co., Cambridge, UK, [43]) with a Tenney temperature test chamber [44] in accordance with the circuit of the setup control (Figure 3b). For the experiment, an AC current of 1 A (rms) was applied for the frequency range of 1 Hz–1 kHz. The EIS studies were carried out for temperature range (−15 °C to 30 °C) with a step size of 15 °C. The internal resistance (Rint) and capacitance of both UCs were calculated through mathematical modeling of the impedance data. An equivalent circuit of was also established using an infinite ladder of similar resistance-capacitance (r–C) chains.

3. Results

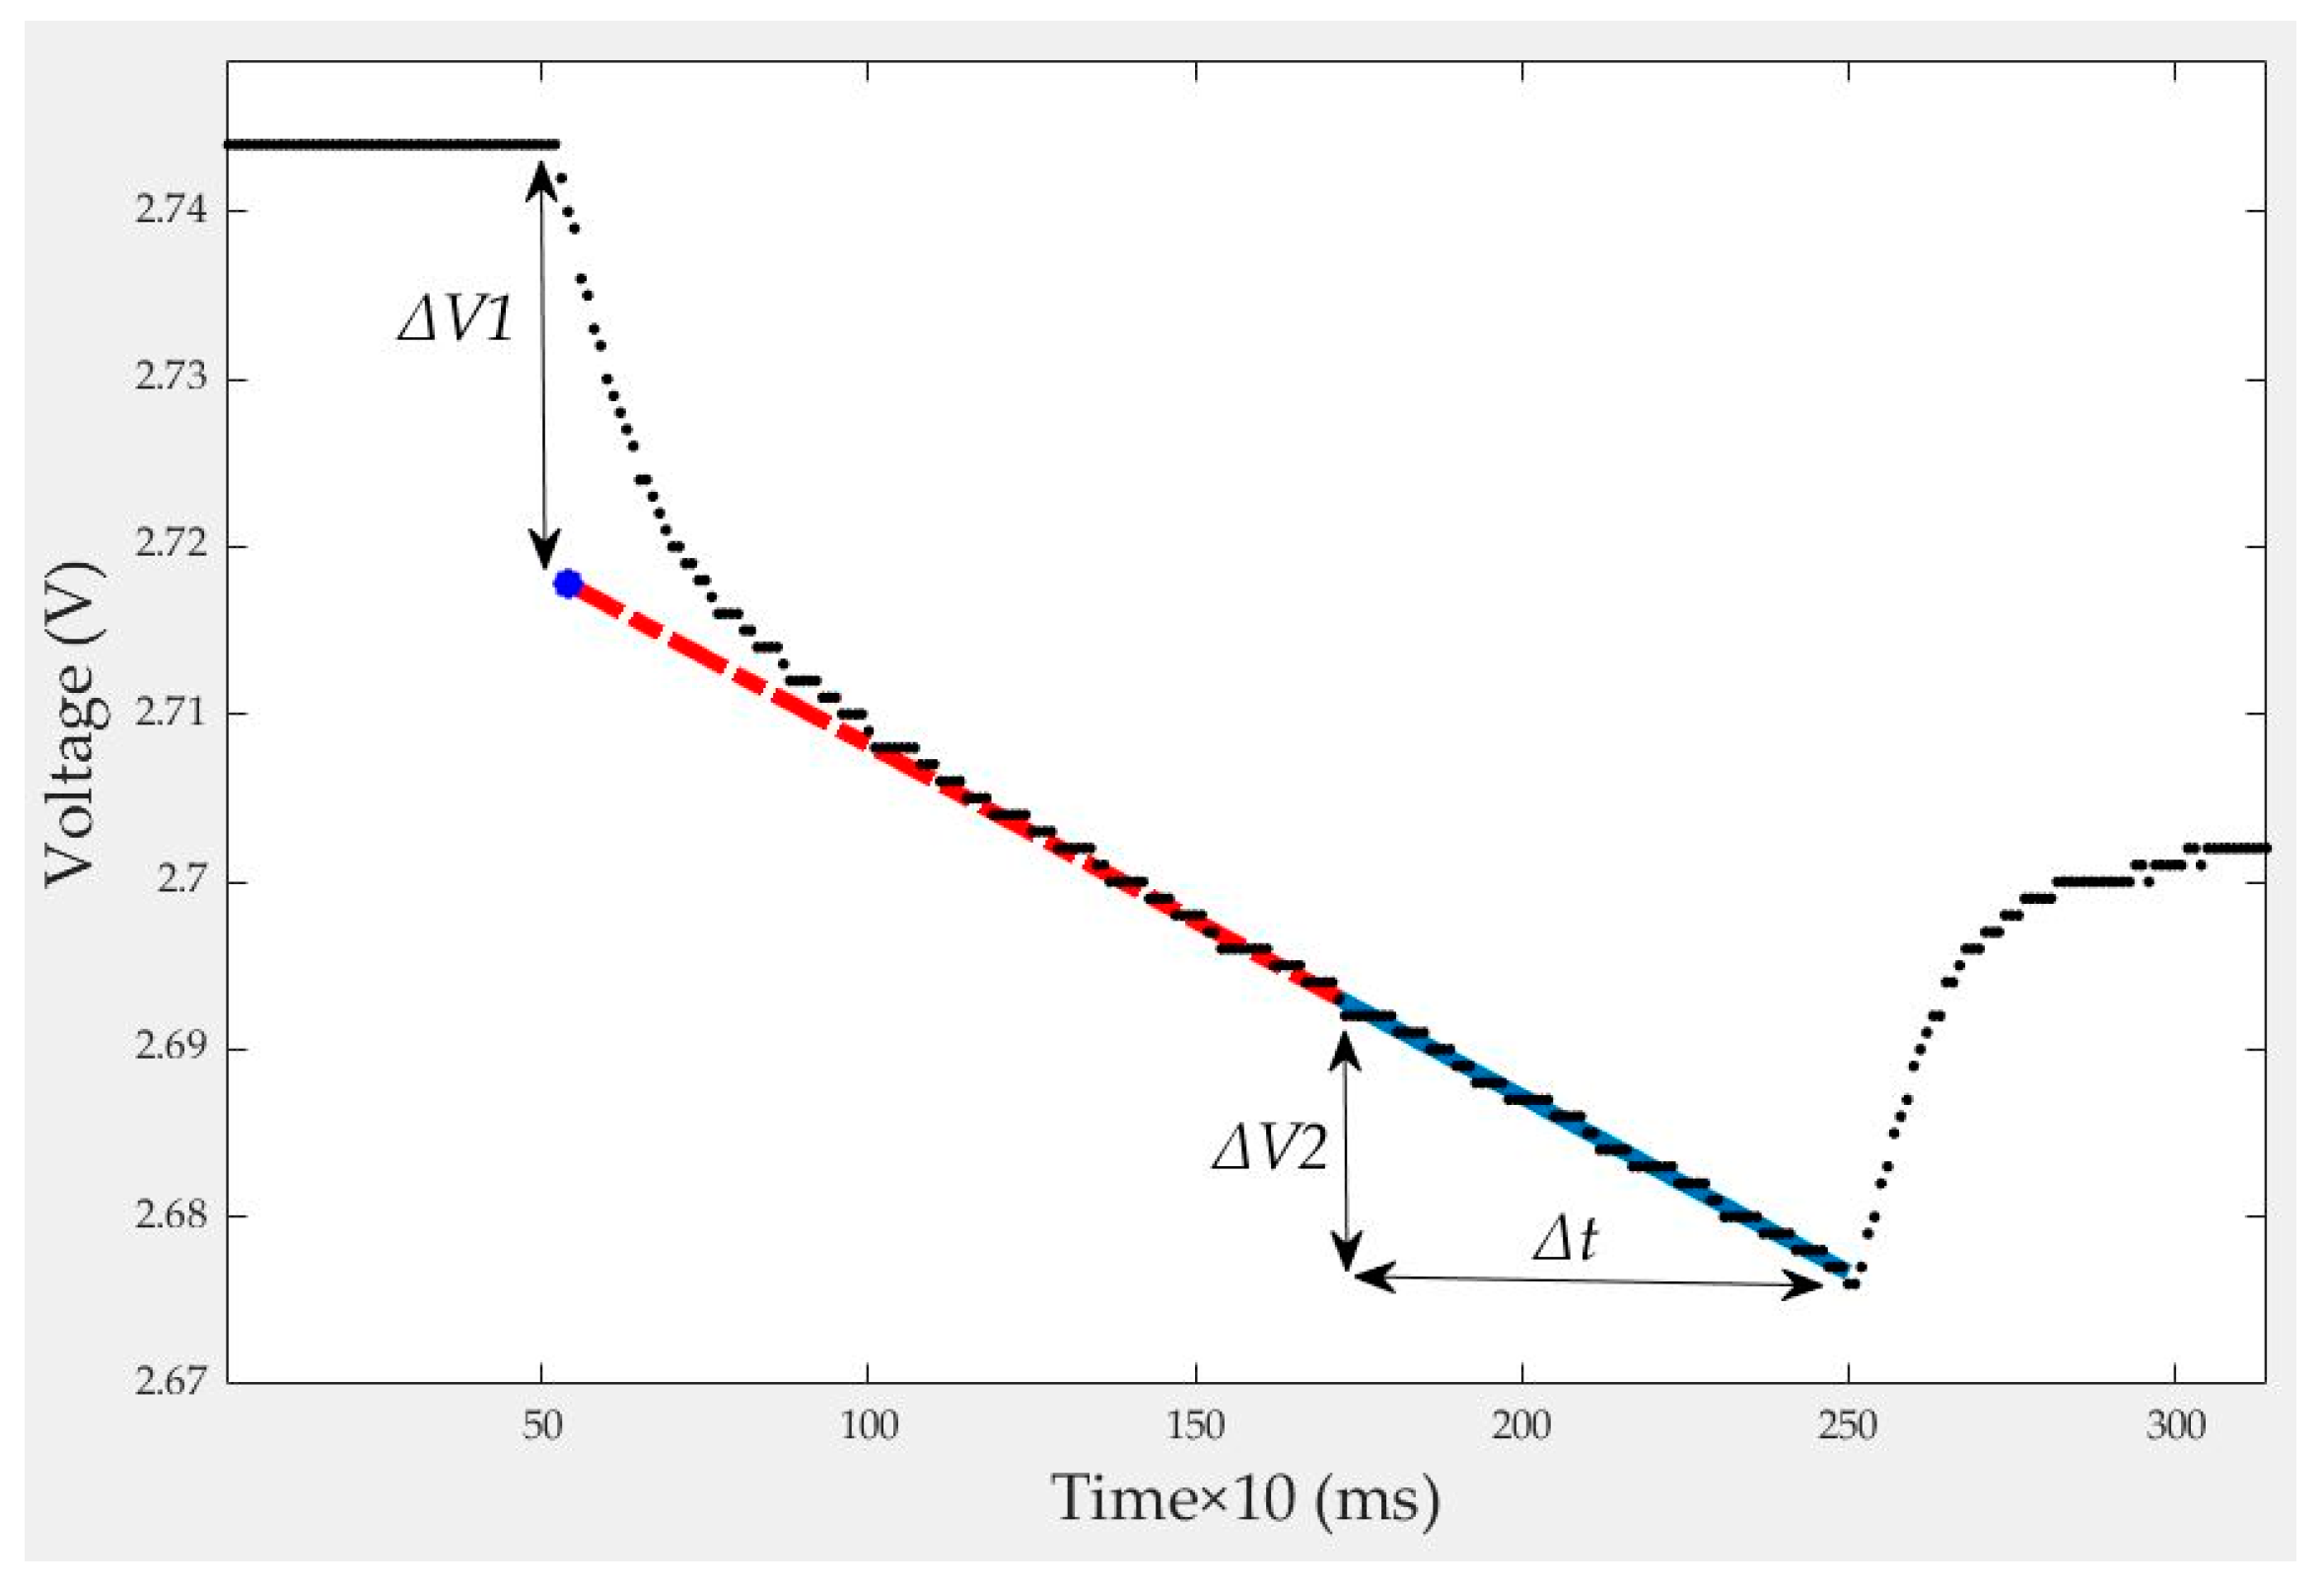
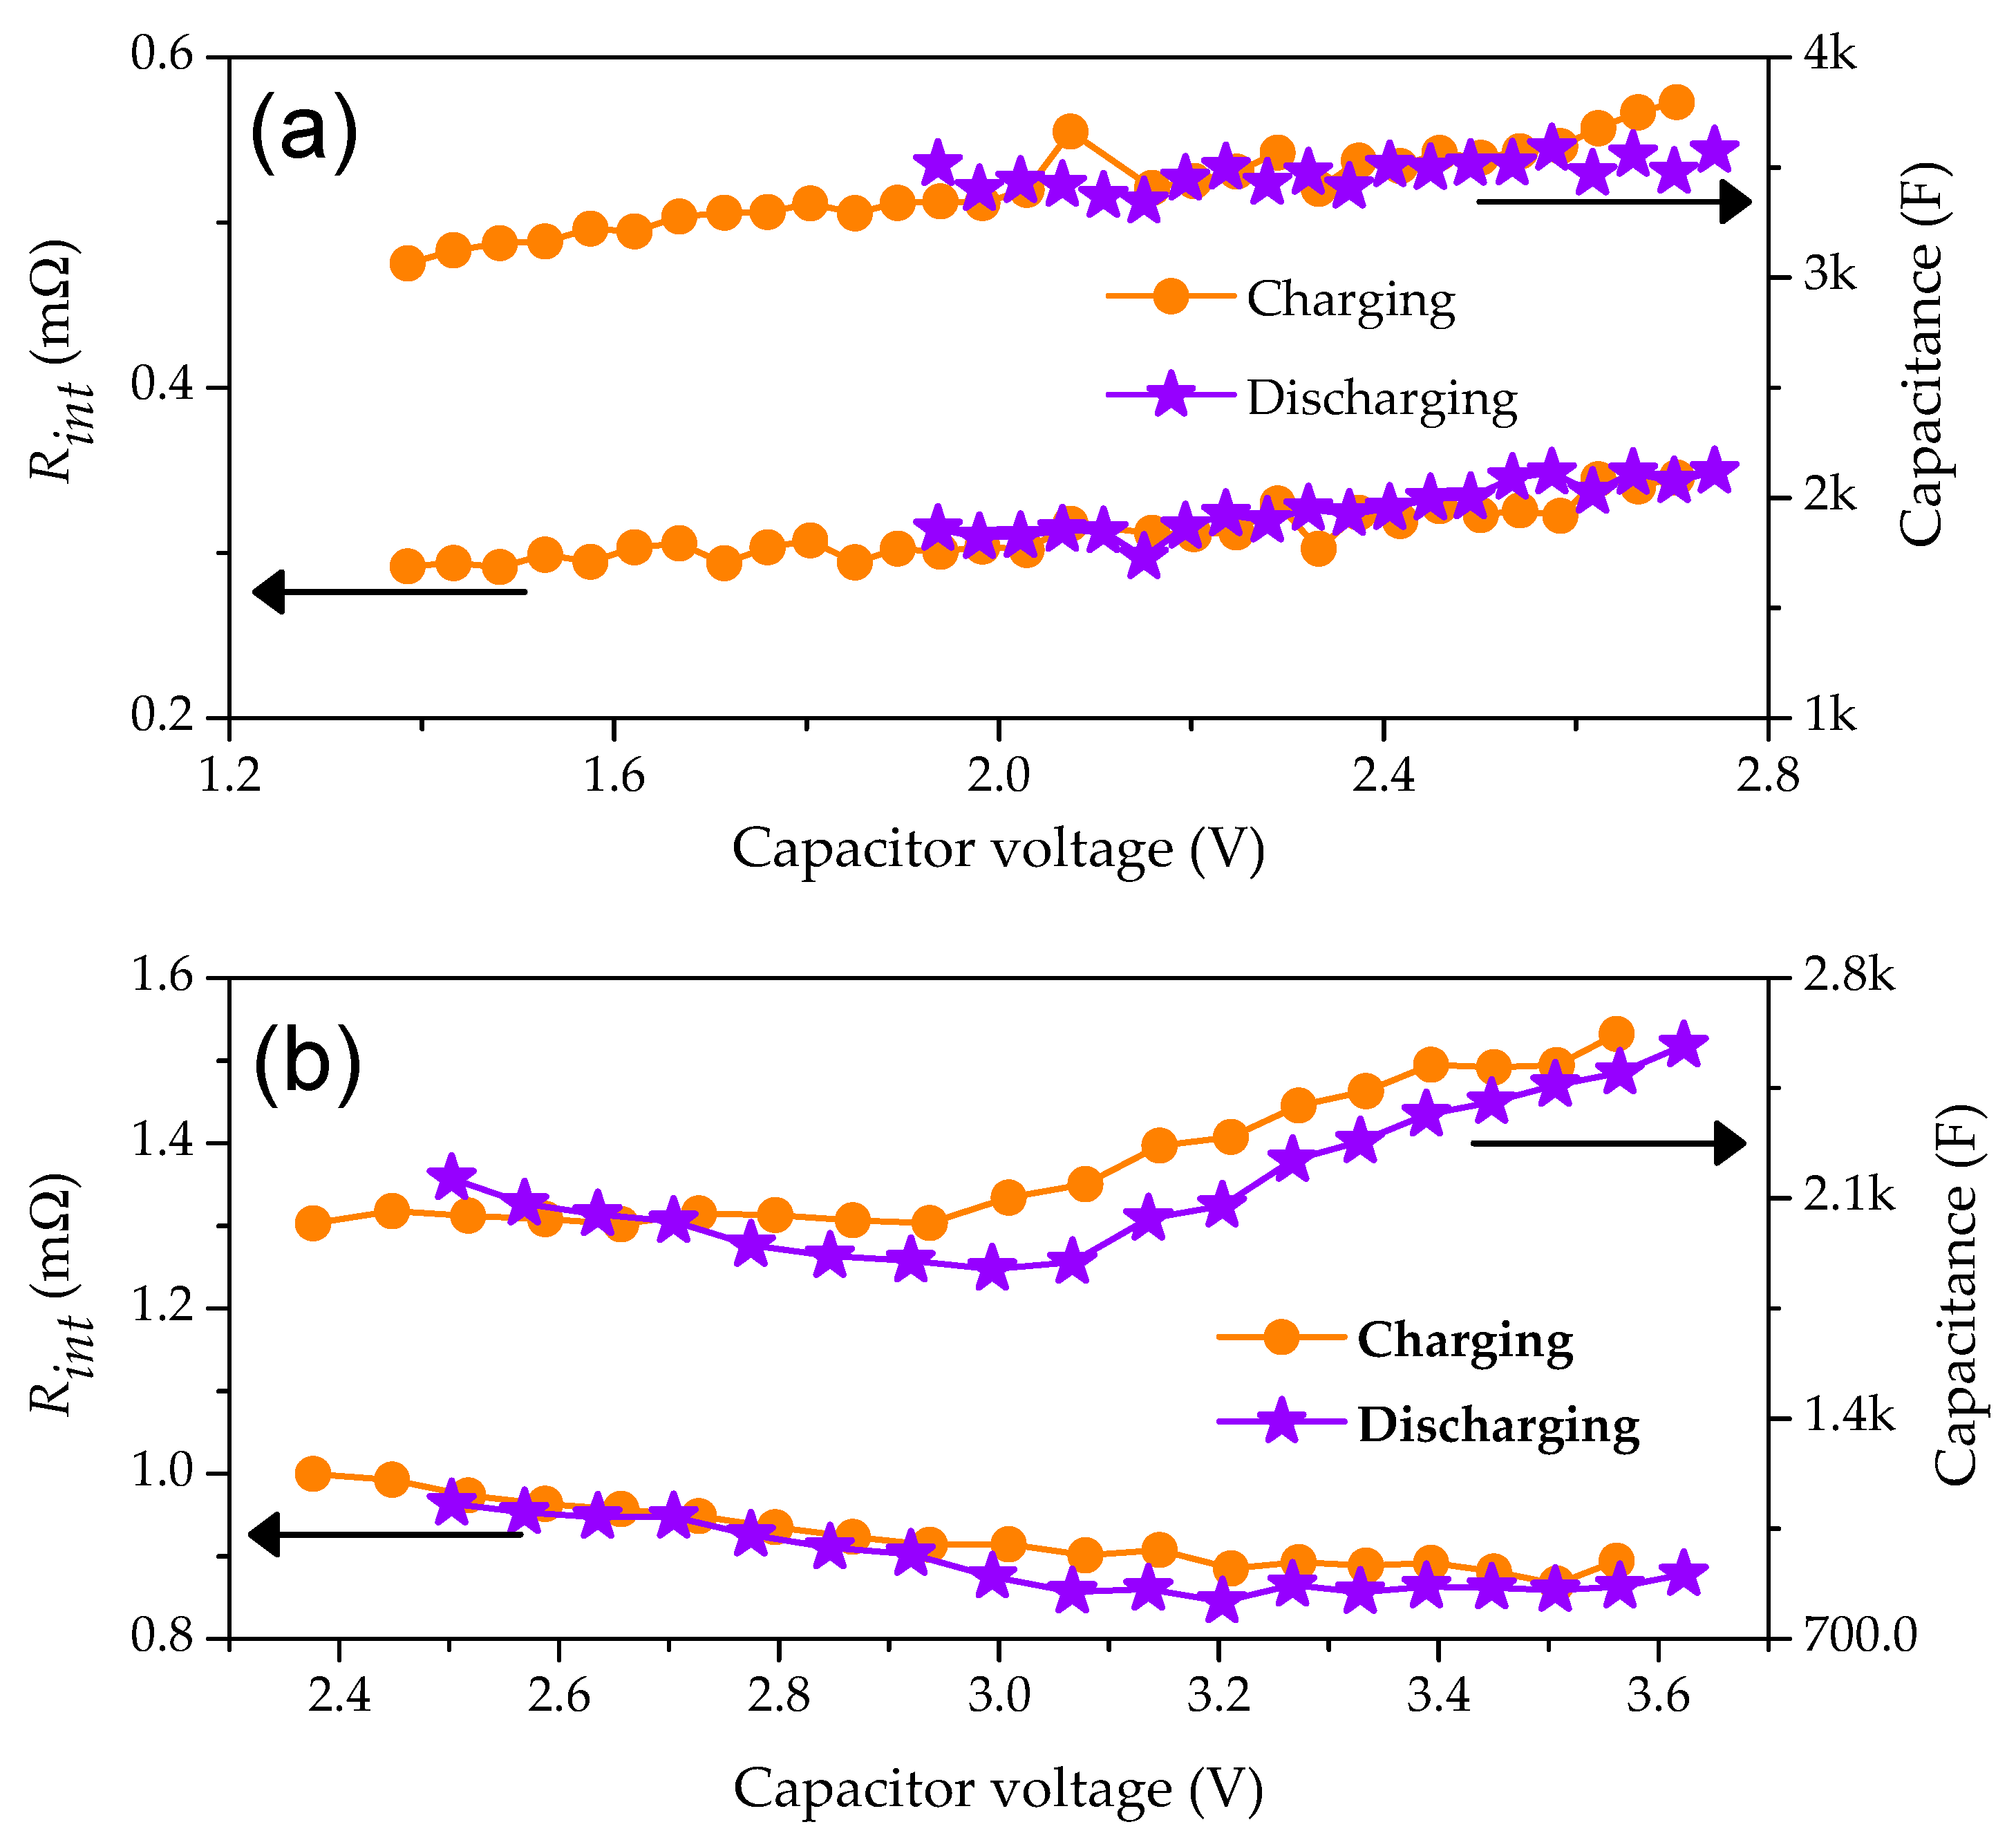
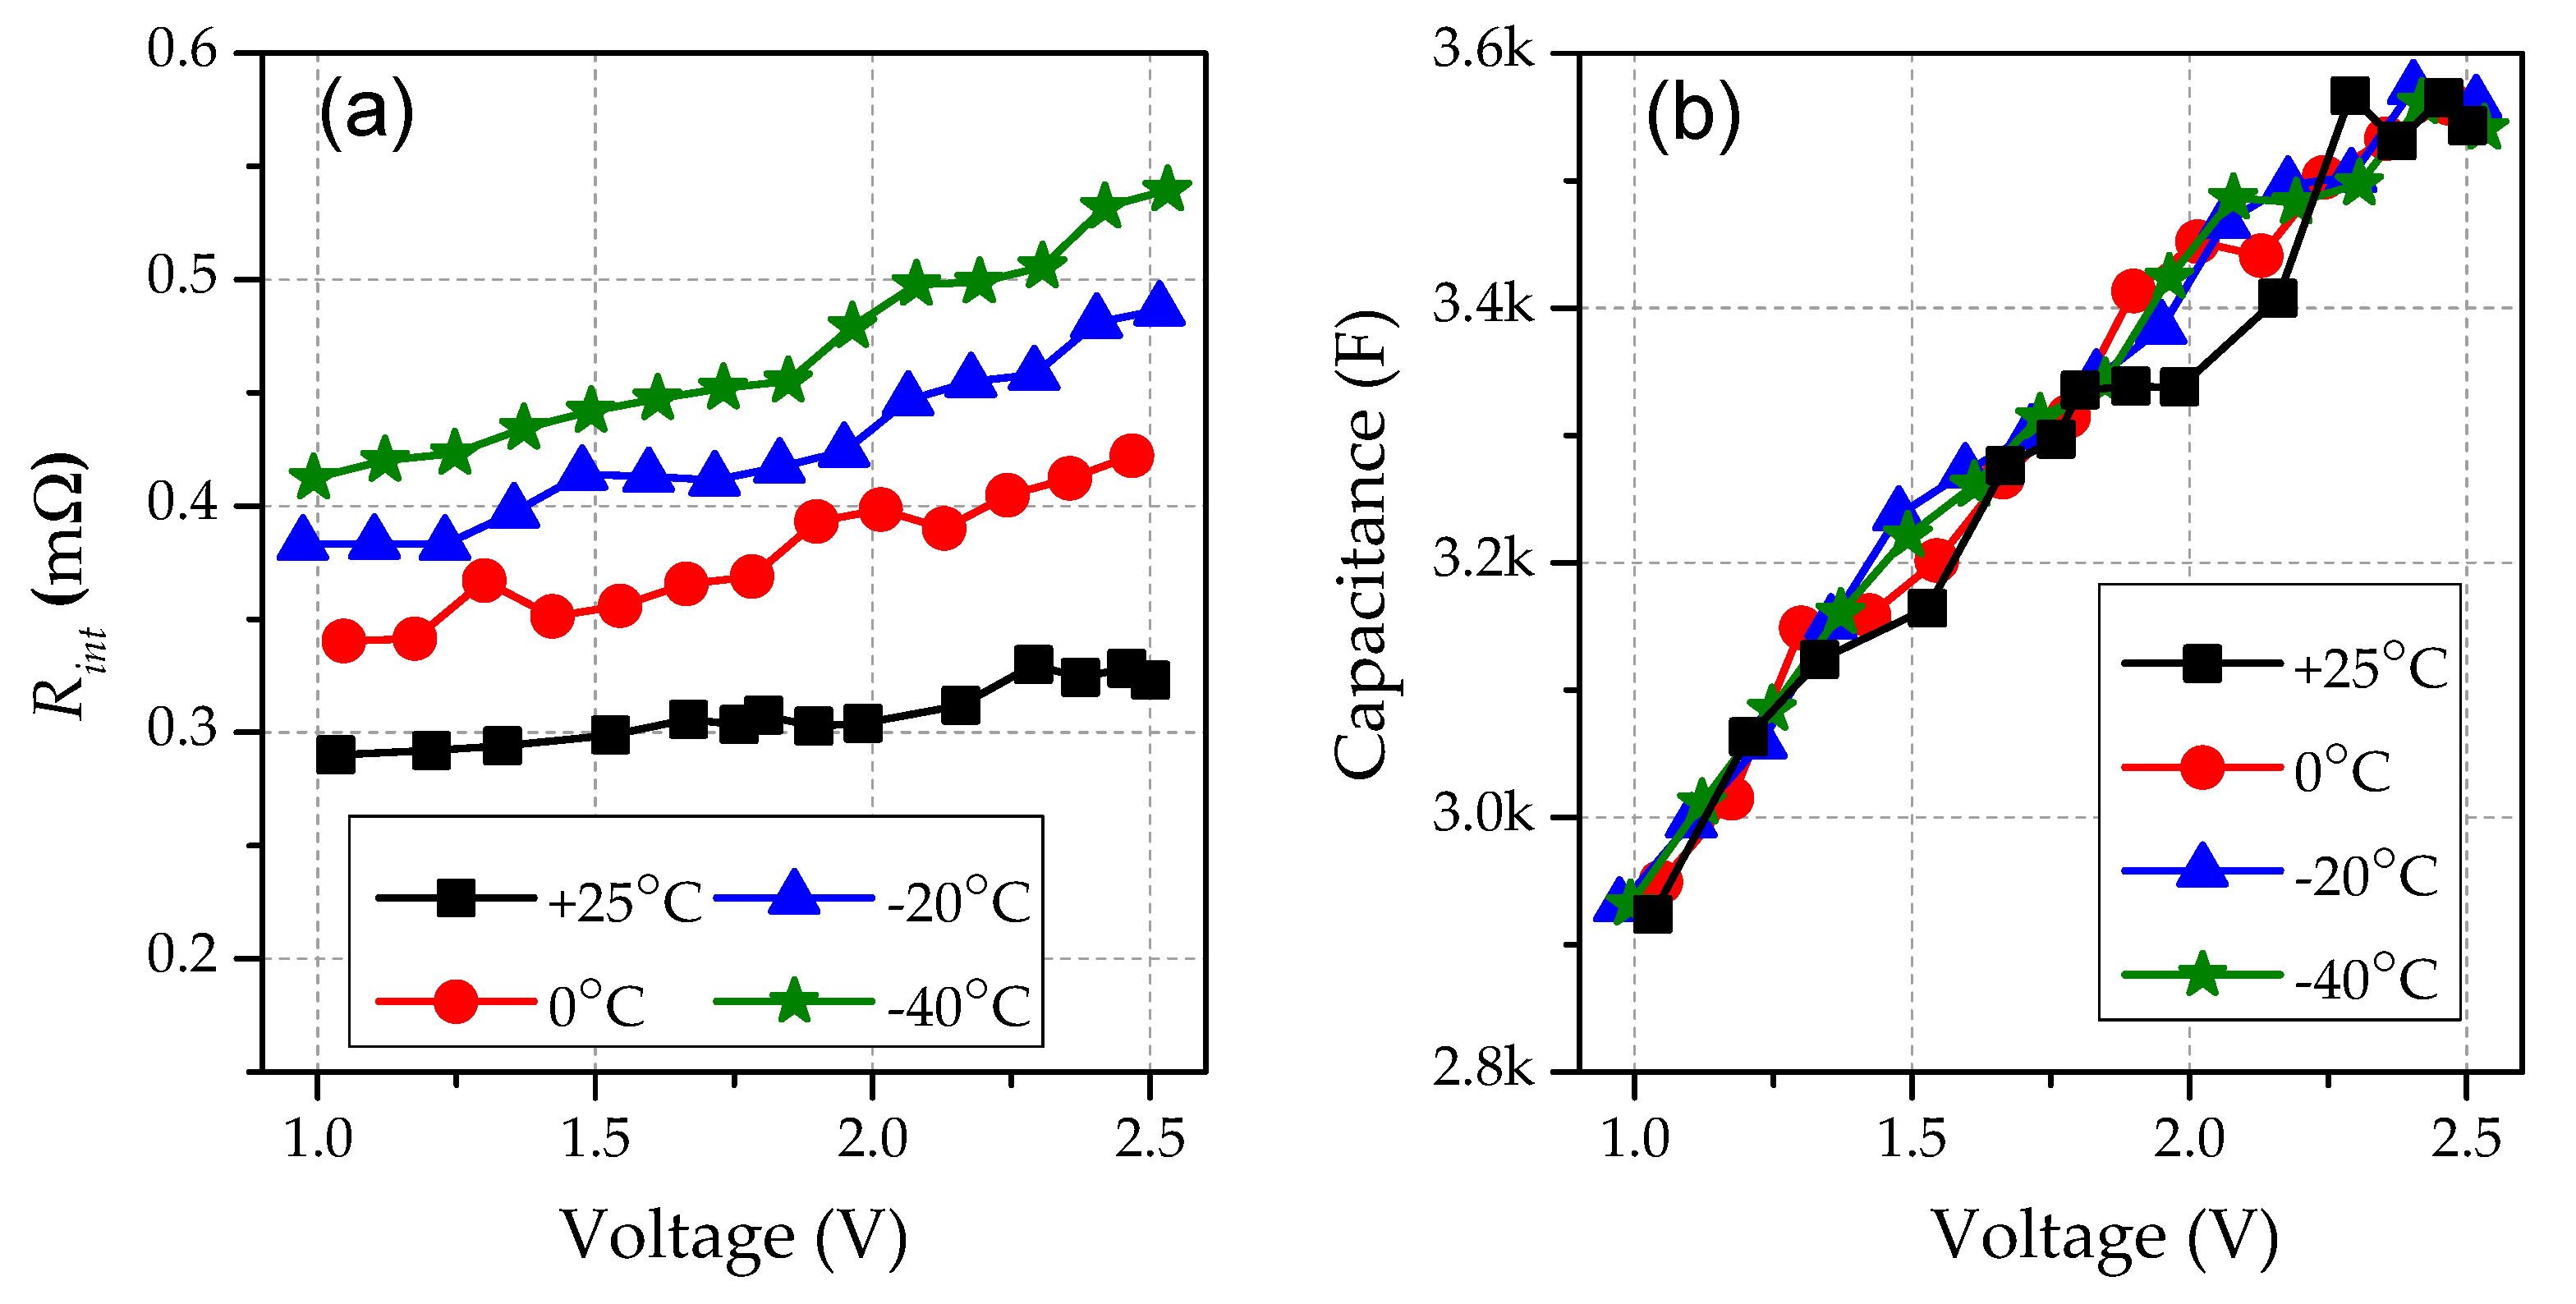
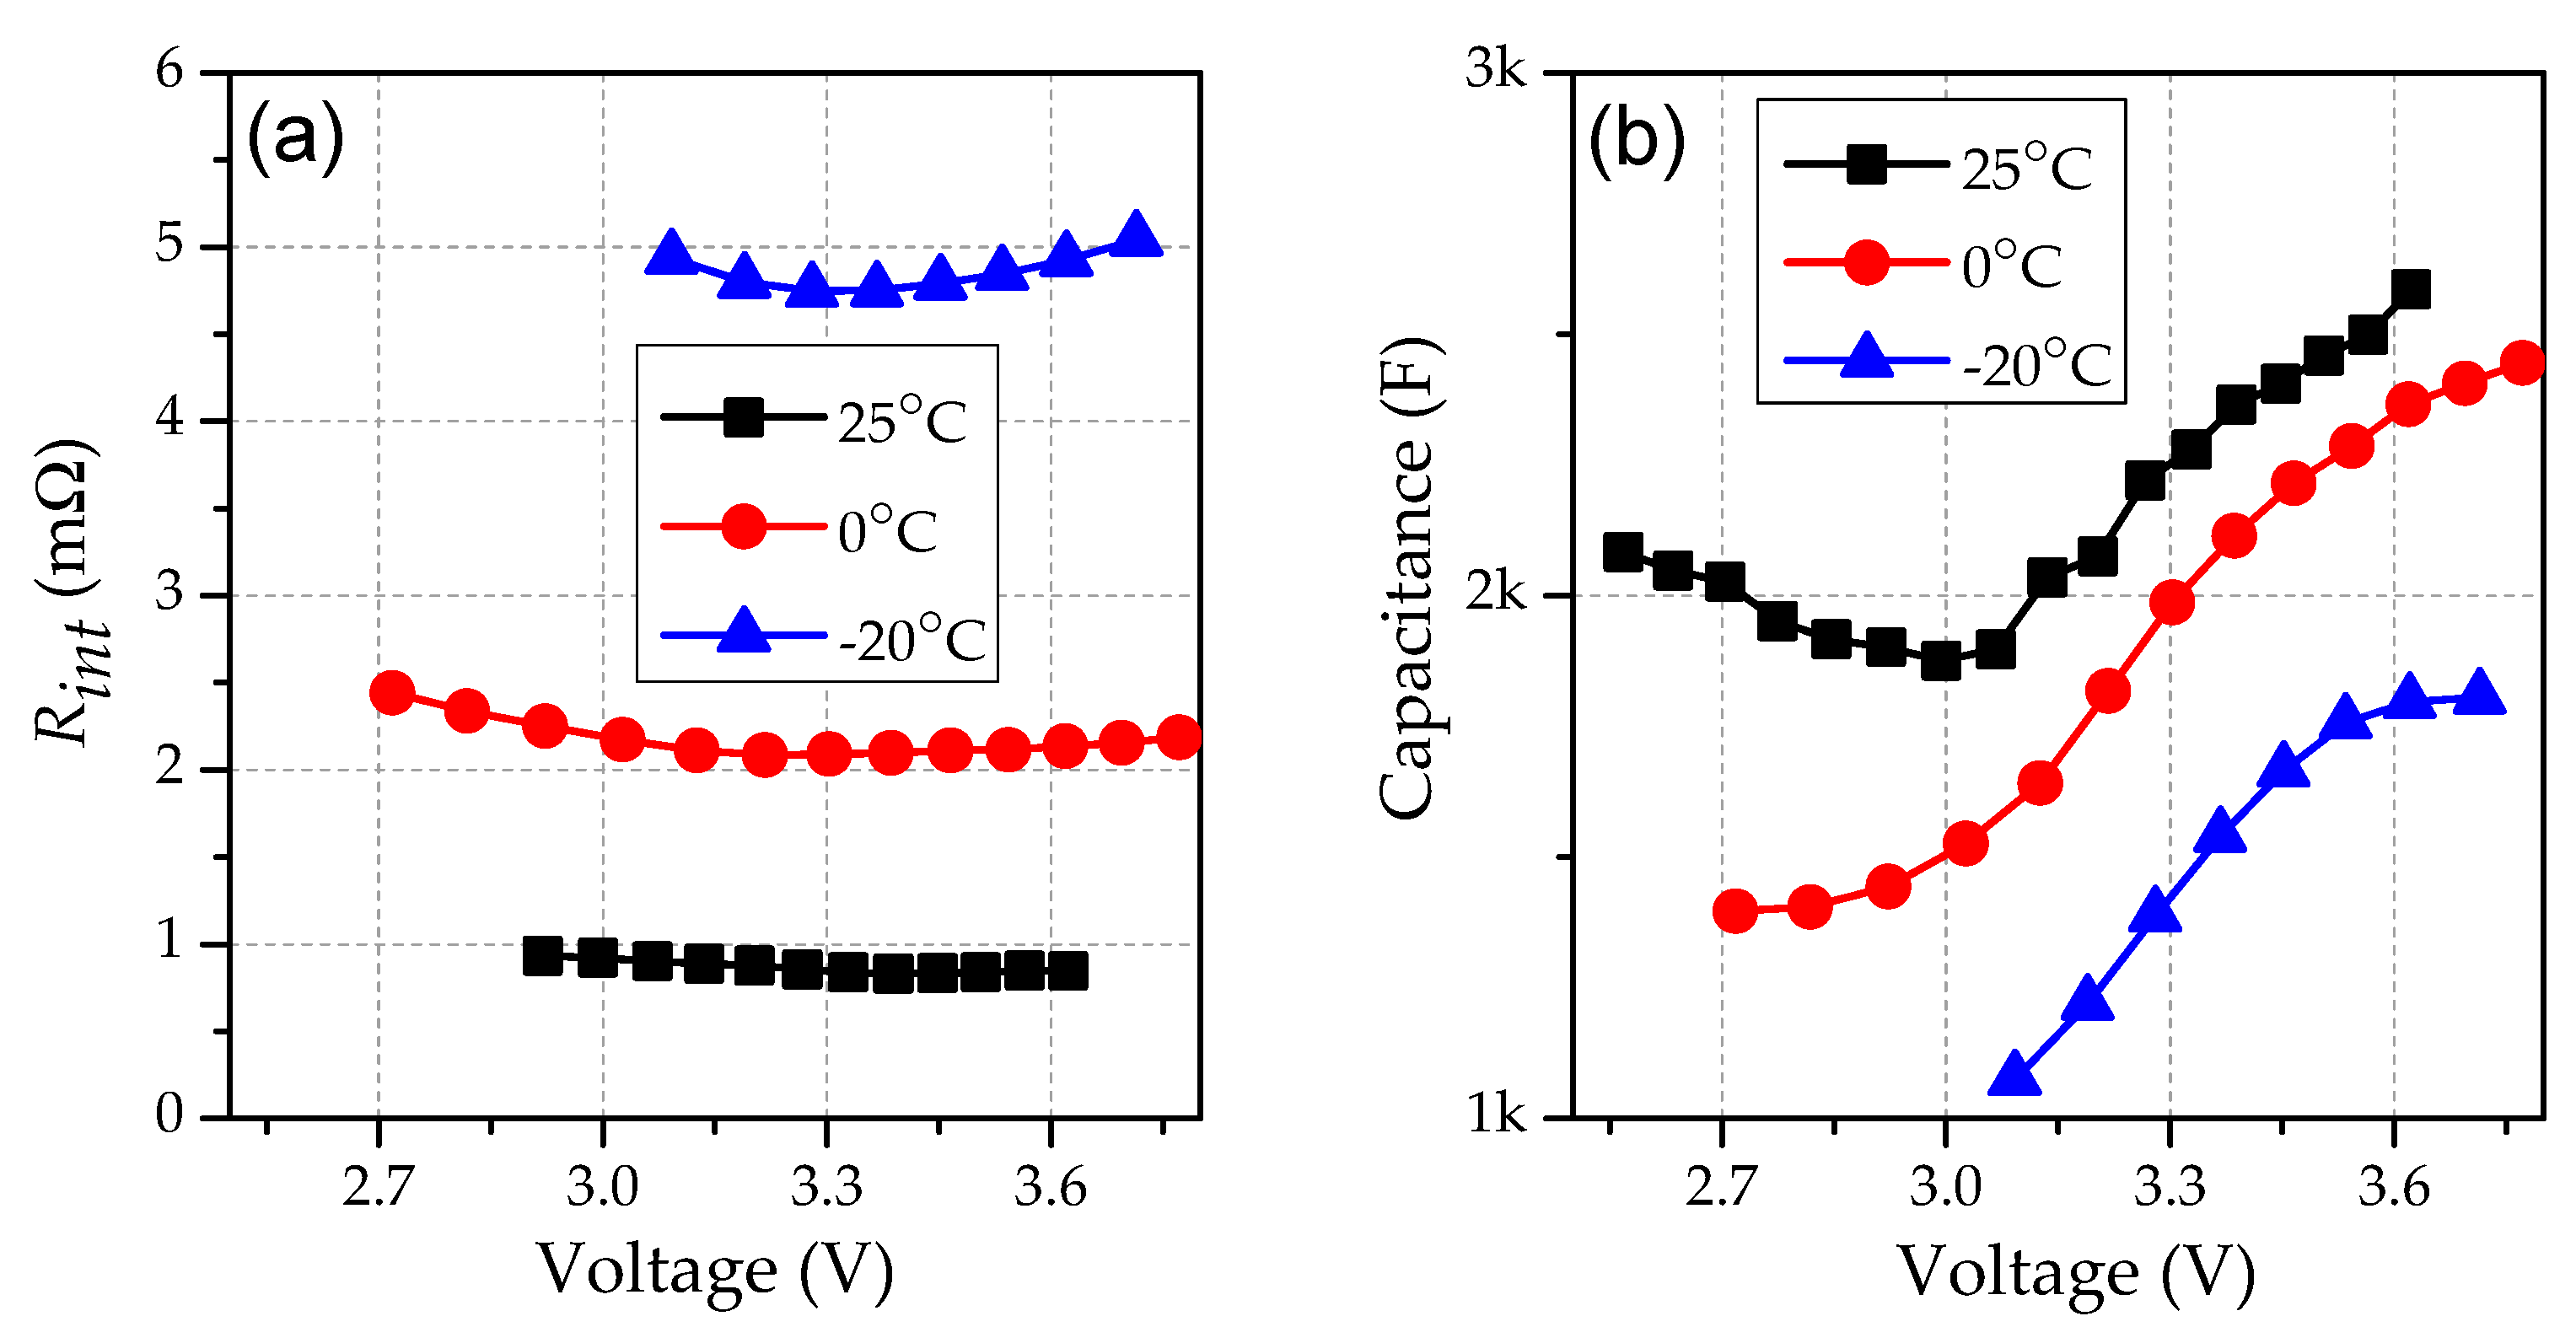
3.1. Measurements by Charge–Discharge Cycling

The internal resistance and capacitance of both UCs were determined by conventional methods of international standard (IEC 62391), as discussed in Section 2. Figure 4 demonstrates the Rint and C values of both capacitors measured at 75 A for different voltages. Additionally, Table 1 summarizes the capacitor parameters (Rint and C) for different current magnitudes (20, 50, and 75 A) at 2.08 V.
It can be observed from Figure 4 that the Rint and C values of both UCs slightly increased when the voltage rose from minimum to maximum value. However, the parameters of the Li-ion UC changed more significantly than that of the double-layer UC. The Rint and C values of the double-layer UC remained nearly constant in charge/discharge modes, but were not exactly equal for the charge/discharge modes in the case of the Li-ion UC. It can also be observed from Table 1 that the Li-ion UC was more affected by the applied current than the double-layer UC. Figure 5 represents the resistance and capacitance of the double-layer UC at different temperatures (+25 °C, 0 °C, −20 °C, −40 °C) as a function of voltage, whereas similar parameters are shown in Figure 6 with the Li-ion UC at different temperatures (+25 °C, 0 °C, −20 °C). The internal resistance of the double-layer UC increased slightly as temperature decreased to −40 °C, but this magnitude of internal resistance is in the applicable range. More importantly, the capacitance of the double-layer UC remained nearly constant for a wide range of temperatures (Figure 5b). In the case of the Li-ion UC, its internal resistance increased significantly as the temperature decreased (+25 °C to −20 °C). For example, the internal resistance at −20 °C was approximately five times higher than that at +25 °C. On the other hand, capacitance increased by roughly two times as temperature increased from −20 to +25 °C.

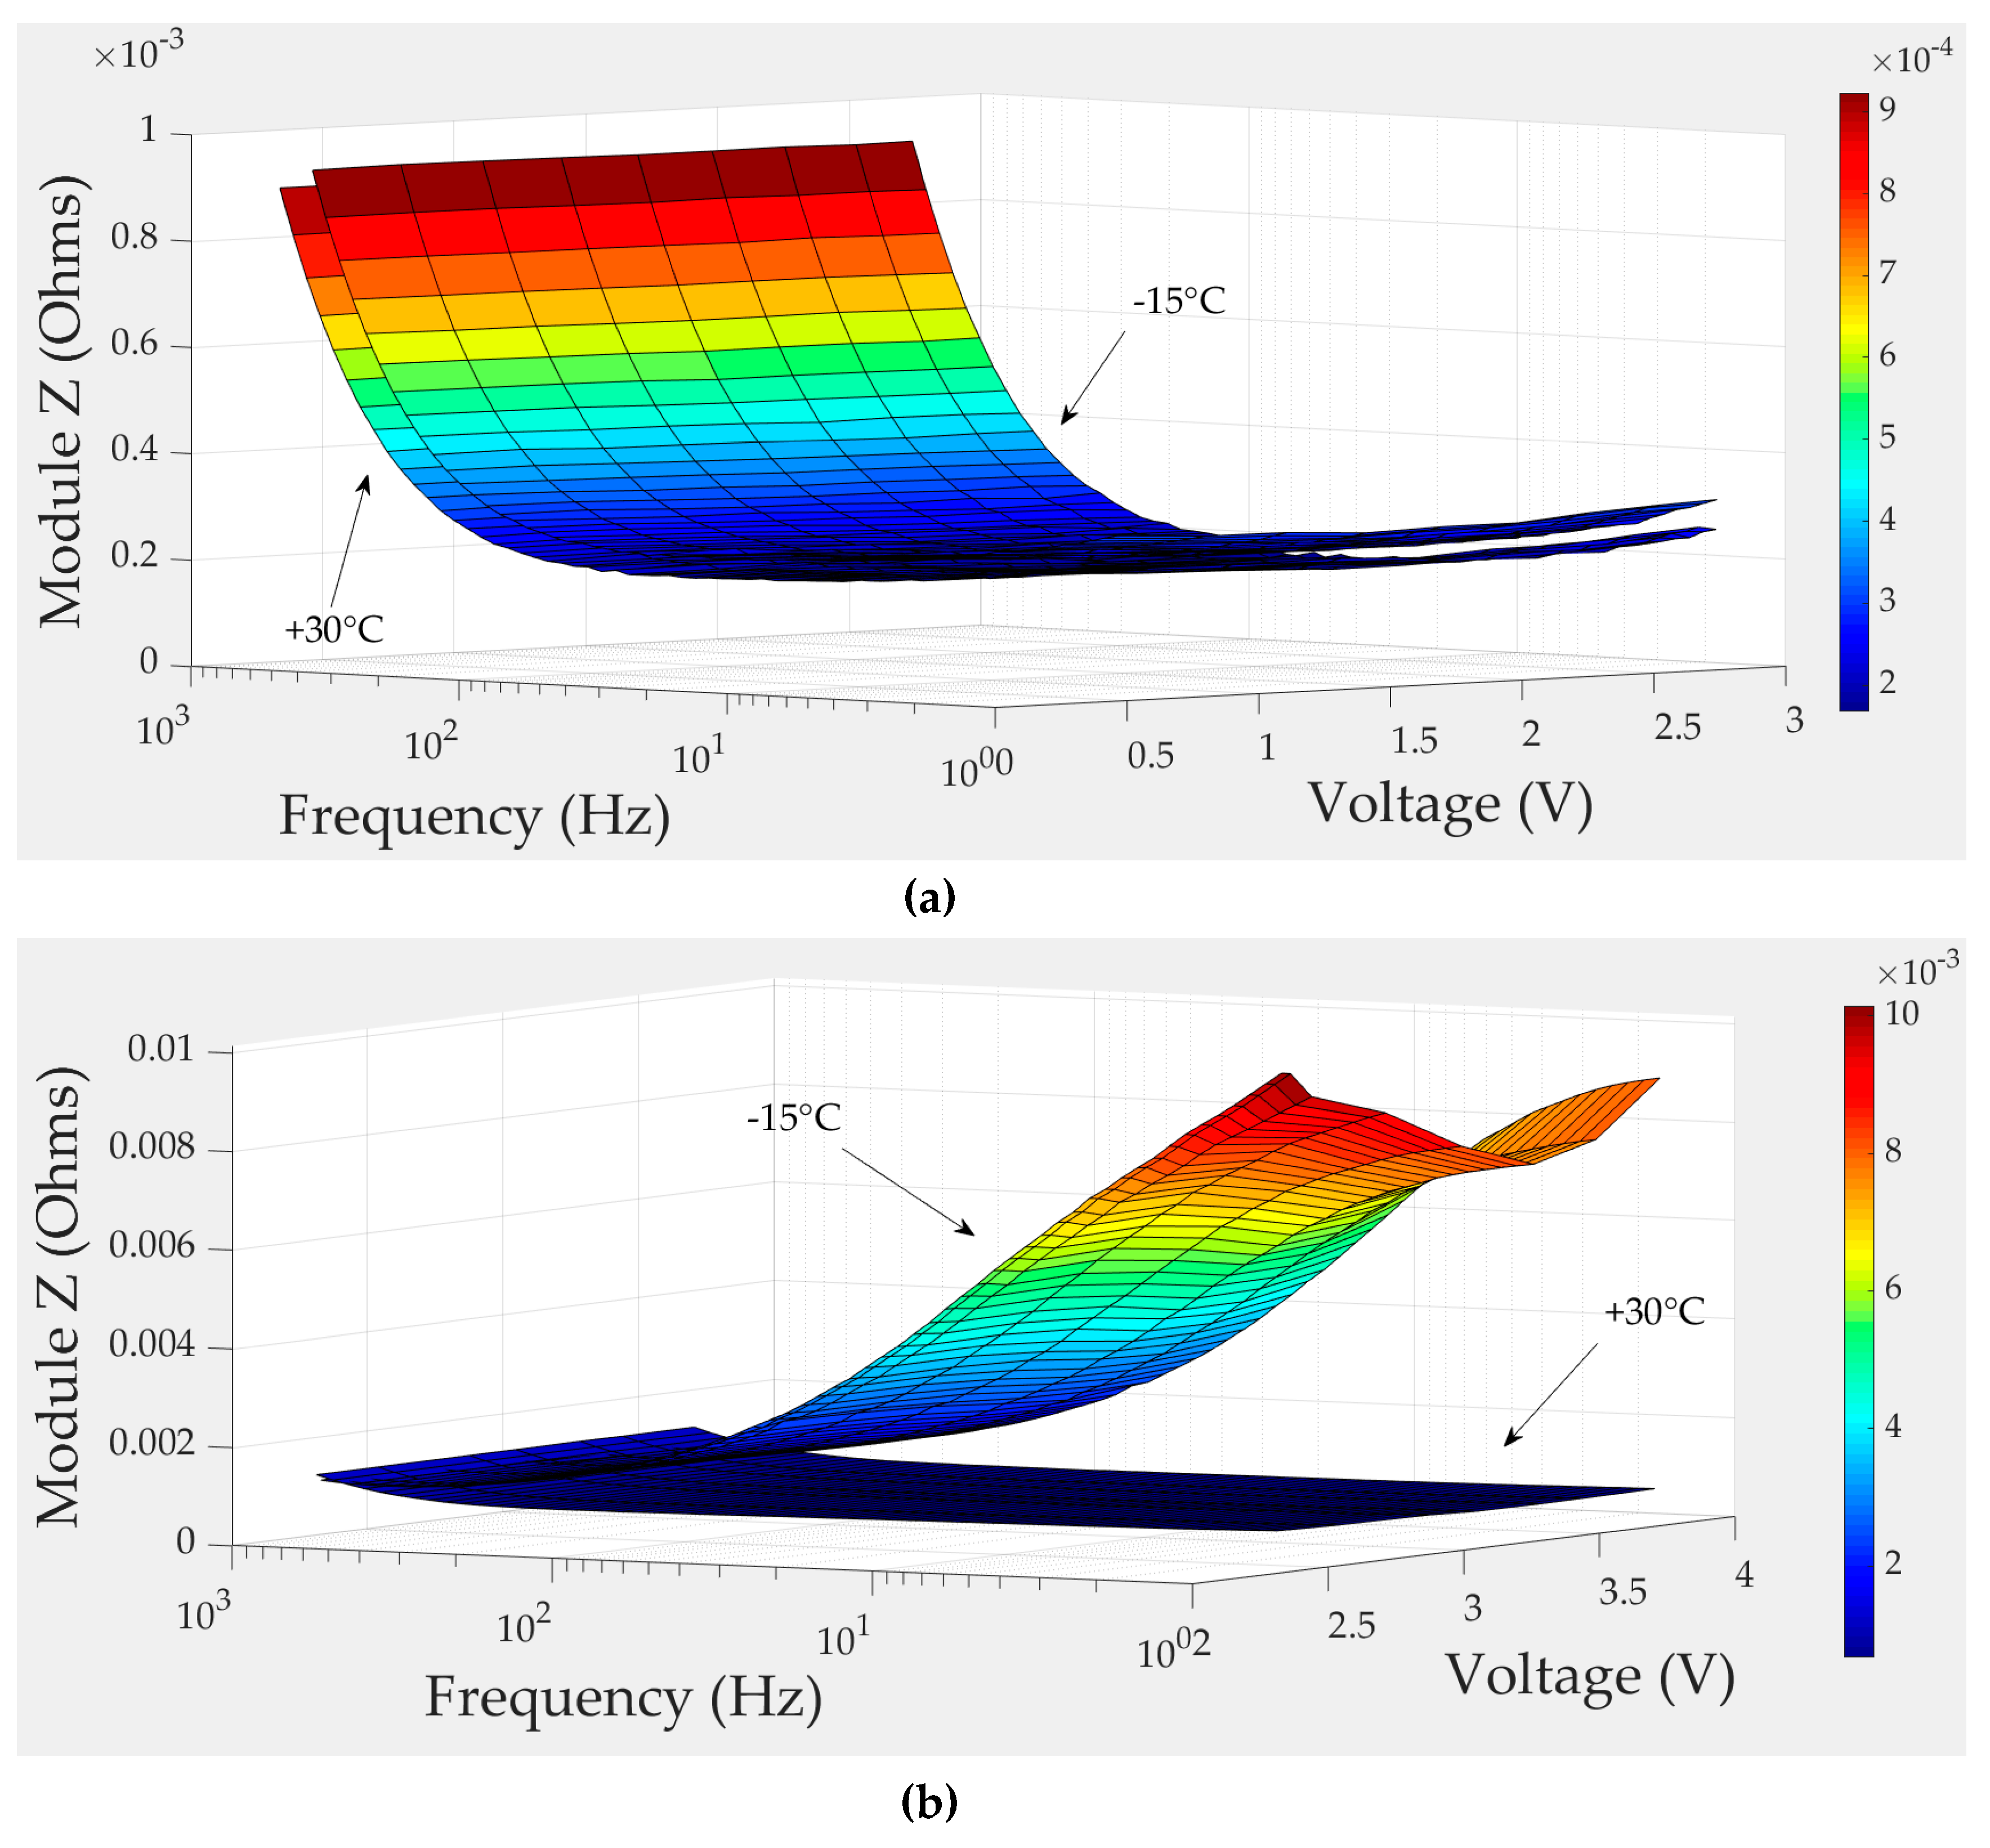
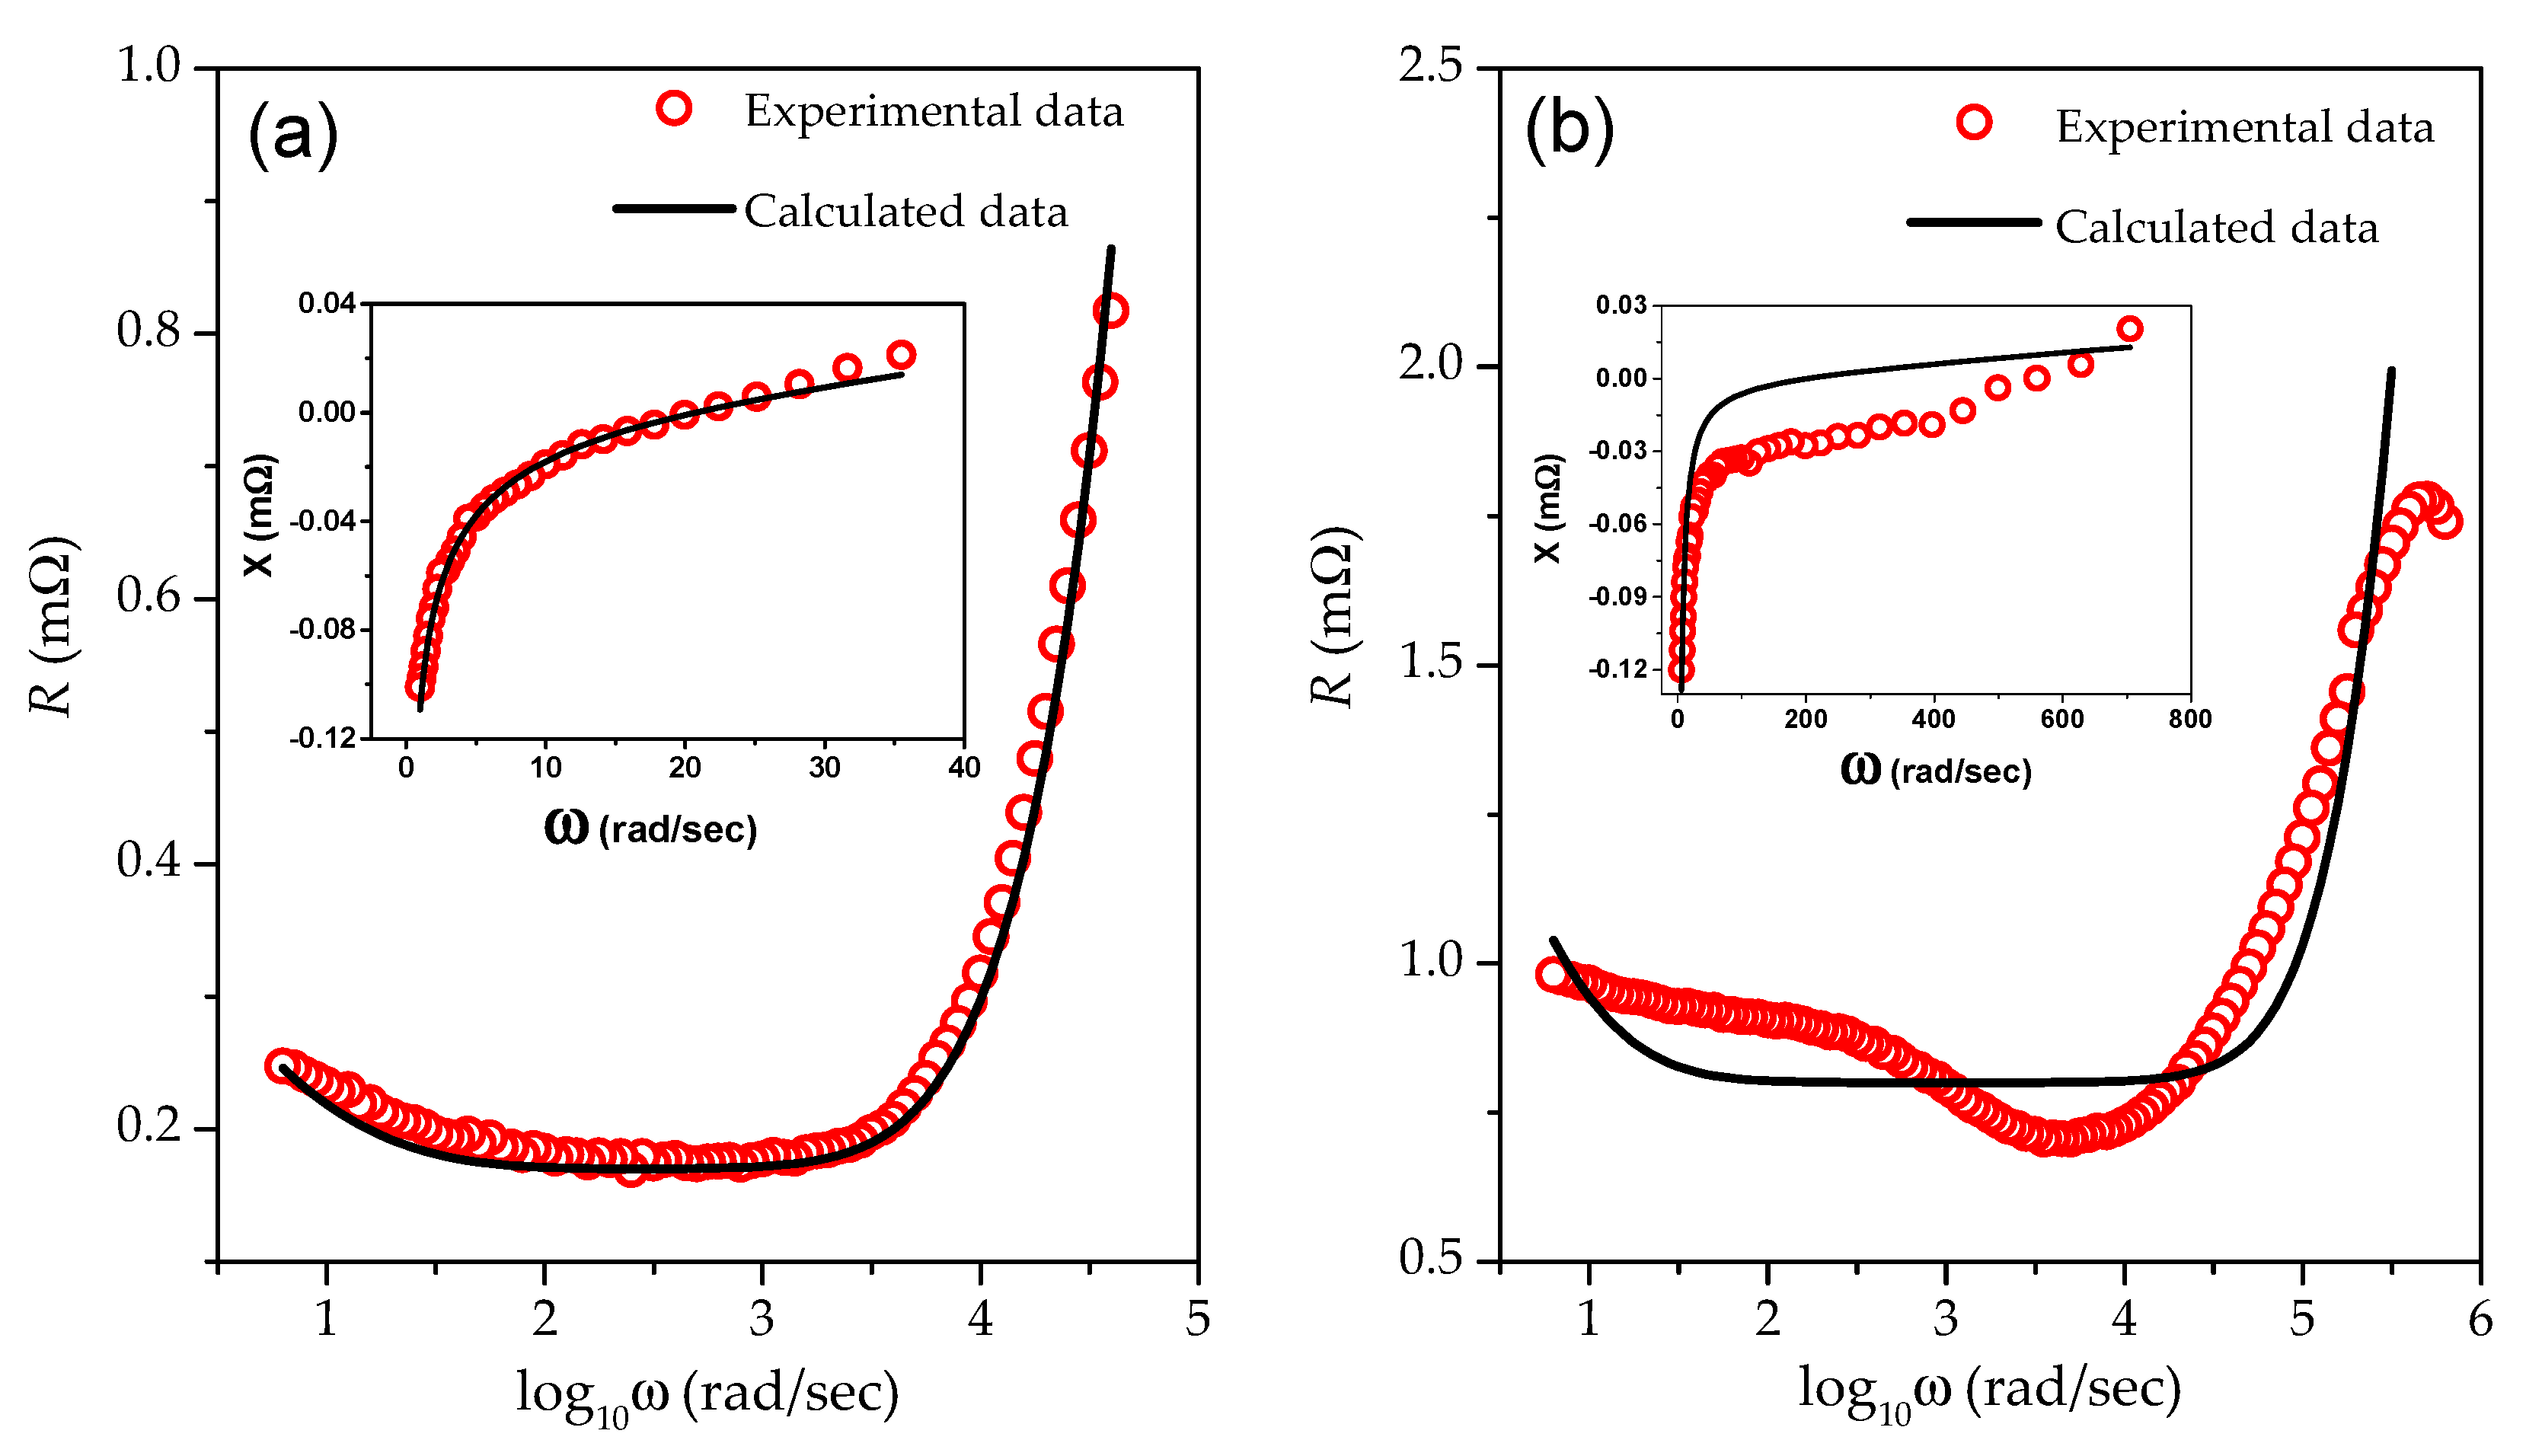
3.2. Measurements by EIS

EIS studies were performed at various temperatures in order to determine the dependence of the characteristic parameters on temperature. The real part of impedance data for both types of UC is shown in Figure 7. The EIS data were measured as a function of voltage and temperature for the frequency range (1 Hz–100 kHz). It was observed that the temperature effects were much more pronounced for the asymmetric Li-ion UC than that of the symmetric double-layer UC. These results suggest that impedance and phase values of the double layer capacitor remained nearly constant for a wide temperature range (−15 °C to 30 °C). This behavior remained unchanged upon further cooling to −30 °C. On the other hand, impedance and phase values of the asymmetric Li-ion UC changed significantly with varying temperature and applied voltage (Figure 7b). These findings are consistent with the findings of the previous section.

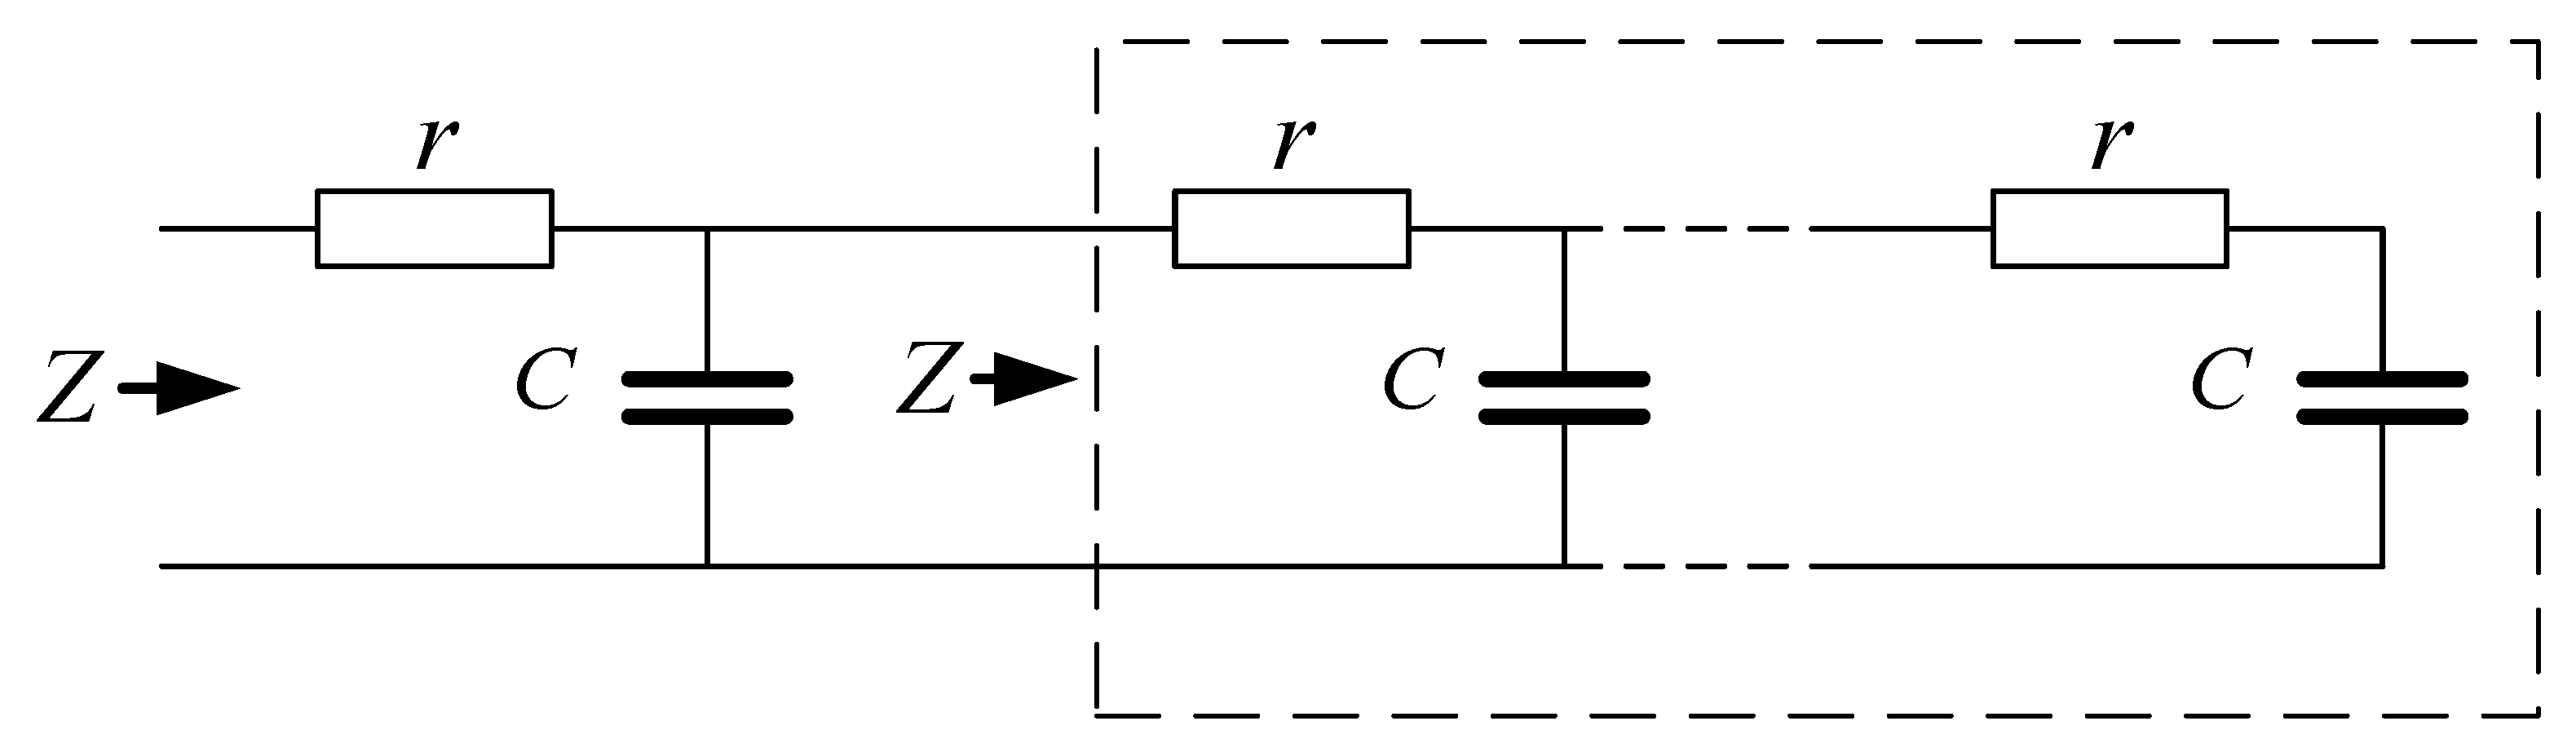
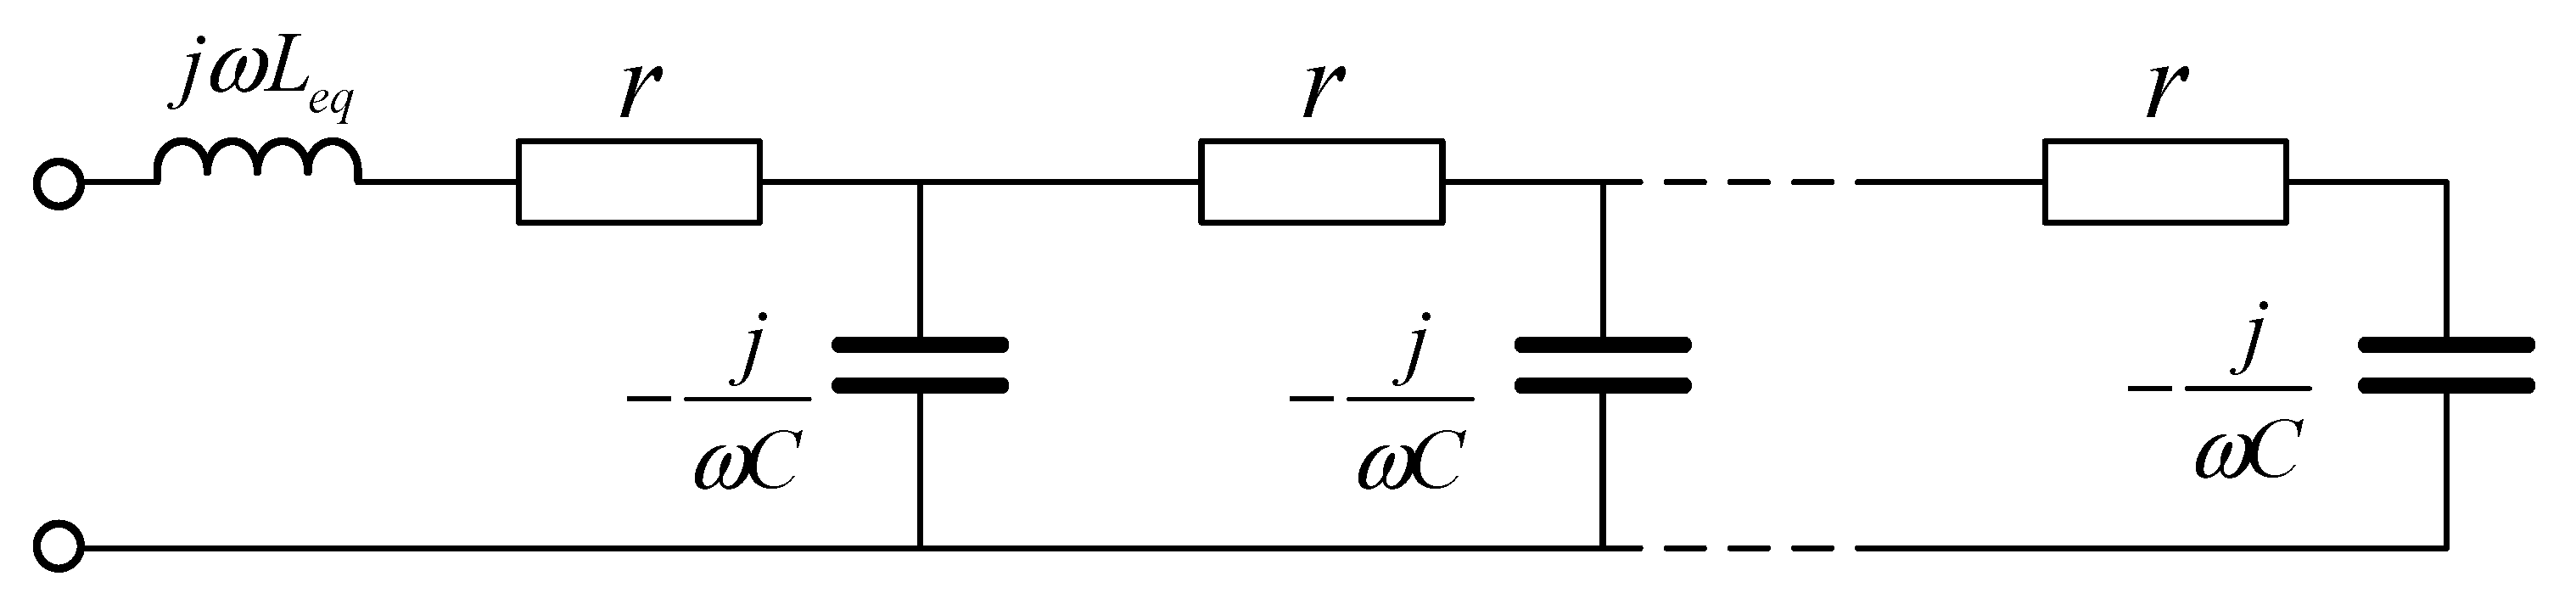
4. Equivalent Circuit Development

4.1. Mathematical Model

A mathematical model should demonstrate the best compromise between model precision, robustness, and complexity. The equivalent circuit for UCs can be represented by a capacitance connected to its internal resistance and inductance. In this work, the equivalent circuit of the UCs was established using an infinite ladder comprising similar r–C chains. The proposed ultracapacitor equivalent circuit model is shown in Figure 8. We assumed that this approach would provide a more accurate description of the operating principles of the ultracapacitors (physical/chemical processes). This model is composed of a resistor r, which models the UC’s ohmic loss (usually called an equivalent series resistor, ESR) and a capacitor C, which simulates the UC’s capacitance during charging and discharging. The mathematical expression for this equivalent circuit is based on the assumption that repetitive chains have the same impedance Z as an input one.
According to basic electrical circuit principles, the continuity equation can be written as:
Z i = r + ( j ω C ) Z i Z i j ω C = r j Z Z · ( ω C ) j .
Input impedance can be expressed as Z = R + j X , where R and X are unknown parameters. Therefore, Equation (3) can be rearranged as given below:
Z 2 ( ω C ) Z ( ω r C ) + j r = 0.
We can write:
Z 2 = ( R + j X ) 2 = R 2 + 2 j R X X 2 .
After the substitution of Equation (5) to Equation (3) and simplification, we arrive at:
( R 2 X 2 r R ) ω C + j ( r + 2 R X ω C ω C r X ) = 0.
For the solution, both real and imaginary parts of Equation (6) should be equated to zero. Hence:
{ R 2 X 2 r R = 0 , r + ω C X ( 2 R r ) = 0.
The magnitude of the variable R versus r and X can be obtained from the first equation of the system:
R 1 , 2 = 0.5 ( r ± r 2 + 4 X 2 ) , R > 0 R = 0.5 ( r + r 2 + 4 X 2 ) .
The substitution of (8) to the second expression of (7) provides a bi-quadratic equation for parameter X:
4 X 4 + r 2 X 2 r 2 ( ω C ) 2 = 0.
Considering the negative character of the input reactance X, its solution versus parameters r and C of the equivalent circuit are obtained from (9) as:
X = r 2 r 4 + ( 4 r ω C ) 2 8 = r 2 2 1 + ( 4 ω r C ) 2 1 .
Parameters of an equivalent circuit are supposed to be obtained from data of EIS experiment using alternating current. Let us consider that the equivalent capacitance is very large (thousands of farads), then even a relatively small inductivity (tens of nH) of a connecting cable plays a significant role in the measurement of a total reactance (X) using EIS. Hence, the equivalent circuit (Figure 8) should be modified by adding the inductivity of cable wires. Figure 9 shows the modified equivalent circuit.
Therefore, expression (10) should be specified as:
X t o t = ω L e q r 2 2 1 + ( 4 ω r C ) 2 1 .
The parameter R can be acquired by substituting (11) to (7):
R = 0.5 r + 0.25 r 2 + ( ω L e q r 2 2 1 + ( 4 ω r C ) 2 1 ) .

4.2. Fitting Results by Developed Theoretical Modeling

The experimental and simulation (using Equations (11) and (12)) results for both capacitors are shown in Figure 10. We measured the EIS data of both UCs for several temperatures and voltages. Here, the simulation and experimental curves of symmetric double layer UC are demonstrated for 2.751 V and 30 °C. The simulation and experimental curves of the Li-ion UC are shown for 3.747 V and 30 °C.
We want to emphasize that this mathematical model based on an infinite number of r–C chains ensures a more accurate description of UCs. Figure 10 illustrates the coincidence of theoretical with experimental data for reactance (X) and resistance (R). However, the accuracy of this model was better for the symmetric double-layer UC. This can be explained by the fact that there are no electrode electrochemical reactions for the symmetric double-layer UC. This model explained the characteristic behavior of the asymmetric UC with less precision. For asymmetric UCs, electrochemical reactions take place in one of the compartments, which are difficult to model using linearization approach [45].

5. Application of UCs for Filtering Power Fluctuation

The most prominent use of UCs is for filtering power fluctuations in grids, including significant PV generation. Power fluctuations in grids having more than 15–20% of the total load power may achieve substantial magnitudes [46], causing voltage deviations over the permissible level. The practical solution for preventing such events is the usage of a capacitor bank connected to the grid, where the power filtering improves as capacitance is increased. The requirements to provide essential diminishment of power deviations with minimal cost leads to the use of UC banks comprised of m-parallel branches of n-serially connected individual cells. The practical selection of the required UC cells utilize a special approximating procedure, see [3]. The selection procedure considers the capacitance and internal resistance of each cell. These parameters can be evaluated according to the method described in the previous sections of this article.

6. Conclusions

In this study, the dynamic parameters of two types of ultracapacitor (UC) were determined using experimental investigations and theoretical modeling. The first UC was a Li-ion UC (CPQ2300S, JSR Micro Co.), and the second was a double-layer UC (BCAP3400, Maxwell). The characteristic properties of UCs (i.e., capacitance and internal resistance) were measured and investigated as a function of temperature, current, and voltage. The experimental investigations were carried out using charge–discharge cycling and galvanostatic potentiostat. During charge–discharge processes, the UCs were charged from minimum to maximum allowable voltage with a specific current magnitude and later discharged with the same magnitude of current. The EIS studies were performed on both capacitors for a frequency range of 1 Hz–100 kHz with a constant current of 1 A (rms). These experiments were also carried out for the temperature range of −30 °C to +30 °C with an interval of 15 °C.
The Li-ion UC was characterized by a smaller capacitance, smaller size, and prolonged service life than that of the double-layer UC. On the other hand, higher capacitance, internal resistance, and smaller inductance were shown by the symmetric double layer UC. The internal resistance of the double-layer UC increased as temperature decreased to −40 °C. This magnitude of internal resistance is relatively low and still applicable to power appliances. On the other hand, the internal resistance of the Li-ion UC became five times larger when the temperature dropped from +25 °C to −20 °C. The current and voltage magnitudes influenced the internal resistance of both UCs insignificantly. Importantly, the capacitance of the double-layer UC remained nearly constant for a wide range of temperature, current, and voltage. Instead, the capacitance of the Li-ion UC was significantly changed with temperature variations (~1% change for each degree Celsius) and slightly influenced by current and voltage. The EIS studies also revealed that the Li-ion UC was more sensitive to temperature alterations (−30 to +30 °C) as compared to the double-layer UC. A linear equivalent circuit based on an infinite r–C chains ladder was developed. The proposed algorithm was applied to impedance data to calculate equivalent circuit parameters (internal resistance and capacitance) on EIS measurements. This model explained the functionality of the symmetric double-layer UC very accurately. The same approach was applicable for the Li-ion UC, but with less accuracy. This is explained by the presence of electrochemical electrode reactions in one of the compartments of such UCs.
It is strongly recommended to continue this research in order to deepen the description of asymmetric Li-ion UCs considering the role of electrochemical reactions on the electrode surface.

Author Contributions

Conceptualization: M.A. and A.Y.; methodology: M.A., S.R., and Y.A.; formal analysis, S.R. and Y.A; investigation, S.R. and Y.A; resources, M.A.; writing—original draft preparation, S.R. and Y.A; writing—review and editing, S.R., M.A., and A.Y.; supervision, M.A.

Funding

This research received no external funding.

Acknowledgments

The authors thank M. Zinigrad (Ariel University), Y. Bernstein (Ariel University), and M. Perl (Wise-Tech. Co.) for providing the possibility to use specific equipment for carrying out the experimental measurements.

Conflicts of Interest

The authors declare no conflicts of interest.

References

  1. Burke, A. Ultracapacitors: Why, how, and where is the technology. J. Power Sources 2000, 91, 37–50. [Google Scholar]
  2. Averbukh, M.; Lineykin, S.; Kuperman, A. Portable ultracapacitor based power source for emergency starting of internal combustion engines. IEEE Trans. Power Electron. 2015, 30, 4283–4290. [Google Scholar] [CrossRef]
  3. Sorkin, O.; Farber, E.; Averbukh, M. Selecting ultracapacitors for smoothing voltage deviations in local grids fed by transformer with tap-changer and distributed PV facilities. Electronics 2019, 8, 357. [Google Scholar] [CrossRef]
  4. Schultz, L.I.; Querques, N.P. Tracing the ultracapacitor commercialization pathway. Renew. Sustain. Energy Rev. 2014, 39, 1119–1126. [Google Scholar] [CrossRef]
  5. Sharma, P.; Bhatti, T.S. A review on electrochemical double-layer capacitors. Energ. Convers. Manage. 2010, 51, 2901–2912. [Google Scholar] [CrossRef]
  6. Campillo-Robles, J.M.; Artetxe, X.; del Teso Sánchez, K.; Gutiérrez, C.; Macicior, H.; Röser, S.; Wagner, R.; Winter, M. General hybrid asymmetric capacitor model: Validation with a commercial lithium ion capacitor. J. Power Sources 2019, 425, 110–120. [Google Scholar] [CrossRef]
  7. Manla, E.; Mandic, G.; Nasiri, A. Testing and modeling of lithium-ion ultracapacitors. In Proceedings of the 2011 IEEE Energy Conversion Congress and Exposition, Phoenix, AZ, USA, 17–22 September 2011; pp. 2957–2962. [Google Scholar]
  8. Hamidi, S.A.; Manla, E.; Nasiri, A. Li-ion batteries and Li-ion ultracapacitors: Characteristics, modeling and grid applications. In Proceedings of the 2015 IEEE Energy Conversion Congress and Exposition (ECCE), Montreal, QC, Canada, 20–24 September 2015; pp. 4973–4979. [Google Scholar]
  9. Seyedmahmoudian, M.; Horan, B.; Soon, T.K.; Rahmani, R.; Oo, A.M.T.; Mekhilef, S.; Stojcevski, A. State of the art artificial intelligence-based MPPT techniques for mitigating partial shading effects on PV systems-A review. Renew. Sustain. Energy Rev. 2016, 64, 435–455. [Google Scholar] [CrossRef]
  10. Dou, X.; Quan, X.; Wu, Z.; Hu, M.; Sun, J.; Yang, K.; Xu, M. Improved control strategy for microgrid ultracapacitor energy storage systems. Energies 2014, 7, 8095–8115. [Google Scholar] [CrossRef]
  11. Alizadeh, G.A.; Rahimi, T.; Nozadian, B.; Hasan, M.; Sanjeevi kumar, P.; Leonowicz, Z. Improving microgrid frequency regulation based on the virtual inertia concept while considering communication system delay. Energies 2019, 12, 2016. [Google Scholar] [CrossRef]
  12. Sepe, R.B., Jr.; Steyerl, A.; Bastien, S.P. Lithium-ion supercapacitors for pulsed power applications. In Proceedings of the 2011 IEEE Energy Conversion Congress and Exposition (ECCE), Phoenix, AZ, USA, 17–22 September 2011; pp. 1813–1818. [Google Scholar]
  13. Zhu, W.H.; Tatarchuk, B.J. Characterization of asymmetric ultracapacitors as hybrid pulse power devices for efficient energy storage and power delivery applications. Appl. Energy. 2016, 169, 460–468. [Google Scholar] [CrossRef]
  14. Piórkowski, P.; Chmielewski, A.; Bogdziński, K.; Możaryn, J.; Mydłowski, T. Research on ultracapacitors in hybrid systems: Case study. Energies 2018, 11, 2551. [Google Scholar] [CrossRef]
  15. Wang, L.; Guo, J.; Xu, C.; Wu, T.; Lin, H. Hybrid Model Predictive Control Strategy of Supercapacitor Energy Storage System Based on Double Active Bridge. Energies 2019, 12, 2134. [Google Scholar] [CrossRef]
  16. Yahalom, A.; Dahan, Y.; Prihodko, V.; Averbukh, M. Experimental verification of internal resistance and capacitance of CPQ2300S li-ion ultracapacitors (JSR Co.). In Proceedings of the 2016 IEEE International Conference on the Science of Electrical Engineering (ICSEE), Eilat, Israel, 16–18 November 2016; pp. 1–3. [Google Scholar]
  17. Zhao, S.; Wu, F.; Yang, L.; Gao, L.; Burke, A.F. A measurement method for determination of dc internal resistance of batteries and supercapacitors. Electrochem. Commun. 2010, 12, 242–245. [Google Scholar] [CrossRef]
  18. Vicentini, R.; Da Silva, L.M.; Cecilio Junior, E.P.; Alves, T.A.; Nunes, W.G.; Zanin, H. How to Measure and Calculate Equivalent Series Resistance of Electric Double-Layer Capacitors. Molecules 2019, 24, 1452. [Google Scholar] [CrossRef] [PubMed]
  19. Galla, S.; Szewczyk, A.; Smulko, J.; Przygocki, P. Methods of Assessing Degradation of Supercapacitors by Using Various Measurement Techniques. Appl. Sci. 2019, 9, 2311. [Google Scholar] [CrossRef]
  20. Eddahech, A.; Briat, O.; Ayadi, M.; Vinassa, J. Ultracapacitor performance determination using dynamic model parameter identification. In Proceedings of the 2013 IEEE International Symposium on Industrial Electronics, Taipei, Taiwan, 28–31 May 2013; pp. 1–5. [Google Scholar]
  21. Devillers, N.; Jemei, S.; Péra, M.; Bienaimé, D.; Gustin, F. Review of characterization methods for supercapacitor modelling. J. Power Sources 2014, 246, 596–608. [Google Scholar] [CrossRef]
  22. Miniguano, H.; Barrado, A.; Fernández, C.; Zumel, P.; Lázaro, A. A General Parameter Identification Procedure Used for the Comparative Study of Supercapacitors Models. Energies 2019, 12, 1776. [Google Scholar] [CrossRef]
  23. Zhang, L.; Wang, Z.; Hu, X.; Sun, F.; Dorrell, D.G. A comparative study of equivalent circuit models of ultracapacitors for electric vehicles. J. Power Sources 2015, 274, 899–906. [Google Scholar] [CrossRef]
  24. Fletcher, S.; Black, V.J.; Kirkpatrick, I. A universal equivalent circuit for carbon-based supercapacitors. J. Solid State Electrochem. 2014, 18, 1377–1387. [Google Scholar]
  25. Jiya, I.; Gurusinghe, N.; Gouws, R. Electrical circuit modelling of double layer capacitors for power electronics and energy storage applications: A review. Electronics 2018, 7, 268. [Google Scholar] [CrossRef]
  26. Manla, E.; Mandic, G.; Nasiri, A. Development of an electrical model for lithium-ion ultracapacitors. IEEE Trans. Emerg. Sel. Top. Power Electron. 2015, 3, 395–404. [Google Scholar] [CrossRef]
  27. Drummond, R.; Valmorbida, G.; Duncan, S.R. Equivalent circuits for electrochemical supercapacitor models. IFAC-Pap. OnLine 2017, 50, 2671–2676. [Google Scholar] [CrossRef]
  28. Pozo, B.; Garate, J.I.; Ferreiro, S.; Fernandez, I.; de Gorostiza, E.F. Supercapacitor Electro-Mathematical and Machine Learning Modelling for Low Power Applications. Electronics 2018, 7, 44. [Google Scholar] [CrossRef]
  29. Wu, C.H.; Hung, Y.H.; Hong, C.W. On-line supercapacitor dynamic models for energy conversion and management. Energy Convers. Manag. 2012, 53, 337–345. [Google Scholar] [CrossRef]
  30. Shi, L.; Crow, M. Comparison of ultracapacitor electric circuit models. In Proceedings of the 2008 IEEE Power and Energy Society General Meeting-Conversion and Delivery of Electrical Energy in the 21st Century, Pittsburgh, PA, USA, 20–24 July 2008; pp. 1–6. [Google Scholar]
  31. Li, J.; Xu, M.; Li, X.; Yuan, C. Preparation and Electrochemical Characterization of Li-ion Supercapacitor. Adv. Mater. Res. 2015, 482, 535–538. [Google Scholar] [CrossRef]
  32. Allu, S.; Asokan, B.V.; Shelton, W.A.; Philip, B.; Pannala, S. A generalized multi-dimensional mathematical model for charging and discharging processes in a supercapacitor. J. Power Sources 2014, 256, 369–382. [Google Scholar] [CrossRef]
  33. Sedlakova, V.; Sikula, J.; Majzner, J.; Sedlak, P.; Kuparowitz, T.; Buergler, B.; Vasina, P. Supercapacitor equivalent electrical circuit model based on charges redistribution by diffusion. J. Power Sources 2015, 286, 58–65. [Google Scholar] [CrossRef]
  34. Zhang, L.; Hu, X.; Wang, Z.; Sun, F.; Dorrell, D.G. A review of supercapacitor modeling, estimation, and applications: A control/management perspective. Renew. Sustain. Energy Rev. 2018, 81, 1868–1878. [Google Scholar] [CrossRef]
  35. Freeborn, T.J.; Maundy, B.; Elwakil, A.S. Fractional-order models of supercapacitors, batteries and fuel cells: A survey. Mater. Renew. Sustain. Energy 2015, 4, 9. [Google Scholar] [CrossRef]
  36. Zubieta, L.; Bonert, R. Characterization of double-layer capacitors for power electronics applications. IEEE Trans. Ind. Appl. 2000, 36, 199–205. [Google Scholar] [CrossRef]
  37. Buller, S.; Karden, E.; Kok, D.; Doncker, R.W.D. Modeling the dynamic behavior of supercapacitors using impedance spectroscopy. IEEE Trans. Ind. Appl. 2002, 38, 1622–1626. [Google Scholar] [CrossRef]
  38. K2 ULTRACAPACITORS: 2.85V/3400F. Available online: https://www.maxwell.com/images/documents/K2_2_85V_DS_3000619EN_3_.pdf (accessed on 20 March 2019).
  39. ULTIMO Lithium Ion Capacitor Prismatic Cells. Available online: https://www.jsrmicro.be/emerging-technologies/lithium-ion-capacitor/products/ultimo-lithium-ion-capacitor-prismatic-cells (accessed on 10 May 2019).
  40. Variable-switching Multi Range DC Power Supply PWR 1600W. Available online: https://www.kikusui.co.jp/en/product/detail.php?IdFamily=0064 (accessed on 1 February 2019).
  41. Midi logger GL900. Available online: http://www.graphteccorp.com/instruments/gl900/index.html (accessed on 21 February 2019).
  42. Gualous, H.; Bouquain, D.; Berthon, A.; Kauffmann, J.M. Experimental study of supercapacitor serial resistance and capacitance variations with temperature. J. Power Sources 2003, 123, 86–93. [Google Scholar] [CrossRef]
  43. EchemLab XM Potentiostat Galvanostat. Available online: https://www.ameteksi.com/products/potentiostats/single-channel/apps-xm-series/echemlab-xm-potentiostat-galvanostat (accessed on 21 May 2019).
  44. Lunaire Steady State Testing Chamber. Available online: https://www.thermalproductsolutions.com/brands/tenney-lunaire-environmental-test-chambers-and-rooms (accessed on 12 February 2019).
  45. Liu, H.; Akhtar, Z.; Li, P.; Wang, K. Mathematical Modeling Analysis and Optimization of Key Design Parameters of Proton-Conductive Solid Oxide Fuel Cells. Energies 2014, 7, 173–190. [Google Scholar] [CrossRef]
  46. Capizzi, G.; Sciuto, G.L.; Napoli, C.; Tramontana, E. Advanced and adaptive dispatch for smart grids by means of predictive models. IEEE Trans. Smart Grid 2017, 9, 6684–6691. [Google Scholar] [CrossRef]
Figure 1. Experimental setup for the charging and discharging cycle on both capacitors.
Electronics 08 00891 g001
Figure 2. Voltage measured as a function of time in order to calculate internal resistance and capacitance.
Electronics 08 00891 g002
Figure 3. (a) Experimental setup of EIS measurements includes (1) potentiostat/galvanostat analyzer, (2) deep freezer chamber and (3) Laptop PC for data acquisition; (b) Schematic diagram of the experimental setup, where CE/WE are the main contacts, RE1/RE2 are the auxiliary contacts and DUT is device under test.
Electronics 08 00891 g003
Figure 4. Internal resistance and capacitance for charge and discharge processes of (a) symmetric double-layer UC; (b) asymmetric Li-ion UC.
Electronics 08 00891 g004
Figure 5. (a) Internal resistance and (b) capacitance measured at different temperatures (+25 °C, 0 °C, −20 °C, and −40 °C) as a function of voltage for the double-layer UC.
Electronics 08 00891 g005
Figure 6. (a) Internal resistance and (b) capacitance measured at different temperatures (+25 °C, 0 °C, and −20 °C) as a function of voltage for the Li-ion UC.
Electronics 08 00891 g006
Figure 7. Real part of Z as a function of temperature, frequency, and voltage for (a) double-layer UC, (b) Li-ion UC.
Electronics 08 00891 g007
Figure 8. Equivalent circuit of a UC represented by a ladder combined from r–C chains. r: resistor; C: capacitor.
Electronics 08 00891 g008
Figure 9. UC equivalent circuit considering the inductivity of connecting wires.
Electronics 08 00891 g009
Figure 10. Experimental and calculated data of impedance for (a) symmetric double-layer UC and (b) asymmetric Li-ion UC.
Electronics 08 00891 g010
Table 1. Average values of internal resistance (Rint) and capacitance for both UCs during charge and discharge currents of 20, 50, and 75 A.
Double-Layer UCLi-ion UC
Current (A)Rint (mΩ)Capacitance (F)Rint (mΩ)Capacitance (F)
ChargeDischarge ChargeDischarge ChargeDischarge ChargeDischarge
200.3190.323346534940.9240.91822062244
500.3110.308338133810.9630.90921982161
750.3110.326341134720.9230.89122182154

