Article

A Novel MFDFA Algorithm and Its Application to Analysis of Harmonic Multifractal Features

1
College of Electrical Engineering and Automation, Shandong University of Science and Technology, 579 Qianwangang Road, Huangdao District, Qingdao, Shandong Province 266590, China
2
Zaozhuang Power Supply Company, State Grid Shandong Electric Power Company, Zaozhuang 277000, China
*
Author to whom correspondence should be addressed.
Electronics 2019, 8(2), 209; https://doi.org/10.3390/electronics8020209
Submission received: 17 December 2018 / Revised: 9 February 2019 / Accepted: 10 February 2019 / Published: 13 February 2019
(This article belongs to the Special Issue Recent Developments on Time-Delay Systems and Its Applications)

Abstract

:
A power grid harmonic signal is characterized as having both nonlinear and nonstationary features. A novel multifractal detrended fluctuation analysis (MFDFA) algorithm combined with the empirical mode decomposition (EMD) theory and template movement is proposed to overcome some shortcomings in the traditional MFDFA algorithm. The novel algorithm is used to study the multifractal feature of harmonic signals at different frequencies. Firstly, the signal is decomposed and the characteristics of wavelet transform multiresolution analysis are employed to obtain the components at different frequency bands. After this, the local fractal characteristic of the components is studied by utilizing the novel MFDFA algorithm. The experimental results show that the harmonic signals exhibit obvious multifractal characteristics and that the multifractal intensity is related to the signal frequency. Compared with the traditional MFDFA algorithm, the proposed method is more stable in curve fitting and can extract the multifractal features more accurately.

1. Introduction

With a large number of nonlinear electrical equipment and electronic devices being applied in the power system, more and more harmonics are appearing in the power grid. Investigations show that the pollutions from harmonics have become increasingly severe in the power grid [1,2,3,4,5,6]. Therefore, the study and analysis of harmonics has become an important research topic both at home and abroad. Traditional harmonic analysis methods mainly employ artificial neural network [7,8,9,10,11,12,13], Hilbert Huang Transform (HHT) [14,15], instantaneous reactive power [16], wavelet transform [17,18] and Fourier transform (FT) [19], etc. However, these methods ignore the self-similarity that exists in the time-domain waveform and the trend of harmonics, i.e., the so-called fractal characteristics [20]. Therefore, bringing fractal characteristics into harmonic analysis is of great significance.
As one of the emerging theories for studying nonlinear systems, monofractal analysis has made great progress in the nonlinear signal analysis. However, monofractal is mainly a description of the overall average of the object of study, with the local characteristics of the signal being insufficiently characterized [21]. Multifractal analysis [22,23] provides the ability to describe the local characteristics of the signal in detail. By combining multifractal and detrended fluctuation analysis, a multifractal detrended fluctuation analysis (MFDFA) algorithm [24] was proposed by Kantelhardt and Zschiegner et al. Since then, MFDFA has been quickly applied in a number of research areas, including market [25], temperature time series [26], seismic wave signal [27], vibration fault diagnosis [28], image processing [29], etc. For instance, in 2016, Zhao and He [30] analyzed the characteristics of speech signals based on MFDFA with moving, overlapping windows. To solve the shortcomings of the periodic trend affecting the Hurst index estimation in MFDFA, Fourier transform and MFDFA were combined to analyze the fluctuations in a high-frequency power load [31]. Aiming to solve the subjectivity, lack of dynamics and theoretical basis for setting the risk threshold, the authors of Reference [32] proposed a method that combined surrogate data method and MFDFA to determine the prewarning threshold of electric load risk threshold based on historical load data.
The above-mentioned various methods can effectively describe the nonlinear system, especially the multifractal features of time series, but the analysis of time-series signals requires the process of detrending. New pseudofluctuation errors occur during the process. Such errors are mainly caused by two reasons. One is that the sequence is overfitting or underfitting due to the uncertainty of the order in the fitting polynomial function, while the other is that MFDFA uses a uniform sequence to segment data, resulting in discontinuity at sequence segmentation points.
To solve the above-mentioned problem, this paper proposes a new MFDFA algorithm based on empirical mode decomposition (EMD) and template movement. The multifractal characteristics of harmonic signals are analyzed by the new algorithm and a new method for determining the harmonic signals’ characteristics is obtained. Since harmonic signals are susceptible to factors such as randomness, distribution factors and nonstationary factors [33], this paper first uses the wavelet multiresolution method to decompose the harmonic signals and the harmonic components, obtained at different frequencies. After this, the multifractal characteristics of the harmonic components are determined by the novel MFDFA algorithm. Finally, the proposed method and the traditional method are analyzed and compared. The analysis results verify the effectiveness of the proposed method.

2. MFDFA Algorithm Based on Empirical Modality and Template Movement

2.1. Empirical Mode Decomposition Algorithm

The EMD algorithm is an adaptive signal time-frequency processing algorithm [34], which is mainly used for the processing of nonlinear and nonstationary signals [35,36]. The procedure of EMD analysis is described as follows:
  • Find all local extreme points in signal x ( t ) and connect the extreme points smoothly through the cubic spline function to get the upper envelope e ( t ) , lower envelope e + ( t ) and the average envelope m ( t ) = ( e + ( t ) + e ( t ) ) / 2 of the original signal;
  • Find the difference function z ( t ) = x ( t ) m ( t ) ;
  • Determine whether z ( t ) meets intrinsic mode function’s (IMF) conditions or not. If it is not satisfied, repeat the above steps. If it is satisfied, z ( t ) is the first IMF and is recorded as i m f i ( t ) ;
  • Finally, x ( t ) is decomposed by EMD into n frequencies from high to low i m f i ( t ) and a remainder r n ( t ) . Essentially, x ( t ) = i = 1 n i m f i ( t ) + r n ( t ) .

2.2. Proposed Novel MFDFA Algorithm

The EMD algorithm successively decomposes n i m f i ( t ) and one residual r n ( t ) from the signal and the residual part is used to replace the detrend fluctuation item in MFDFA. To be specific, the residual r n ( t ) replaces the detrend polynomial y v ( t ) and the result, after the least squares polynomial fitting, eliminates the residual sequences to obtain the fluctuations polynomial. After this, the fluctuation polynomial is divided into several segments. After calculating the fluctuation function F q ( s ) of the signal according to different q values, the generalized Hurst index of the signal can be obtained by finding the logarithmic least squares fitting slope of F q ( s ) and q . Finally, the multifractal spectrum of the signal can be obtained through the Legendre transform. The proposed algorithm is illustrated in the flowchart in Figure 1.
Step-1: Set the time series as x ( k ) ,     k = 1 , 2 , ,   N and subsequently, construct a new sequence:
Y ( i ) = k = 1 i ( x k x ¯ )
where x ¯ is the mean value of x k , with x ¯ = 1 N k = 1 N x k .
Step-2: The traditional MFDFA algorithm divides the new sequences Y i into N s = i n t ( N / s ) nonoverlapping intervals, each of which contains s data. Since N may not be divisible by s , there will be a residual value. To fit all the data in the sequence in the calculation, another segmentation process is performed from the end of the sequence and thereafter, 2 N s equal length segments are obtained.
In this paper, the method of sequence segmenting MFDFA is improved by introducing the template movement and the number of sequences is increased from N s or 2 N s to N s + 1 .
Step-3: For the s points in each v   ( v = 1 , 2 , , 2 N s ) interval, the least square method is used to fit the polynomial of the order k and the results are obtained:
Y v ( i ) = a 1 i k + a 2 i k 1 + + a k i + a k + 1 ,   ( i = 1 ,   2 ,   ,   s ;   k = 1 ,   2 ,   )
This paper introduces the EMD algorithm to replace the least squares fitting, to detrend sequence Y ( i ) . The remainder of the EMD decomposition is the trend polynomial that reflects the general trend of the signal, with Y v ( i ) = r v ( i ) .
Step-4: Calculate the mean square error of F 2 ( s , v ) by the following:
F 2 ( s , v ) = 1 s i = 1 s { Y [ ( v 1 ) s + i ] r v ( i ) } 2
Step-5: For N s + 1 segments, find the mean value of F 2 ( s , v ) and get the q o r d e r fluctuation function F q ( s ) by the following:
F q ( s ) = { { 1 N s + 1 v = 1 N s + 1 [ F 2 ( s , v ) ] q 2 } 1 q ,   q 0 e x p { 1 2 ( N s + 1 ) v = 1 N s + 1 l n [ F 2 ( s , v ) ] } ,   q = 0
F q ( s ) is a function of data length s and q o r d e r . With an increase in s , F q ( s ) increases in the power–law relationship
s h ( q ) F q ( s )
where h ( q ) is the generalized Hurst index.
h ( q ) is related to the multifractal quality index τ ( q ) and their relation is described as follows:
τ ( q ) = q h ( q ) 1
According to the Legendre transform, the relationship between the singular exponent α and the multifractal spectrum f ( α ) and h ( q ) , is obtained in Reference [37]
α = h ( q ) + q h ( q ) = h ( q ) + q d h ( q ) d q
f ( α ) = q [ α h ( q ) ] + 1
From the above equations, three characteristics in judging multifractal features based on the MFDFA method can be obtained [38]:
  • Judging by q and h ( q ) :
    • If q is not related to h ( q ) , the signal is monofractal.
    • If q is related to h ( q ) , the signal is multifractal.
  • Judging by q and τ ( q ) :
    • If τ ( q ) is a straight line, the signal is monofractal.
    • If q and τ ( q ) are nonlinear, the signal is multifractal.
  • Judging by α and f ( α ) :
    • If f ( α ) is a constant, the signal is monofractal.
    • If the curve of α and f ( α ) has a single-peak bell shape, the signal is multifractal.

2.3. MFDFA Feature Extraction Parameters

The singular exponent α reflects the degree of unevenness of the fractal sequence in the local probability measure distribution [39,40] while the multifractal spectrum width Δ α = α m a x α m i n reflects the signal’s intensity of the multifractal property. A larger Δ α highlights stronger multifractal characteristics in the signal and more severe fluctuations in the signal. The singular exponent α 0 , corresponding to the maximum value of multifractal spectrum f ( α ) , reflects the randomness of the signal. α m i n is the smallest singular exponent, which reflects the intensity of local changes in the signal. A smaller α m i n indicates a stronger local singularity in the signal and a more intense local variation in the signal.
Therefore, based on the above analysis, Δ α , α 0 and α m i n can be used as the feature quantities after extracting the multifractal property of harmonic signals.

3. Signal Acquisition and Analysis

3.1. Signal Acquisition

In this paper, the electromagnetic flow meter contaminated by power harmonics was taken as the study object and the fractal characteristics of power system harmonics were analyzed. The advantages of the new MFDFA algorithm in the harmonic analysis of the power system were studied.
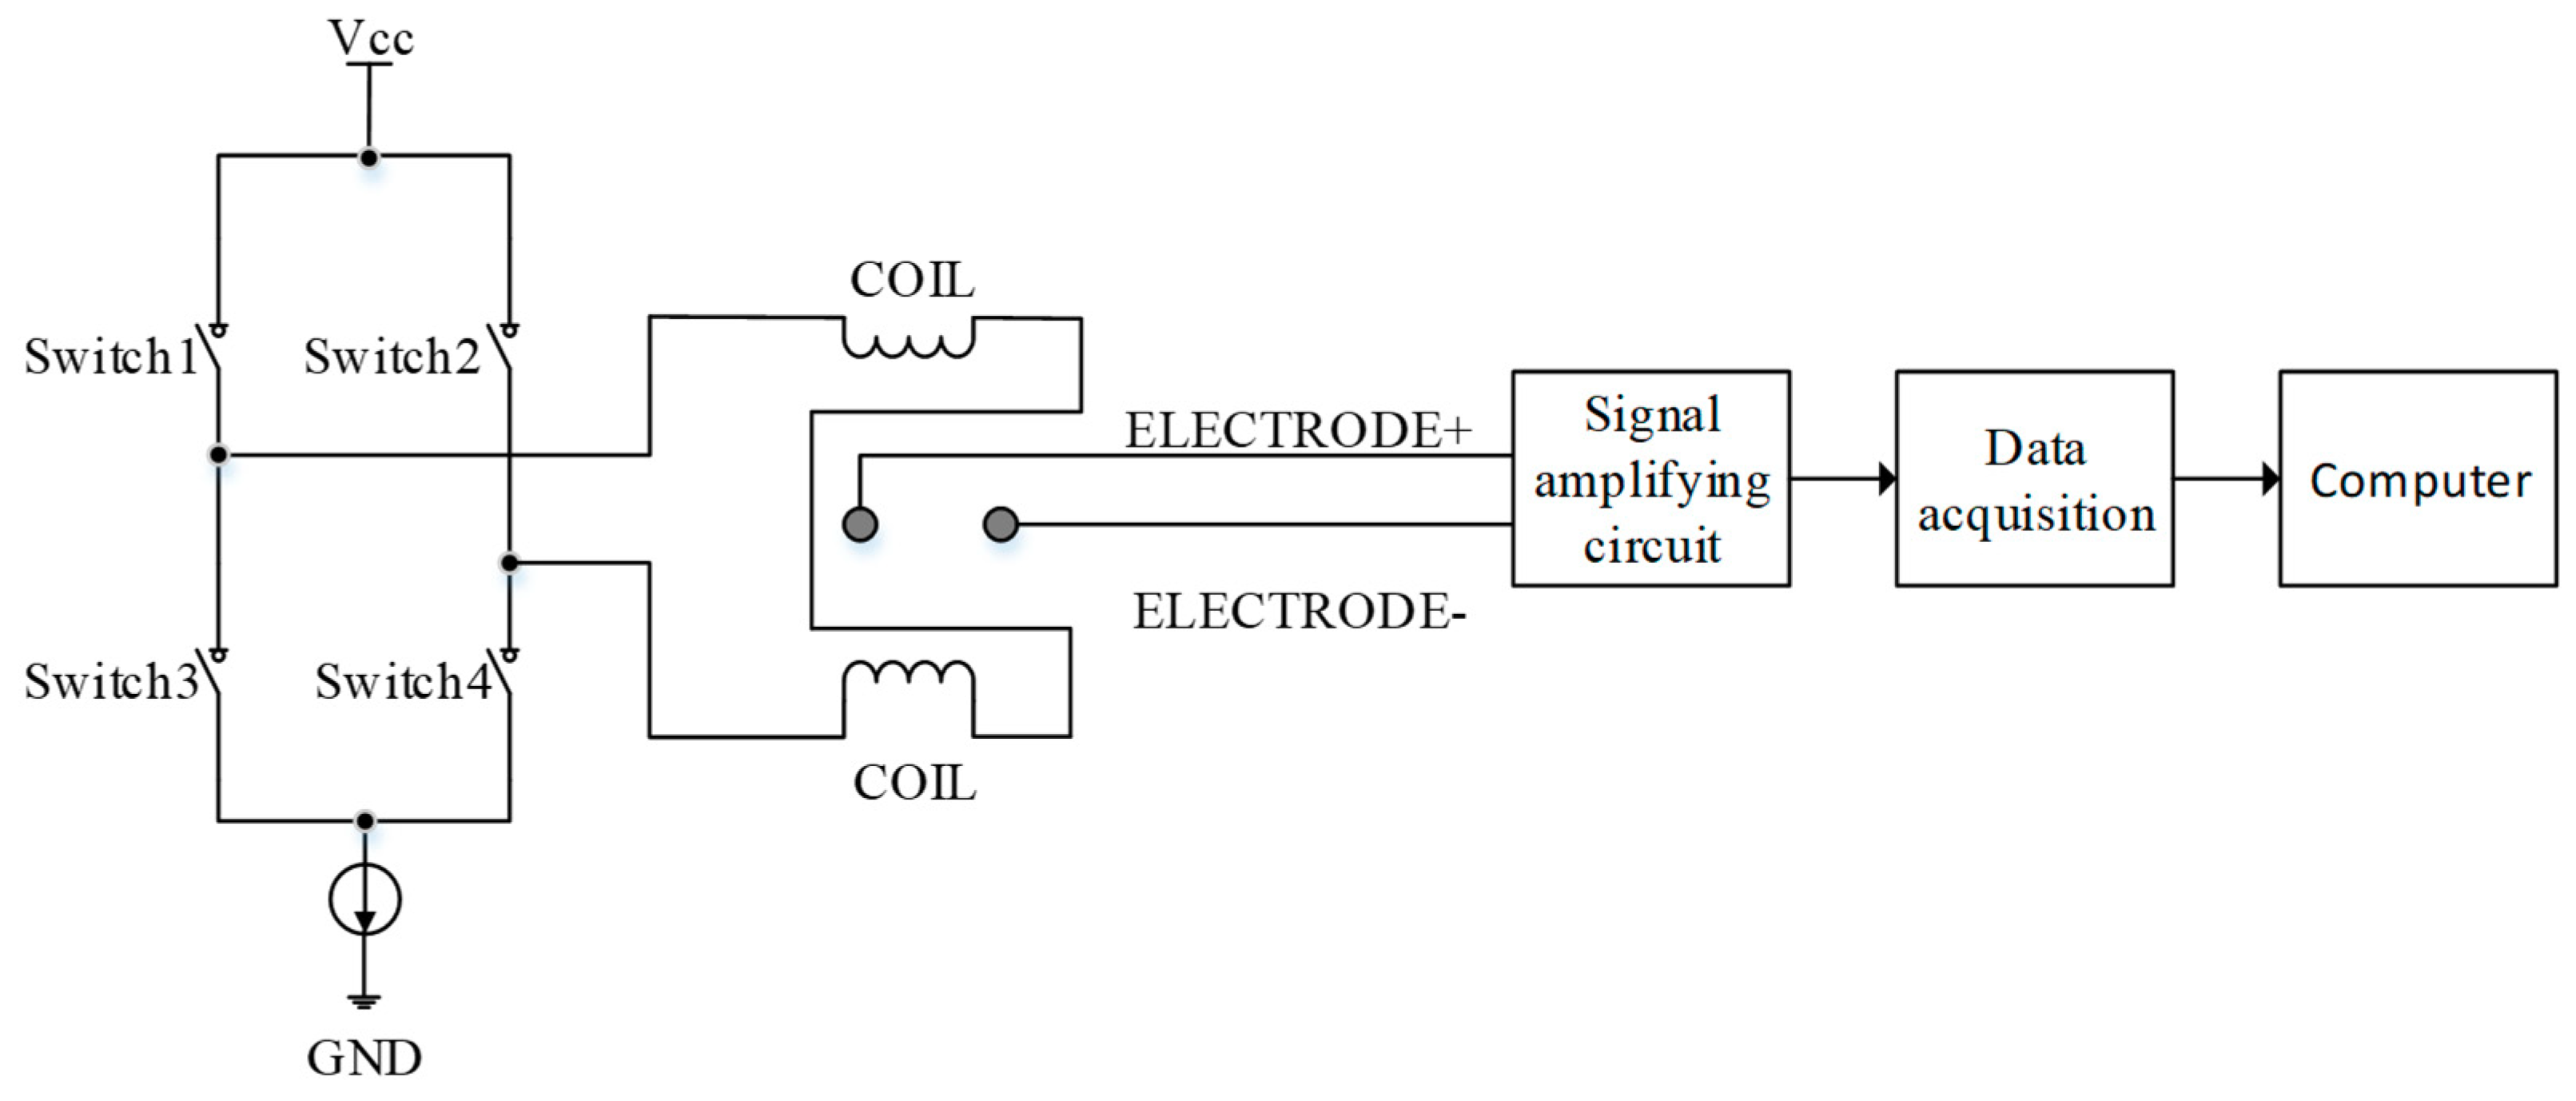
The electromagnetic flow meter adopted Faraday’s law of electromagnetic induction and the conductor moving in the magnetic field generated an induced voltage. As shown in Figure 2, in the acquisition system, an alternating magnetic field was generated on the coil by controlling Switch 1, Switch 2, Switch 3 and Switch 4. Furthermore, the voltage induced by the flowing liquid was connected to the signal amplifying circuit through ELECTRODE+ and ELECTRODE–. Finally, the amplified signal was sent to the computer through the signal acquisition system after the analysis. The system adopted a low-frequency rectangular wave excitation mode, with the excitation frequency at 6.25 Hz and the excitation current at 25 mA. It is important to note that the induced voltage between ELECTRODE+ and ELECTRODE– is extremely susceptible to interference from power system harmonics as its amplitude is generally in the range of tens of uV and several mV.
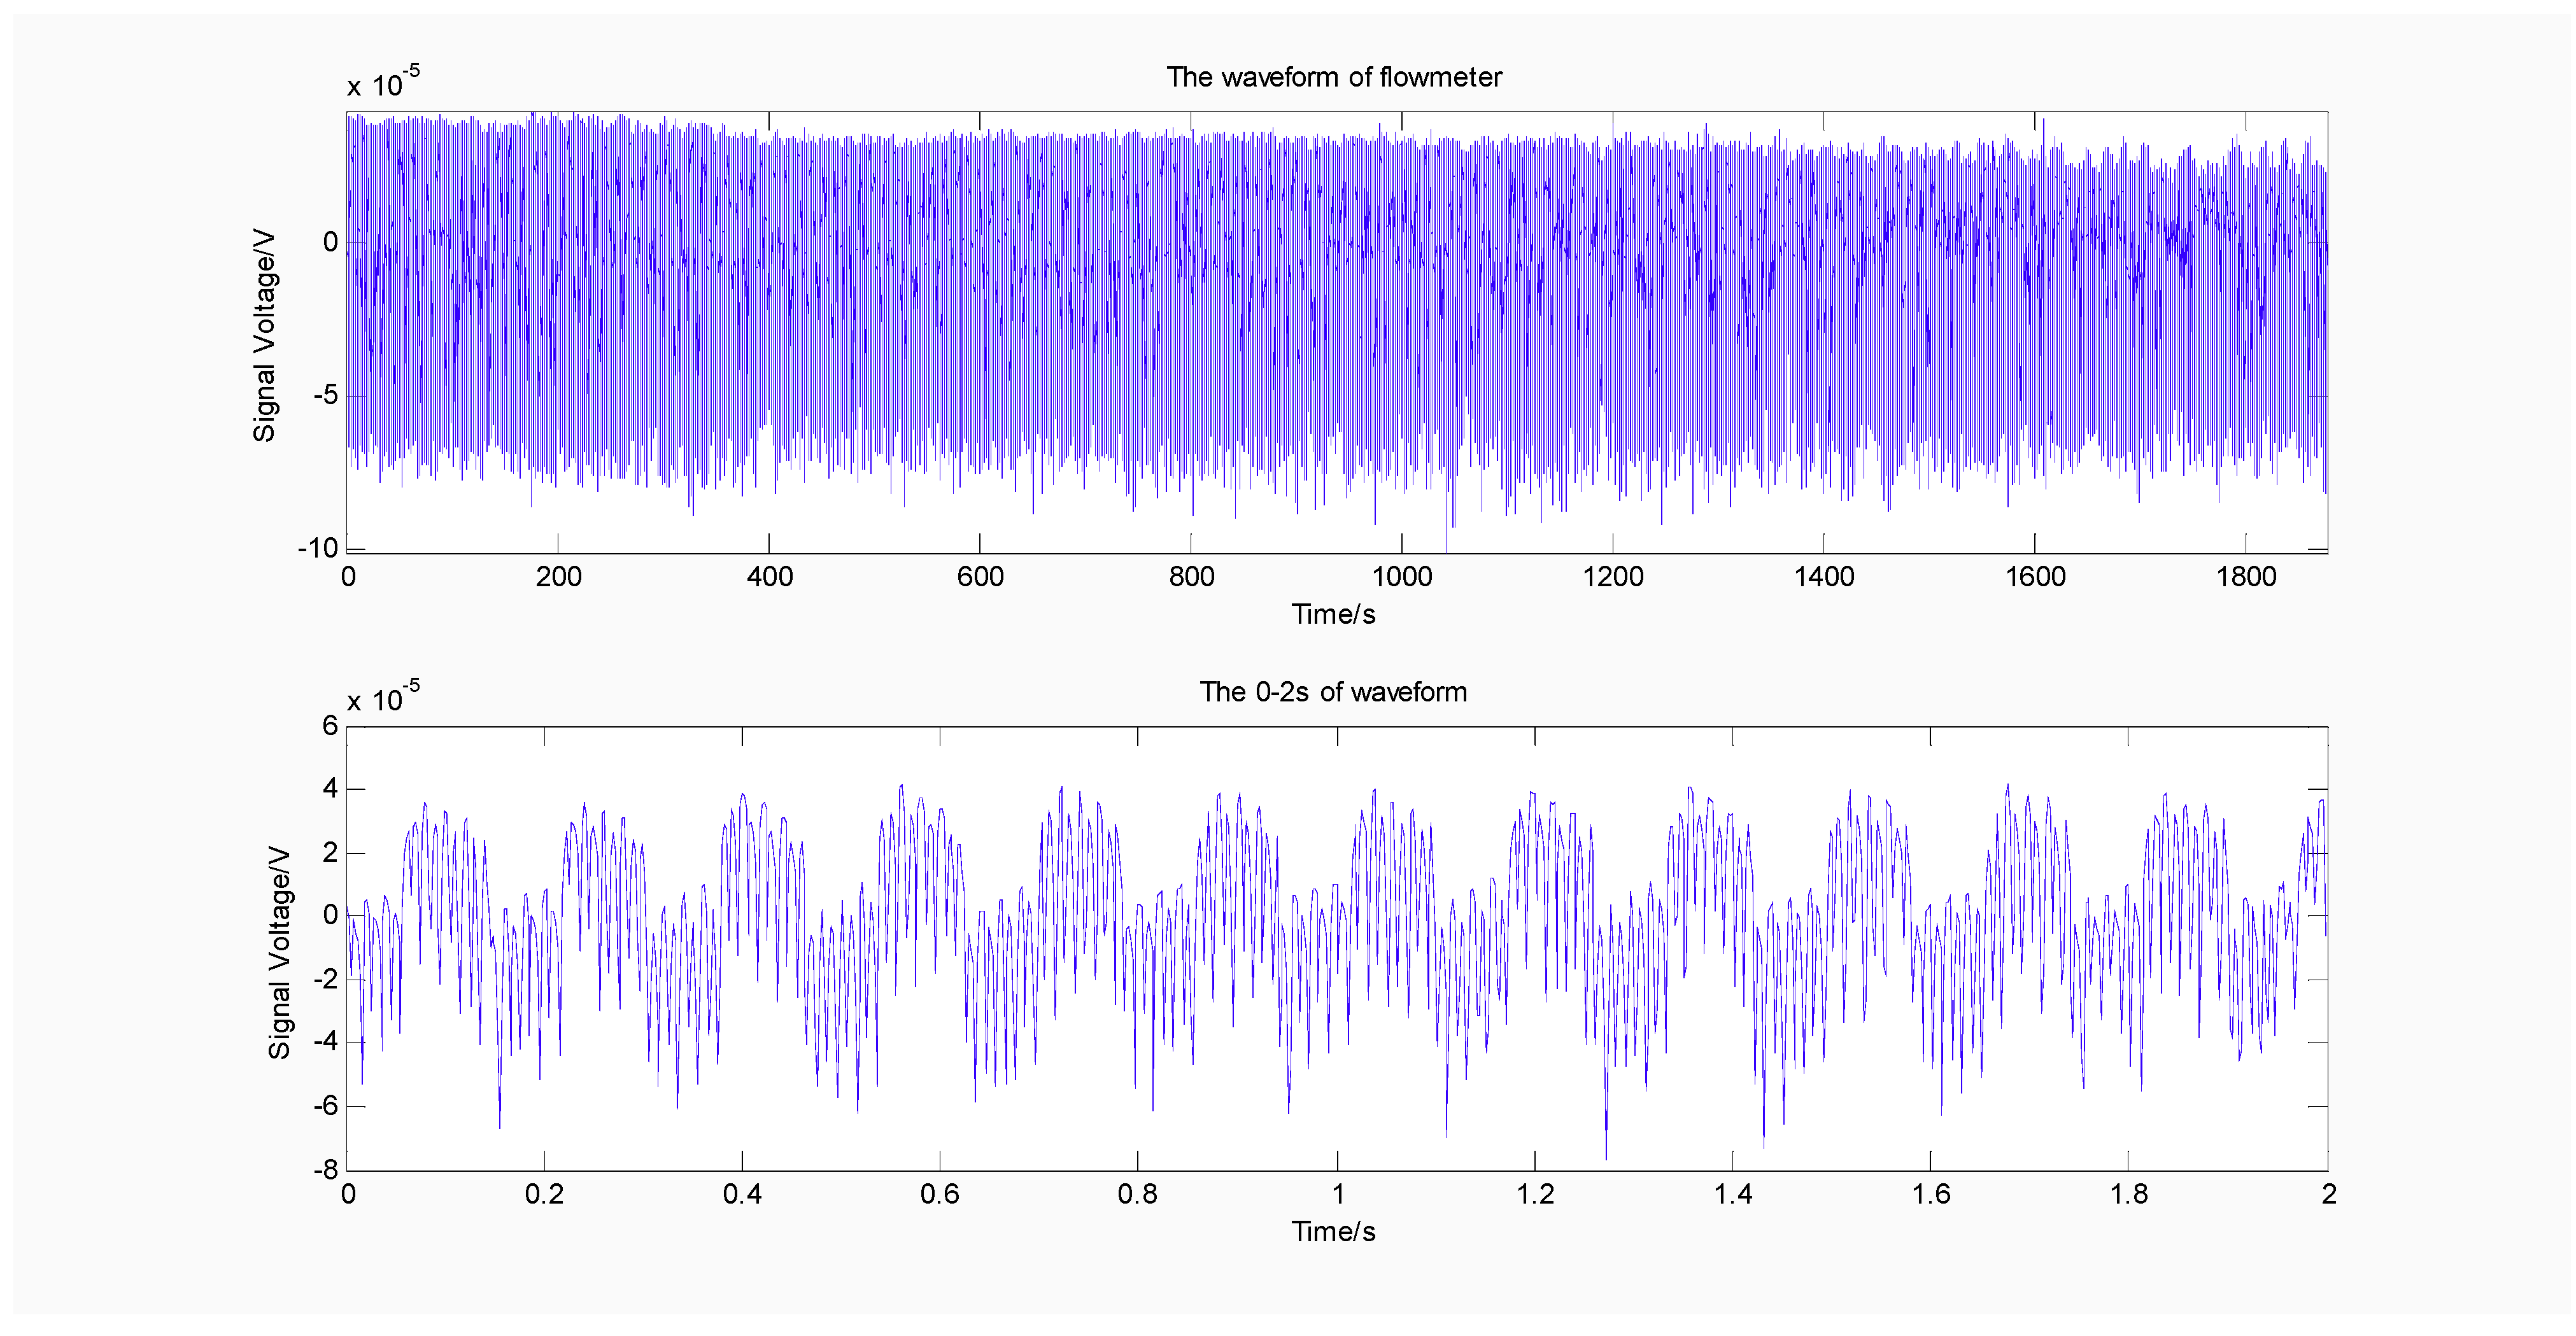
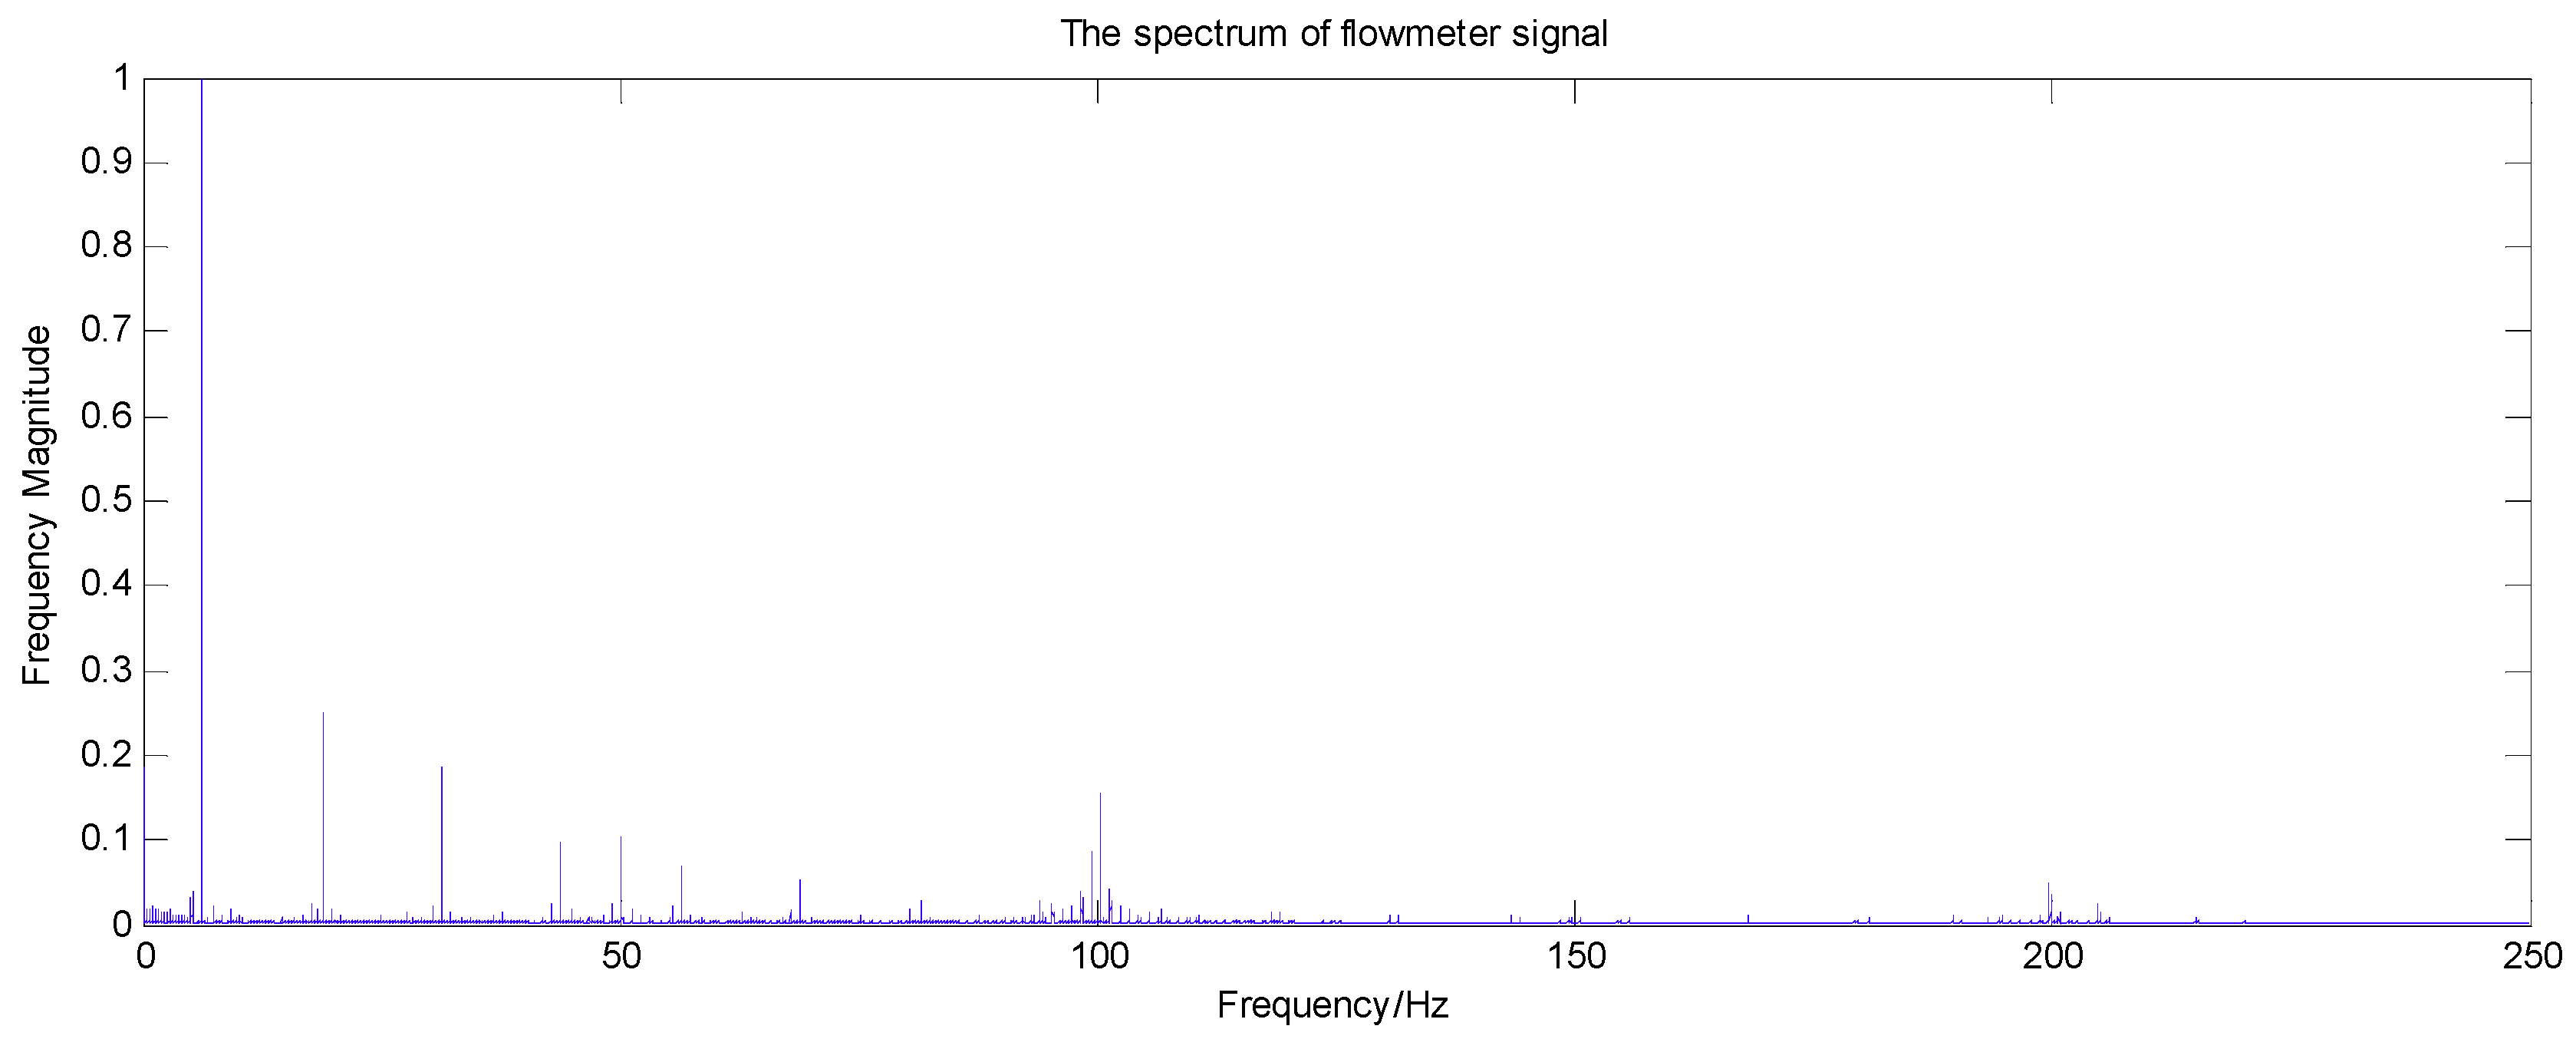
Figure 3 shows a waveform of the voltage after removing the DC offset signal between ELECTRODE+ and ELECTRODE–. The signal acquisition system adopted a sampling rate of 500 Hz, and the spectrum of the acquired signal was calculated and is presented in Figure 4. The spectrogram indicated that the signal contained obvious harmonic components. In addition to the fundamental component, the harmonic components were dominated by second-order (100 Hz) and fourth-order (200 Hz) harmonics.
The original signal in Figure 3 was decomposed by the Mallat algorithm [41,42,43] and the actual frequency decomposition layer p was:
p = l o g 2 ( f s 2 f 0 ) 1 ,
f 0 was selected as 6.25 Hz and f s was the sampling frequency of 500 Hz. The db24 wavelet was used to decompose the signal into 5 layers to obtain the high-frequency part of the original signal.
The total bandwidth of the signal was 250 Hz and the frequency band range is shown in Table 1. The approximate signal (a5–a1) c­onsisted of the low-frequency components of the signal and the detail signal (d5–d1) consisted of the high-frequency components of the signal.
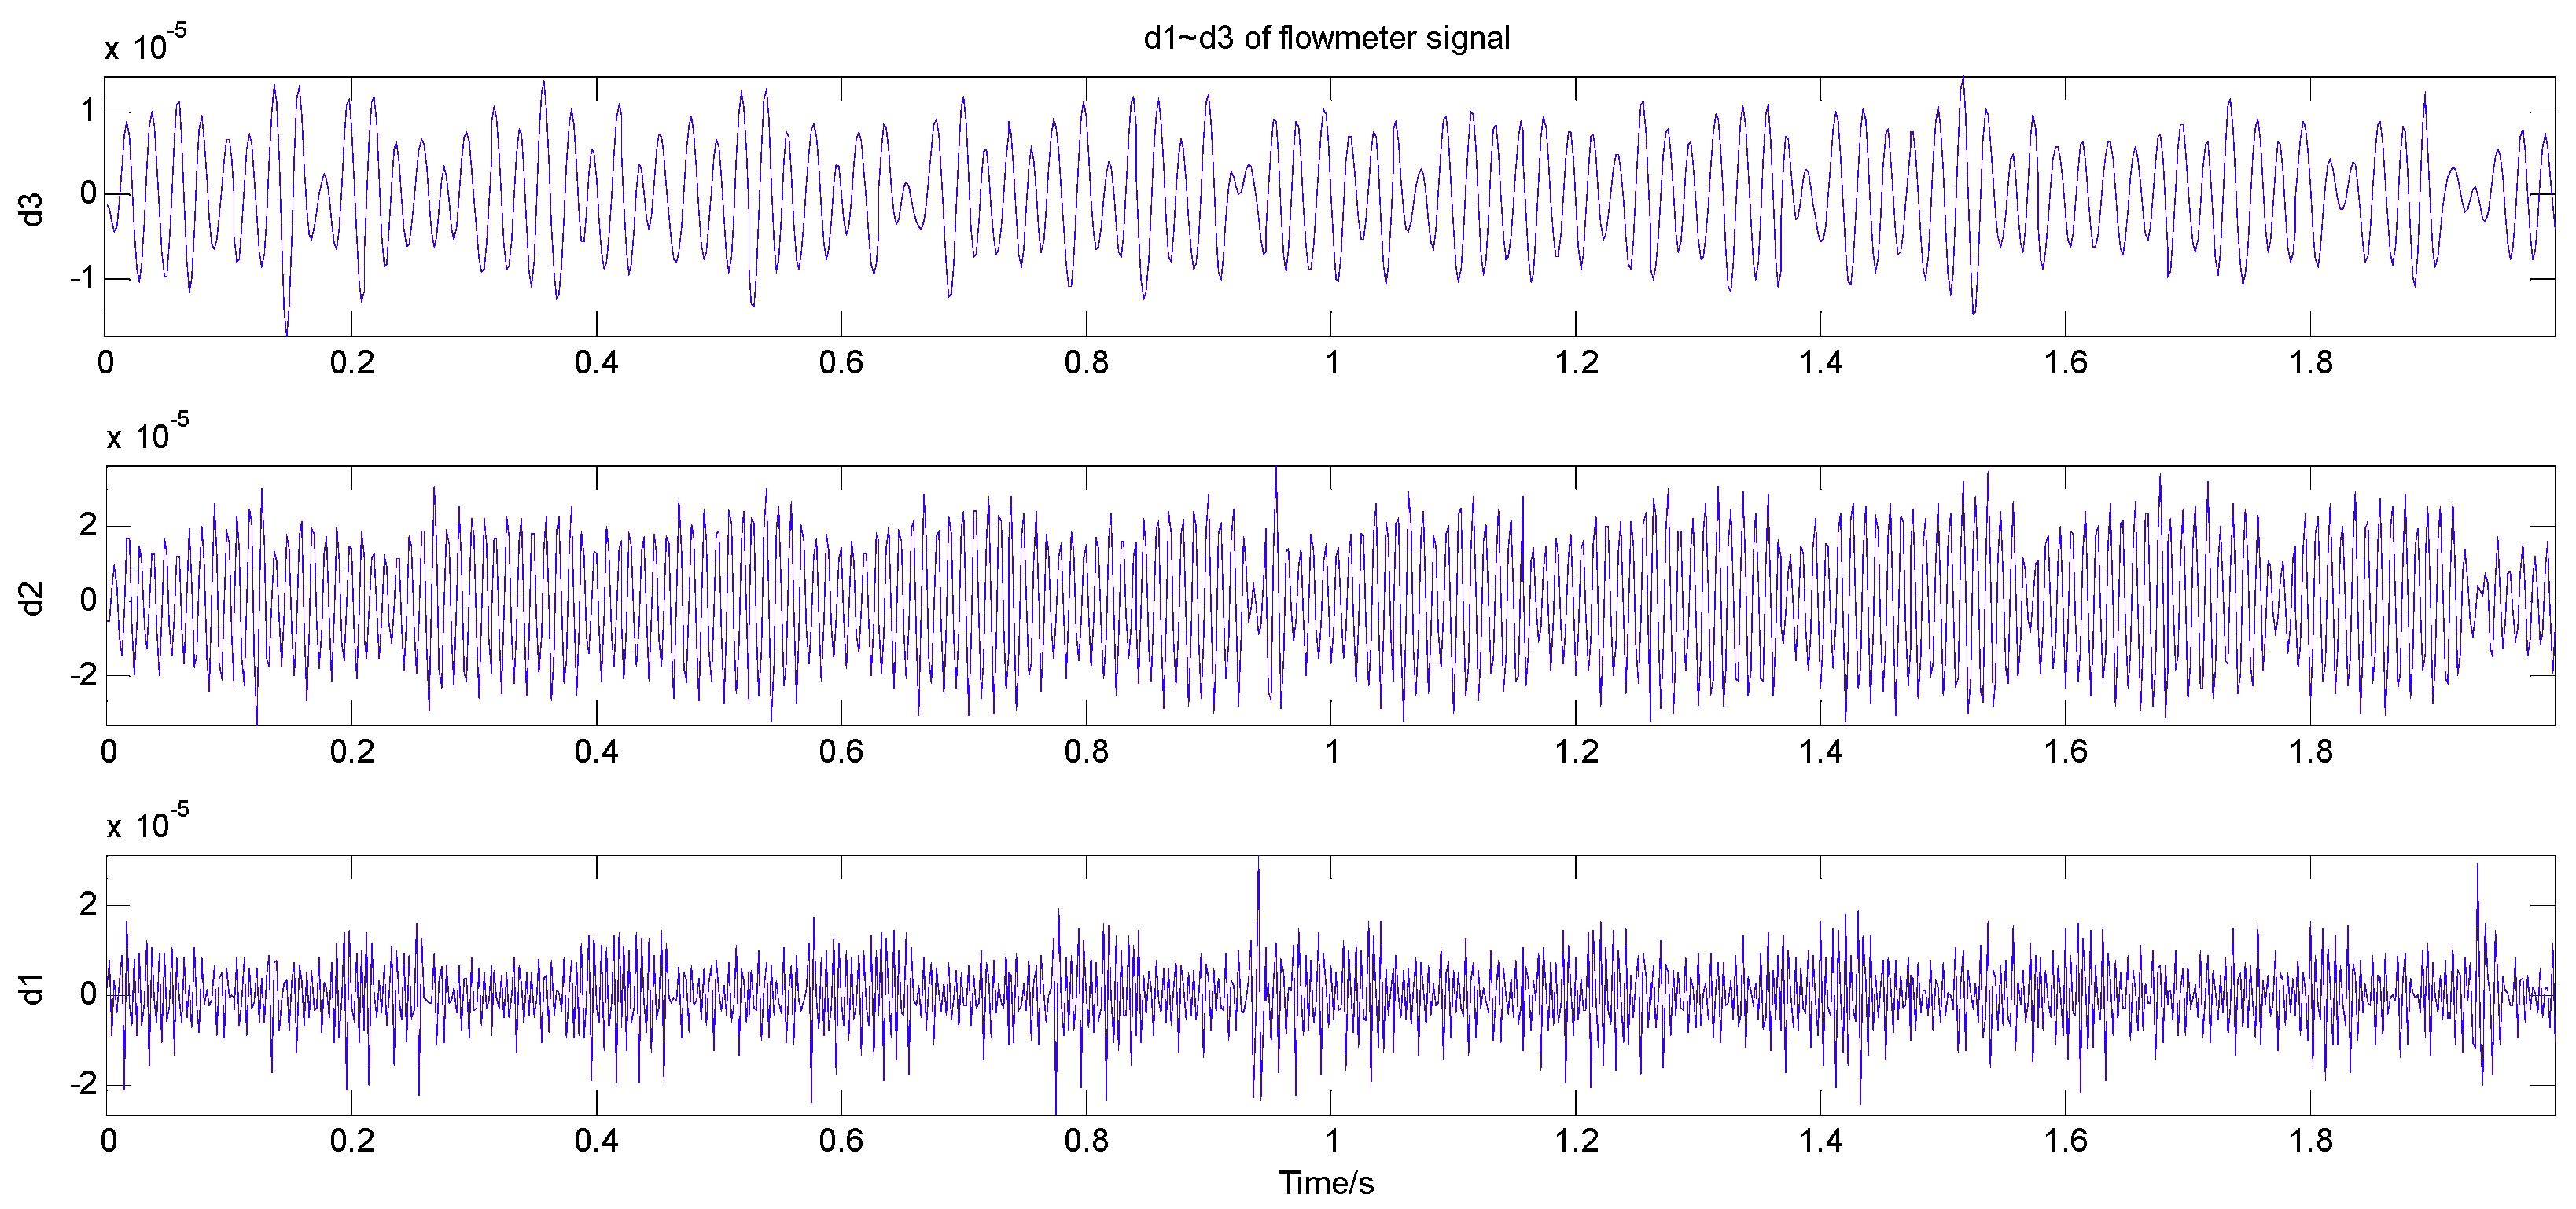
The decomposition coefficient d3 contained the fundamental wave, as shown in Table 1, the decomposition coefficient d2 contained second-order harmonics, the decomposition coefficient d1 contained fourth-order harmonics and the waveform of d3–d1 is shown in Figure 5.

3.2. Signal Analysis

Three components, d1, d2 and d3, were selected to calculate and analyze the local fractal characteristics by using the traditional MFDFA algorithm [44] and the proposed MFDFA algorithm.
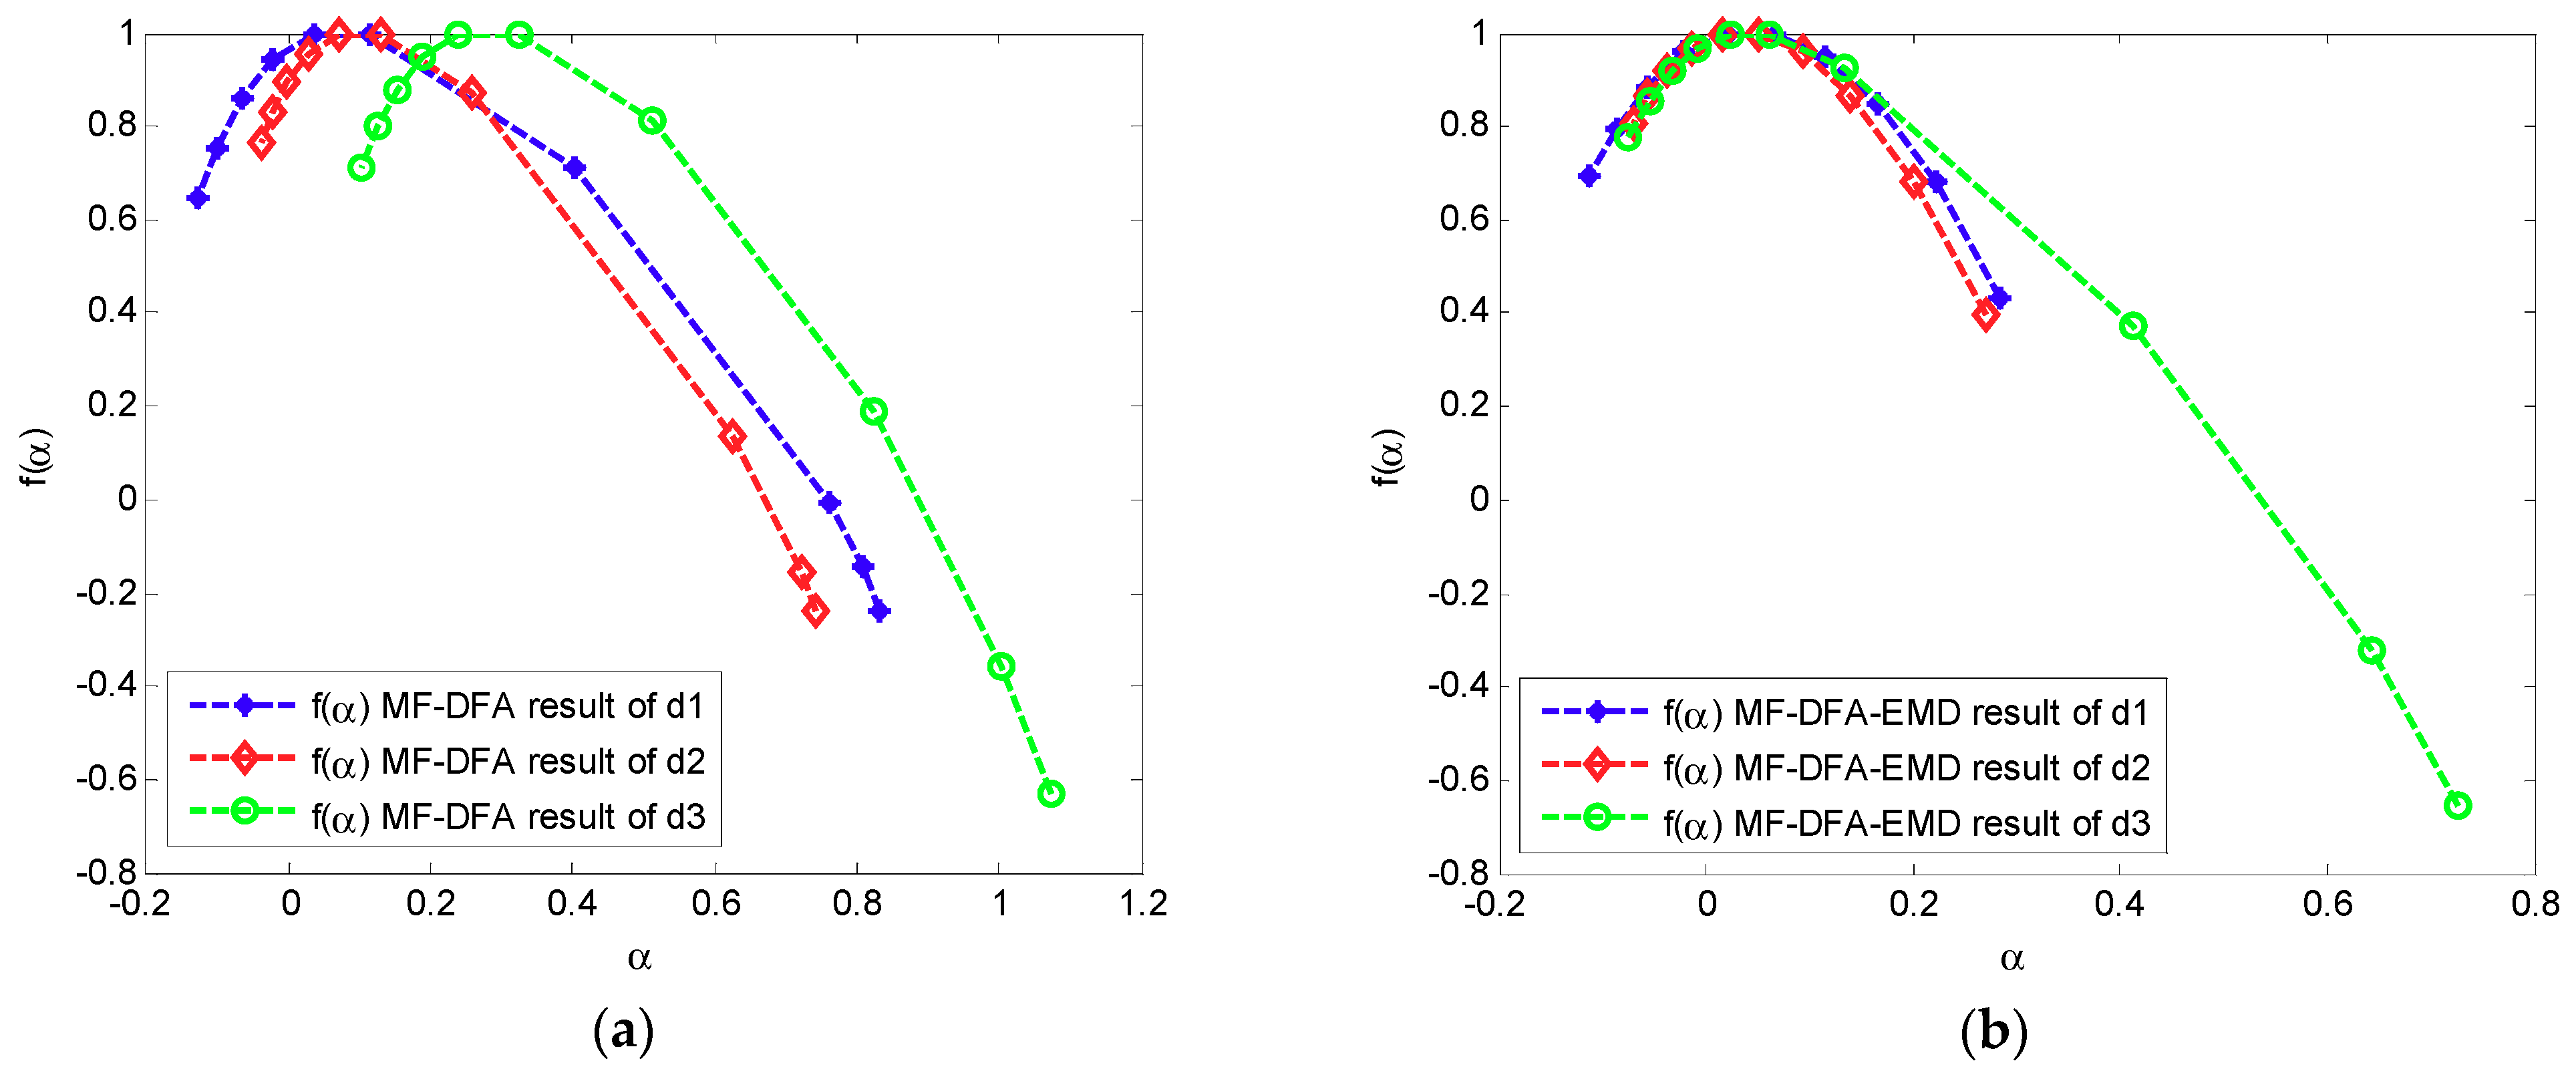
Figure 6a,b shows the multifractal spectrum of the three signal components after wavelet decomposition, using the traditional MFDFA algorithm and the new MFDFA algorithm. α and f ( α ) are single-peak bell-shaped graphs. The slope of the curve is obvious and the value of the singular index α is not unique. Therefore, all three signal components have typical multifractal characteristics.
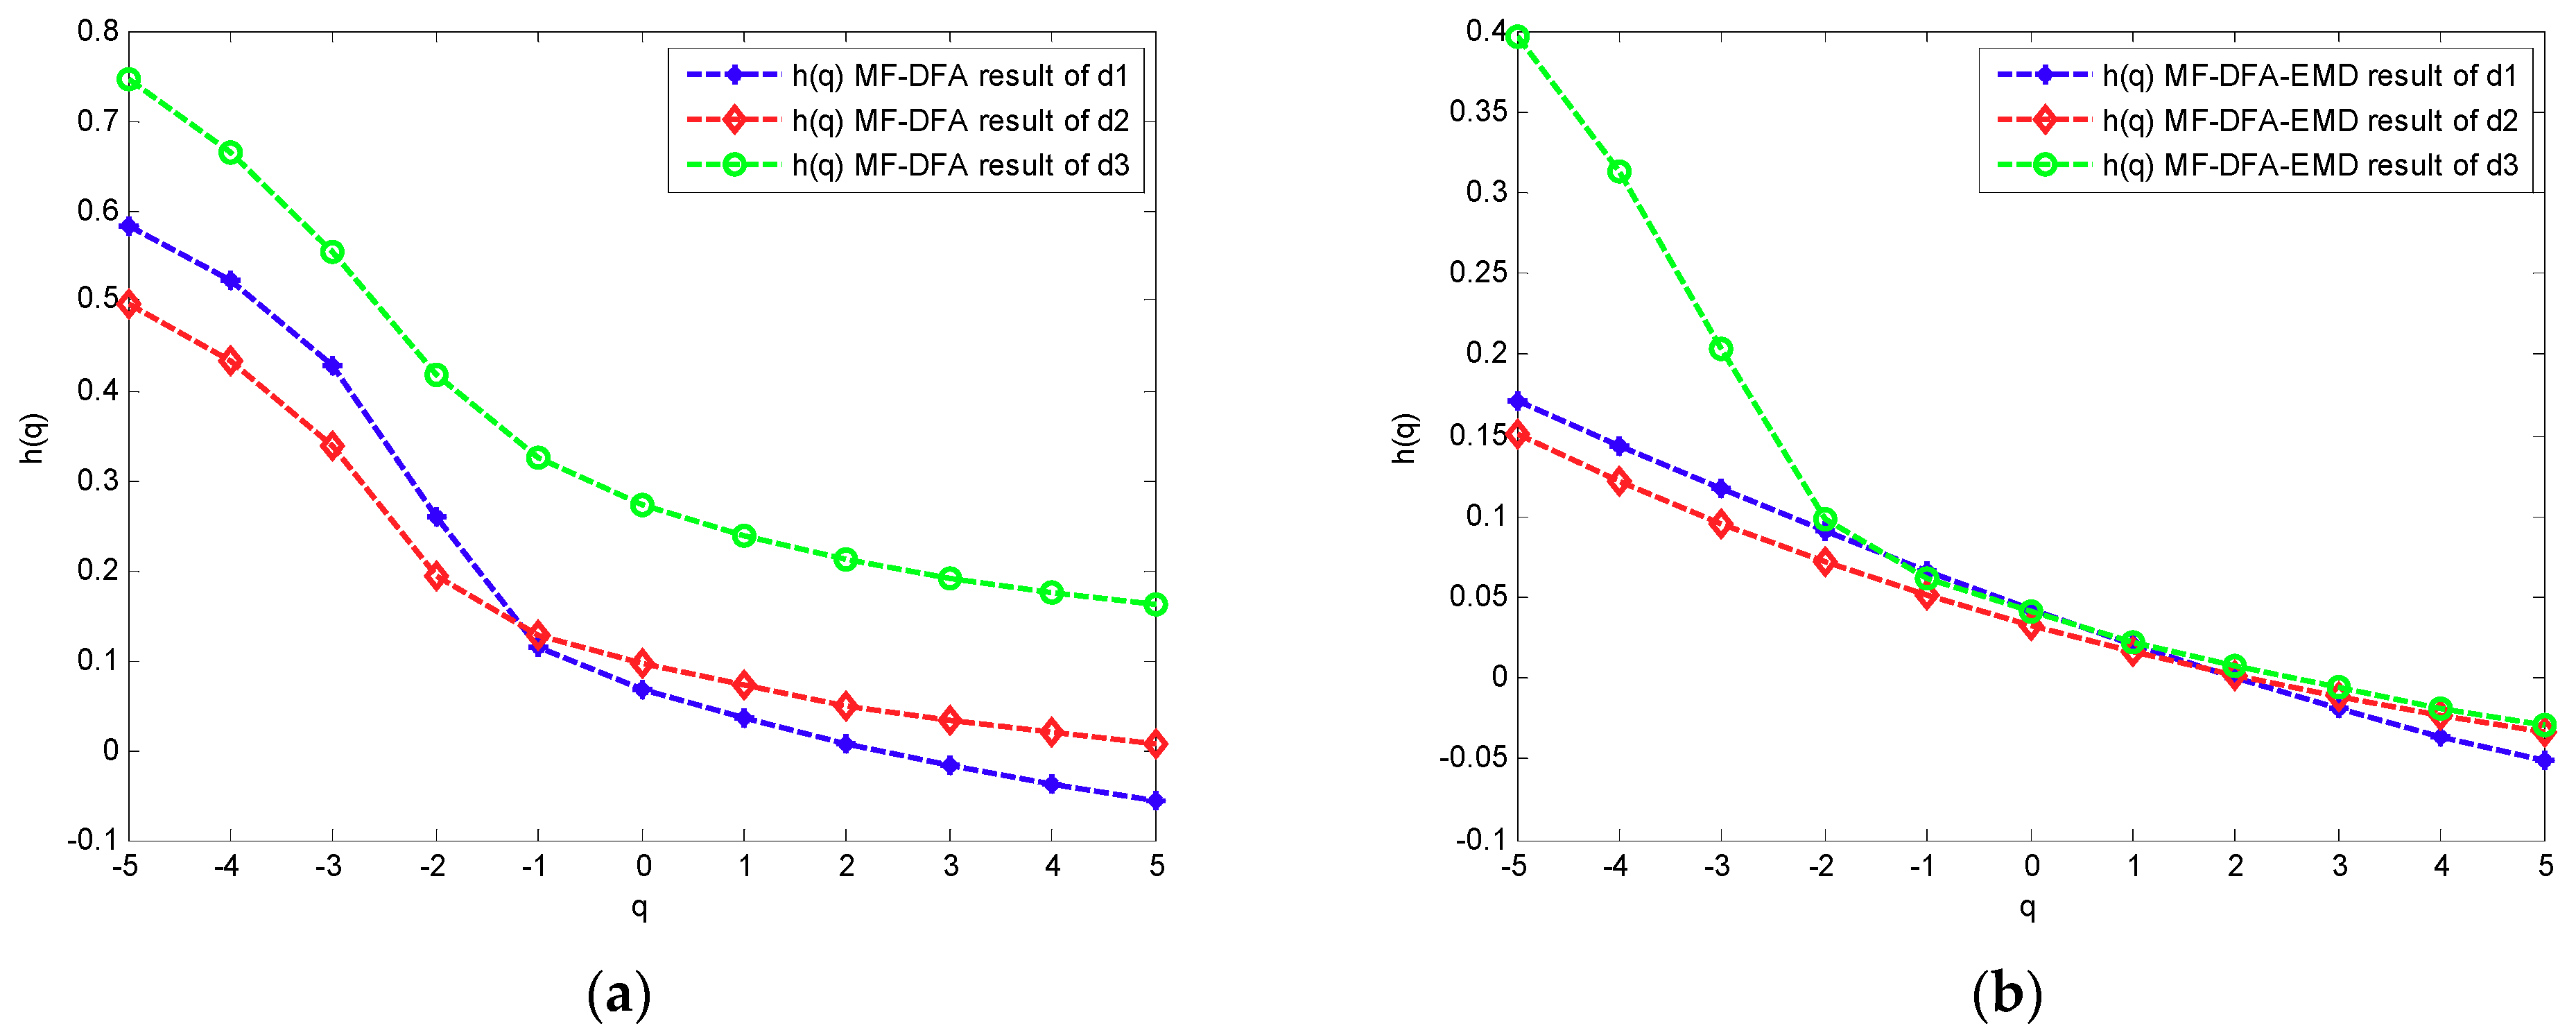
Figure 7a,b is the q h ( q ) curves of the three signal components, derived from the traditional MFDFA algorithm and new MFDFA algorithm, respectively. h ( q ) of the three signal components gradually decreased with an increase in q , as seen in in Figure 7, and the value of q varied with h ( q ) . In other words, q was related to h ( q ) . The local structure of the fundamental signal, both the second-order harmonic and fourth-order harmonic, were not uniform and therefore indicated the existence of obvious multifractal characteristics. From the comparison displayed in Figure 7a,b, the curve of the traditional MFDFA algorithm had obvious bumps and inflection points, and the curve using the new algorithm was smoother and more stable than the traditional algorithm. Moreover, the density of the three curves of the new algorithm was also much lower than that of the traditional algorithm. This indicated that the proposed algorithm reduced the pseudofluctuation error, caused by the discontinuity of the data segmentation and obtained a more stable fluctuation function.
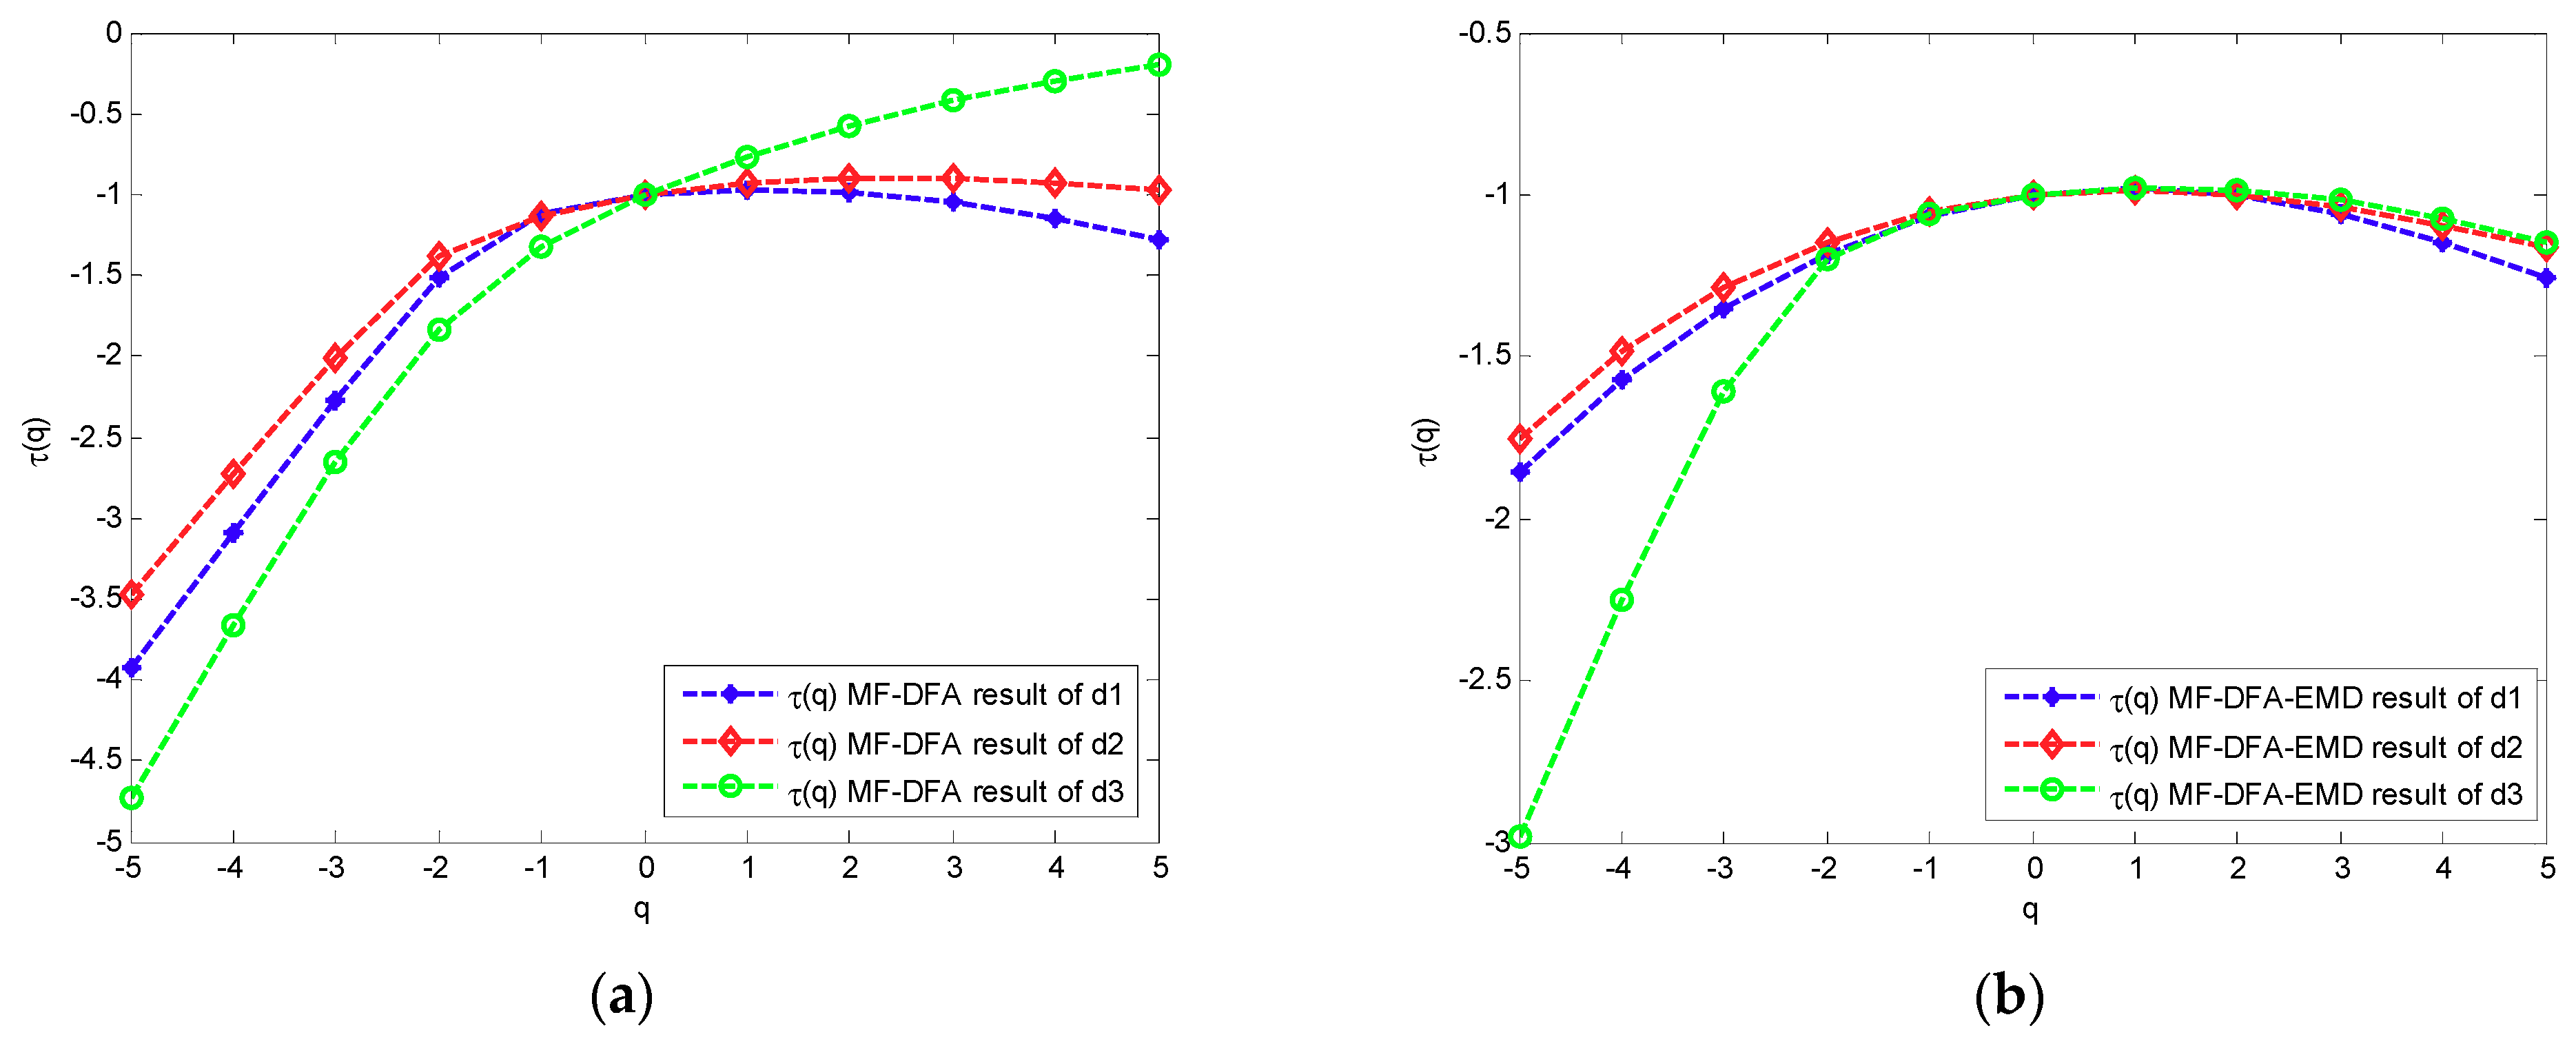
Figure 8a,b exhibits the q τ ( q ) curves of the three signal components, obtained using the conventional MFDFA algorithm and the new MFDFA algorithm, respectively. τ ( q ) is a curve where q and τ ( q ) have a nonlinear relationship. Furthermore, this was a convex-increasing function, which proved that the fundamental signal, the second-order harmonic and the fourth-order harmonic signals had multifractal characteristics. When q was greater than 0, the τ ( q ) values of the three components were more densely distributed. When q was less than 0, the τ ( q ) value distribution of the three signals was relatively sparse, and the τ ( q ) value of the high-frequency component d1 was lower than the τ ( q ) value of the high-frequency component d2. Furthermore, the τ ( q ) value of the low-frequency component d3 signal was the largest. From comparing Figure 8a,b, we can see that the q τ ( q ) curve of the new algorithm was smoother than the traditional algorithm, which verified the superiority of the new algorithm.
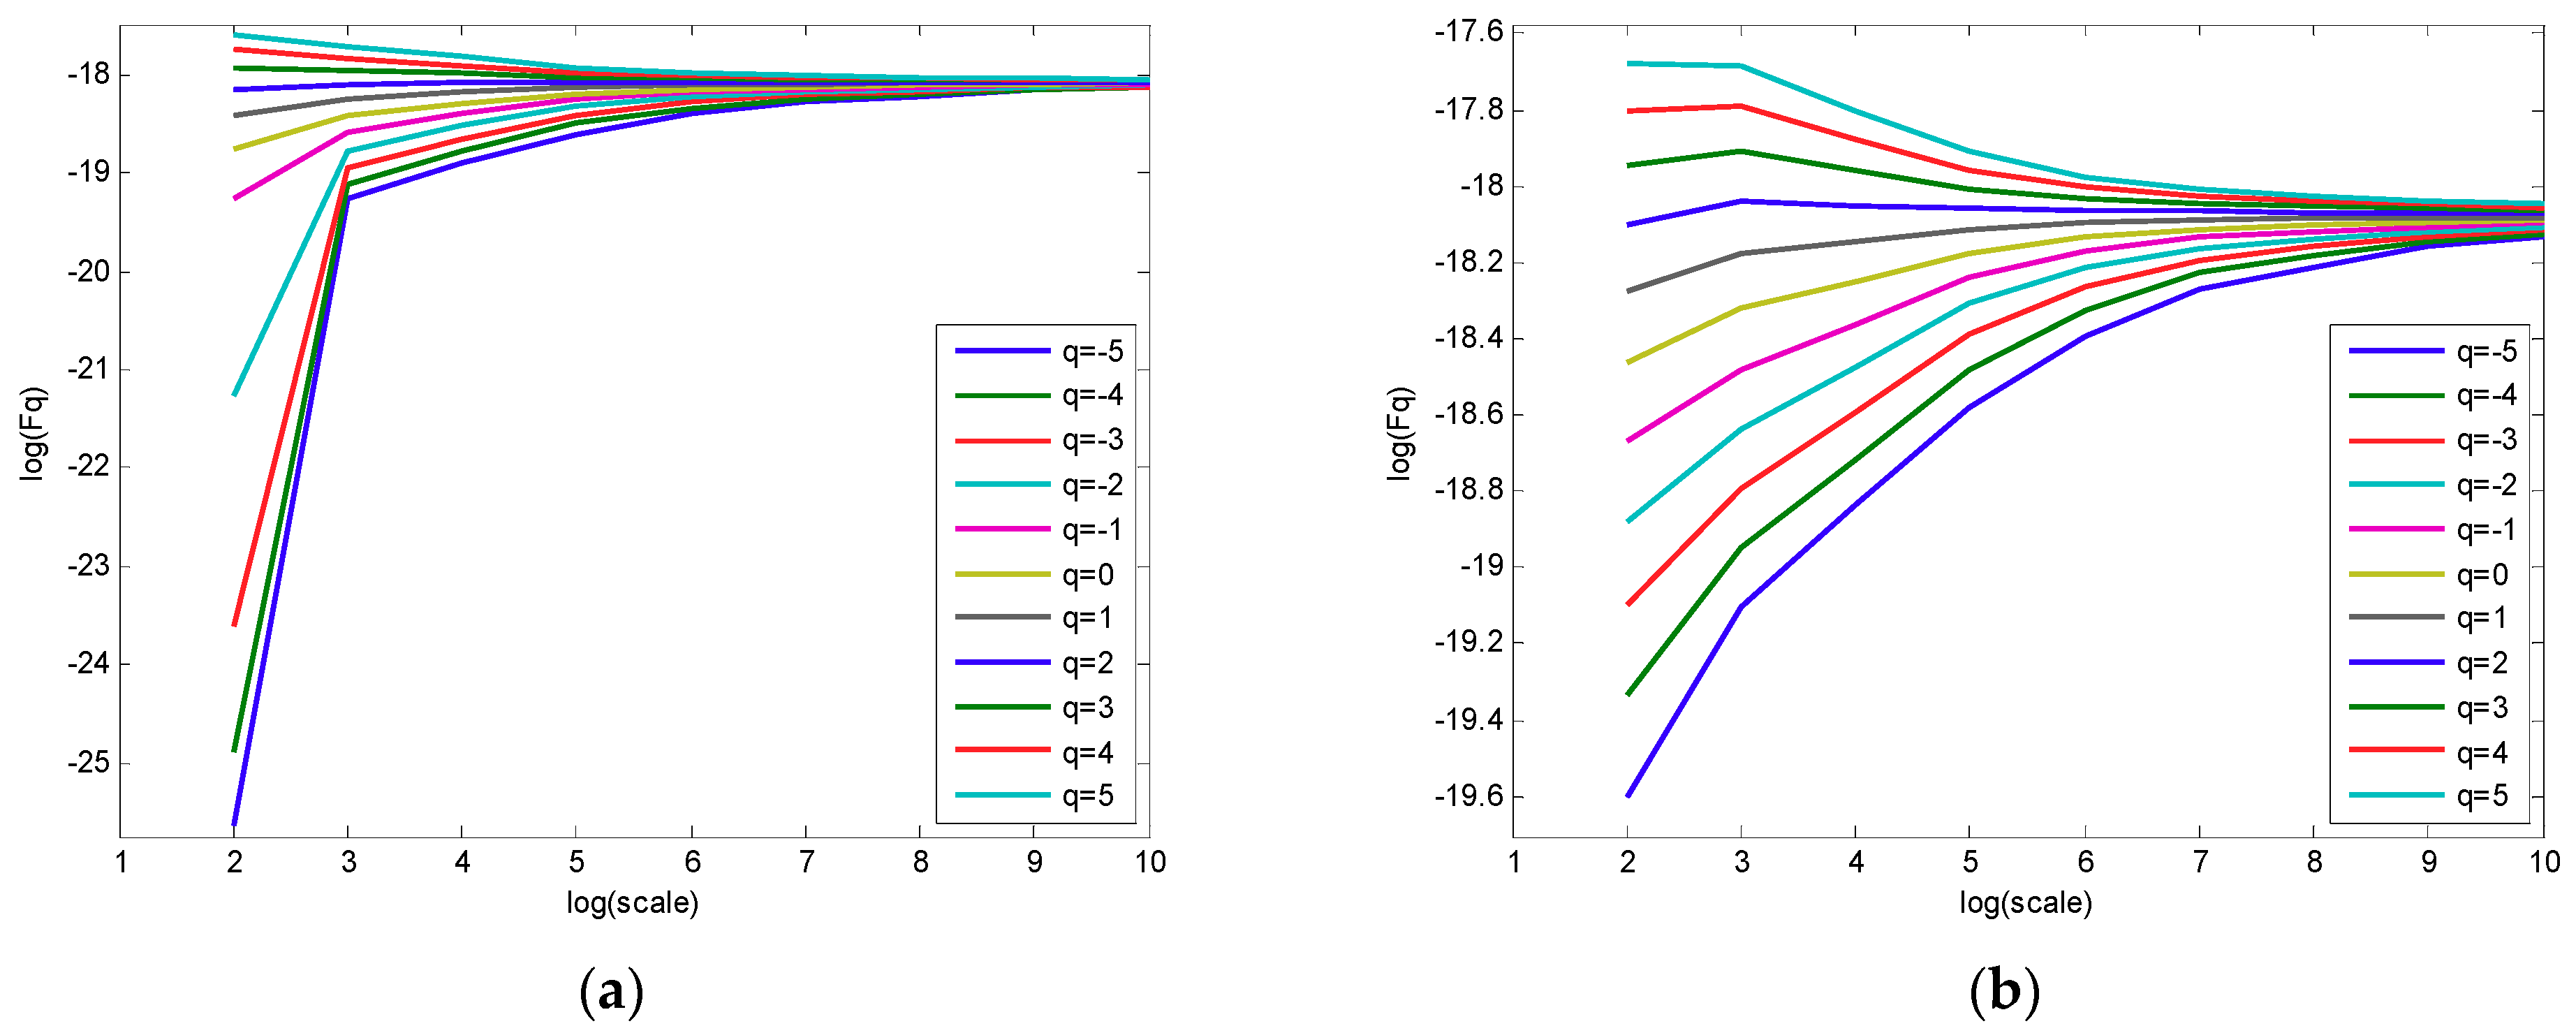
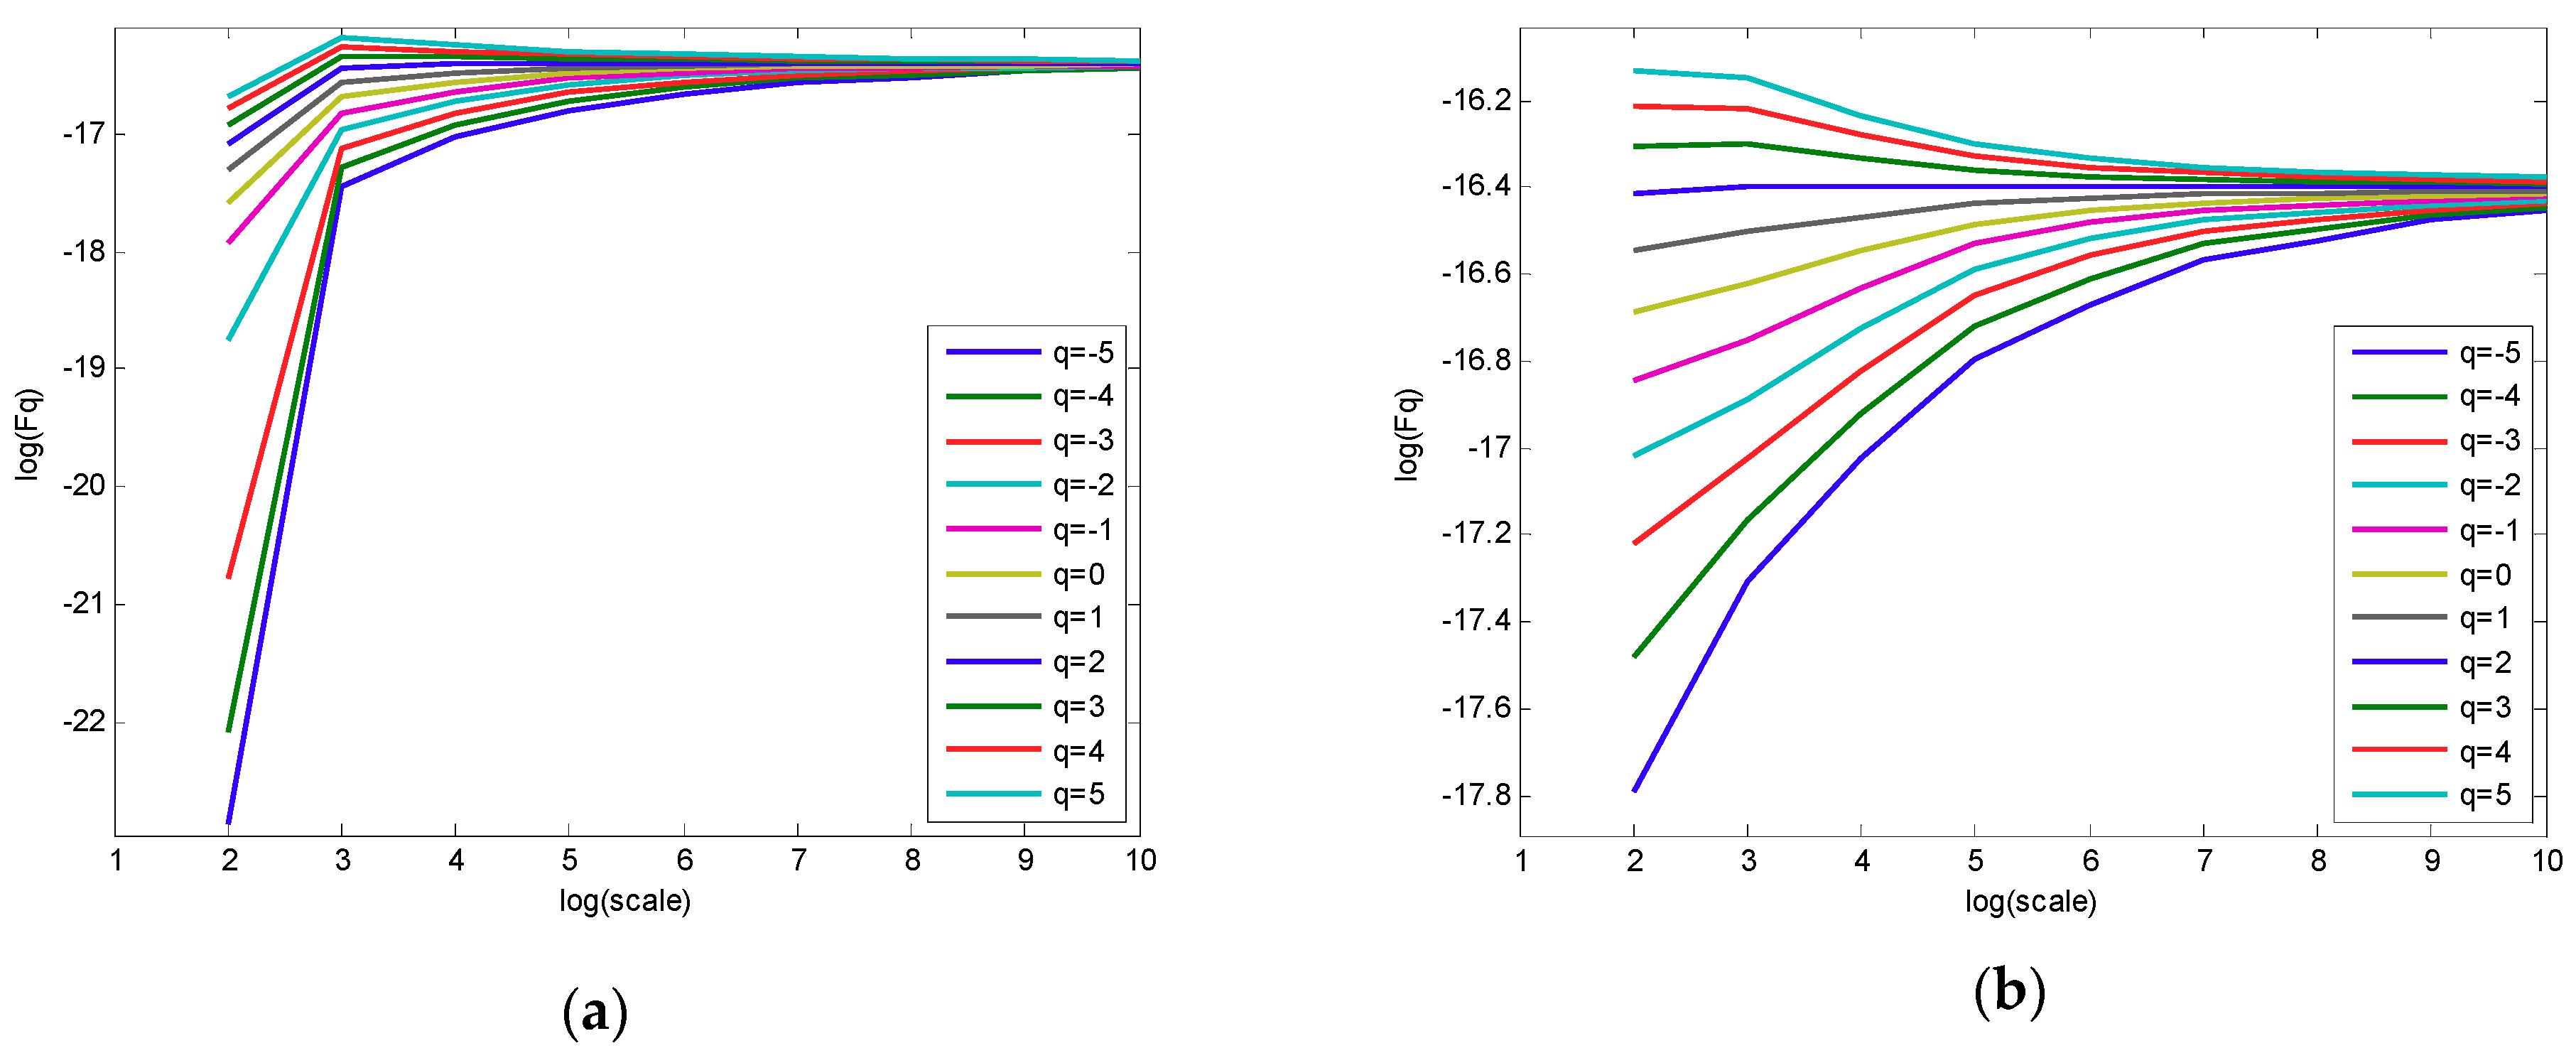
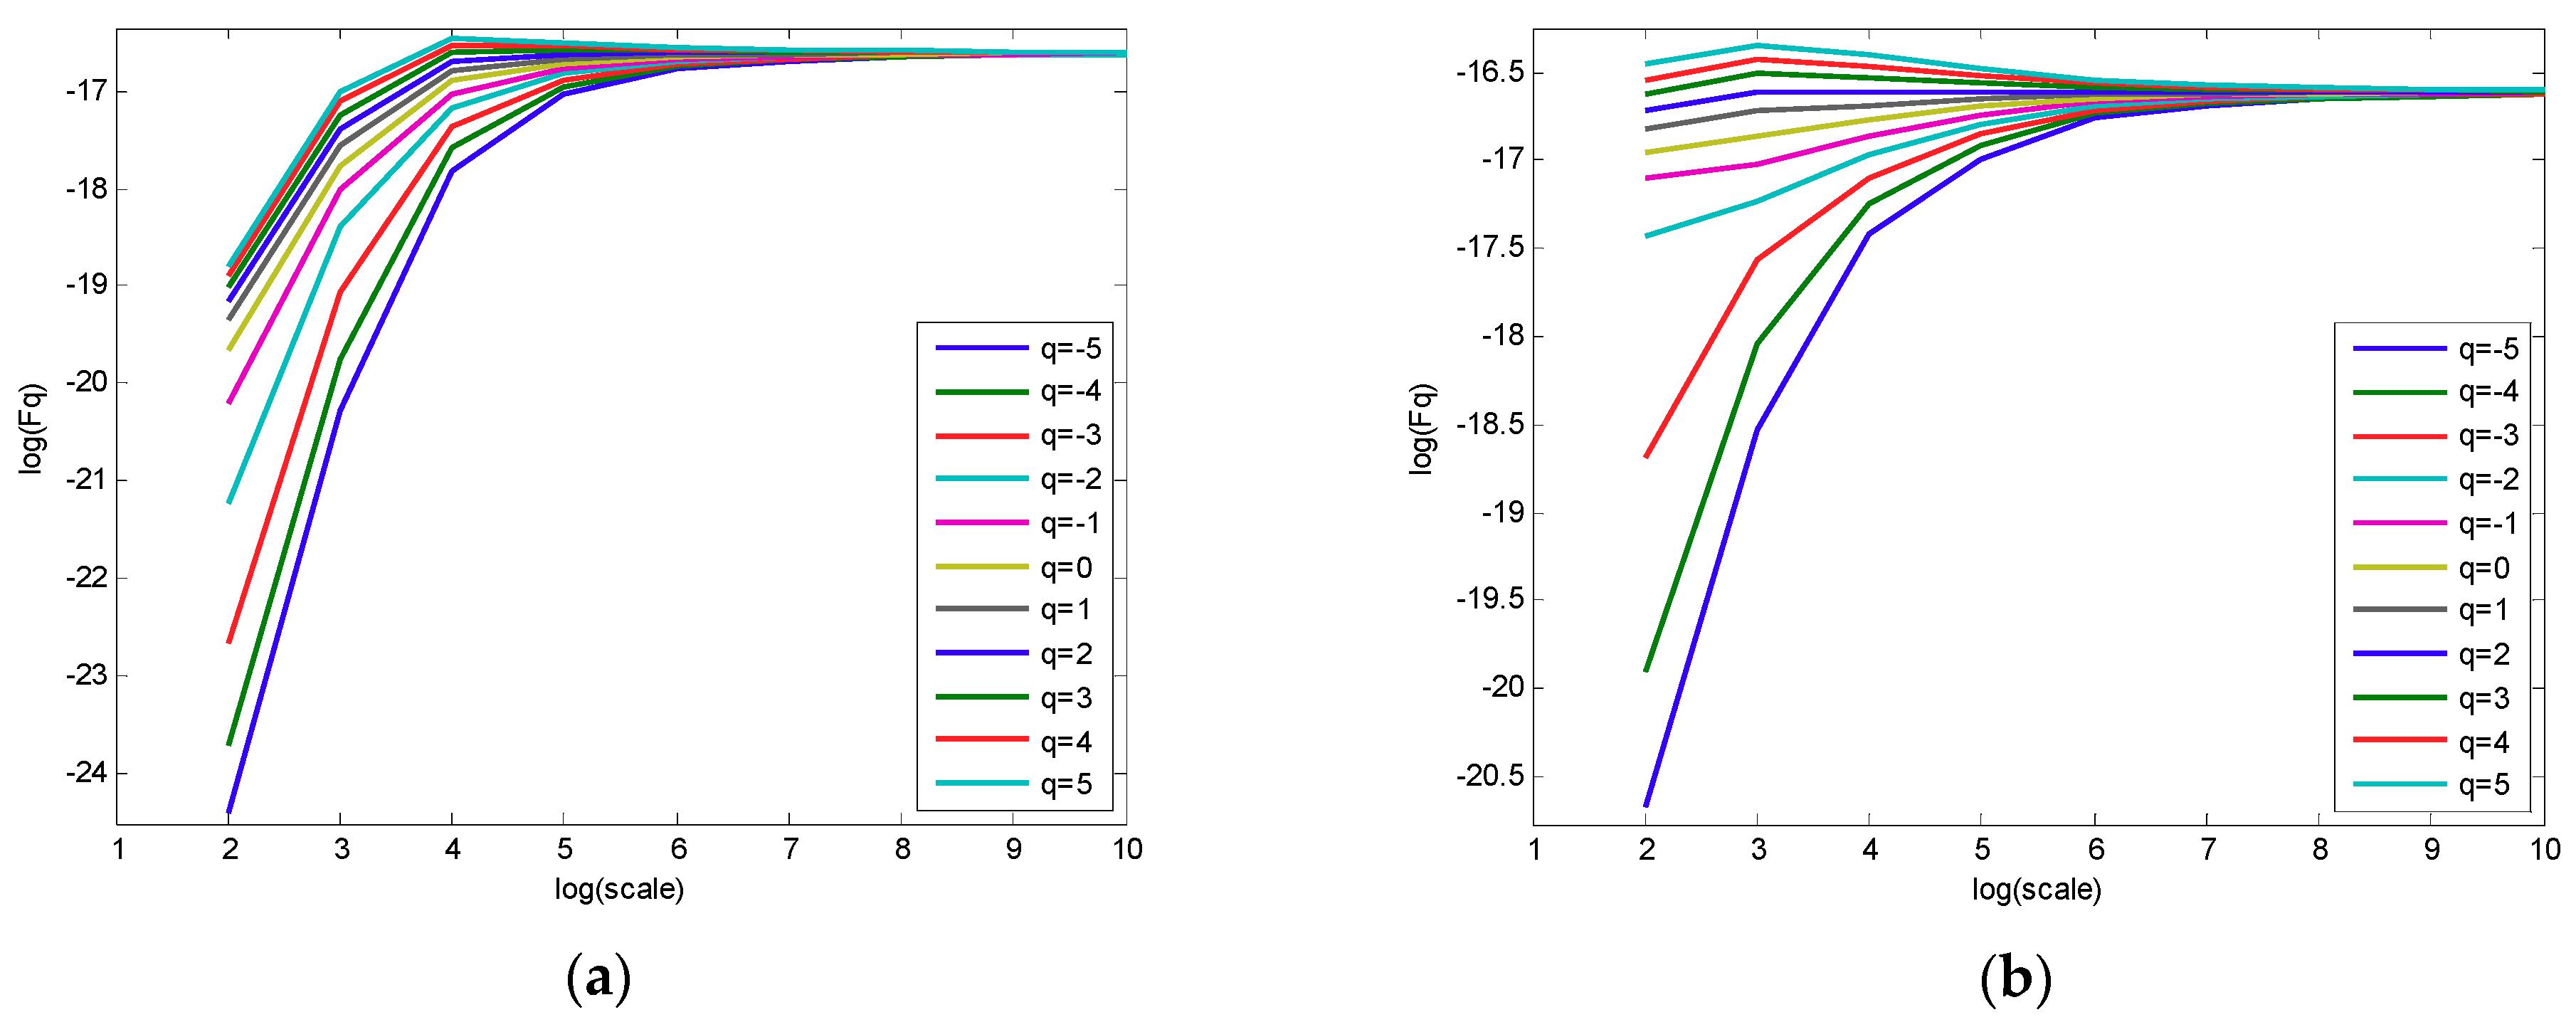
The fluctuation function was calculated according to the q values of different fluctuation orders, where q ranged from −5 to 5 and different q values were calculated to obtain different l o g F q ( s ) l o g ( s ) scatter plots. All l o g F q ( s ) l o g ( s ) calculated at all q values are plotted on Figure 9, Figure 10 and Figure 11. Figure 9a with Figure 9b, Figure 10a with Figure 10b and Figure 11a with Figure 11b are l o g F q ( s ) l o g ( s ) , double logarithmic graphs corresponding to different q -valued harmonic signal components obtained by the traditional MFDFA algorithm and the novel MFDFA algorithm, respectively.
In Figure 9, Figure 10 and Figure 11, the fluctuation function F q ( s ) that was obtained by the two algorithms, changes with the scale s , which indicated that the signal had multifractal characteristics. Using the traditional MFDFA algorithm and the new MFDFA algorithm to analyze each harmonic component, the extracted multifractal characteristics parameters Δ α , α 0 and α m i n are listed in Table 2.
In Table 2, the Δ α value of d2 is the smallest and the Δ α value of d3 is the largest. This represents that the singular exponential distribution range of the second-order harmonic component was the narrowest and the singular exponential distribution range of d1 was wider than that of d3. It shows that the fractal distribution of the second-order harmonic component signal was better than that of the fundamental signal and the fourth-order harmonic. The fourth-order harmonic showed better uniformity than the fundamental signal. Compared with the second-order harmonic, the fundamental wave of the fourth-order harmonic had more obvious multifractal features and the fluctuations were more obvious with scale changes. The α m i n of d1 is the smallest, indicating that the harmonic signal with the highest frequency had the strongest local fluctuation. It was known that the multifractal intensity of the fundamental signal was the largest and the signal distribution is relatively uniform. The multifractal intensity of the fourth-order harmonic signal was larger than that of the second-order harmonic and the signal distribution was the most uneven. These features can be well reflected in Figure 5.
Compared with the traditional MFDFA method, the characteristic extraction parameter values obtained by the new MFDFA method showed a significant decreasing trend. The multifractal spectrum curve distribution was narrowed in the new method, indicating that the new algorithm can reduce the error in the multifractal-characteristics analysis of harmonic signals and thus, make the curve fitting more stable.
The h ( q ) values obtained by analyzing the harmonic components using traditional MFDFA and the new MFDFA are presented in Table 3.
The h ( q ) values corresponding to all q values in the Table 3 were less than 0.5 for the new MFDFA algorithm, which indicated that the low-frequency harmonic signal component and the high-frequency harmonic signal component were anticorrelated. The Δ h of d2 was the smallest and the Δ h value of d3 was the largest. Thus, if Δ h is larger, the multifractal is stronger, which resulted in the multifractal degree of the d2 component being the smallest and the multifractal degree of the fundamental signal being the strongest. Comparing the Δ h values obtained by the traditional MFDFA algorithm and the new algorithm, the results obtained by the new MFDFA algorithm were significantly smaller than the traditional algorithms, which indicated that the new algorithm could reduce the pseudofluctuation error and had higher precision than the traditional algorithm. The new MFDFA could more accurately characterize the multifractal features of the signal.
By using the characteristics of multifractal, the h(q) value distribution of different signals can be calculated under the condition of a fixed range of q values to measure the irregularity of multifractal in different frequency harmonic signals.

4. Conclusions

By using the new MFDFA algorithm proposed in this paper to analyze the multifractal characteristics of harmonic signals, the following conclusions are drawn:
  • The power grid harmonic signals in the flow meter signal exhibit multifractal characteristics. Furthermore, the multifractal intensity of the fundamental signal is the largest and the multifractal intensity of the higher-order harmonic is larger than that of the lower harmonic.
  • Compared with the traditional MFDFA algorithm, the new algorithm can effectively reduce the pseudofluctuation error caused by the discontinuity of the traditional algorithm, making the fitting curve more stable and more accurately revealing the multifractal characteristics of harmonic signals.
  • Δ α , α 0 , α min and h ( q ) can provide theoretical and algorithmic support for grid harmonic management.
  • Although the algorithm shows good performance in the multifractal-characteristics analysis of harmonic signals, the new algorithm is mainly for integer subharmonics. Using the algorithm for analyzing noninteger harmonics still remains an interesting issue that needs to be studied.

Author Contributions

Data curation, J.L. and M.Z.; formal analysis, X.M.; investigation, J.L.; methodology, X.C.; Project administration, X.C.; software, J.L.; validation, J.L. and M.Z.; writing—original draft, J.L.

Funding

The work was supported by the National Natural Science Foundation of China (No.61503224), Shandong Natural Science Foundation of China (No.ZR2017MF048), the Graduate Education Quality Improvement Plan Construction of Shandong Province of China under Grant (No.2016050), Qingdao Minsheng science and technology plan project (No.17-3-3-88-nsh), Shandong University of Science and Technology Postgraduate Innovation Program (SDKDYC180232).

Conflicts of Interest

The authors declare no conflicts of interest.

References

  1. Kumar, D.; Zare, F. Harmonic Analysis of Grid Connected Power Electronic Systems in Low Voltage Distribution Networks. IEEE J. Emerg. Sel. Top. Power Electron. 2016, 4, 70–79. [Google Scholar] [CrossRef]
  2. Cheng, X.; Lin, X.; Zhu, C.; Chen, Q.; Cao, M. Hierarchy Fault Diagnosis Method for Power System Based on Weight Fuzzy Petri Net. J. Shandong Univ. Sci. Technol. (Nat. Sci.) 2017, 36, 86–93. [Google Scholar]
  3. Peng, X.; Zou, Q.; Cao, X. A high precision combinational optimization algorithm of power grid harmonic/inter-harmonic signal detection. Power Sys. Prot. Control. 2014, 42, 95–101. [Google Scholar]
  4. Zou, P.; Huang, C.; Jiang, H.; Zou, D. Harmonics and Interharmonics Measurement Based on All-Phase Spectrum Zoomand Correction. Power Sys. Technol. 2016, 40, 2496–2502. [Google Scholar]
  5. Xu, L.; Cao, M.; Song, B.; Zhang, J.; Liu, Y.; Alsaadi, F.E. Open-circuit fault diagnosis of power rectifier using sparse auto encoder based deep neural network. Neurocompting 2018, 311, 1–10. [Google Scholar] [CrossRef]
  6. Ding, L.; Han, Q.; Zhang, X. Distributed Secondary Control for Active Power Sharing and Frequency Regulation in Islanded Microgrids Using an Event-triggered Communication Mechanism. IEEE Trans. Ind. Inf. 2018. [Google Scholar] [CrossRef]
  7. Xiao, J.; Li, S.; Wu, K.; He, Y. A Novel Approach of Harmonic Detection in Power System Based on Neural Network. Trans. China Electrotech. Soc. 2013, 28, 345–348. [Google Scholar]
  8. Liu, W.; Wang, Z.; Liu, X.; Zeng, N.; Liu, Y.; Alsaadi, F.E. A survey of deep neural network architectures and their applications. Neurocomputing 2017, 234, 11–26. [Google Scholar] [CrossRef]
  9. Zhao, Z.; Wang, Z.; Zou, L.; Liu, H. Finite-Horizon H∞ State Estimation for Artificial Neural Networks with Component-Based Distributed Delays and Stochastic Protocol. Neurocomputing 2018, 321, 169–177. [Google Scholar] [CrossRef]
  10. Murugan, A.S.S.; Kumar, V.S. Determining true harmonic contributions of sources using neural network. Neurocomputing 2016, 173, 72–80. [Google Scholar] [CrossRef]
  11. Yang, R.; Tan, K.K.; Tay, A.; Huang, S.; Fuh, J.; Wong, Y.S.; Teo, C.S.; Wang, Z. An RBF neural network approach to geometric error compensation with displacement measurements only. Neural Comput. Appl. 2017, 28, 1235–1248. [Google Scholar] [CrossRef]
  12. Yang, R.; Er, P.V.; Dong, Z.; Tan, K.K. An RBF Neural Network Approach Towards Precision Motion System with Selective Sensor Fusion. Neurocomputing. 2016, 199, 31–39. [Google Scholar] [CrossRef]
  13. Huang, X.; Zhao, Z.; Li, Y. Chaos and Hyperchaos in Fractional-Order Cellular Neural Networks. Neurocomputing. 2012, 94, 13–21. [Google Scholar] [CrossRef]
  14. Geng, C.; Wang, F.; Huang, R.; Zhang, J.; Zhang, X.; Feng, L. Harmonic detection of electrified railway based on improved Hilbert-Huang transform method. J. Shanghai Jiaotong Univ. 2014, 48, 1225–1230. [Google Scholar]
  15. Sahani, M.; Dash, P.K. Variational mode decomposition and weighted online sequential extreme learning machine for power quality event patterns Recognition. Neurocompting 2018, 310, 10–27. [Google Scholar] [CrossRef]
  16. Wang, X.; Du, C. Instantaneous Reactive Power Theory and the Measurement Methods for Detecting Harmonics. Electr. Eng. 2014, 4, 38–41. [Google Scholar]
  17. Chen, H.; He, Y.; Xiao, J.; Liu, X.; Wang, D. Harmonics detection based on a combination of continuous wavelet transform and discrete wavelet transform. Power Syst. Prot. Control. 2015, 43, 71–75. [Google Scholar]
  18. Dick, O.E.; Svyatogor, I.A. Potentialities of the wavelet and multifractal techniques to evaluate changes in the functional state of the human brain. Neurocompting 2012, 82, 207–215. [Google Scholar] [CrossRef]
  19. Zhang, J.; Liu, K.; Wang, L.; Chen, W. A rapid algorithm for harmonic analysis based on four-spectrum-line interpolation FFT. Power Syst. Prot. Control. 2017, 45, 139–145. [Google Scholar]
  20. Jia, F.; Wu, B.; Xiong, X.; Xiong, S. Intelligent diagnosis of bearing based on EMD and multifractal detrended fluctuation analysis. J. Central South. Univ. (Sci. Technol.) 2015, 46, 491–497. [Google Scholar]
  21. Chu, Q.; Xiao, H.; Lv, Y.; Yang, Z. Gear fault diagnosis based on multifractal theory and neural network. J. Vibr. Shock 2015, 34, 15–18. [Google Scholar]
  22. Maity, A.K.; Pratihar, R.; Mitra, A.; Dey, S.; Agrawal, V.; Sanyal, S.; Banerjee, A.; Sengupta, R.; Ghosh, D. Multifractal Detrended Fluctuation Analysis of alpha and theta EEG rhythms with musical stimuli. Chaos Solitons Fractals 2015, 81, 52–67. [Google Scholar] [CrossRef]
  23. Dick, O.E.; Svyatogor, I.A. Wavelet and multifractal estimation of the intermittent photic stimulation response in the electroencephalogram of patients with dyscirculatory encephalopathy. Neurocomputing 2015, 165, 361–374. [Google Scholar] [CrossRef]
  24. Kantelhardt, J.W.; Zschiegner, S.A.; Koscielny-Bunde, E.; Havlin, S.; Bunde, A.; Stanley, H.E. Mutifractal detrended fluctuation analysis of nonstationary time series. Phys. A 2002, 316, 87–114. [Google Scholar] [CrossRef]
  25. Guo, Y.; Huang, J.; Cheng, H. Multifractal features of metal futures market based on multifractal detrended cross-correlation analysis. Kybernetes 2012, 41, 1509–1525. [Google Scholar] [CrossRef]
  26. Kalamaras, N.; Philippopoulos, K.; Deligiorgi, D.; Tzanis, C.G.; Karvounis, G. Multifractal scaling properties of daily air temperature time series. Chaos Solitons Fractals 2017, 98, 38–43. [Google Scholar] [CrossRef]
  27. Fan, X.; Lin, M. Multiscale multifractal detrended fluctuation analysis of earthquake magnitude series of Southern California. Phys. A 2017, 479, 225–235. [Google Scholar] [CrossRef]
  28. Lu, S.; Wang, J.; Xue, Y. Study on multifractal fault diagnosis based on EMD fusion in hydraulic engineering. Appl. Therm. Eng. 2016, 103, 798–806. [Google Scholar] [CrossRef]
  29. Wang, F.; Fan, Q.; Stanley, H.E. Multiscale multifractal detrended-fluctuation analysis of two-dimensional surfaces. Phys. Rev. E 2016, 93. [Google Scholar] [CrossRef]
  30. Zhao, H.; He, S. Analysis of speech signals’ characteristics based on MFDFA with moving overlapping windows. Phys. A 2016, 442, 343–349. [Google Scholar] [CrossRef]
  31. Kracík, J.; Lavička, H. Fluctuation analysis of high frequency electric power load in the Czech Republic. Phys. A 2016, 462, 951–961. [Google Scholar] [CrossRef] [Green Version]
  32. Li, C.; Li, Q.; Wang, Q.; Song, Y. Research on Electric Power Load Risk Warning Threshold Based on SMF-DFA. Power Syst. Technol. 2016, 40, 1437–1441. [Google Scholar]
  33. Zhu, N.; Bai, X.; Dong, W. Harmonic Detection Method Based on EEMD. Proc. CSEE 2013, 33, 92–98. [Google Scholar]
  34. Lin, H.; Chen, L. Denoising Method of Power System Perturbed. Electr. Eng. 2014, 8, 11–13. [Google Scholar]
  35. Bustos, A.; Rubio, H.; Castejón, C.; Carlos, J. García-Prada EMD-Based Methodology for the Identification of a High-Speed Train Running in a Gear Operating State. Sensors 2018, 18, 793. [Google Scholar] [CrossRef] [PubMed]
  36. Ihlen, E.F. Introduction to multifractal detrended fluctuation analysis in matlab. Front. Physiol. 2012, 1–18. [Google Scholar] [CrossRef] [PubMed]
  37. Mensi, W.; Tiwar, A.K.; Yoon, S.M. Global financial crisis and weak-form efficiency of Islamic sectoral stock markets: An MF-DFA analysi. Phys. A 2016, 471, 135–146. [Google Scholar] [CrossRef]
  38. Xi, C.; Zhang, S.; Xiong, G.; Zhao, C. A comparative study of multifractal detrended fluctuation analysis and multifractal detrended moving average algorithm to estimate the multifractal spectrum. Acta Phys. Chim. Sin. 2015, 13, 335–348. [Google Scholar]
  39. Tian, Z.; Li, H.; Sun, J.; Lin, B. Degradation state identification method of hydraulic pump based on improved MF-DFA and SSM-FCM. Chin. J. Sciebtific Instrum. 2016, 37, 1851–1860. [Google Scholar]
  40. Lin, J.; Chen, Q. Applications of multifractal detrended fluctuation analysis to severity Identification of rolling bearing damages. Chin. Mech. Eng. 2014, 25, 1760–1765. [Google Scholar]
  41. Lei, R.; Hao, Z. A harmonic detection for power network based on wavelet transform Mallat algorithm. Ind. Mine Autom. 2014, 42, 65–69. [Google Scholar]
  42. Zou, X.; Ye, Y. Multi-fault diagnosis method on Mallat pyramidal algorithmwavelet analysis. Control. Decis. 2004, 19, 592–594. [Google Scholar]
  43. Zhang, B.; Sun, J. A power quality analysis method based on mallat algorithm and fast fourier transform. Power Sys. Technol. 2007, 31, 35–40. [Google Scholar]
  44. Ihlen, E.A.F. Introduction to multifractal detrended fluctuation analysis in Matlab. Front. Physiol. Fractal Physiol. 2012, 3, 1–18. [Google Scholar] [CrossRef] [PubMed]
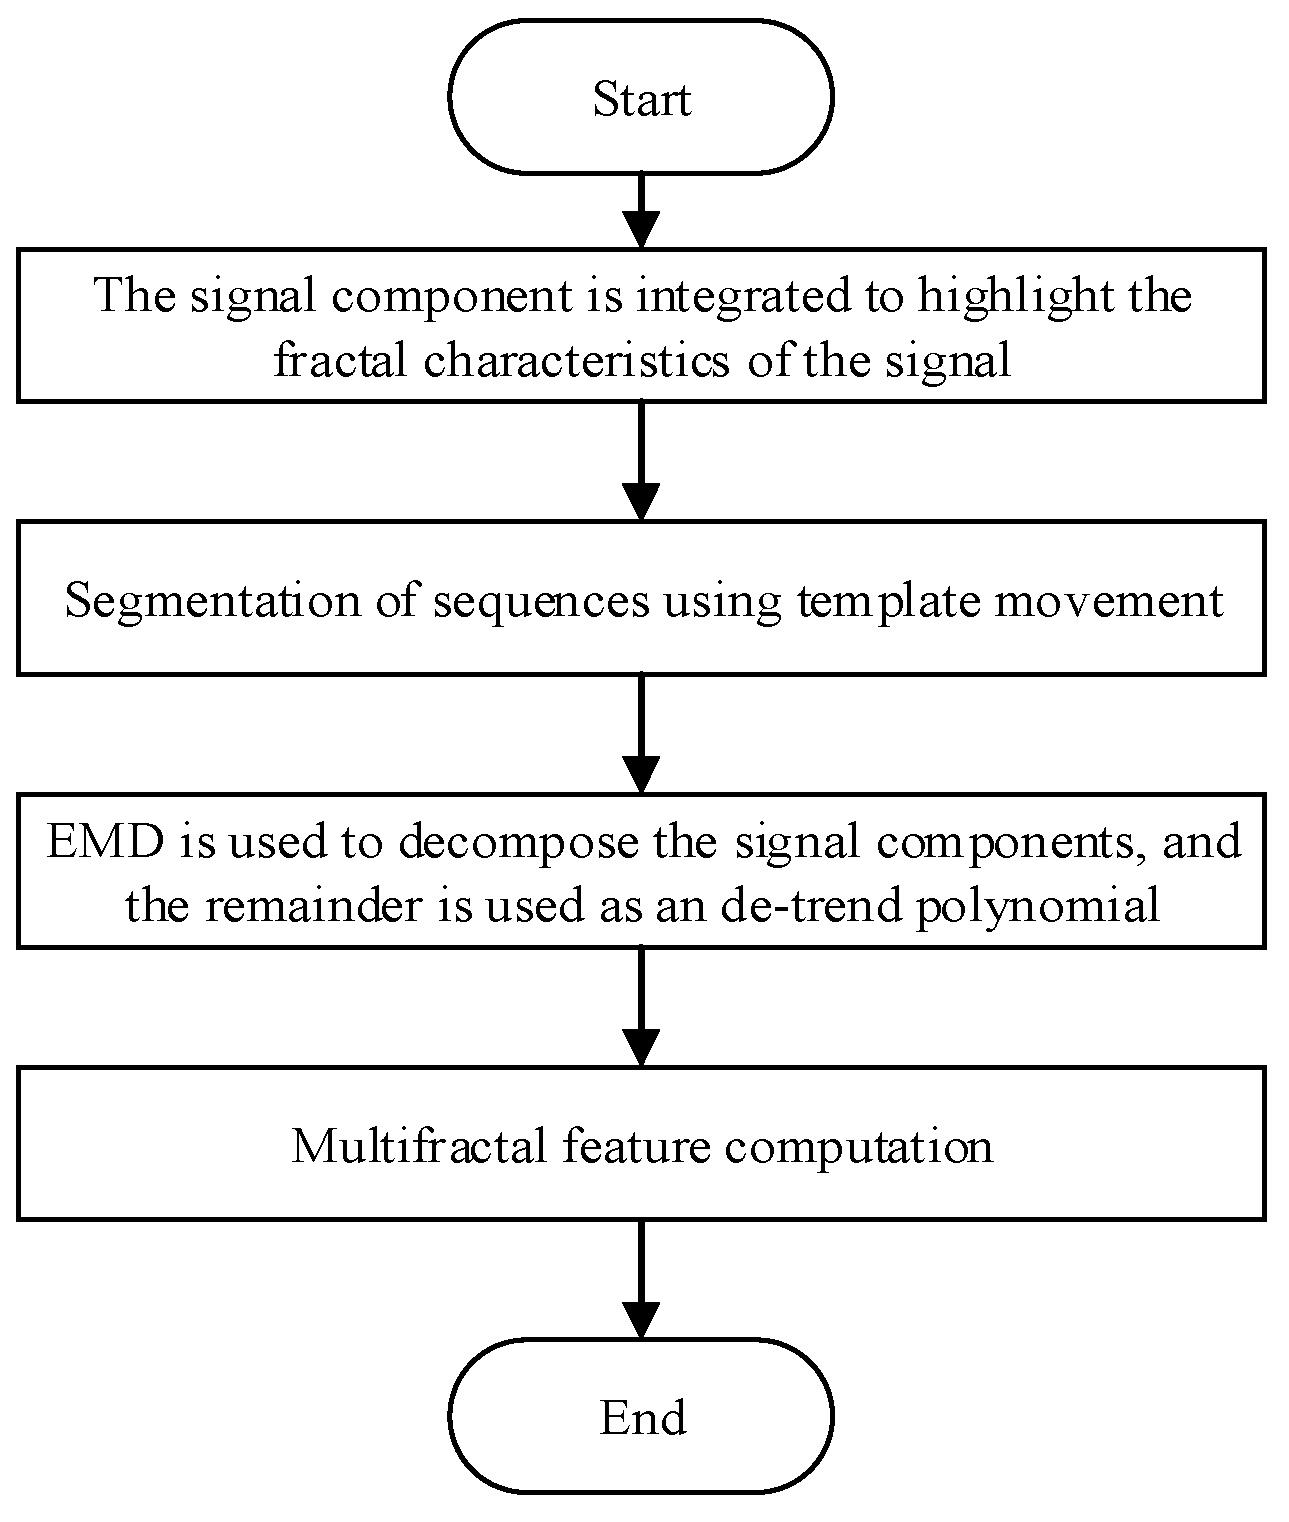
Figure 1. Flowchart of multifractal analysis.
Electronics 08 00209 g001
Figure 2. Acquisition system.
Electronics 08 00209 g002
Figure 3. The original flow meter signal.
Electronics 08 00209 g003
Figure 4. The spectrum of the original signal.
Electronics 08 00209 g004
Figure 5. The high-frequency part of the wavelet decomposition.
Electronics 08 00209 g005
Figure 6. α f ( α ) curves of three signal components obtained using: (a) the traditional multifractal detrended fluctuation analysis (MFDFA) algorithm; and (b) the new MFDFA algorithm.
Electronics 08 00209 g006
Figure 7. q h ( q ) curves of three signal components obtained using: (a) the traditional MFDFA algorithm; and (b) the new MFDFA algorithm.
Electronics 08 00209 g007
Figure 8. q τ ( q ) curves of three signal components obtained using: (a) the traditional MFDFA algorithm; and (b) the new MFDFA algorithm.
Electronics 08 00209 g008
Figure 9. Double-log relation graph of low-frequency component d1 obtained using: (a) the traditional MFDFA algorithm; and (b) the new MFDFA algorithm.
Electronics 08 00209 g009
Figure 10. Double-log relation graph of low-frequency component d2 obtained using: (a) the traditional MFDFA algorithm; and (b) the new MFDFA algorithm.
Electronics 08 00209 g010
Figure 11. Double-log relation graph of low-frequency component d3 obtained using: (a) the traditional MFDFA algorithm; and (b) the new MFDFA algorithm.
Electronics 08 00209 g011
Table 1. The frequency band of each layer by wavelet decomposition.
LayerFrequency Band
a50–7.8125 Hz
a40–15.625 Hz
a30–31.25 Hz
a20–62.5 Hz
a10–125 Hz
d57.8125–15.625 Hz
d415.625–31.25 Hz
d331.25–62.5 Hz
d262.5–125 Hz
d1125–250 Hz
Table 2. Δ α , α 0 and α m i n values of the harmonic component computed analytically through traditional MFDFA and new MFDFA.
Harmonic ComponentTraditional MFDFANew MFDFA
Δ α α 0 α m i n Δ α α 0 α m i n
d10.9570.113−0.1260.3970.066−0.122
d20.7820.128−0.0390.3420.051−0.071
d30.9690.3240.1030.8000.061−0.074
Table 3. h(q) values of the harmonic signal computed analytically through MFDFA and the new MFDFA.
q Traditional MFDFANew MFDFA
d1d2d3d1d2d3
−50.5830.4950.7470.1710.1510.395
−40.5210.4330.6660.1420.1210.313
−30.4260.3360.5530.1160.0940.202
−20.2580.1920.4180.0910.0720.098
−10.1130.1280.3240.0660.0510.061
00.0670.0970.2720.0420.0330.041
10.0340.0710.2380.020.0160.022
20.0060.0490.21200.0010.007
3−0.0170.0320.192−0.019−0.012−0.006
4−0.0370.0180.175−0.036−0.023−0.018
5−0.0550.0060.160−0.051−0.032−0.029
Δ h 0.6380.4890.5870.2220.1830.4244