Article

Determination of Liberation Degree of Mechanically Processed Waste Printed Circuit Boards by Using the Digital Microscope and SEM-EDS Analysis

by
Pedro Pereira Gonçalves
1 and
Akira Otsuki
1,2,*
1
Ecole Nationale Supérieure de Géologie, GeoRessources UMR 7359 CNRS, University of Lorraine, 2 Rue du Doyen Marcel Roubault, BP 10162, 54505 Vandoeuvre-lès-Nancy, France
2
Waste Science & Technology, Luleå University of Technology, 971 87 Luleå, Sweden
*
Author to whom correspondence should be addressed.
Electronics 2019, 8(10), 1202; https://doi.org/10.3390/electronics8101202
Submission received: 26 July 2019 / Revised: 4 October 2019 / Accepted: 15 October 2019 / Published: 22 October 2019

Abstract

:
Characterization of heterogeneous materials, such as particles from mechanically processed waste printed circuit boards, is a challenging task. The majority of characterization methods either give average information or information that is very limited and in a tiny area of specific interest. That said, capturing such heterogeneity is significantly important for any kind of processes. Degree of liberation, indicating how much the target component is liberated from the non-valuable components, is a key property to determine the success of subsequent process for valuable material recovery. This work analyzed the degree of liberation of metals within the products of hammer milling process via the combination of image acquisition and analysis. The digital microscope and a scanning electron microscope (SEM) coupled with the energy dispersive spectroscopy (EDS) were used for image acquisition and elemental mapping, in order to evaluate the selective liberation under different milling conditions (i.e., feed mass, milling time) for different metals (mainly Cu and Al) and particle size fractions. The obtained liberation degree was also modelled and determined the liberation parameters that were compared. The results showed that the degree of liberation significantly depend on the milling conditions and metals we analyzed, and well correlated with the selective metal enrichment behavior. Results between the two methods showed some similarities and discrepancies. The advantages and disadvantages of the above two methods were identified and discussed in the paper, in addition to their methodological developments.

1. Introduction

Waste electrical and electronic equipment (WEEE) is one of the fastest growing waste categories in the EU, with the growth rate of 3–5% per year [1], as a result of massive production of the EEE and its market expansion based on technological progress. The printed circuit boards (PCBs) present in almost every single piece of electronic equipment, and account for roughly 5 wt% of the entire e-waste currently produced. Nevertheless, they carry the most important share of the valuable and also toxic metals [2,3]. This creates an urgent need for recovering/recycling valuable materials from PCBs. On the other hand, their complex and heterogeneous structures (e.g., mixture of number of different metals, plastics, and ceramics in different sizes) and their diversion with time raise the issues associated with their effective pre-concentration process development as well as environmental concerns. One of the major limitations in the recycling of PCBs is a lack of a proper characterization method to quantitatively evaluate the distribution and liberation of each metal without destroying the heterogeneous particle status at each separation/beneficiation unit operation.
The degree of liberation, indicating how much the target component is liberated from the non-valuable components, is a key factor when establishing the liberation performance of the comminution to determine the success of subsequent process for valuable material recovery [4]. The study of the degree of liberation was initially introduced in the mineral processing field, where the main objective was to achieve selective liberation of the valuable minerals of interest aiming for the coarsest particle size possible, saving energy on the grinding process and reducing the amount of non-desirable fine fractions produced [5,6].
One of the methods for the degree of liberation for mineral grains is the analysis of images (and elemental maps) obtained by optical microscopy or scanning electron microscopy. For instance, there was a report on liberation within complex assemblages, such as in a Galena-Sphalerite ore [7]. In the mineral industry, the image analysis has shifted towards an automatic procedure lately, using automated analyzers coupled with the electron microscopes, such as MLA and QEMSCAN [8,9]. However, the applicability of the automated image analyzers algorithms to electronic wastes, mostly for such complex assemblage resulting from the waste PCBs can be challenging [10]. The heterogeneous nature of the samples, in terms of diverse materials used (i.e., metals, glass, ceramics), the irregular shape of the particles due to the different physical properties of the materials (e.g., round ball-like shaped, elongated rod-like shapes, cubic-like [11]) and associated software developed for mineral analysis are some of the issues that could face by automated analysis. Hence, particle counting method is preferred for the conditions and heterogeneous samples of our study in order to evaluate and understand the liberation degree of the metals of interest, by applying a non-destructive characterization. The importance of using non-destructive characterization methods and how it can be helpful to understand the association and deportment of metals/plastics in the different size fractions was alerted in our previous studies e.g., [12].
Comparing with the primary ore beneficiations, in a waste PCB assemblage, a specific size fraction for the liberation of valuable metals from non-metallic fractions is still not clearly understood. Some previous studies investigated the effect of the particles size and shape on the liberation characteristics [11,13], and high liberation degree was reported with the particle sizes below < 100 μm or from 100 μm up to 3 mm. Such discrepancies are likely related to the differences in the PCB material compositions and the grinding mechanisms used in the comminution processes [14].
Our previous work [15] reported the selective metal enrichment and agglomeration of metallic components (e.g., Cu, Al) through the application of a hammer milling for PCBs comminution. Based on our results and abovementioned research gaps, the objective of the present study is to assess the degree of liberation of metals within the products of hammer milling process via the combination of image acquisition and analysis, in order to evaluate their selective liberation. The particles produced under different milling conditions (i.e., feed mass, milling time) for different metals (i.e., Cu, Al) were compared as a function of particle size fractions. The results obtained for the liberation degree using digital optical microscopic images were compared with the analysis of backscattered electron (BSE) images and elemental maps obtained by scanning electron microscope coupled with an energy dispersive spectroscopy (SEM-EDS). The advantages and disadvantages of the above two methods for investigating the liberation degree of mechanically processed PCB particles will be discussed in the paper, in addition to their methodological developments.

2. Materials and Methods

2.1. Materials

Printed circuit boards (origin confidential) were comminuted through shredding and hammer milling, without prior detachment of components. An experimental matrix was designed to investigate the influence of two of the hammer milling parameters, feed mass (20, 40 and 80 g) and grinding time (30, 60 and 90 s) on the selective enrichment of metals from the non-metallic fractions in the milled products. The detailed milling procedure was presented in our previous report [15]. The hammer milled PCB products were then sieved to obtain the following size fractions: 1–2 mm, 0.5–1 mm, 0.25–0.5 mm, 0.125–0.25 mm, and <0.125 mm.

2.1.1. Scanning Electron Microscope (SEM) with Energy Dispersive Spectroscopy (EDS)-Sample Preparation

Table 1 shows the experimental conditions selected to represent the whole experimental matrix for the acquisition of images by the Scanning Electron Microscope—SEM (Vega3 TESCAN). The results were compared with the ones obtained by the liberation degree analysis by using the digital optical microscopic images.
The focus of the application of the SEM-EDS was to investigate the degree of liberation of the metallic particles contained in the fine size fractions, below 0.5 mm, generated by the hammer milling performed under different feed masses and grinding time. The PCB milled products from the size fractions 0.25–0.5 mm; 0.125–0.25 mm and < 0.125 mm were quartered until a homogeneous material around 0.2 g was obtained. These particles were then mounted into epoxy resin polished sections, using ARALDITE 2020® and making sure to apply a silicone releasing agent in each polytetrafluoroethylene mold cup before pouring the particles. A special care was taken in order to avoid the physical touch of the particles, which could bring misinterpretations when dealing with such a heterogeneous material. After 36–48 hours of room temperature hardening, the specimens were polished with a sand paper (#1200, APP, France).

2.1.2. Digital Optical Microscope-Sample Preparation
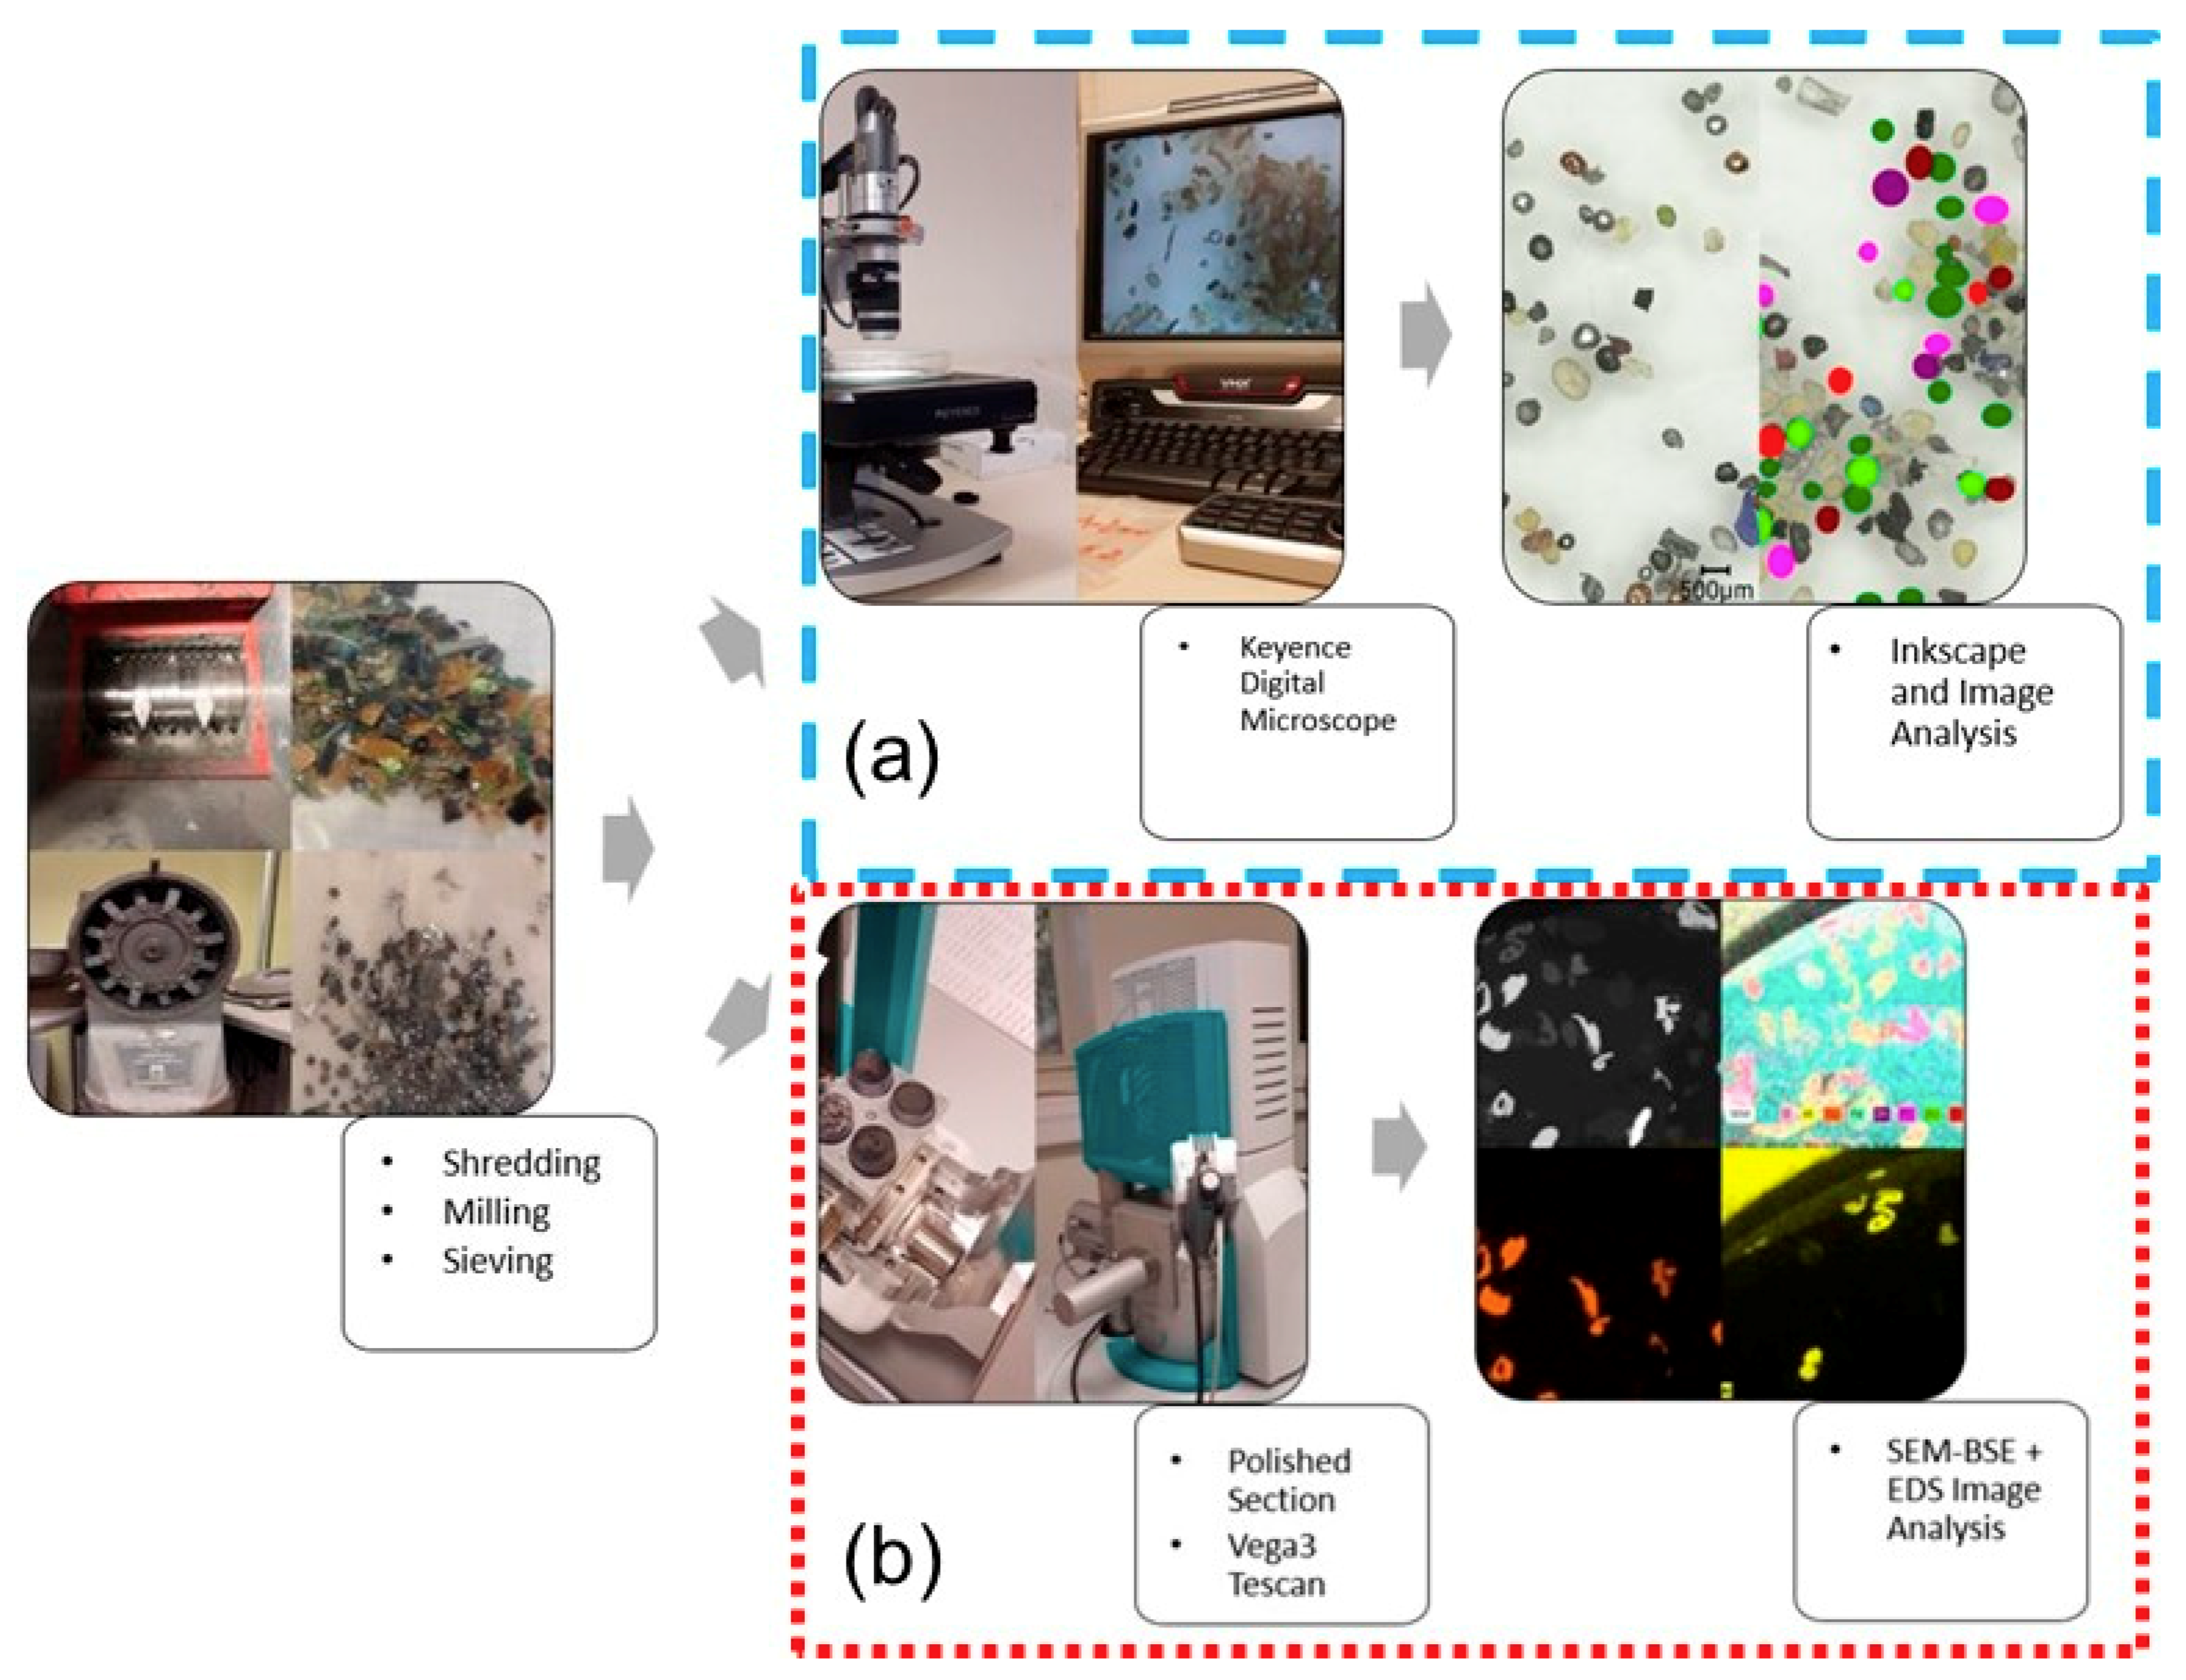
Representative samples from each fraction and for each of the nine conditions from the experimental matrix (feed mass vs. grinding time) were obtained through a quartering device (Minemet, France). Among the five particle size fractions, the coarser size fractions 1–2 mm; 0.5–1 mm; 0.25–0.5 mm and 0.125–0.25 mm were selected and imaged by the Digital Optical Microscope (Keyence—VHX-1000) that was not suitable for the finest size fraction (< 0.125 mm). The milled PCB particles were poured into a glass petri dish and the particles were gently dispersed in order to avoid their overlapping. If necessary, for the coarser fractions, the particles were manually separated by a wooden spatula for better particle liberation/association recognition prior to the image acquisition. A series of images were taken for each sample, aiming to build a map of particle images that were analyzed to evaluate metallic particle liberation degree.

2.2. Methods

The chemical composition analysis of the samples has already been published in our previous reports [12,15]. The issues associated with the use of chemical composition is that it gives the average value of the samples disregarding the liberation degree of metals. In other words, what if a sample carries the same concentration of Cu as the other sample with the different liberation degree of Cu, we cannot detect their differences. Thus, sole use of chemical composition analysis is not applicable in the liberation degree analysis, but we need to assess individual particles about their liberation status to calculate the liberation degree of a specific metal of interest (e.g., Cu).
In this study, the liberation degree of the metals of interest (Cu, Al and “Other Metals”) was calculated by the particle-counting method, which can be expressed by the following equation:
L i b e r a t i o n   D e g r e e =   N f r e e N f r e e + N l o c k e d
where ‘Nfree’, indicates the number of free particles of the metal of interest and ‘Nlocked’ is the number of interlocked particles, either with other metals or with non-metallic fraction, i.e., plastics, glass and ceramics.
In order to assess the dependence of the liberation degree as a function of the geometric mean particle size, Abouzeid [16] suggested the expression below to obtain the “Liberation Parameter”.
Y = 100 exp ( K x )
where ‘Y’ is the liberation degree whose natural logarithmic values were plotted in normal scale as a function of the geometric mean particle size ‘x’, and fitted with linear regression that determines the ‘−K’ as the slope.
In the analysis of the images generated by both digital microscope and scanning electron microscope, the composite particles (e.g., plastic and metal interlocked in the same particle) were considered as locked particles. In case two different metals composing the same particle, these particles were taken into account, as a non-liberated particle for both metals (e.g., non-liberated Al and non-liberated Cu).

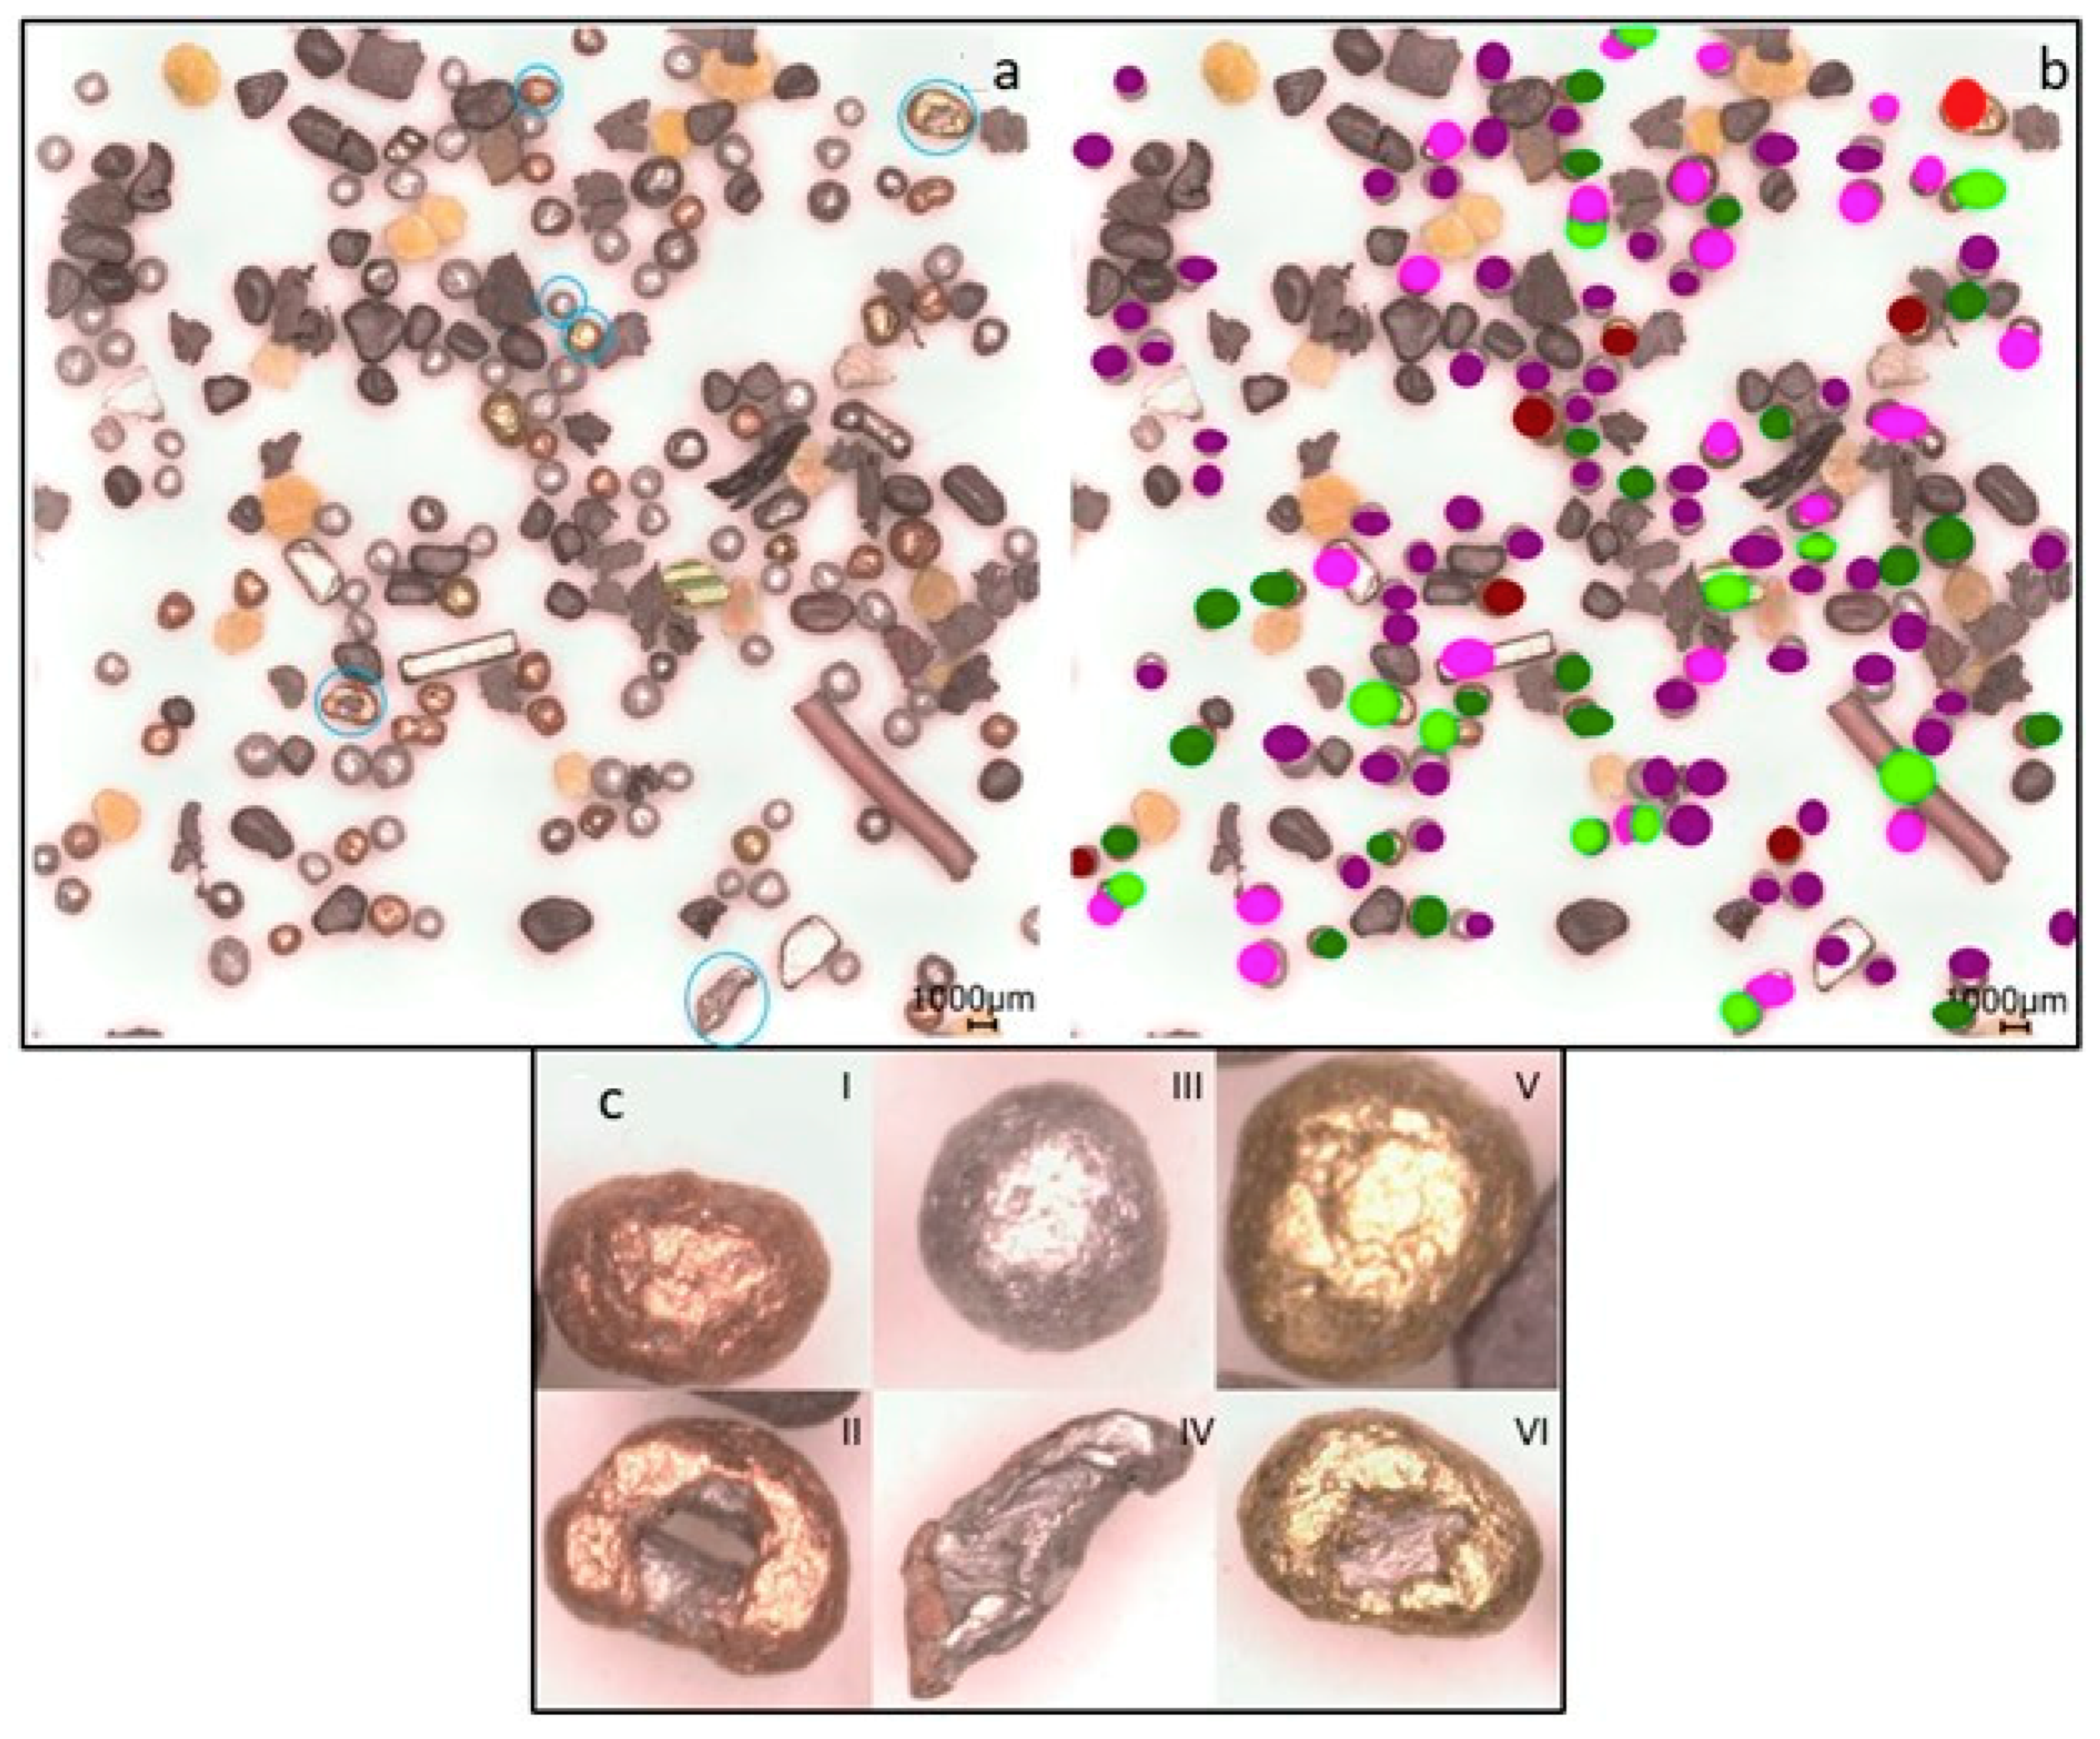
2.2.1. Digital Optical Microscope Imaging and Image Analysis

The digital optical microscope (VHX-1000, Keyence) was used for image acquisition. The VHX-1000 is a versatile digital microscope that allows sharp observations of the particles through a deeper depth of field in a magnified image than regular optical microscopes. The particles were poured and spread onto a petri dish, placed on the white background stage, and then the reflected light setting was used with a white LED as a light source. The focus of the image was made using a coupled camera adapter. The magnification varied from 20–50x for the coarser fractions (i.e., 1–2 mm; 0.5–1 mm) up to 100–200x for the finer ones (i.e., 0.25–0.5 mm and 0.125–0.25 mm). For each size fraction and each experimental condition (feed mass x grinding time), compositional images were acquired in different areas and combined through a real time 2D image stitching function of the VHX-1000, in which the stage automatically scanned and imaged in order to cover a wide area of the sample.
A first attempt using the software ImageJ for the image analysis was proven to be inefficient, since the direct interpretation of the raw image obtained with ImageJ could not define the composite particles as being single particles with both metallic and non-metallic inclusions. Instead, the software identified the composite locked particle as two or more separated particles, which is inappropriate for the purpose of our study.
In order to solve the issue of direct analysis faced when using ImageJ, another graphic software, the Inkscape, was used to count the composite particles. A color coding system was established, assigning dots with different colors to the six different types of particles of interest that were defined prior to counting, i.e., liberated Cu, non-liberated Cu, liberated Al, non-liberated Al, liberated other metals (e.g., alloys, steel scrap, lead) and non-liberated other metals, according to the following Table 2.
Table 3 represents the total number of particles counted according to the size fractions for each different ‘feed mass (g)—grinding time (s)’ condition. For each sample (milling condition and different size fraction), a range between 15–99 metallic particles were observed and counted, out of around 200–400 all the particles in total.
An example of the methodology used to count the particles is given with more details in the following Figure 1. The image corresponds to the PCB sample prepared at 80 g and 90 s (feed mass x grinding time) and the coarsest product size fraction, i.e., 1–2 mm. A guidance for how the interpretation of the individual particles was performed is given in Figure 1c.
Figure 2a summarizes the procedure for the degree of liberation analysis, combining image acquisition with the Keyence VHX-1000 and then image analysis through particle counting for further calculations of the liberation degree.

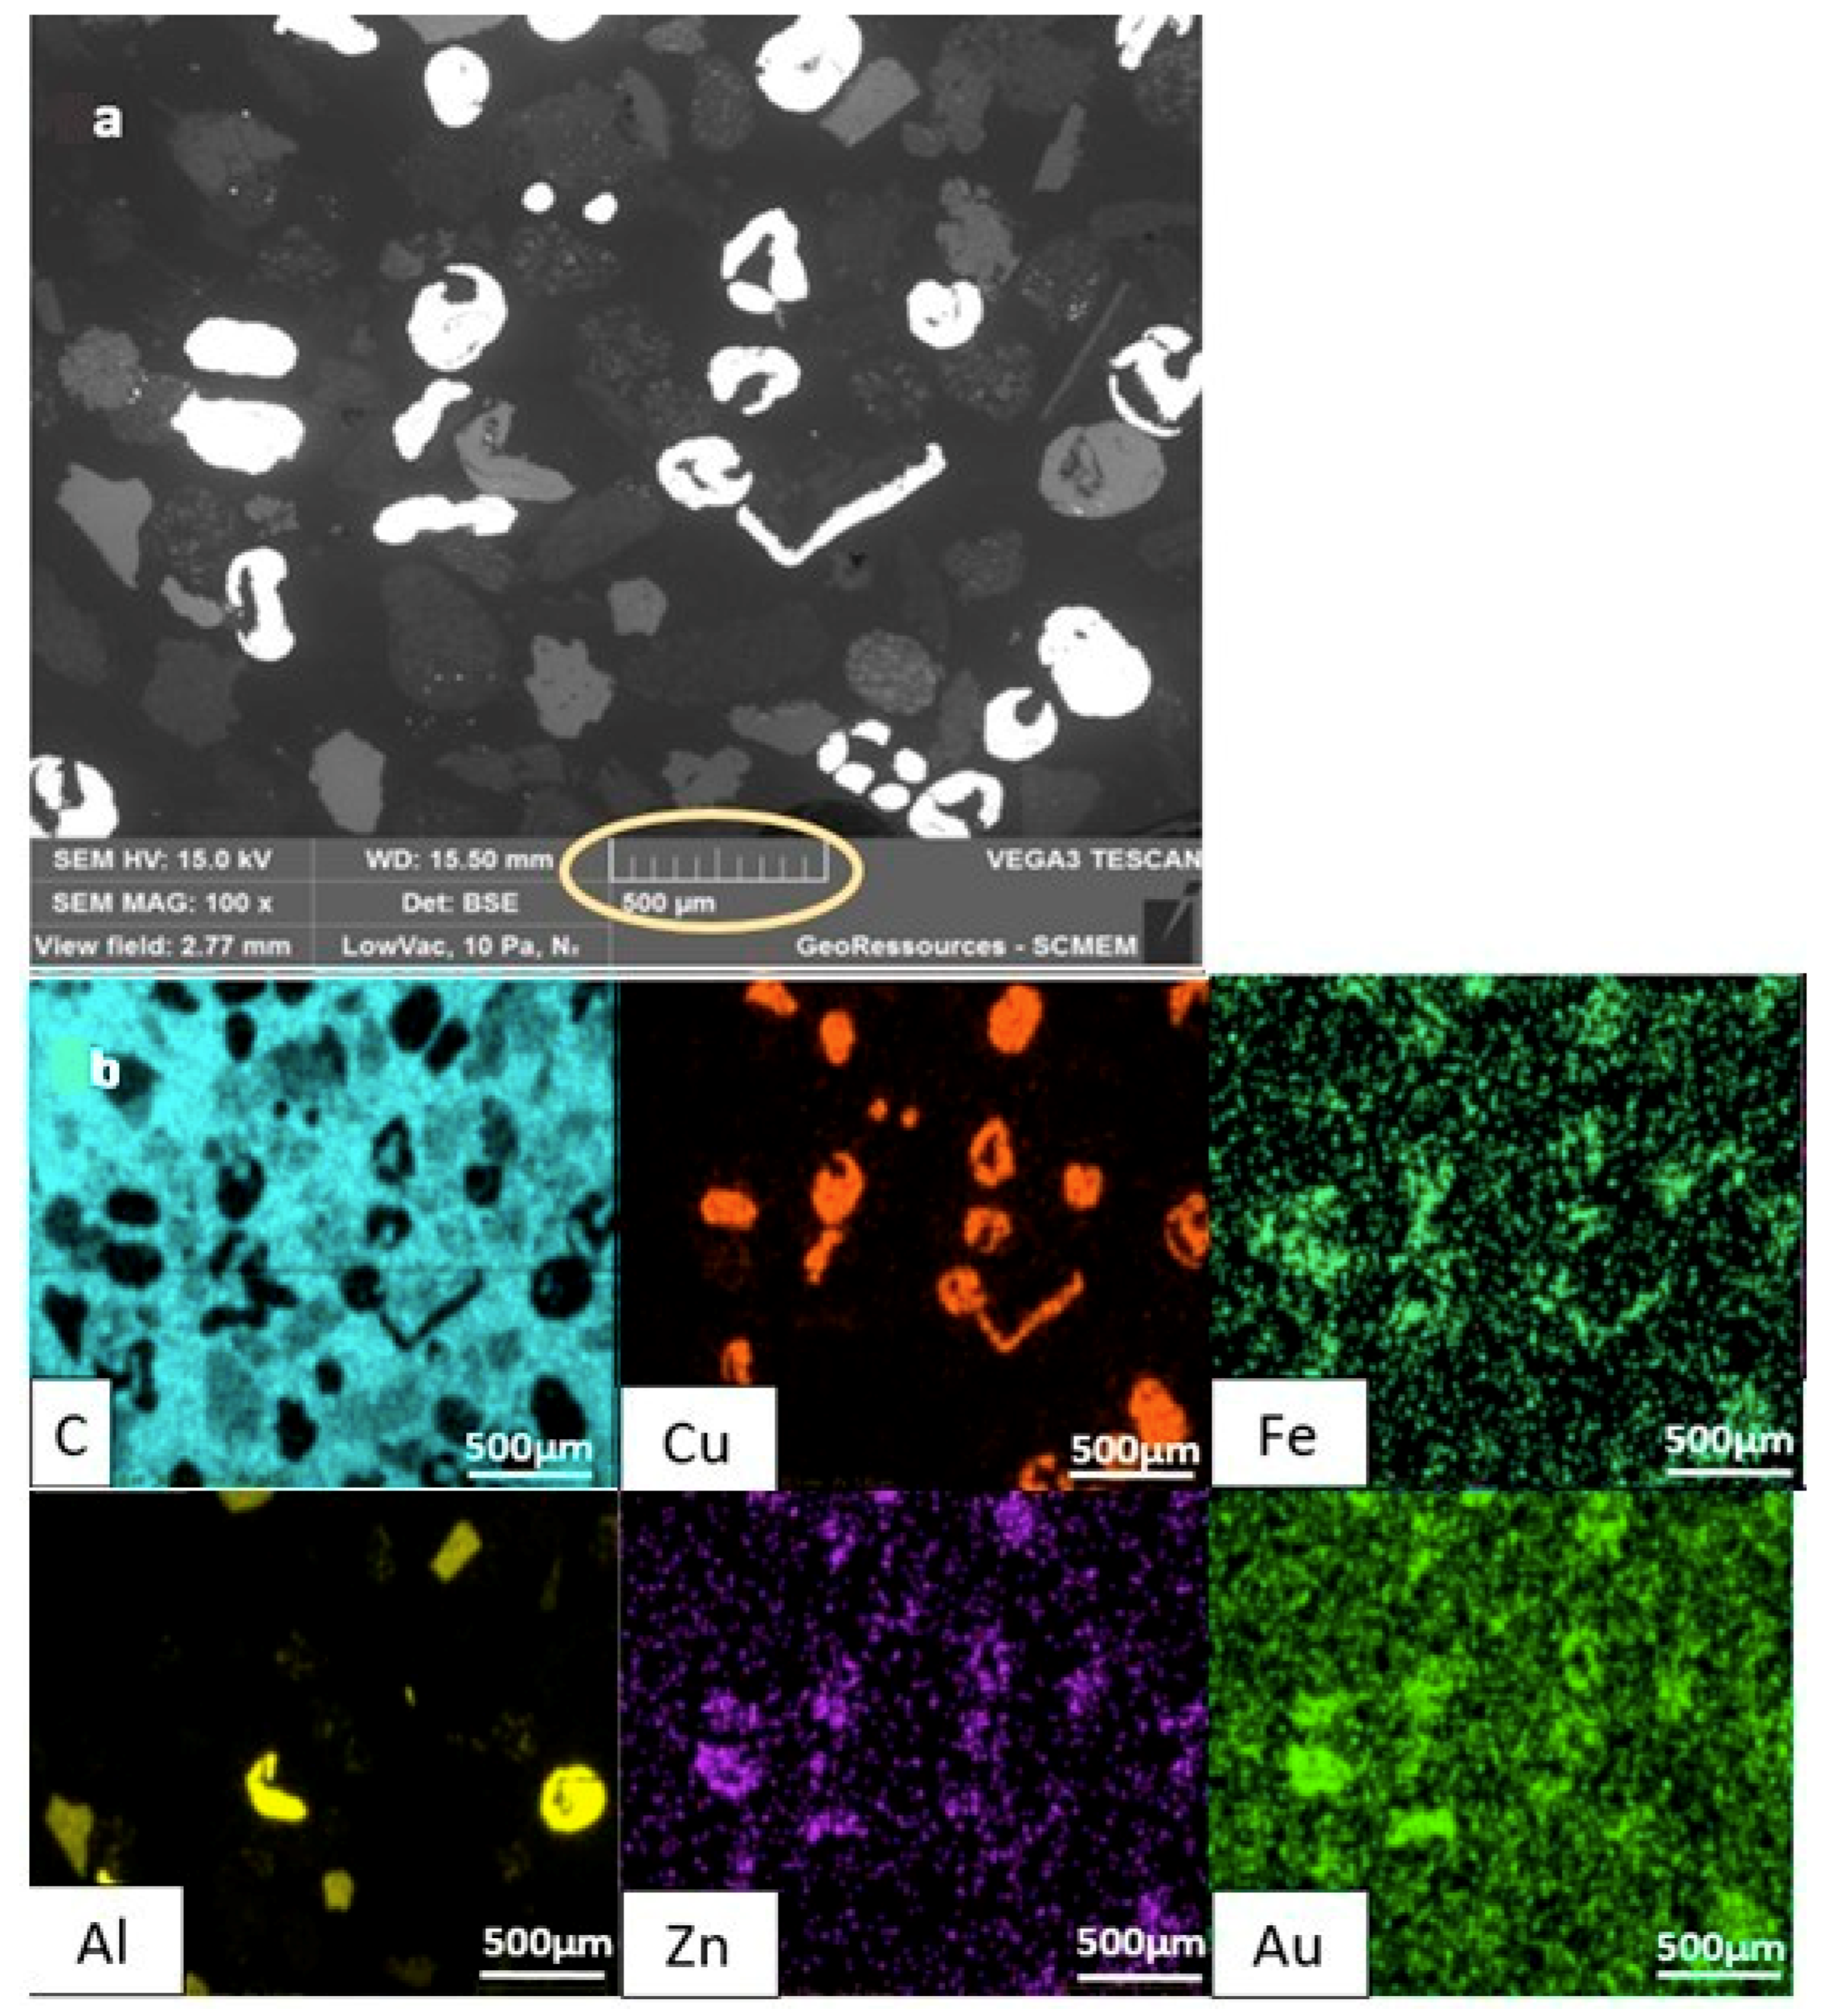
2.2.2. Scanning Electron Microscope (SEM) with Energy Dispersive Spectroscopy (EDS) Methodology

Backscattered electron (BSE) images from the polished sections were obtained by a scanning electron microscope (Vega3, TESCAN), coupled with an EDS detector (Bruker) allowing the elemental mapping. The analysis was performed in the low vacuum pressurized chamber (10Pa). The 15-kV electron beam with the intensity of 15 (arbitrary unit—defined by Vega3 TESCAN) and the working distance at around 15 mm were used. Incident probe current, brightness and contrast levels were set to allow the acquisition of BSE images and elemental maps with a good quality for further processing.
The BSE images provided signals from a sample polished section in greyscale that distinguishes plastics (dark) from the metallic particles (bright) due to their distinguished chemical composition contrast. Regarding the liberated and locked metallic particles (e.g., Cu, Fe, Al), as the atomic numbers are in a closer range, the level of brightness could be similar, hence, the extra information acquired from the energy dispersive spectroscopy (EDS) was also considered. The EDS detector was used for the elemental analysis. Elemental mapping for 8 different elements: C, O, Cu, Al, Fe, Pb, Zn and Au (Figure 3) was acquired from the same areas as the BSE images after two 6 minutes-cycles, using the Bruker software. In addition to the BSE images in greyscale contrasting metallic and non-metallic particles (Figure 3a), the EDS detector provided elemental mapping extra information that was used to differentiate the composition of the metallic particles (Figure 3b).
Table 4 represents the total number of particles counted for each polished section according to the size fractions and the different ‘feed mass (g)—grinding time (s)’ condition. For each of the polished sections analyzed, a range between 34–123 metallic particles were observed and counted, out of around 200–400 all the particles in total.
Analogous to the methodology used for counting with the digital microscope images, the particles were identified into six main categories: liberated and non-liberated Cu, liberated and non-liberated Al, and liberated/non-liberated other metals, which could include brass, steel, lead alloys.
Figure 2b summarizes the procedure for the degree of liberation analysis, combining image acquisition with the Vega3 TESCAN and image analysis through particle counting methodology for further calculations of the liberation degree.

3. Results and Discussion

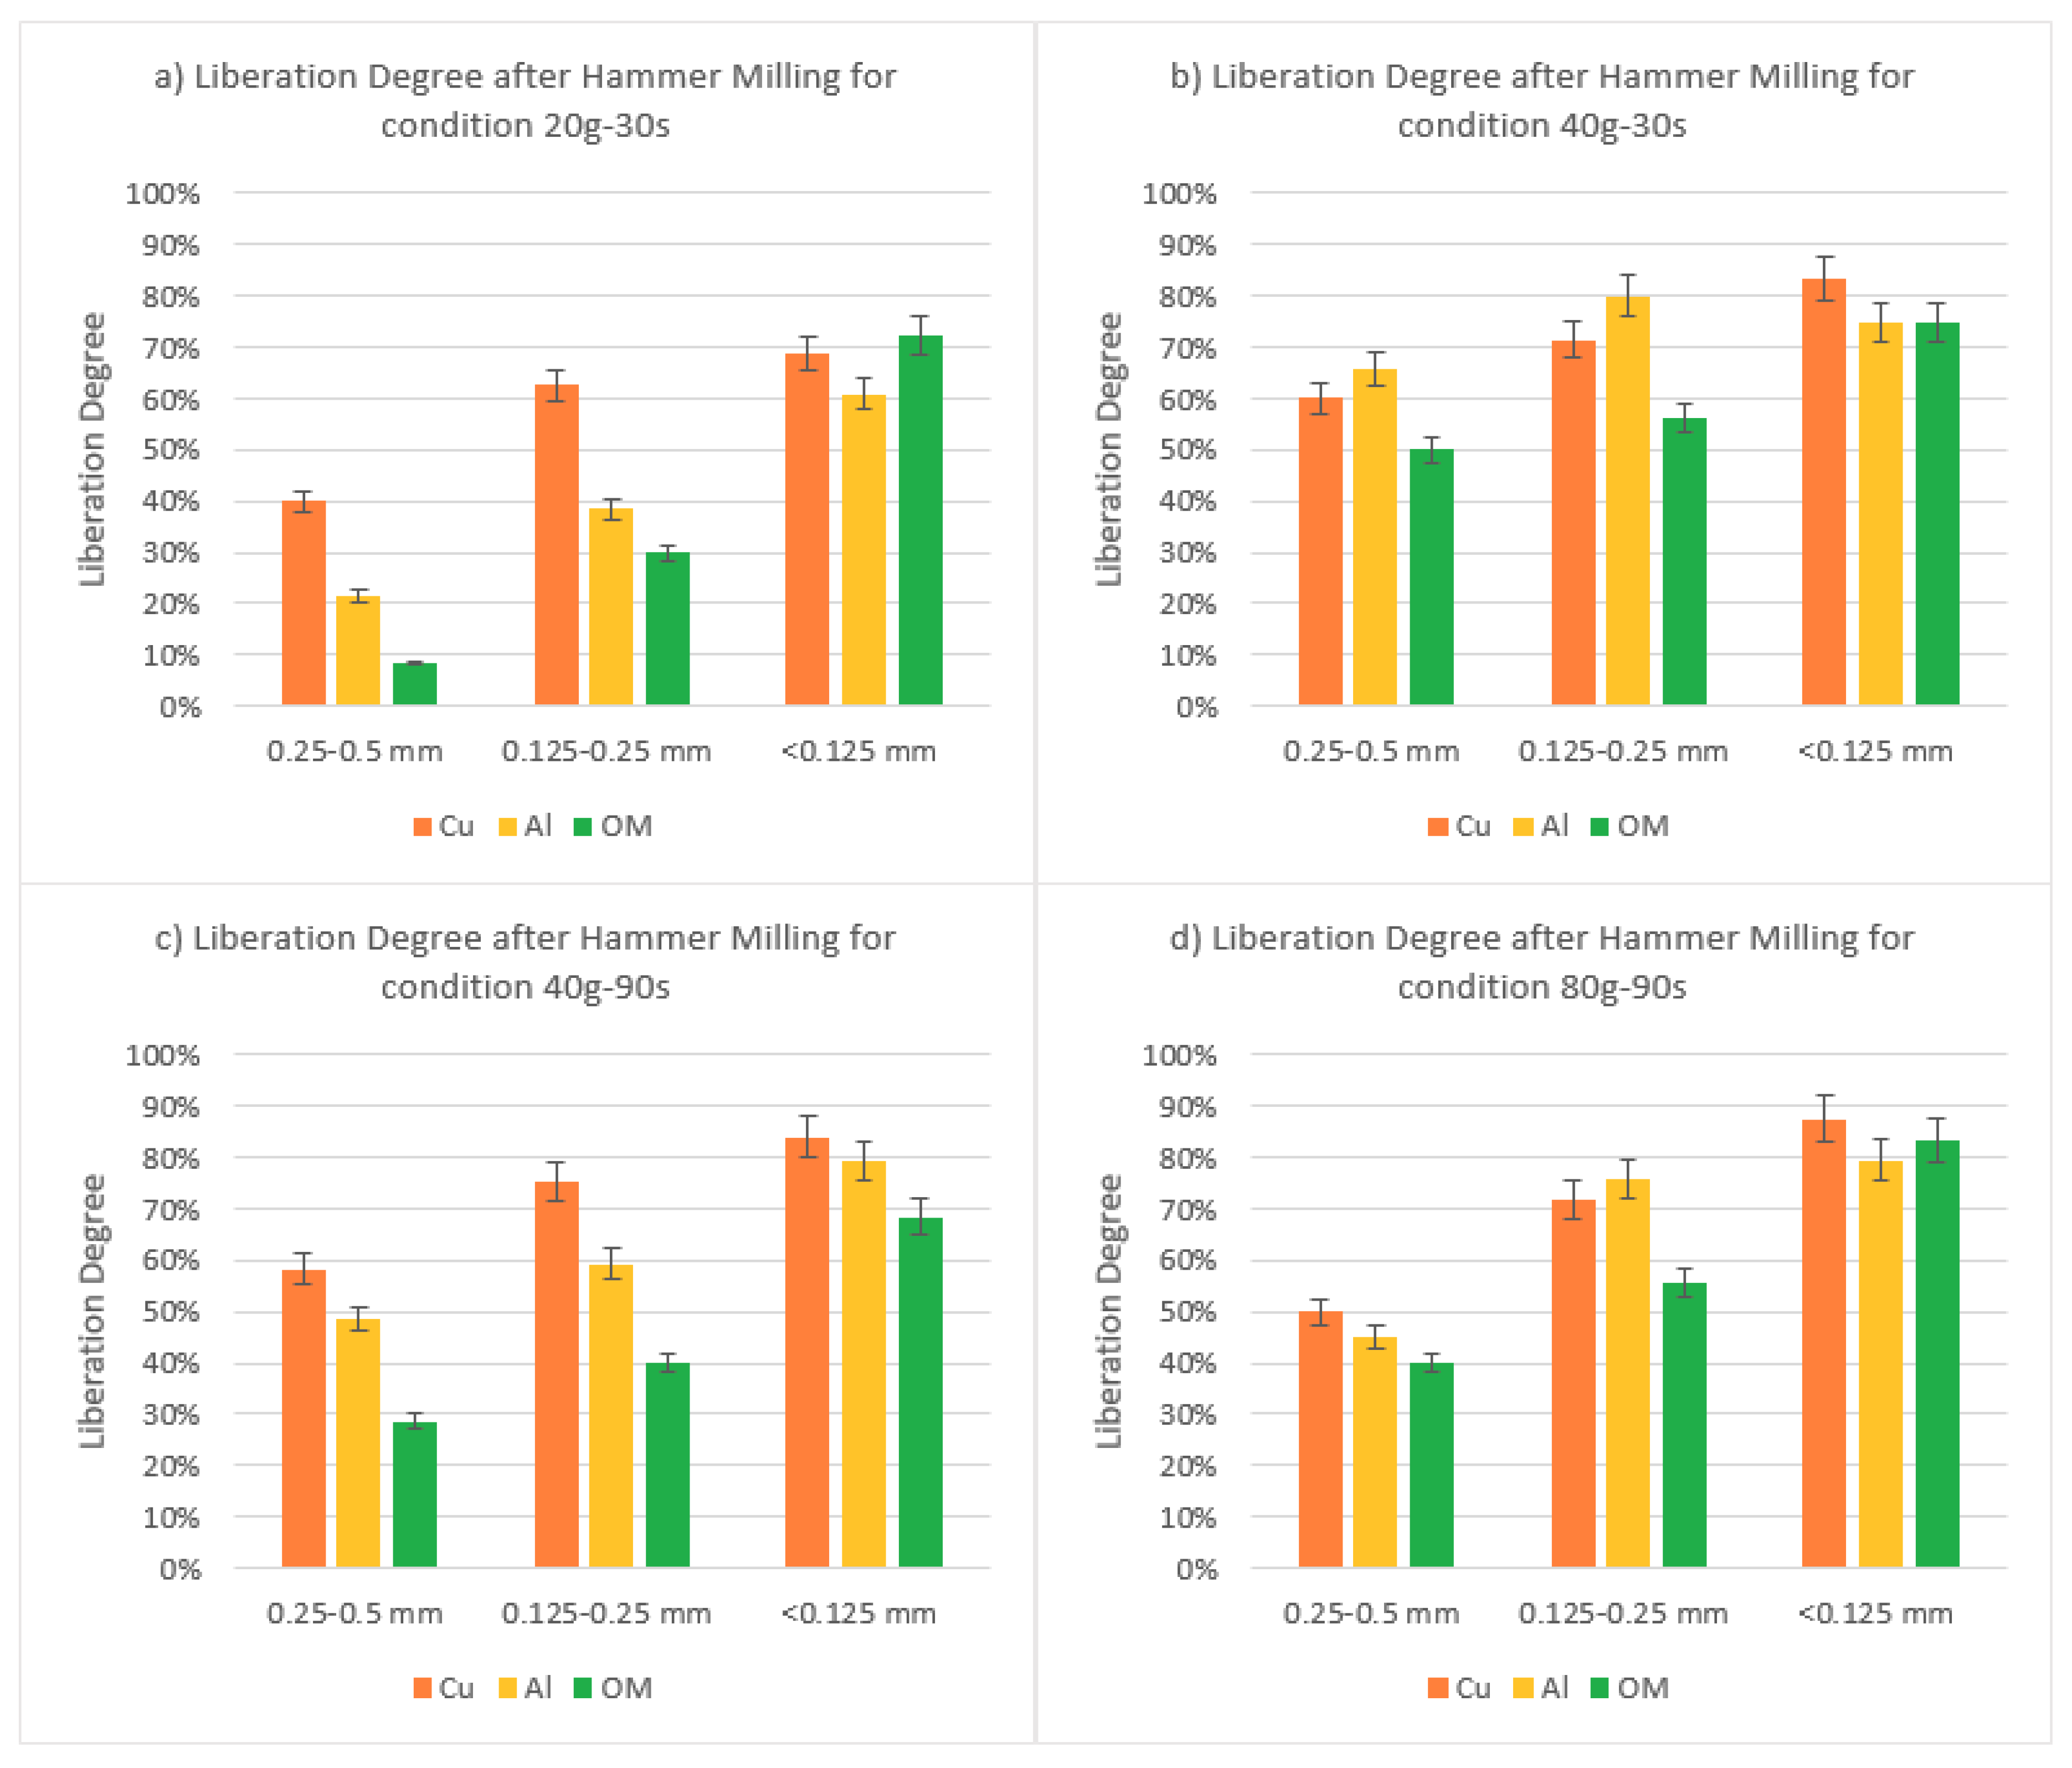
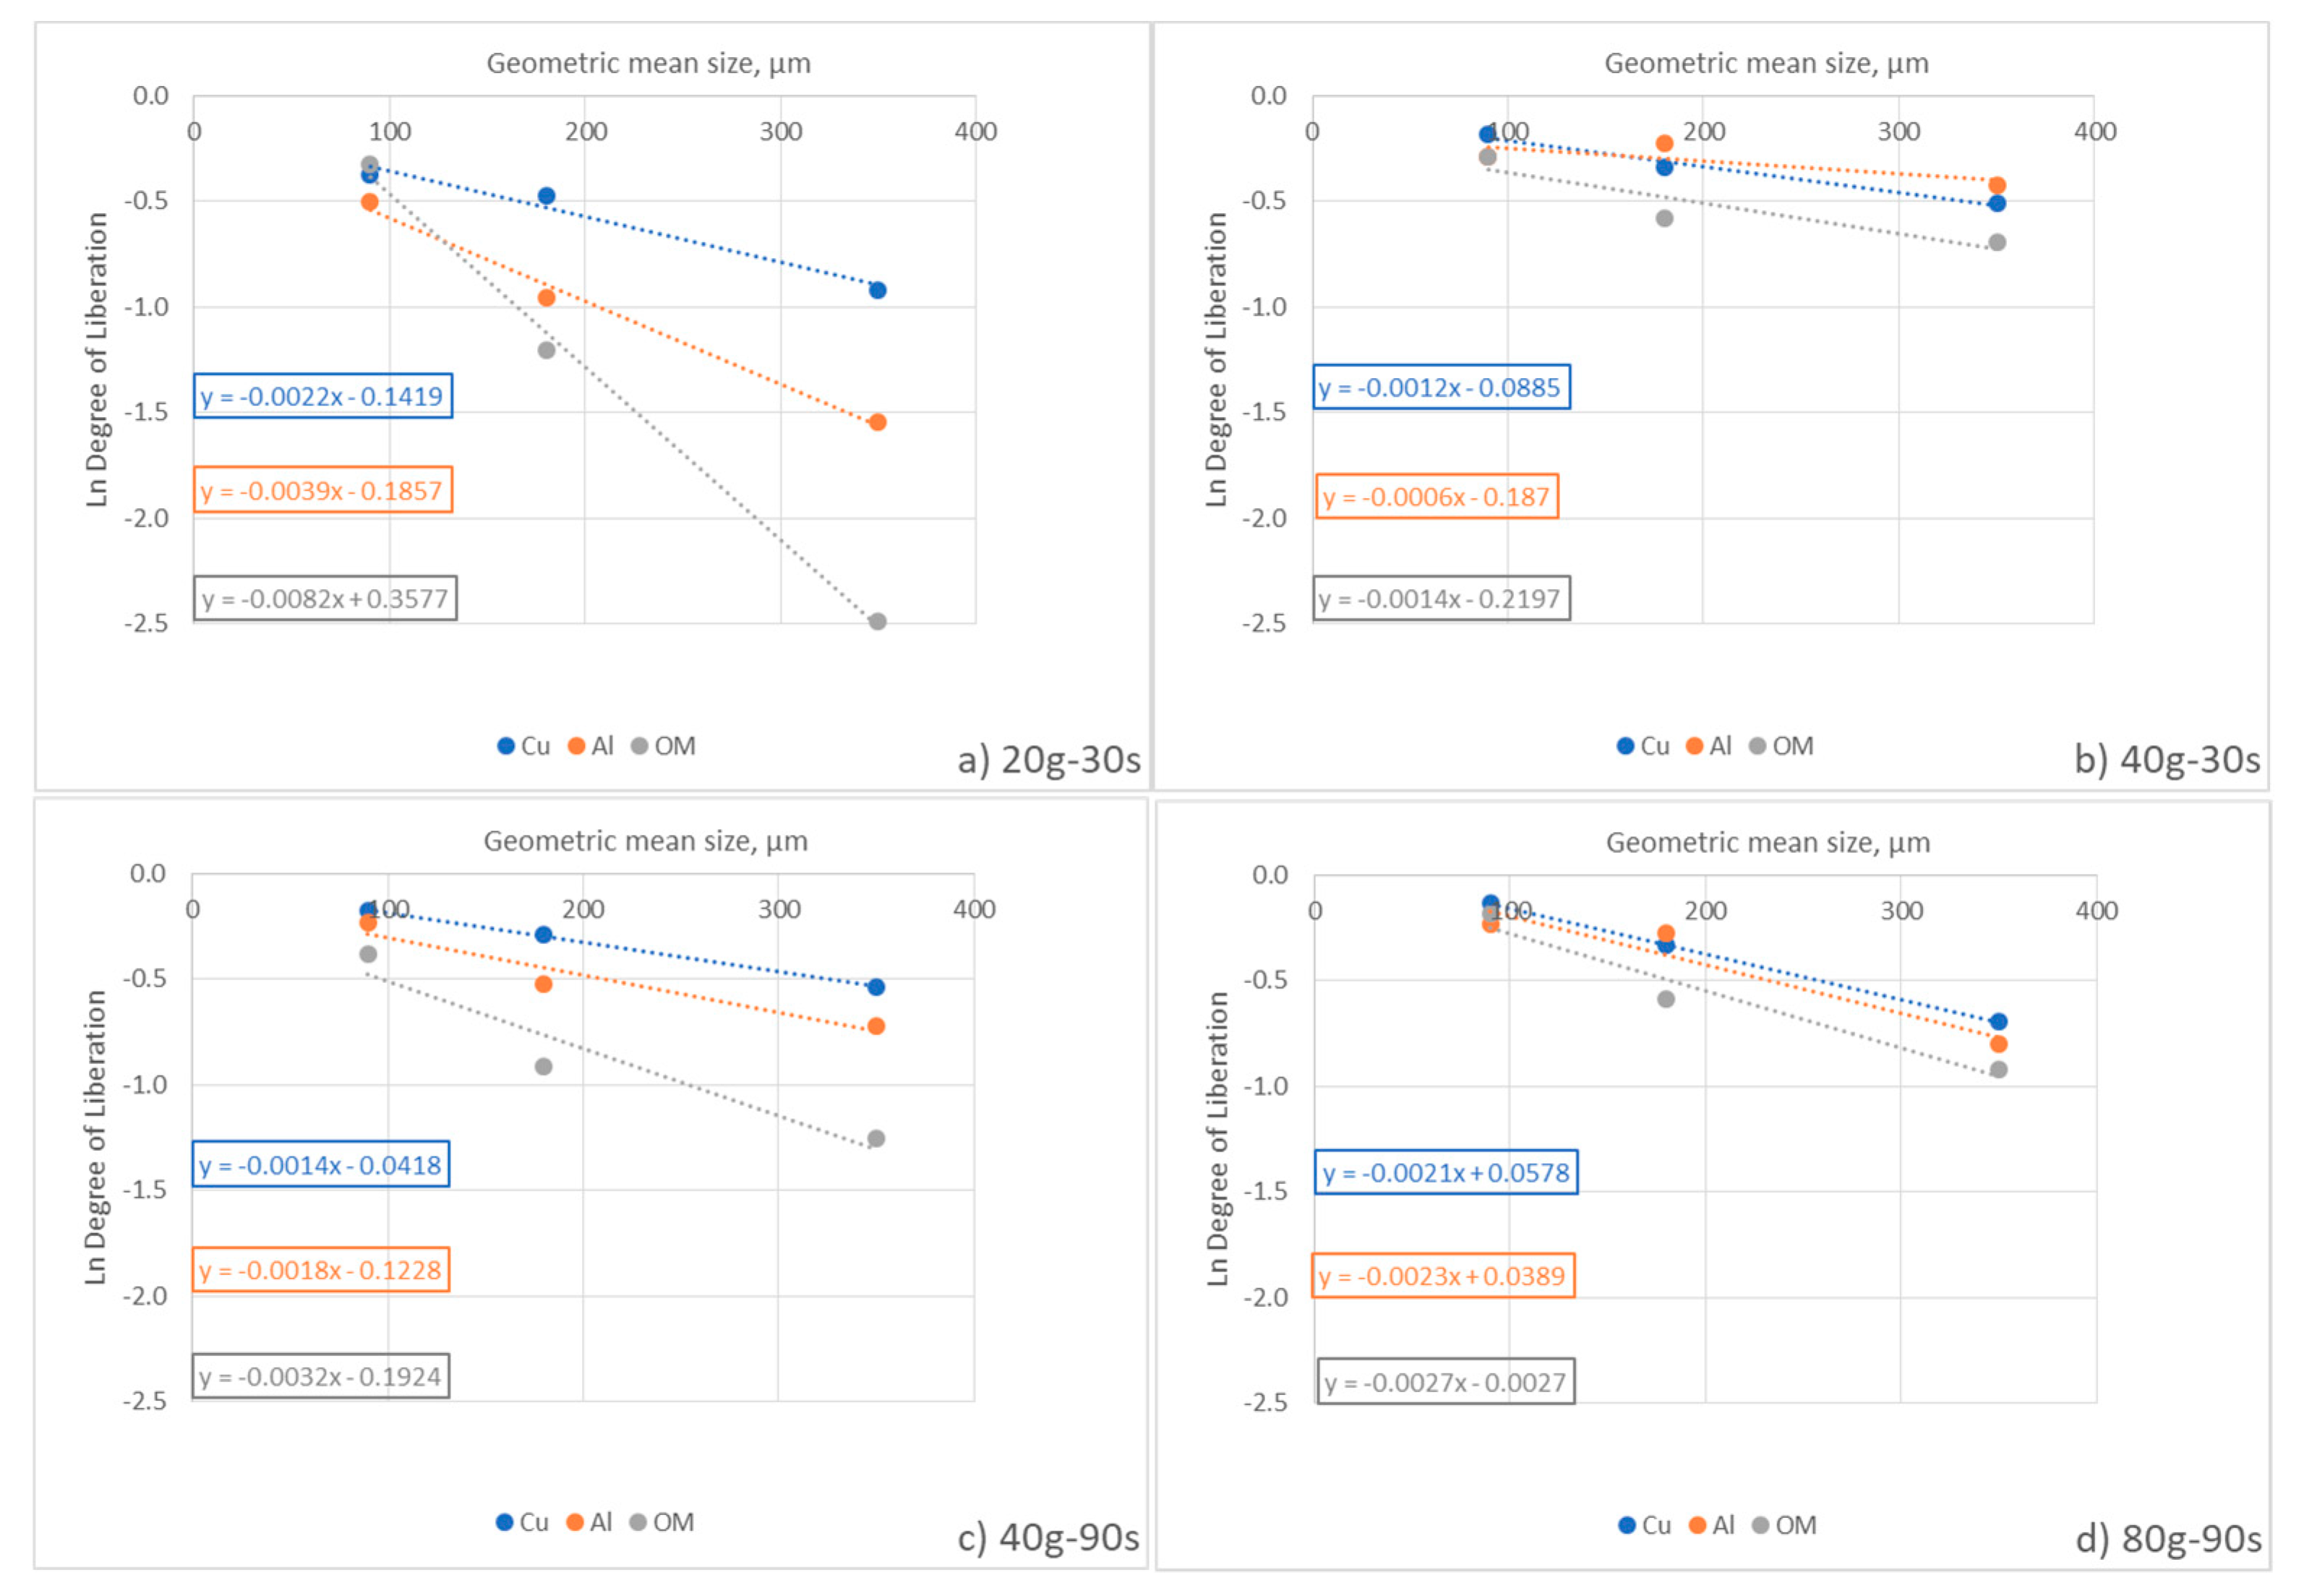
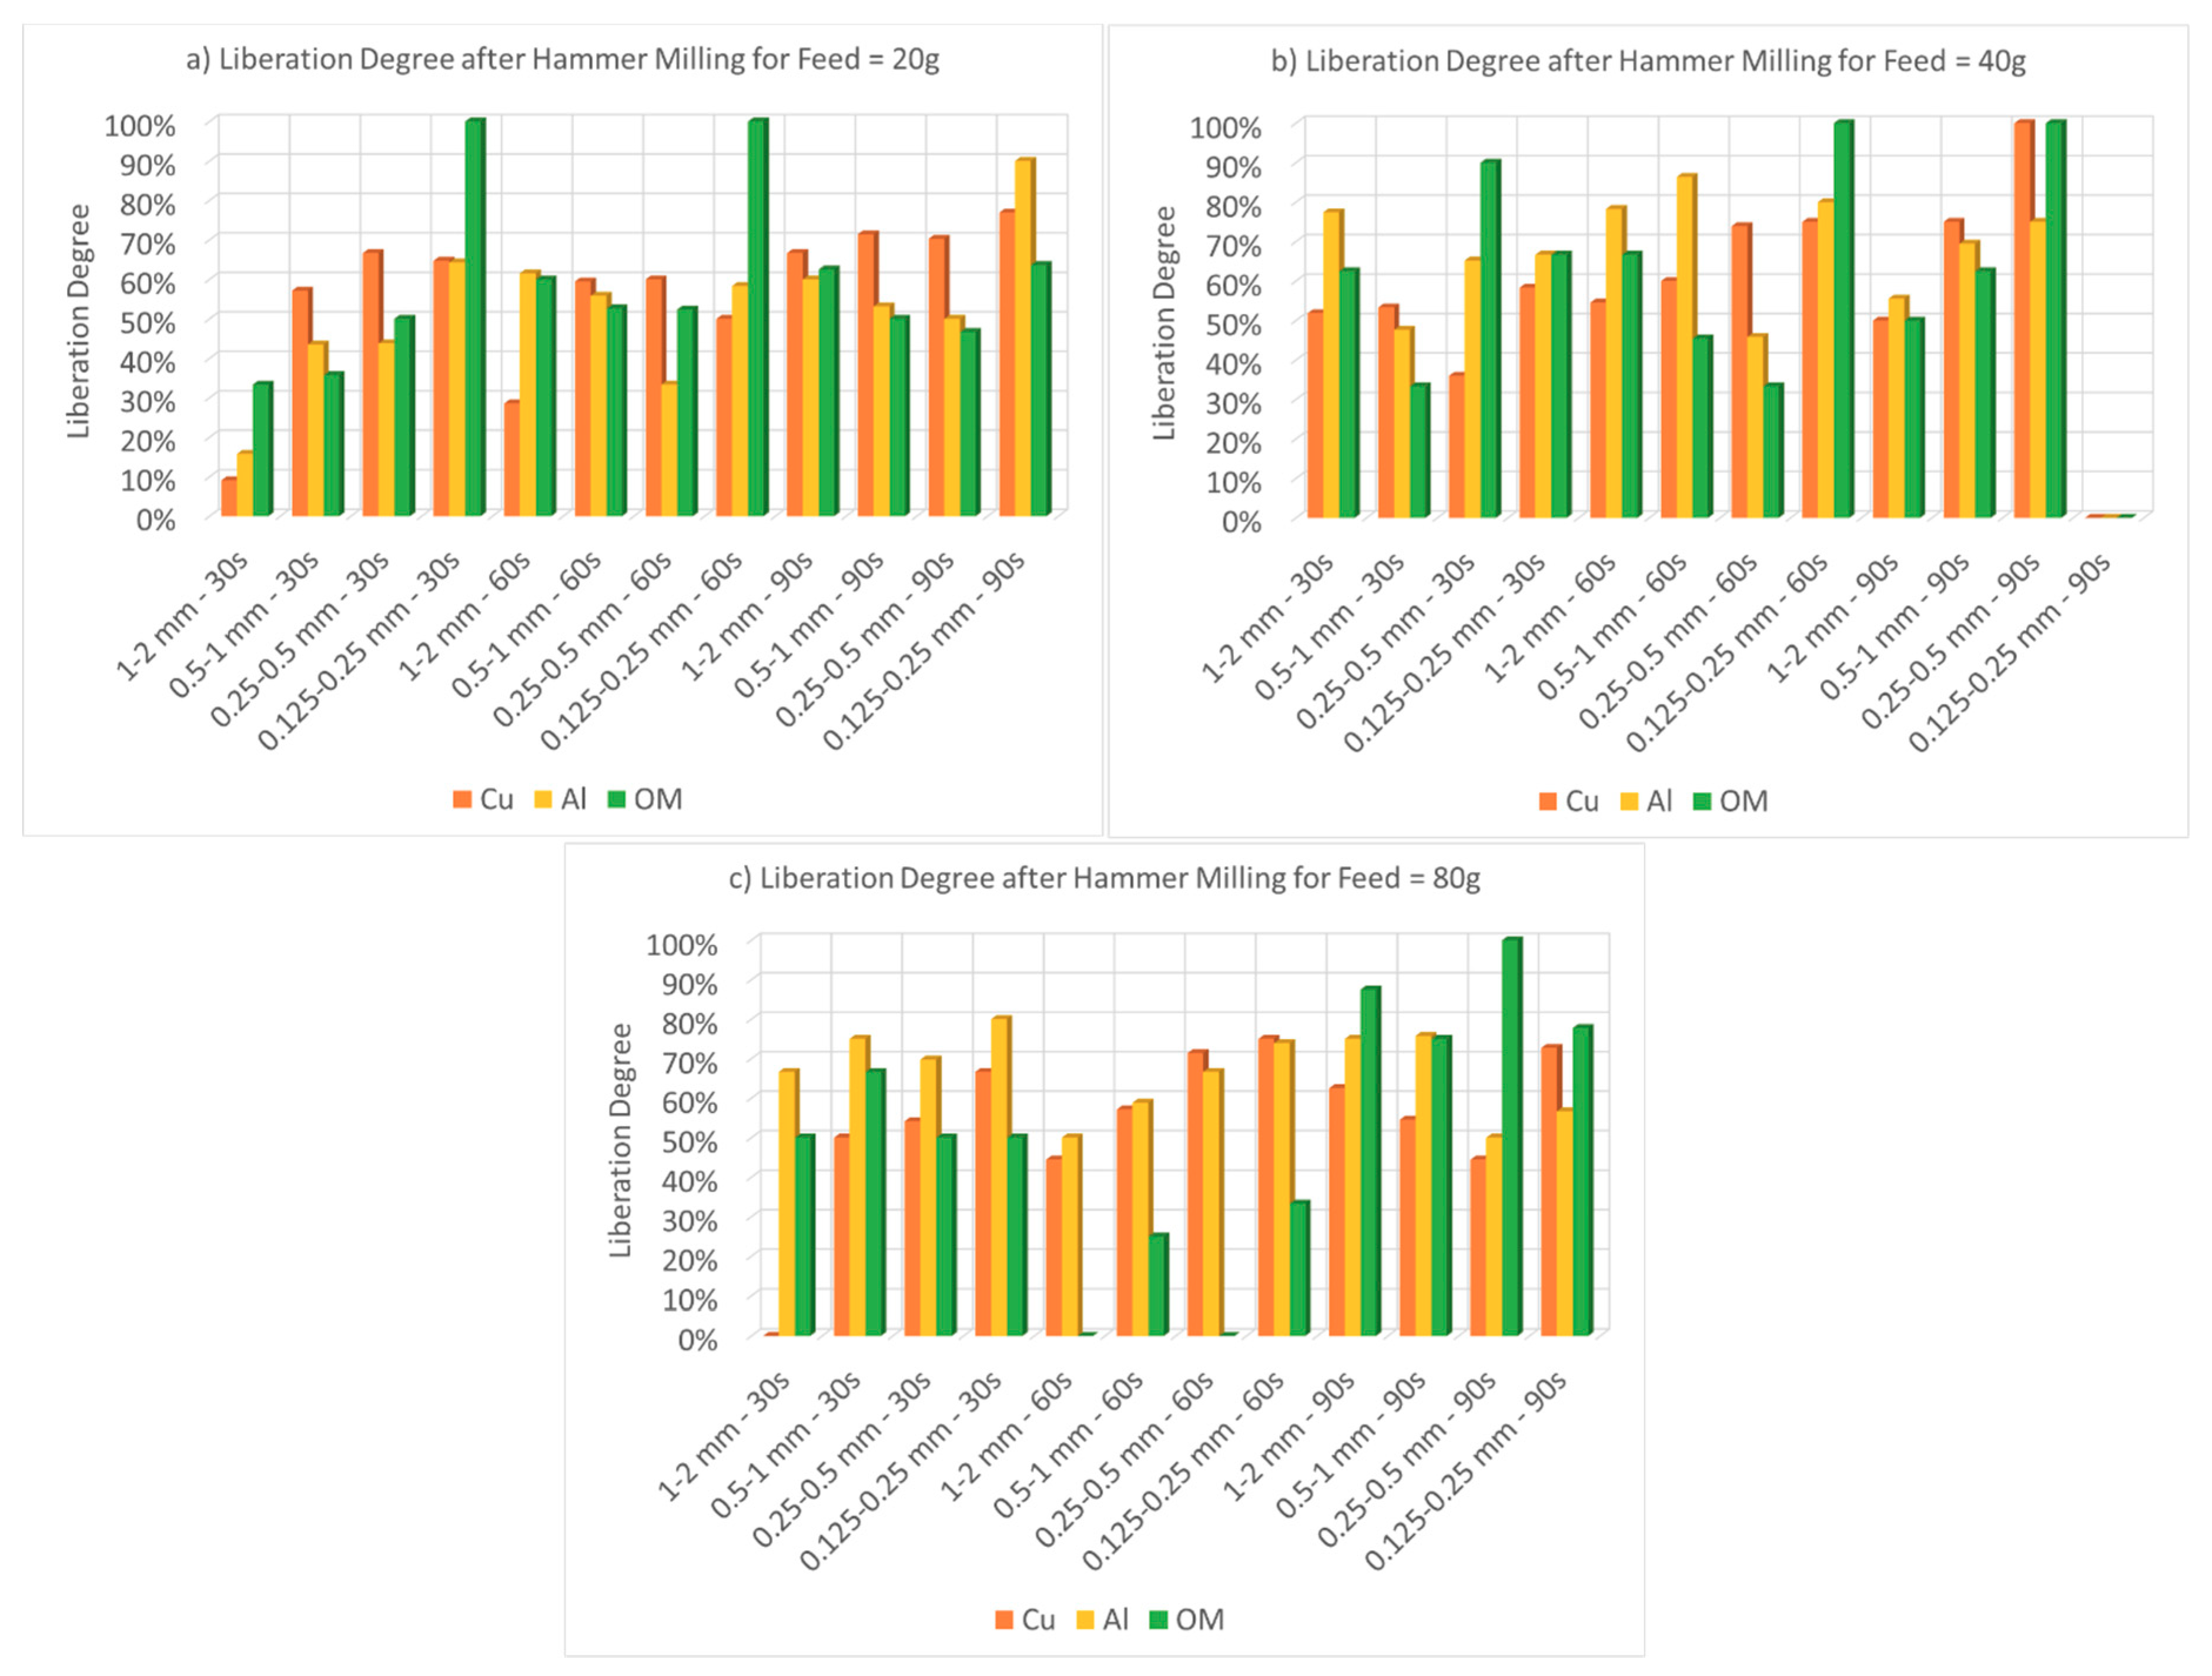
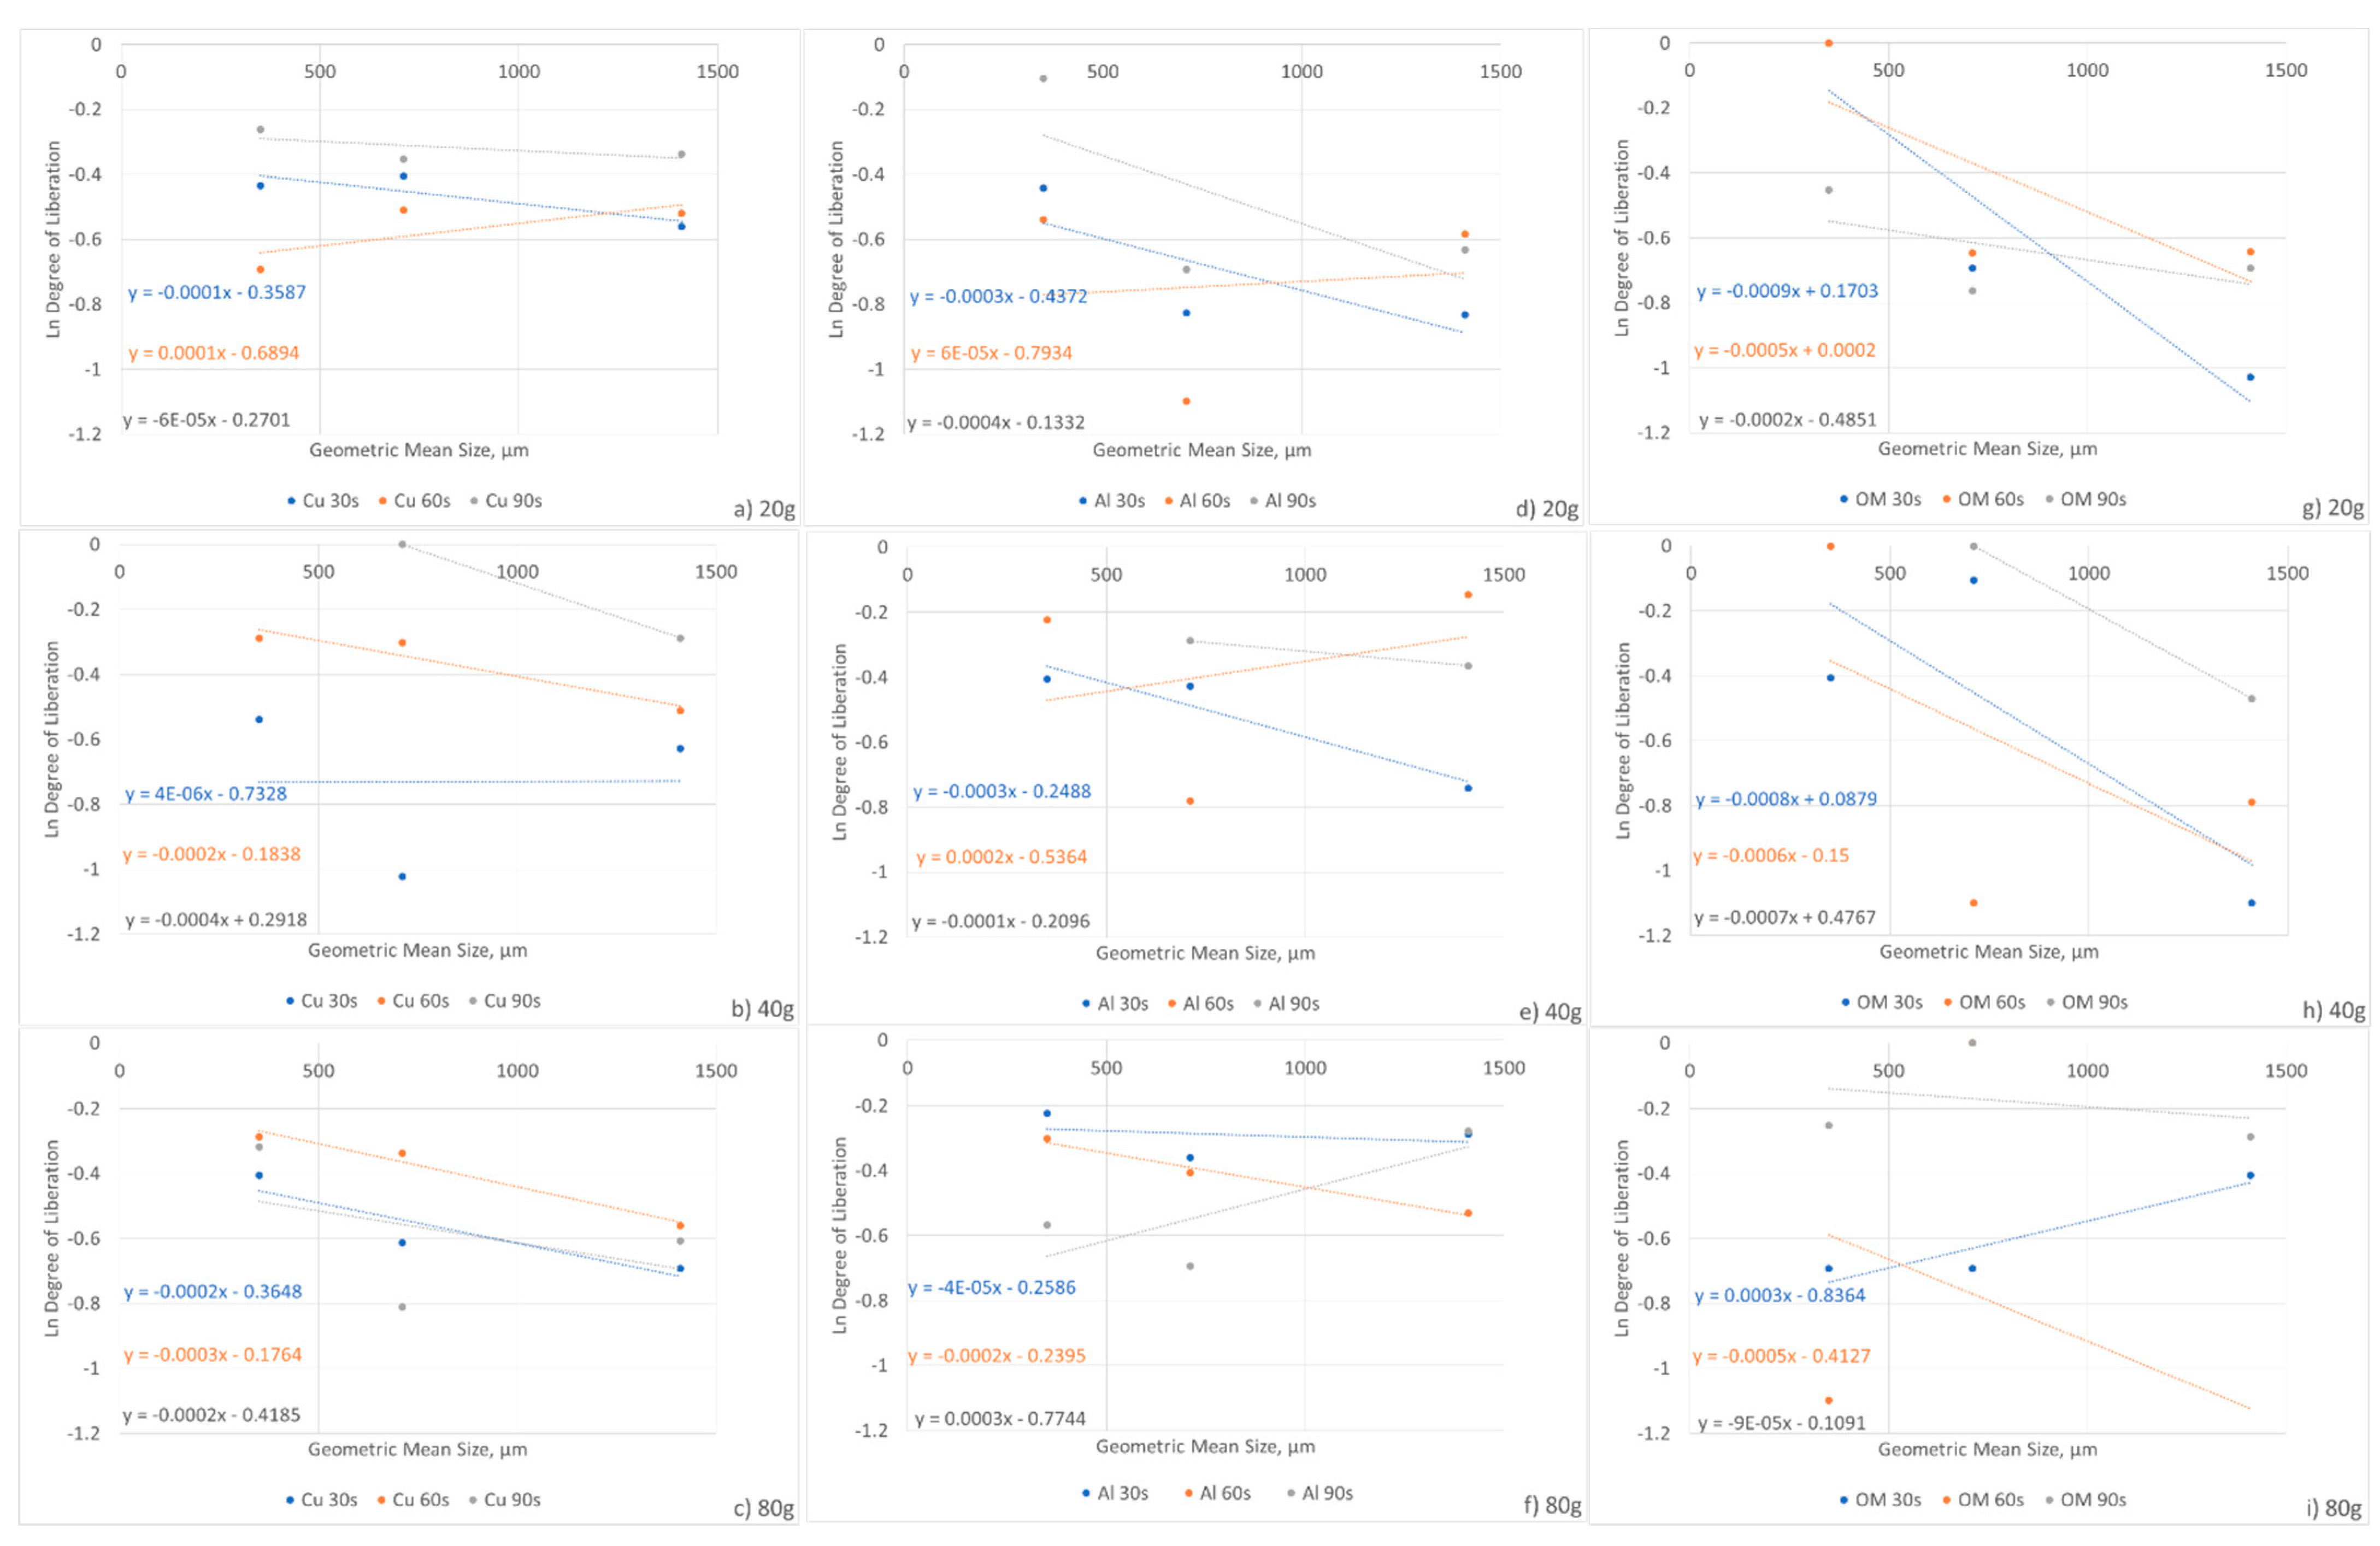
3.1. Determination of Liberation Degree and Parameters

Figure 4 shows the liberation degree determined by BSE images and elemental maps for Cu, Al and other metals, as a function of milling parameters (feed mass, milling time) and product particle size. In general, with the particle size range (below 0.5 mm) studied by this method, there is a clear trend of the increase in degree of liberation with a decrease in particle size. For example, with 80 g feed mass and 90 s milling time (Figure 4d), the Cu liberation degree was 50% in 0.25–0.5 mm fraction, 72% in 0.125–0.25 mm fraction, and 88% in < 0.125 mm fraction.
With less feed mass (i.e., 20 g feed mass and 30 s milling time, Figure 4a), there is a clear liberation degree contrast (40% for Cu, 22% for Al, 8% for other metals) with the coarse size fraction (0.25–0.5 mm) while the contrast diminished (68% for Cu, 60% for Al, 72% for other metals) in the finest size fraction (<0.125 mm) although the values are high. With increasing the feed mass (e.g., 40 g feed mass and 30 s milling time, Figure 4b), the liberation contrast is also hindered. This can be explained by the decrease in the collision probability between particles and hammers, reducing the selective liberation of different metallic components.
Figure 5 was designed to obtain the Liberation parameter ‘K’ aforementioned in the methodology Section 2.2. The natural logarithm of liberation degree for Cu, Al and the other metals were plotted against the geometric mean particle size (µm) for the different feed mass and milling time conditions. The slope for the plots obtained represents −K in Equation (2). In general, the larger the K, the larger the change in degree of liberation. In other words, the size reduction helps increasing the degree of liberation while the smaller the K, the little effect of size reduction on increasing the degree of liberation. The objective of K values determination by linear regression is to test capturing and explaining the liberation degree trend with them.
Figure 5a shows the effect of size reduction on the better liberation with a decrease in particle size. It also indicates the liberation is more enhanced with other metals (K = 0.0082), followed by Al (K = 0.0039) and then Cu (K = 0.0022). With increasing the feed mass to 40 g and 80 g, the liberation contrast among different metals decreased. It is proven by the closer K values among three categories than the K value difference with 20 g. With 40 g feed mass and 90 s milling time, K values were 0.0032 for other metals, 0.0018 for Al and 0.0014 for Cu while with 80 g feed mass and 90 s milling time, K values were 0.0027 for other metals, 0.0023 for Al and 0.0021 for Cu. This trend indicates that with increase in feed mass, the selective liberation is hindered. It can be explained by the less probability of collision between particles and hammers with the higher feed mass, and thus diminishment of liberation contrast among different metals.
Figure 6 shows the liberation degree determined by the digital microscope image analyses, following the methodology described in the Section 2.2.1. There is a clear trend of higher liberation towards the finest fractions analyzed (i.e., 0.125–0.25 mm), and this is true for all the three metals of interest, Cu, Al and the group of other metals. This trend agreed with a previous report [11] with some difference in the absolute value. In the current study, the degree of liberation of at least 50% for these three metals was achieved in the finest fractions analyzed. The influence of milling time variation (i.e., 30, 60 and 90 s) is clearly visible in terms of increasing the liberation degree. For example, the liberation degree of Cu in the size fraction of 1–2 mm for 30 s, 60 s and 90 s were 8%, 27% and 65%, respectively (Figure 6a). With decreasing particle size, the liberation degree increased as agree with the results obtained by SEM-EDS image analysis (Figure 4 and Figure 5). For example, the liberation degree of Cu in the size fraction of 30 s for 1–2 mm, 0.5–1 mm, 0.25–0.5 mm, and 0.125–0.25 mm was 8%, 56%, 65% and 63%, respectively (Figure 6a). The above two trends were obtained with two other metal categories and other feed mass, in general, with some exceptions (e.g., Cu liberation degree decrease with size reduction with 80 g feed due to selective agglomeration, Figure 6c).
Despite being more liberated in the finest fractions in general, our previous studies [12,15] also showed the metals, especially Cu, were often enriched in coarser fractions (e.g., 1–2 mm) explained by selective agglomeration. Hence, the relationship among particle agglomeration, particle liberation and metallic enrichment is aimed to further understand in this study, and should be useful for further beneficiation stages. In our previous selective milling study [15], the optimal operational conditions for selective size reduction and highest recovery of Cu in the finest fractions (0.125–0.250 mm and <0.125 mm) was feed mass (20 g) and milling time (90 s), with 89% copper recovery. Figure 6 shows that such conditions indicate a liberation degree for Cu around 80%, which is not the highest value, but high enough for the product with the high recovery of Cu previously reported [15], for the subsequent beneficiation stages. The conditions for selective agglomeration (taking place in the coarse fractions) were reported as 80 g feed mass and 90 s milling time in our previous work [15], with a recovery of copper at 40% (0.5–1 mm). Figure 6c shows that the liberation degree of Cu in the product size fraction 0.5–1 mm generated under these conditions was around 53%. It indicates the presence of other components than Cu in those agglomerates formed during hammer milling operation although the highest recovery (40%) and enrichment (1.3) of Cu in that size fraction among all the milling conditions tested [15]. A further study of selective agglomeration and selective liberation will be of great interest in terms of practical use of agglomeration as a selective material recovery process.
Figure 7, analogous to Figure 5 for SEM-EDS image analysis, was designed to obtain the liberation parameter ‘K’ aforementioned in the methodology Section 2.2. The natural logarithm of the liberation degree for Cu, Al and the other metals were plotted against the geometric mean particle size (µm) for the different feed mass and milling time conditions. For the digital microscope, the products from all the nine conditions were analyzed. For example, Figure 7g shows that the liberation parameter of other metals is higher with less milling time (K = 0.0009 for 30 s) for 20 g feed than the one with longer milling time (K = 0.0002 for 90 s), indicating the liberation contrast in different size fraction was better with less milling time.
Due to the particle agglomeration discussed and previously reported [12,15], the plot given in Figure 7 that contains the results from coarse size fractions (0.125–2 mm) is more complex than the ones given in Figure 5 that is based on the results from fine size fractions (<0.5 mm) where the agglomerates do not exist. Thus, the general trend will be further discussed with the summary of liberation parameters given in Table 5.
Table 5 summarizes the liberation parameter ‘K’ for the three different metal categories and the different milling conditions analyzed with both digital optical microscope and the SEM-EDS images. In general, the liberation parameter K is higher with less feed mass and less milling time. For example, K determined by digital microscopic image analysis for other metals at 30 s milling time were 0.9 × 10⁻³ (20 g), 0.8 × 10⁻³ (40 g), and 0.3 × 10⁻³ (80 g) while K at 20 g feed mass were 0.9 × 10⁻³ (30 s), 0.5 × 10⁻³ (60 s), and 0.2 × 10⁻³ (90 s). It indicates that with less feed mass and milling time enhanced selective liberation of those metallic components.
Also, in general, the order of K was other metals (0.9 × 10⁻³ (20 g and 30 s)) > Al (0.3 × 10⁻³ (20 g and 30 s)) > Cu (0.1 × 10⁻³ (20 g-30 s)) that reflected the order of facile selective liberation. On the other hand, such a contrast was hindered with higher feed mass and longer milling time (K = 0.09 × 10⁻³ (80 g-90 s) for other metals, K = 0.3 × 10⁻³ (80 g-90 s) for Al, K = 0.02 × 10⁻³ (80 g-90 s) for Cu). The values cited above were K determined by digital microscopic image analysis. The objective of K values determination by linear regression is to test capturing and explaining the liberation degree trend with them, not the absolute values obtained by two different methods. As a result, shown above, we basically found the trend in K values obtained by the both digital microscopic image analysis and SEM-EDS image analysis are the same. As a conclusion, we succeeded to achieve this objective and we confirmed our proposition was valid as shown in the results and discussion. In this sense, the both methods we proposed in this article are reliable while they have some preference in terms of the type of sample. In particular, coarser particle size is preferred with the digital microscope analysis, while fine particle size can utilize the higher magnification capability of SEM-EDS than the other one. In other words, depending on the particle size range, a more suitable method can be selected. On the other hand, if one wishes to evaluate the liberation degree trend of a wide range of particle size, the combination of two methods can give the better idea than the application of either method due to their size preference mentioned above

3.2. Comparison between the Digital Optical Microscope and SEM-EDS Image Analyses

Although not all the products generated by all the milling conditions were observed by using the SEM-EDS, our analysis procedures are hereby compared and summarized in Table 6.
The possibility of analyzing the samples with their natural colors is a valuable advantage for waste PCB studies, while it can be hindered by the artificial colors of BSE images coupled with EDS in the scanning electron microscopy. The major drawbacks when using the digital microscope for the analysis were the time needed for imaging and the particle recognition, depending on the photo quality. Since the digital microscope is not possible to perform an elemental mapping, it is recommended that the particles are coarse enough for the optimal visualization.
It is known from the literature [11] and our previous study [15] that a hammer mill, due to the impact force grinding mechanism, could bundle up and/or encase the liberated metal particles, particularly aluminum, into ball-shaped particles. Such phenomena could mislead the determination of the liberation degree, since plastics/other metals might be aggregated within such ball-shaped particles, hence, it could overestimate the liberation degree of the metallic particles, especially with the digital microscope image analysis. In addition, in general, the stereological bias in 2D sectional analysis [6] might affect the results obtained via both digital microscope and SEM-EDS image analyses.
The SEM is an expensive and more complex equipment to achieve a higher magnification than the digital microscopes. For the applicability to the mechanically processed PCB particles, it can be used for imaging and counting to assess the liberation degree and often for the visualization of particle surface morphology and investigation of particle shapes in a detailed context, due to various detector options applicable to wide range of applications. One more interesting advantage is the semi-quantitative elemental mapping that was used with BSE images and discussed in this paper.
The instrumentation is not exactly hard to manage but the sample preparation procedure requires special care before being placed in the SEM vacuum chamber. An inappropriate sample can result in signal artifacts that could hinder the useful information especially for the X-ray analysis (e.g., from non-flat sample surface).

4. Conclusions

The liberation degree of metal particles in mechanically processed PCBs was analyzed using digital microscopic images in comparison with the analysis of BSE images and elemental maps obtained by SEM-EDS. Results between the two methods showed some similarities and discrepancies. Digital microscopic images can utilize the variety of colors to distinguish different particles while the combination of BSE images with the elemental mapping allows the elemental distribution within the particles in order to calculate the degree of liberation of metallic particles. Results showed that in general liberation degree was higher in finer particle size (selective size reduction) agreed with previous studies, apart from the coarsest fraction (agglomeration). The liberation parameter K also increased with less feed mass and milling time in hammer milling operation, indicating the enhancement of selective liberation under those conditions.
In order to predict selective liberation of the metal components from the non-metallic portion into different size fractions, a model of the liberation parameter ‘K’ based on a 2-level factorial design was attempted. This modelling was not satisfactory, probably due to a lack of a precise data set in a wide range of particle sizes. Especially in coarse size fractions, the higher number of particle counting is recommended. Thus, results are not shown in this paper. Such investigation will be further addressed in a future research.

Author Contributions

Conceptualization, A.O.; methodology, P.P.G. and A.O.; software, P.P.G. and A.O.; validation, P.P.G. and A.O.; formal analysis, P.P.G. and A.O.; investigation, P.P.G. and A.O.; resources, A.O.; data curation, P.P.G. and A.O.; writing—original draft preparation, P.P.G. and A.O.; writing—review and editing, A.O.; visualization, P.P.G. and A.O.; supervision, A.O.; project administration, A.O.; funding acquisition, A.O.

Funding

The authors wish to acknowledge the financial support from the EMerald program.

Acknowledgments

The authors wish to acknowledge the technical support from GeoRessources.

Conflicts of Interest

The authors declare no conflict of interest.

References

  1. Eurostat. Available online: http://ec.europa.eu/eurostat/web/waste/key-waste-streams/weee (accessed on 18 May 2018).
  2. Burat, F.; Özer, M. Physical separation route for printed circuit boards. Phys. Probl. Min. Process. 2017, 54, 554–566. [Google Scholar]
  3. Park, S.; Kim, S.; Han, S.; Kim, B.; Kim, B.; Han, Y.; Park, J. Liberation Characteristics Assessment for Copper Component in PCB Comminution Product by Image Analysis. Mater. Trans. 2018, 59, 1493–1500. [Google Scholar] [CrossRef]
  4. Das, A.; Vidyadhar, A.; Mehrotra, S.P. A novel flowsheet for the recovery of metal values from waste printed circuit boards. Resour. Conserv. Recycl. 2009, 53, 464–469. [Google Scholar] [CrossRef]
  5. Wills, B.; Finch, J.A. Wills’ Mineral Processing Technology: An Introduction to the Practical Aspects of Ore Treatment and Mineral Recovery. In Butterworth-Heinemann; Elsevier: Amsterdam, The Netherlands, 2016. [Google Scholar]
  6. Ueda, T.; Oki, T.; Koyanaka, S. Effect of Particle Shape on the Stereological Bias of the Degree of Liberation of Biphase Particle Systems. Mater. Trans. 2017, 58, 280–286. [Google Scholar] [CrossRef] [Green Version]
  7. Kahn, H.; Mano, E.S.M.; Tassinari, M.M.M.L. Image Analysis Coupled with A SEM-EDS Applied to the Characterization Of A Zn-Pb Partially Weathered Ore. J. Miner. Mater. Charact. Eng. 2002, 1, 1–9. [Google Scholar]
  8. Goodall, W.R.; Scales, P.J. An overview of the advantages and disadvantages of the determination of gold mineralogy by automated mineralogy. Miner. Eng. 2007, 20, 506–517. [Google Scholar] [CrossRef]
  9. Otsuki, A.; Chen, Y.; Zhao, Y. Characterization and beneficiation of complex ores for sustainable use of mineral resources: Refractory gold ore beneficiation as an example. Int. J. Soc. Mater. Eng. Resour. 2014, 20, 126–135. [Google Scholar] [CrossRef]
  10. Otsuki, A. Non-destructive liberation analysis of printed circuit board. In Proceedings of the 16th International Waste Management and Landfill Symposium, Sardinia, Italy, 2–6 October 2017. [Google Scholar]
  11. Zhang, S.; Forssberg, E. Intelligent liberation and classification of electronic scrap. Powder Technol. 1999, 105, 295–301. [Google Scholar] [CrossRef]
  12. Otsuki, A.; Gonçalves, P.P.; Stieghorst, C.; Révay, Z. Non-destructive characterization of mechanically processed waste printed circuit boards: X-ray fluorescence spectroscopy and prompt gamma activation analysis. J. Composite Sci. 2019, 3. [Google Scholar] [CrossRef]
  13. Koyanaka, S.; Endoh, S.; Ohya, H. Effect of impact velocity control on selective grinding of waste printed circuit boards. Adv. Powder Technol. 2006, 17, 113–126. [Google Scholar] [CrossRef]
  14. Chao, G.; Hui, W.; Wei, L.; Jiangang, F.; Xin, Y. Liberation characteristic and physical separation of printed circuit board (PCB). Waste Manag. 2011, 31, 2161–2166. [Google Scholar]
  15. Otsuki, A.; Gonçalves, P.P.; Leroy, E. Selective milling and elemental assay of printed circuit board particles for their recycling purpose. Metals 2019. [Google Scholar] [CrossRef]
  16. Abouzeid, S. Mineral Processing Lab Manual; Trans. Tech. Publications: Clausthal-Zellerfeld, Germany, 1990. [Google Scholar]
Figure 1. Images acquired from the digital microscope Keyence VHX1000 for particle counting. (a). Microscopic image obtained from the printed circuit boards (PCB) milled product condition 80 g and 90 s and size fraction 1–2 mm (Magnification x 30). (b). Inkscape treatment of the images, dots assigned for individual particles following the color coding. (c). Individual particles from each of the six different categories (I–VI) previously mentioned in Table 2.
Electronics 08 01202 g001
Figure 2. Flowsheet of image acquisition and analysis using (a) the Keyence Digital Microscope or (b) the Vega3 TESCAN (SEM coupled with EDS).
Electronics 08 01202 g002
Figure 3. Backscattered electron (BSE) image and elemental maps acquired with VEGA3 TESCAN and the coupled Bruker EDS system. (a) BSE image obtained from the PCB milled product at the condition 80 g and 90 s in addition to a size fraction 0.125–0.25 mm (Magnification x 100). (b) Distribution maps for the individual element C (light blue), Cu (orange), Fe (seafoam green), Al (yellow), Zn (purple), or Au (green).
Electronics 08 01202 g003
Figure 4. Degree of liberation determined by the SEM-EDS image analysis. (a) Feed = 20 g, Milling Time = 30 s; (b) Feed = 40 g, Milling Time = 30 s; (c) Feed = 40 g, Milling Time = 90 s; (d) Feed = 80 g, Milling Time = 90 s.
Electronics 08 01202 g004
Figure 5. Ln (degree of liberation determined by SEM-EDS image and elemental mapping analysis) plot as a function of geometrical mean. (a) Cu, Al and OM–20 g feed and 30 s milling time, (b) Cu, Al and OM–40 g feed and 30 s milling time, (c) Cu, Al and OM–40 g feed and 90 s milling time, and (d) Cu, Al and OM–80 g feed and 90 s milling time.
Electronics 08 01202 g005
Figure 6. Degree of Liberation determined by the digital microscope image analysis. (a) Feed = 20g; (b) Feed = 40 g and (c) Feed = 80 g. For Feed = 40 g, no metallic particles were identified in the size fraction 0.125–0.25mm. Error values are up to 5%.
Electronics 08 01202 g006
Figure 7. Ln (degree of liberation determined by the digital microscope image analysis) plot as a function of geometrical mean. (a) Cu-20 g feed, (b) Cu-40 g feed, (c) Cu-80 g feed, (d) Al-20 g feed, (e) Al-40 g feed, (f) Al-80 g feed, (g) other metals-20 g feed, (h) other metals-40 g feed, and (i) other metals-80 g feed.
Electronics 08 01202 g007
Table 1. Hammer milling conditions selected for the acquisition of images and elemental maps by using the SEM/energy dispersive spectroscopy (EDS).
Feed Mass (g)Milling Time (s)
2030
4030
4090
8090
Table 2. Color coding system assigned for the six different particle types counted with the Inkscape software.
CategoryColor CodingColor
I - Liberated Cu#008000Green
II - Non-liberated Cu#00FF00Lime
III - Liberated Al#800080Purple
IV - Non-liberated Al#FF00FFFuchsia
V - Liberated Other Metals#800000Maroon
VI - Non-liberated Other Metals#FF0000Red
Table 3. Number of metallic particles counted for each image corresponding to samples of each different size fraction and different feed mass x grinding time condition.
Feed Mass-Milling Time (g-s)/Particle Size (mm)1–20.5–10.25–0.50.125–0.25
20 g-30 s36512735
20 g-60 s43994115
20 g-90 s21498444
40 g-30 s66605854
40 g-60 s37485015
40 g-90 s1552120
80 g-30 s20487921
80 g-60 s25292630
80 g-90 s80597561
Table 4. Number (Nb) of particles counted for each image corresponding to polished sections bearing particles of different size fractions for the following experimental conditions: 20 g and 30 s; 40 g and 30 s; 40 g and 90 s, and 80 g and 90 s.
Experimental Condition (Feed Mass-Milling Time)20 g-30 s40 g-30 s
Size Range, mm0.25–0.50.125–0.25<0.1250.25–0.50.125–0.25<0.125
Magnification50x100–200x1000x50x100–200x1000x
Nb images/sample4–53–424–53–42
Nb of particles analyzed5139786512334
Experimental Condition
(feed mass-milling time)
40 g-90 s80 g-90 s
Size Range, mm0.25–0.50.125–0.25<0.1250.25–0.50.125–0.25<0.125
Magnification50x100–200x1000x50x100–200x1000x
Nb images/sample4–53–424–53–42
Nb of particles analyzed665368418443
Table 5. Liberation parameters of major metals obtained for the products generated at different milling conditions, determined by digital microscope and SEM-EDS image analysis. ‘n.d. = not determined’.
Feed Mass (g)Milling Time (s)Liberation Parameter, k (x 10−3)
Digital MicroscopeSEM-EDS
CuAlOMCuAlOM
20300.10.30.92.23.98.2
20600.10.060.5n.d.n.d.n.d.
20900.060.40.2n.d.n.d.n.d.
40300.0040.30.80.61.21.4
40600.20.20.6n.d.n.d.n.d.
40900.40.10.71.41.83.2
80300.20.040.3n.d.n.d.n.d.
80600.30.20.5n.d.n.d.n.d.
80900.020.30.092.12.32.7
Table 6. Advantages and drawbacks of liberation degree analysis of mechanically processed printed circuit boards (PCB) particles by using digital microscope and SEM-EDS.
Digital MicroscopeSEM-EDS
AdvantagesDrawbacksAdvantagesDrawbacks
Feasible to directly manipulate particles on a petri dish prior to image acquisition, in order to confirm whether particles are simply overlapped or actually locked.Results are dependent on the skills of the operator and prior knowledge about the sample to be analyzed.Combination of BSE images and elemental maps can solve more complex associations.SEM is more expensive, large and must be housed in an area free of any possible electric, magnetic or vibration interference.
Easy to use. Images with natural colors.Time consuming for image acquisition and analysis.Feasible to reveal information regarding texture and chemical composition.Special care must be taken with sample preparation and equipment parameters such as the beam control.

