1. Introduction
Ultrasound mid-air haptics (UMAH) is a technology that enables users to experience the feeling of touch without direct physical contact and has been gaining significant attention due to its versatile applications. Recently, its potential has been explored in various fields and contexts, including human–computer interaction (HCI; e.g., touchless controls and haptic icons), virtual and augmented reality (VR and AR; e.g., mid-air feedback during virtual object interaction) [
1,
2], automotive user interfaces (e.g., gesture-controlled infotainment) [
3,
4], and digital advertising (e.g., interactive digital signage) [
5].
UMAH generate a feeling of touch using focused ultrasound waves generated by an array of ultrasound transducers. The phases of different ultrasound waves are individually controlled in a way that the acoustic pressure of the different waves converge at a certain location in space (i.e., focal point). At this focal point, mechanoreceptors in the skin (e.g., Pacinian corpuscles, Meissner corpuscles, Ruffini endings, and Merkel cells) are stimulated by the acoustic radiation forces of ultrasound waves [
6,
7], resulting in perceptible sensations.
While UMAH is a versatile and promising technique, it has its limitations. First, the perceptible strength of UMAH is small. Hoshi et al. [
8] describe a total tactile force of ≈16 mN. This is only a small fraction of the force that physical hardware buttons produce (e.g., 1.5 N, [
9]). A second important limitation is related to safety. Ultrasound exceeds the range of human hearing, and dangerous levels of ultrasound might go undetected since they do not cause discomfort that warns the user. Within a focal point, pressure can reach more than 140 dB [
10,
11,
12]. To mitigate these potential risks, safety measures are incorporated in available devices limiting the pressure levels of ultrasound. These limitations are based on recommendations from [
13,
14], which recommend a limit of pressure levels of 100 dB for the general public. These limitations impose constraints on all applications of UMAH. Consequently, it becomes essential to understand how users perceive UMAH under these restricted conditions. To address this, we investigate user experience (UX) through neural markers.
Neural responses to somatosensory stimulation provide an objective way to assess perception under these limitations. Electroencephalography (EEG) is commonly used to measure such responses, as tactile stimulation elicits transient somatosensory evoked potentials (SEPs). Lehser et al. [
15] demonstrated that UMAH can generate SEPs similar to those produced by vibrotactile stimulation (VTS), suggesting comparable neural processing. More recently, Almasu et al. [
16] further showed that spatio-temporally modulated UMAH can elicit intensity-dependent transient SEPs. Specifically, they reported that a negative N275 component and a positive P450 component showed larger absolute amplitudes and stronger phase synchronization at higher stimulation intensities. Their behavioral results followed a similar pattern, as participants more reliably discriminated between intensity levels that also produced distinct SEP amplitudes. Together, these findings indicate that EEG can capture perceptually meaningful neural responses to UMAH.
Beyond SEPs, steady-state potentials (i.e., sinusoidal brain responses to sinusoidally modulated stimuli) [
17] offer another promising approach due to their 1-on-1 mapping between stimulation frequency and neural oscillation. While steady-state visual and auditory potentials have been widely studied, their somatosensory counterpart (i.e., steady-state somatosensory evoked potentials, SSSEPs) remains less explored. For example, Brickwedde et al. [
18] showed that repetitive pneumatic stimulation at 20 Hz elicits SSSEPs at the same frequency in the primary somatosensory cortex (S1). Stimulation around the 20 Hz range was found to yield the largest signal-to-noise ratios (SNR) for SSSEPs, and matches the preferred frequency range for the S1 [
18,
19,
20].
Building on these findings, we examine whether UMAH can evoke SSSEPs and how these responses reflect UMAH interface experience. Using VTS as a benchmark, we first sought to replicate established SSSEP effects in the S1 using a custom-built VTS device. We then examined whether SSSEPs are also present in stimulus types with reduced stimulation intensity, including matched-intensity VTS and full-intensity UMAH stimulation (maximum intensity under current safety regulations). Matched-intensity refers to matching the VTS intensity to the UMAH stimulus using per-participant perceived intensity matching, allowing us to compare SSSEPs in both stimulus types with subjectively similar intensities. Based on previous SSSEP work with contact stimulation, we hypothesized that full-intensity VTS would elicit robust contralateral SSSEPs, whereas reduced-intensity VTS would result in attenuated responses reflecting differences in stimulus intensity. Given evidence that UMAH can elicit perceptually meaningful transient cortical responses, we additionally examined whether full-intensity UMAH would be sufficient to evoke detectable 20 Hz SSSEPs under the constraints of a commercially available device.
2. Materials and Methods
2.1. Participants
A total of thirty-two participants were recruited through social media groups and mailing lists. Six participants were excluded from the final sample: two participants due to incomplete recordings, three due to technical artifacts that could not be removed during preprocessing, and one for performing the experiment incorrectly. The final sample comprised 26 participants (18 female, 8 male; = 26, = 4.31). Participants received a monetary compensation of EUR10 upon completing the experiment.
No a priori power analysis was conducted. The final sample size was determined by the feasibility of recruiting participants for a time-intensive EEG study involving three stimulation blocks and a calibration procedure. To clarify the statistical sensitivity of the final group size, we conducted a sensitivity power analysis for the final sample. With , , and a two-sided paired comparison, the study had 80% power to detect effects of approximately . For correlations, the same sample size provided 80% power to detect associations of approximately .
2.2. Apparatus
EEG data were recorded using the commercially available eegoTM64 amplifier (ANT Neuro bv., Hengelo, The Netherlands) using a sampling frequency of 512 Hz with an EEG cap with 65 electrodes (64 EEG channels, 1 EOG channel) following the extended 10–20 system.
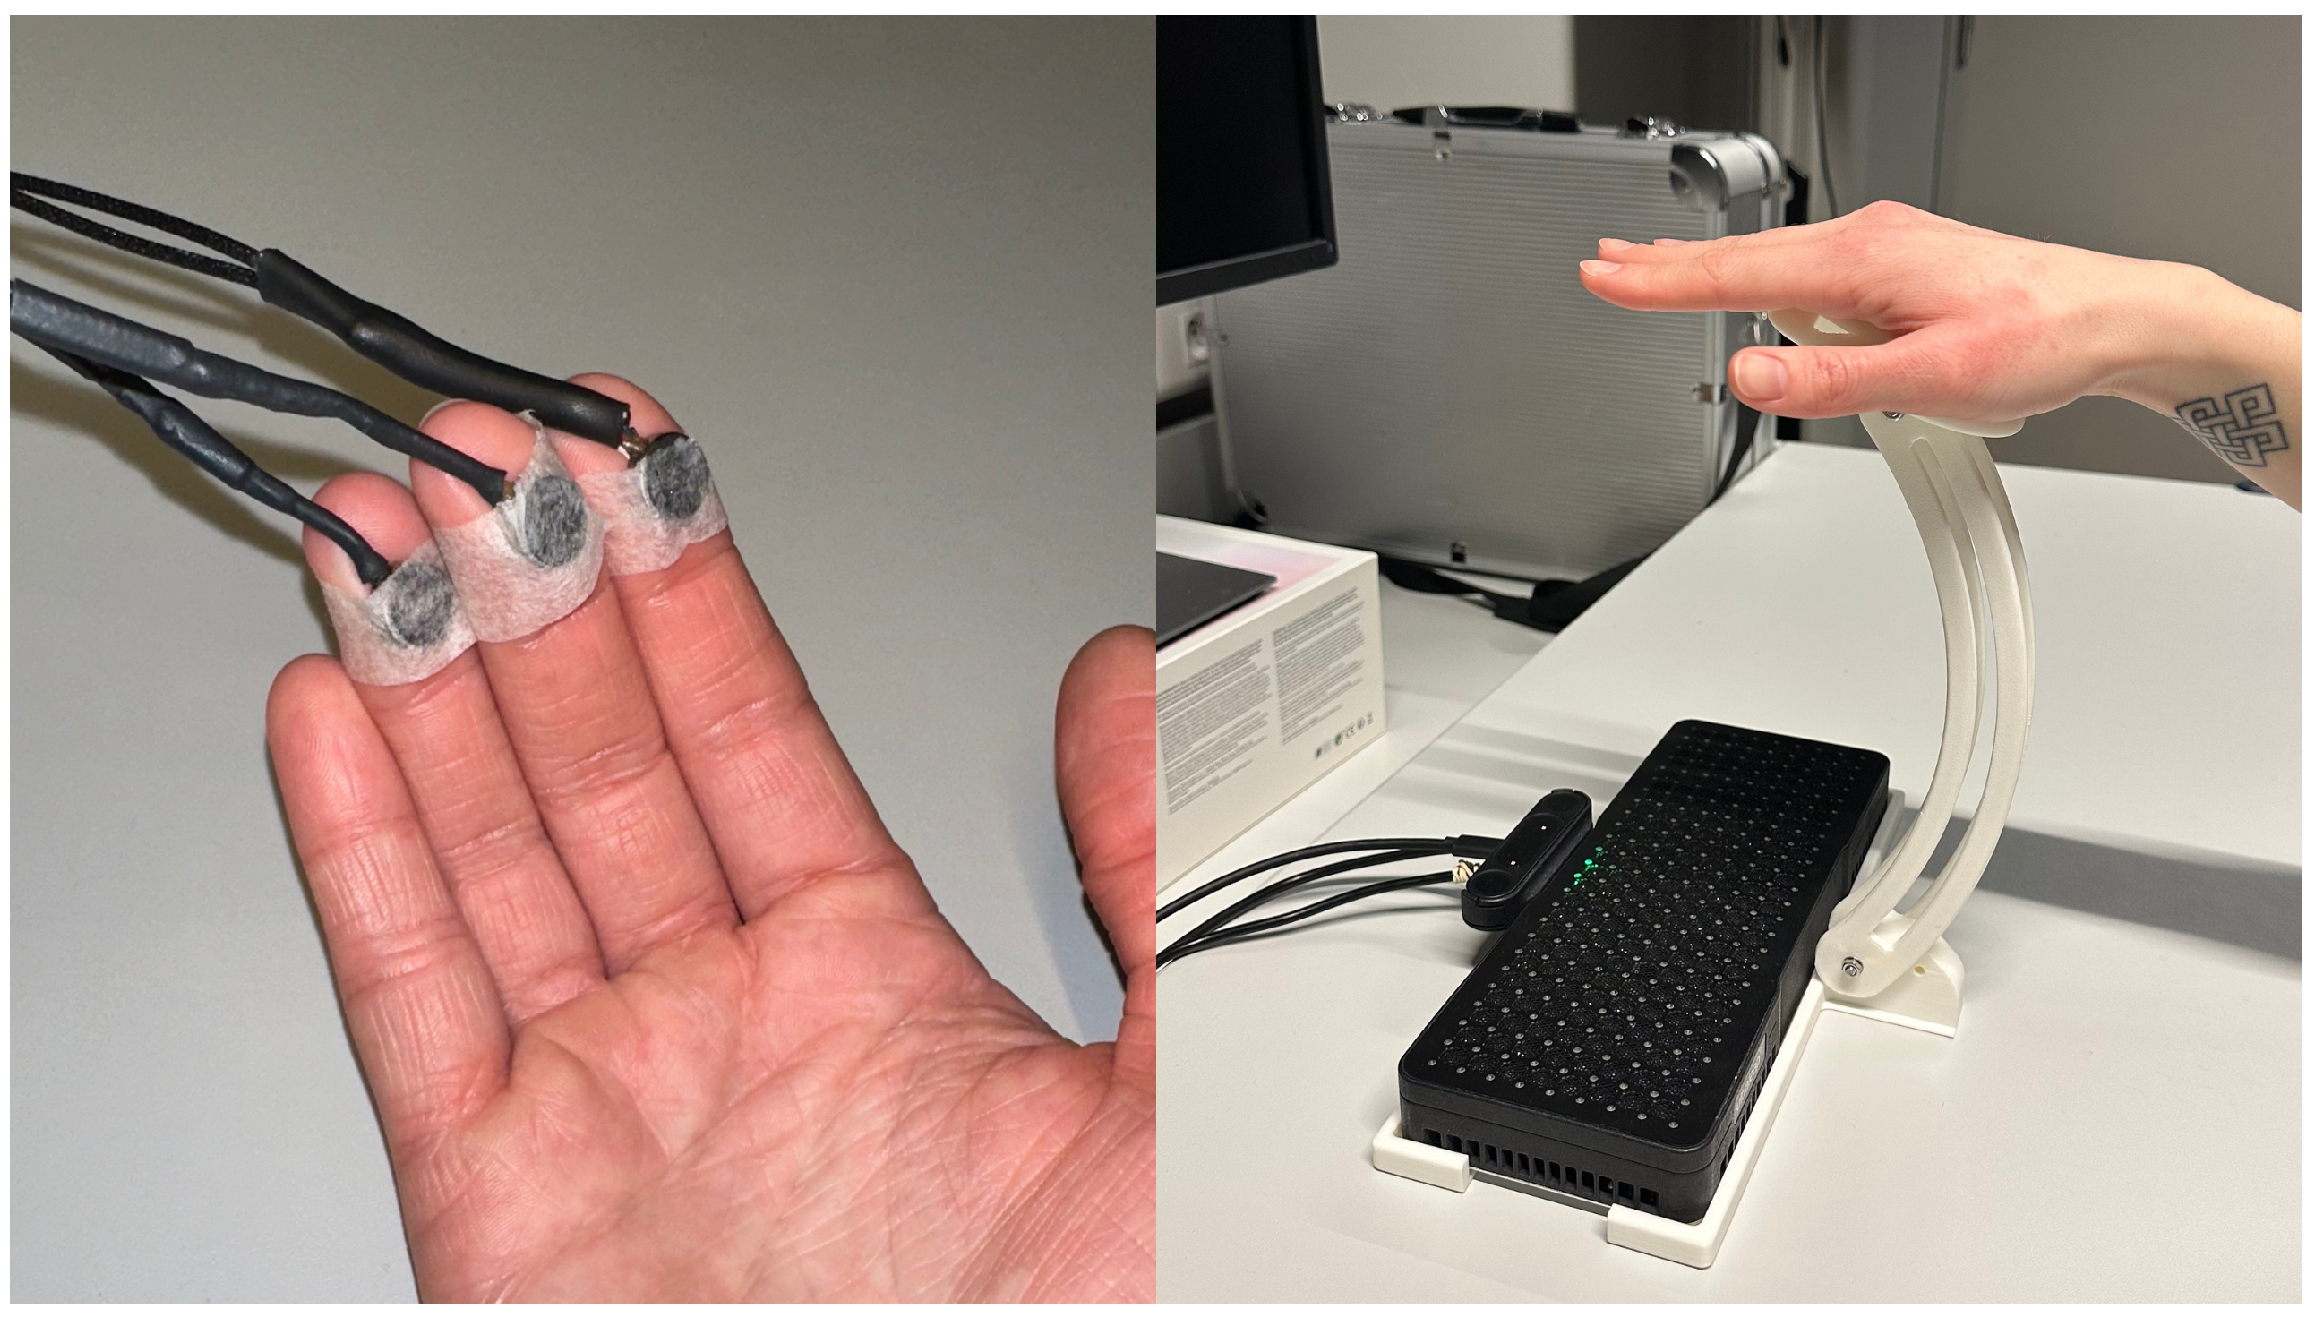
VTS was delivered by a custom-built device consisting of a microcontroller (Arduino Uno R3; Arduino S.r.l., Monza, Italy) connected to three linear resonant actuators (LRAs; Precision Microdrives C10-100, 10 mm diameter, 4 mm type; Precision Microdrives Limited, London, UK). The actuators were driven by a dedicated LRA driver board (Adafruit DRV2605L; Adafruit Industries, New York, NY, USA) in real-time playback mode. Stimulation onset was triggered by the experimental computer through USB serial communication. The actuators were positioned at the ventral side of the distal phalanges of the index, middle, and ring fingers of the right hand. They were held in place using tape to ensure consistent contact.
UMAH stimulation was delivered using the Ultraleap Haptics Development Kit (HDK REC192; Ultraleap Limited, Bristol, UK) which consists of an array of 190 ultrasonic transducers (Murata MA4-0S4S). Hand tracking, necessary to locate the stimulation area, was performed using the integrated Leap Motion Controller 2 (Ultraleap Limited, Bristol, UK). The haptic device was controlled through Unity and the sensation was designed in the Sensation Designer software v1.0.1 provided by Ultraleap (Ultraleap Limited, Bristol, UK). UMAH stimulation was delivered to the right hand.
2.3. Stimuli
During the experiment, participants received repetitive sensory stimulation with 20 Hz pulses. The VTS sensation was designed as a periodic burst pattern at 20 Hz. Each cycle consisted of a 20 ms vibration burst followed by a 30 ms pause. The VTS amplitude was held constant within each burst and trial. VTS intensity for the matched-intensity stimulus type was subjectively chosen by the participants on a 0–100 scale, this value was converted to one of 52 ordered amplitude steps before being sent to the Arduino-controlled DRV2605L driver. The 52-step resolution reflected the single-character serial command protocol used in the experimental setup, in which alphabetic command symbols were used to encode the available stimulation levels. These command symbols were mapped with driver intensity value
using
, where
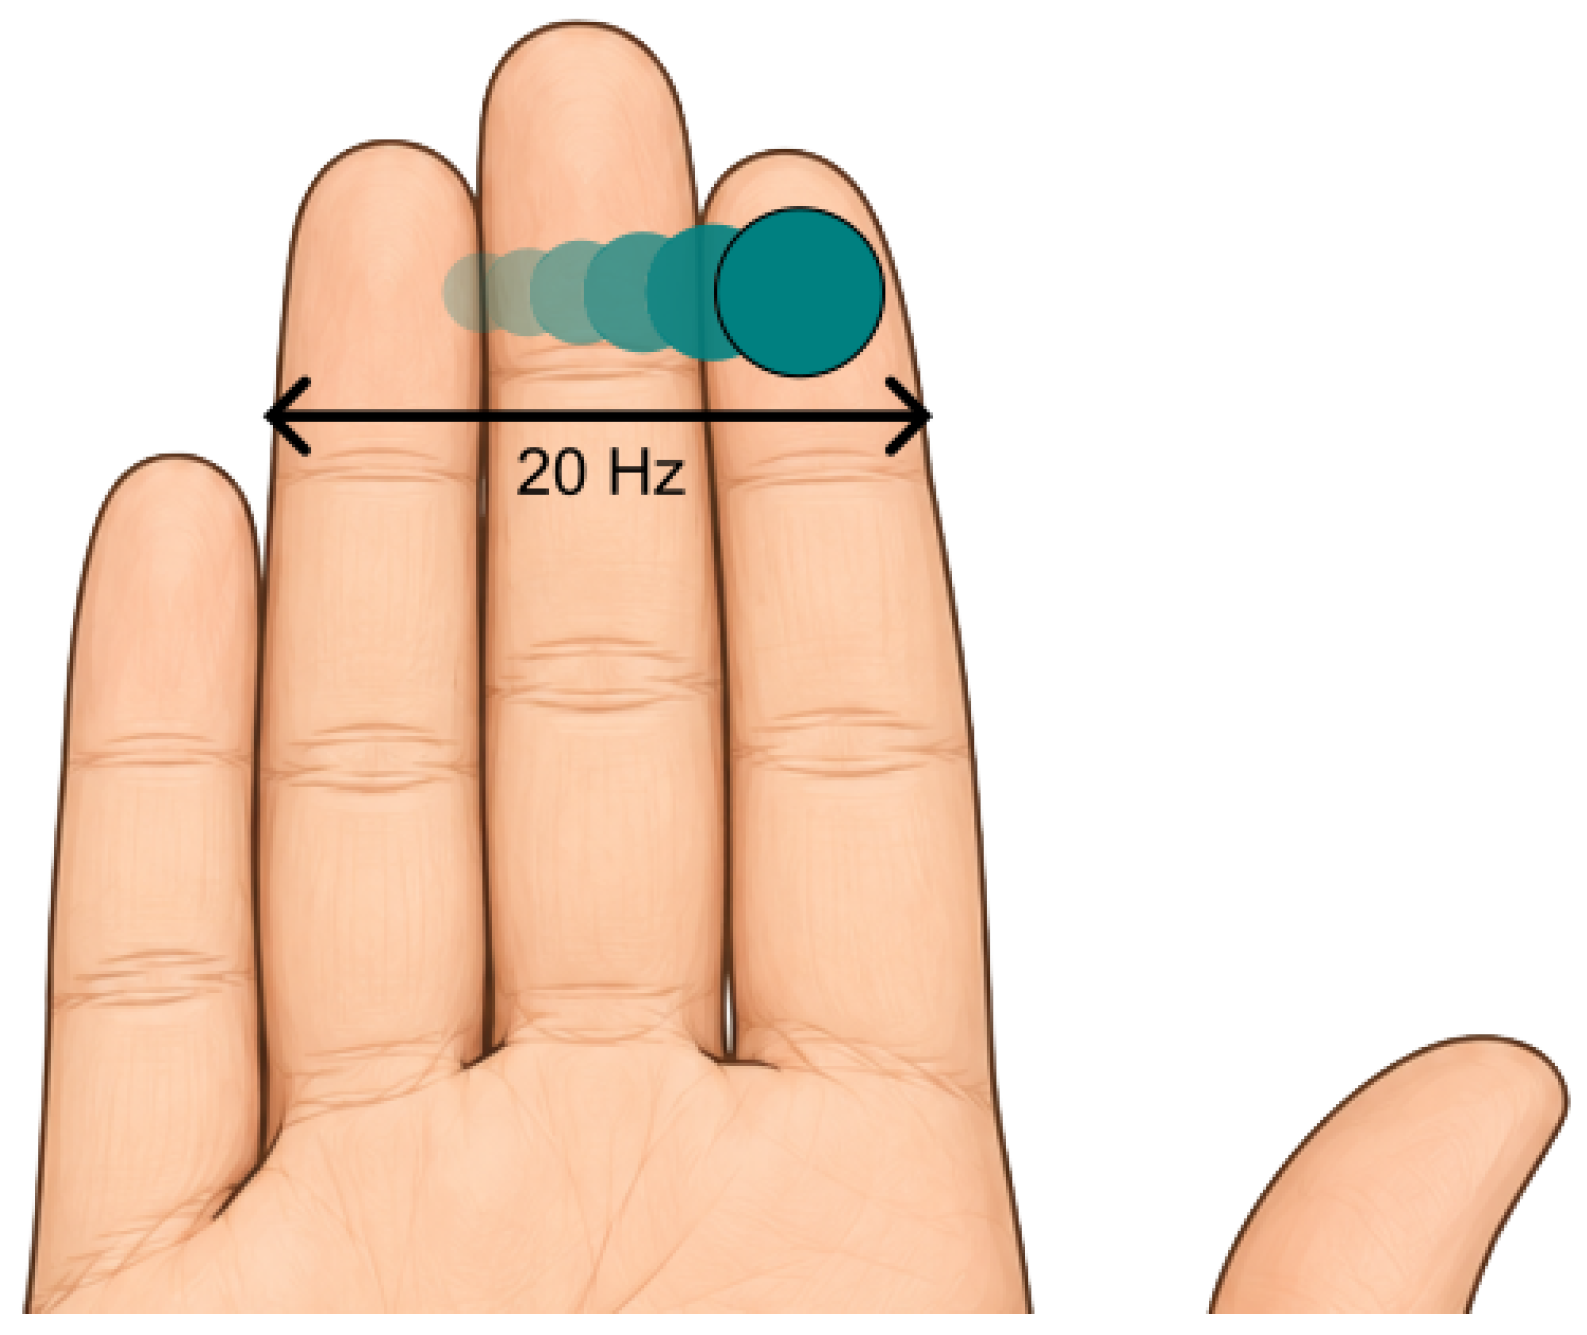
is the selected step index. UMAH sensations were delivered as a spatio-temporal focal stimulus using a Sensation Designer export. The sensation used a primitive brush with a draw frequency of 20 Hz and constant envelope intensity. The focal point moved back-and-forth across the index, middle, and ring fingers at a 20 Hz interval (see
Figure 1). The focal point was hand-tracked and focused to the middle finger with an offset of approximately 11 mm along the finger axis. Stimulation was delivered at the maximum intensity configured in Sensation Designer and looped continuously during each 2 s trial until stopped by the Unity experiment software. A detailed overview of Sensation Designer settings can be found in
Table A1.
The stimulation protocol was adapted from [
18] and consisted of 2000 ms of 20 Hz stimulation with a 5000 ms inter-stimulus interval. The experiment consisted of three blocks with different stimulation types: (1) VTS at maximum intensity for replication purposes (VTS), (2) VTS matched to the intensity of the UMAH stimulation (matched-intensity VTS), and (3) UMAH stimulation with maximal achievable intensity. During stimulation blocks, all participants were shown an identical nature documentary video that is publicly available online, following the protocol from [
18].
2.4. Procedure
Upon arrival, participants filled out an informed consent form. Then, participants were seated in front of the experimental computer. The first part of the experiment consisted of an online questionnaire (Qualtrics) in which participants provided demographic information and answered questions about examples of VTS and UMAH stimulation (these data were, however, not included in the analyses). Following the questionnaire, the EEG sensors were applied to the participant. Next, participants were provided with a 5-min block (45 trials) of VTS set at maximum intensity. Following this block, participants performed a calibration procedure in which they subjectively matched the VTS intensity to that of the UMAH device. Participants used both hands (left: VTS, right: UMAH) simultaneously to gauge the intensity of both stimulation types, while the experimenter altered the VTS intensity (scale 0–100) based on feedback from the participants until they reported the intensity to match. This value determined the matched-intensity VTS. Across included participants, the final matched-intensity VTS value was
,
on the 0–100 calibration scale, with values ranging from 36 to 65. After completing the calibration procedure, the next block was presented. To control for potential order effects, even-numbered participants were presented with the full-intensity UMAH stimulation block first followed by the matched-intensity VTS block, and vice versa for odd-numbered participants. Each block consisted of 174 trials. Upon completing the experiment, participants provided information for monetary compensation. During the UMAH condition, the fingers of the participant were held in place at ≈22 cm using a custom 3D-printed hand support, see
Figure 2.
The unequal number of trials across blocks reflected the different roles of the blocks in the design. The full-intensity VTS block was included as a shorter replication and positive-control block to verify that the setup could elicit a robust 20 Hz SSSEPs. In contrast, the matched-intensity VTS and UMAH blocks were the main comparison of interest and therefore contained more trials to increase the stability of the frequency-domain estimates for these lower-intensity or non-contact stimulation conditions.
2.5. Data Analyses
EEG preprocessing was performed using Python 3.12 and statistical analyses using R 4.5.2. The raw EEG data were bandpass-filtered with cut-off frequencies of 0.1 and 40 Hz and re-referenced to the average signal. The filter range was chosen to retain the 20 Hz stimulation response while attenuating slow drifts and high-frequency activity outside the frequency range of interest, following common filtering practices for electrophysiological data [
21,
22]. Due to the generally high SNR in SSSEP analyses, preprocessing was limited to the exclusion of the T7, T8, M1, and M2 electrodes due to consistent noise, followed by visual epoch-level quality control. No automatic amplitude- or probability-based rejection threshold was applied. Instead, epochs were rejected manually when visual inspection indicated clear technical or physiological artifacts that would compromise the frequency-domain estimate. These included epochs with absent or flat signal, signal dropout or amplifier/electrode failure, abrupt discontinuities or clipping, and epochs with excessive broadband noise or movement-related artifacts affecting multiple channels. A total of 162 (
; per participant:
,
) of trials were excluded from the analyses. A more detailed overview of epoch rejection per stimulus type and per participant can be found in
Table A2 and
Table A3, respectively.
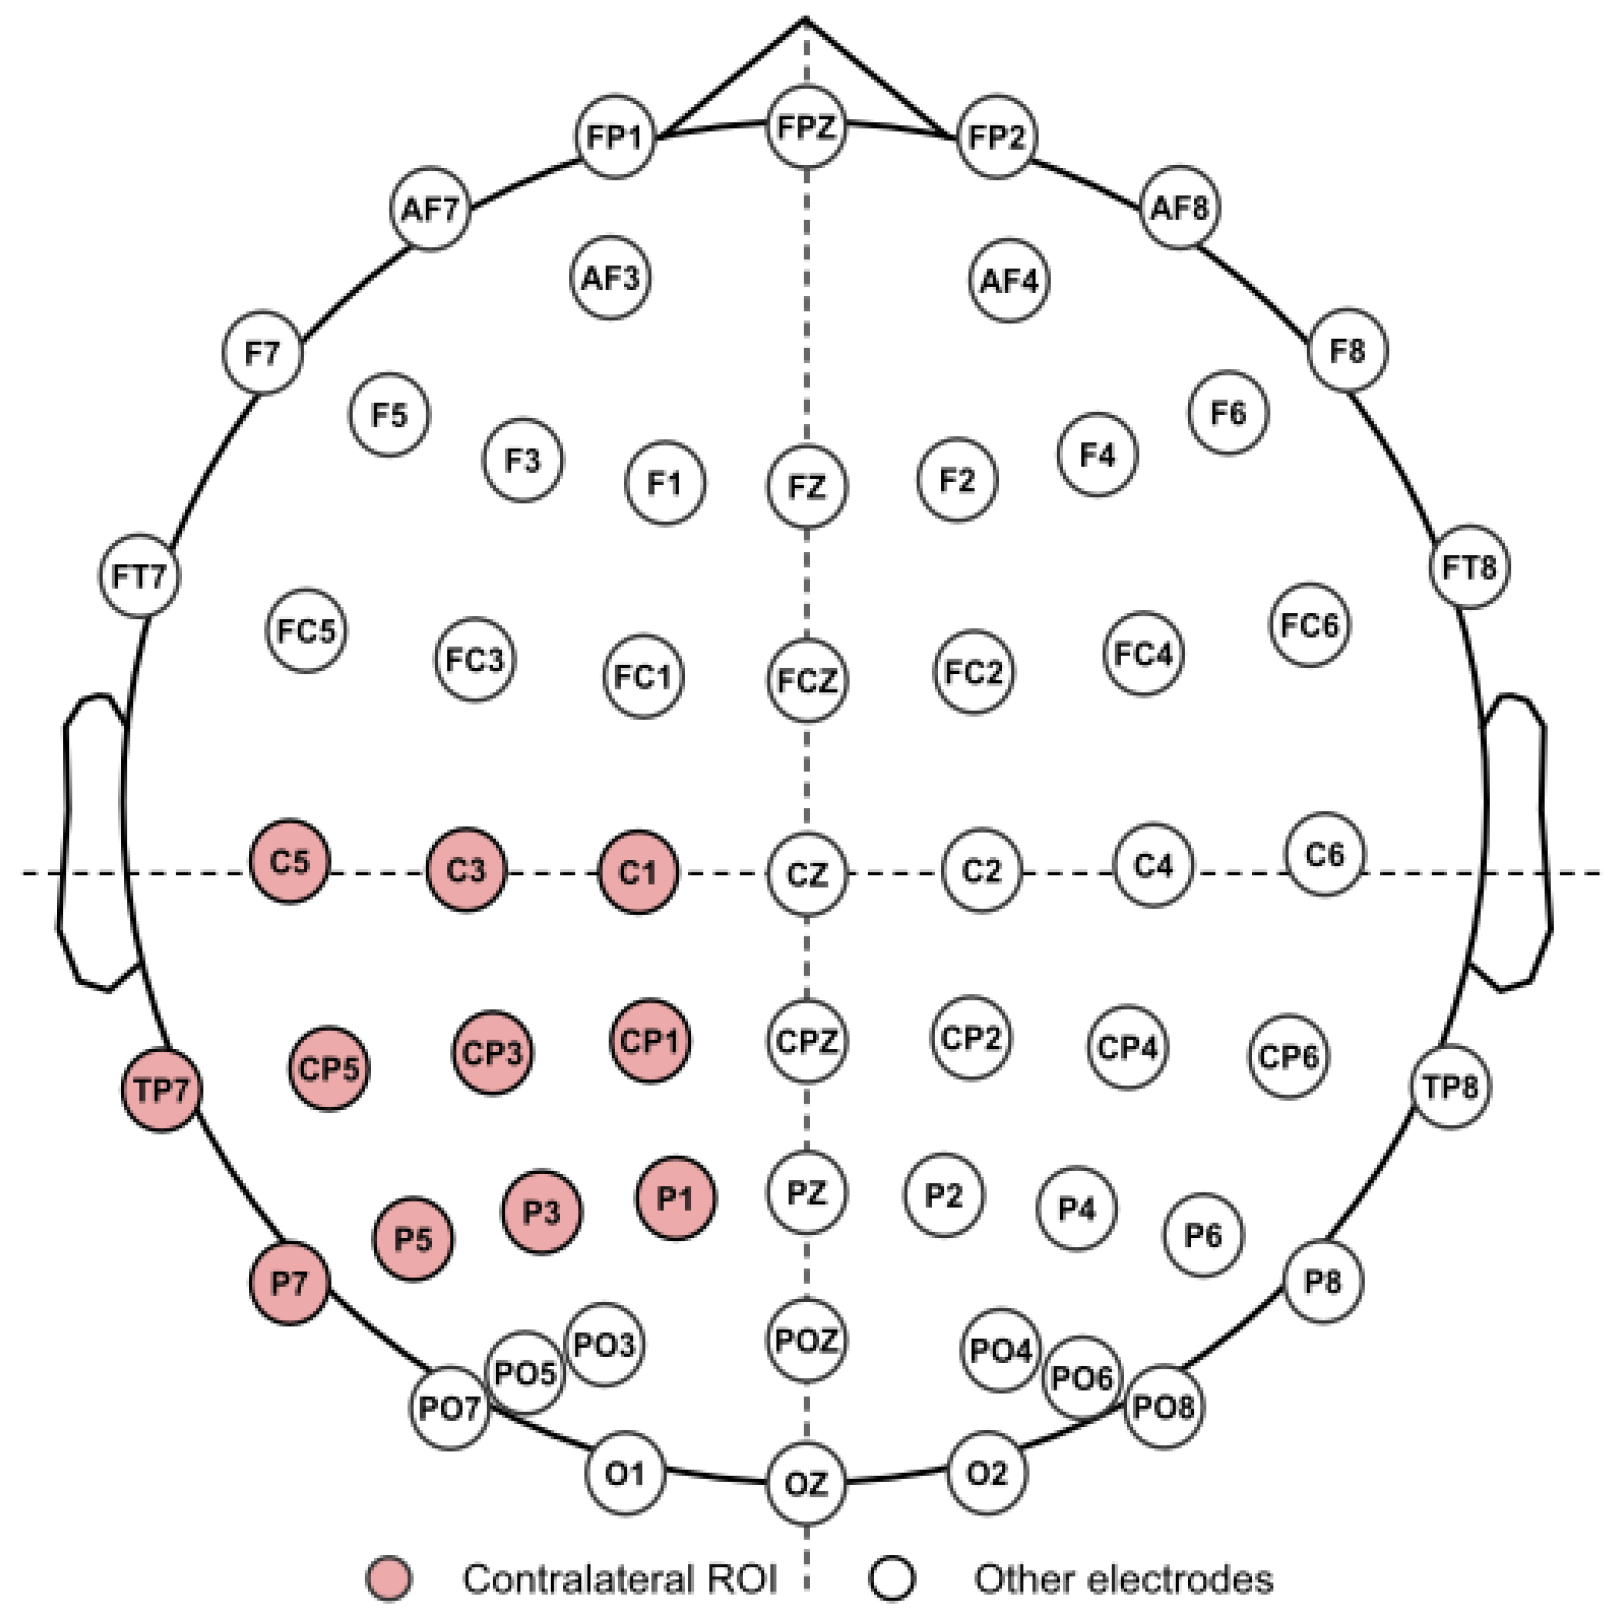
The region of interest (ROI) was defined as the electrodes close to the S1 region contralateral to the stimulated hand as described in Moungou et al. [
23] (ROI: C1, C3, C5, CP1, CP3, CP5, P1, P3, P5, P7, TP7;
Figure 3). Epochs were created by extracting the signal 500 ms pre- and 7000 ms post-stimulus onset. PSD was estimated for each condition using Welch’s method [
24] with a Hann window [
25] and 0 overlap, over the 0.5–2 s post-stimulus interval and the 1–50 Hz frequency range. PSD describes how signal power is distributed across frequencies and includes both stimulus-locked activity and background noise. Using this PSD, we can assess the strength of the SSSEP response relative to background noise by calculating the SNR. SNR is calculated by dividing the power at the target frequency (20 Hz) by the average power of neighboring frequencies [
26,
27], this reflects how strongly the stimulation frequency stands out from surrounding noise. Baseline (no stimulation) measures were obtained by computing the PSD during the no-stimulation segment within the inter-stimulus interval (4000–5500 ms post-stimulus onset). SNR and PSD channel averages across trials for the 20 Hz frequency were calculated for each participant and condition. To account for possible inconsistencies in EEG-cap placement across participants, the three electrodes within the ROI with the highest PSD for 20 Hz relative to surrounding frequencies were selected for each participant separately. To avoid double-dipping, electrode selection was performed using the full-intensity VTS condition, and the selected electrodes were then held fixed for all other stimulus types. The average SNR and PSD (log-transformed) for these electrodes (and their ipsilateral counterparts) were used for further interpretation and statistical analyses.
To investigate our hypotheses, two linear mixed-effects models were conducted, with mean SNR and log-transformed PSD as dependent variables. For both dependent variables, condition, laterality, and their interaction were included as fixed effects, and participant was included as a random intercept to account for repeated observations within participants. The model can be written as:
where
denotes the outcome for participant
i, stimulus type
s, and laterality
l. The terms
,
, and
represent the fixed effects of stimulus type, laterality, and their interaction, respectively. The term
represents the participant-specific random intercept, and
represents the residual error. No random slopes were included.
Post hoc pairwise comparisons were performed using estimated marginal means with Tukey adjustments for multiple comparisons [
28]. Mixed-model contrasts are reported in
Table A4 and
Table A5 as estimated mean differences with 95% confidence intervals, standardized effect sizes, and adjusted
p-values. To examine whether the findings depended on the selection of the three strongest electrodes, we additionally conducted a sensitivity analysis using all electrodes in the predefined ROI (see
Figure 3). This analysis used the same SNR and PSD outcomes and the same model structure as the primary analysis, but averaged the 20 Hz estimates across the full predefined ROI rather than across the three selected electrodes (see
Table A6 and
Table A7). As an additional sanity check, Pearson correlations were calculated between the matched-intensity VTS calibration value and the SNR/PSD estimates for the matched-intensity VTS condition.
4. Discussion
This study investigated whether UMAH, delivered at the maximum intensity under current output constraints, elicits SSSEPs comparable to those produced by VTS. Building on prior work demonstrating reliable SSSEPs for periodic tactile stimulation [
18,
20], we aimed to assess the feasibility of using SSSEP-based neural markers as an objective complement to self-reported UX measures in the evaluation of UMAH interfaces. Three main findings emerged from the results.
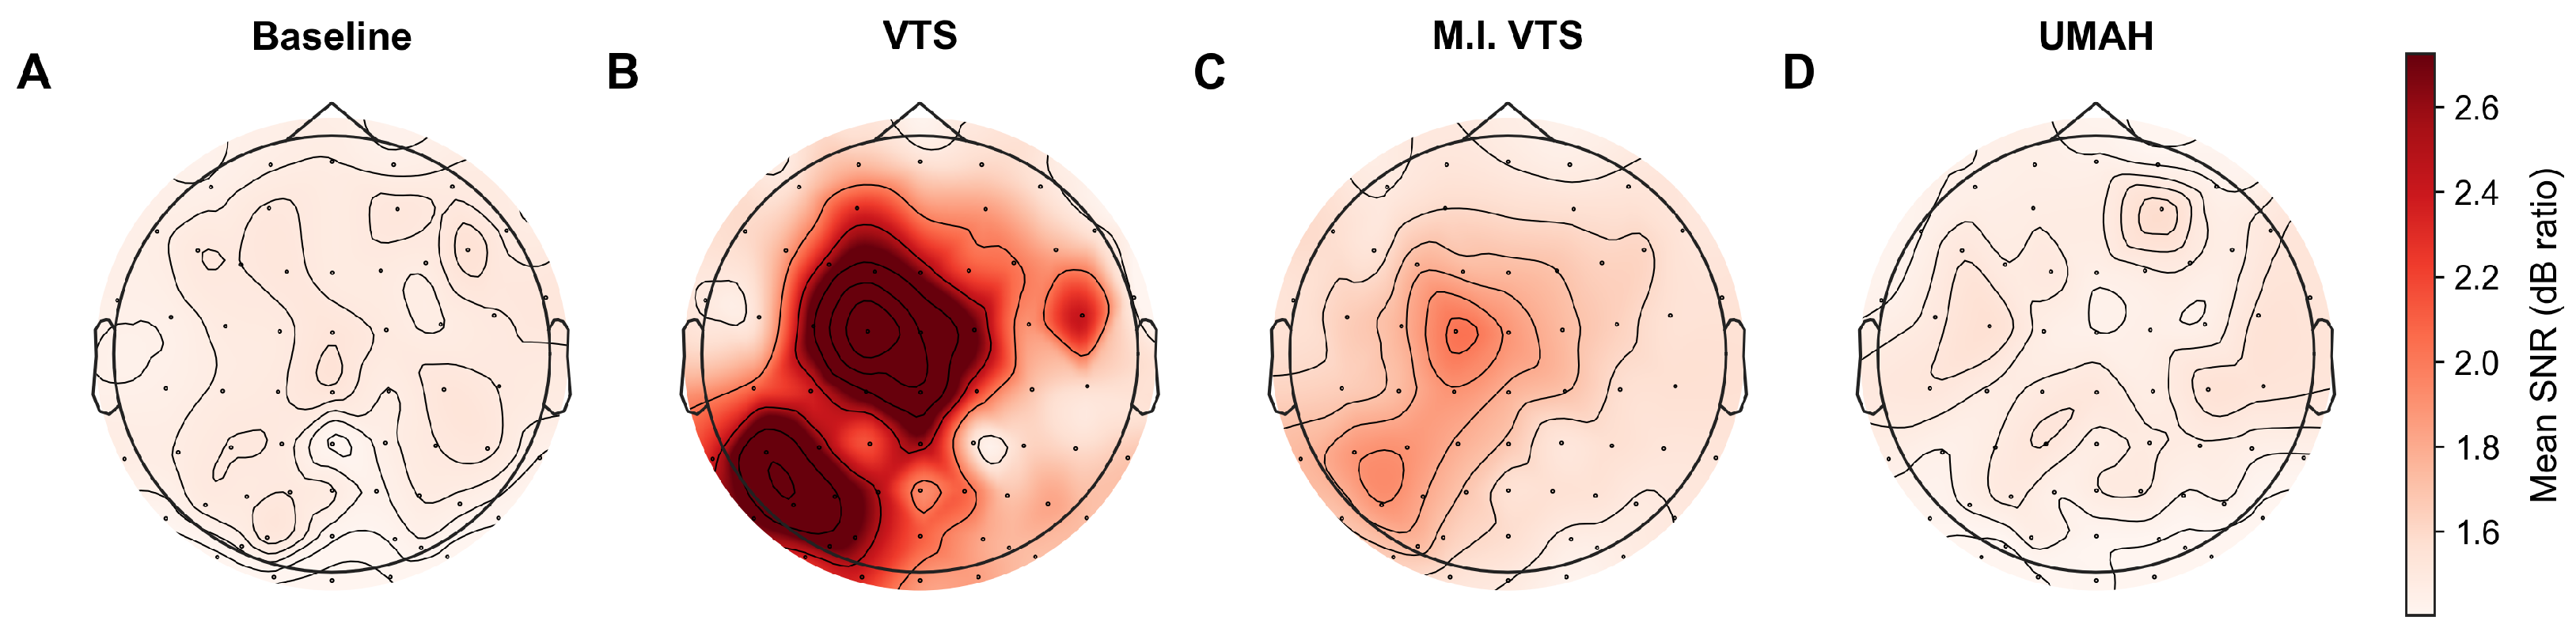
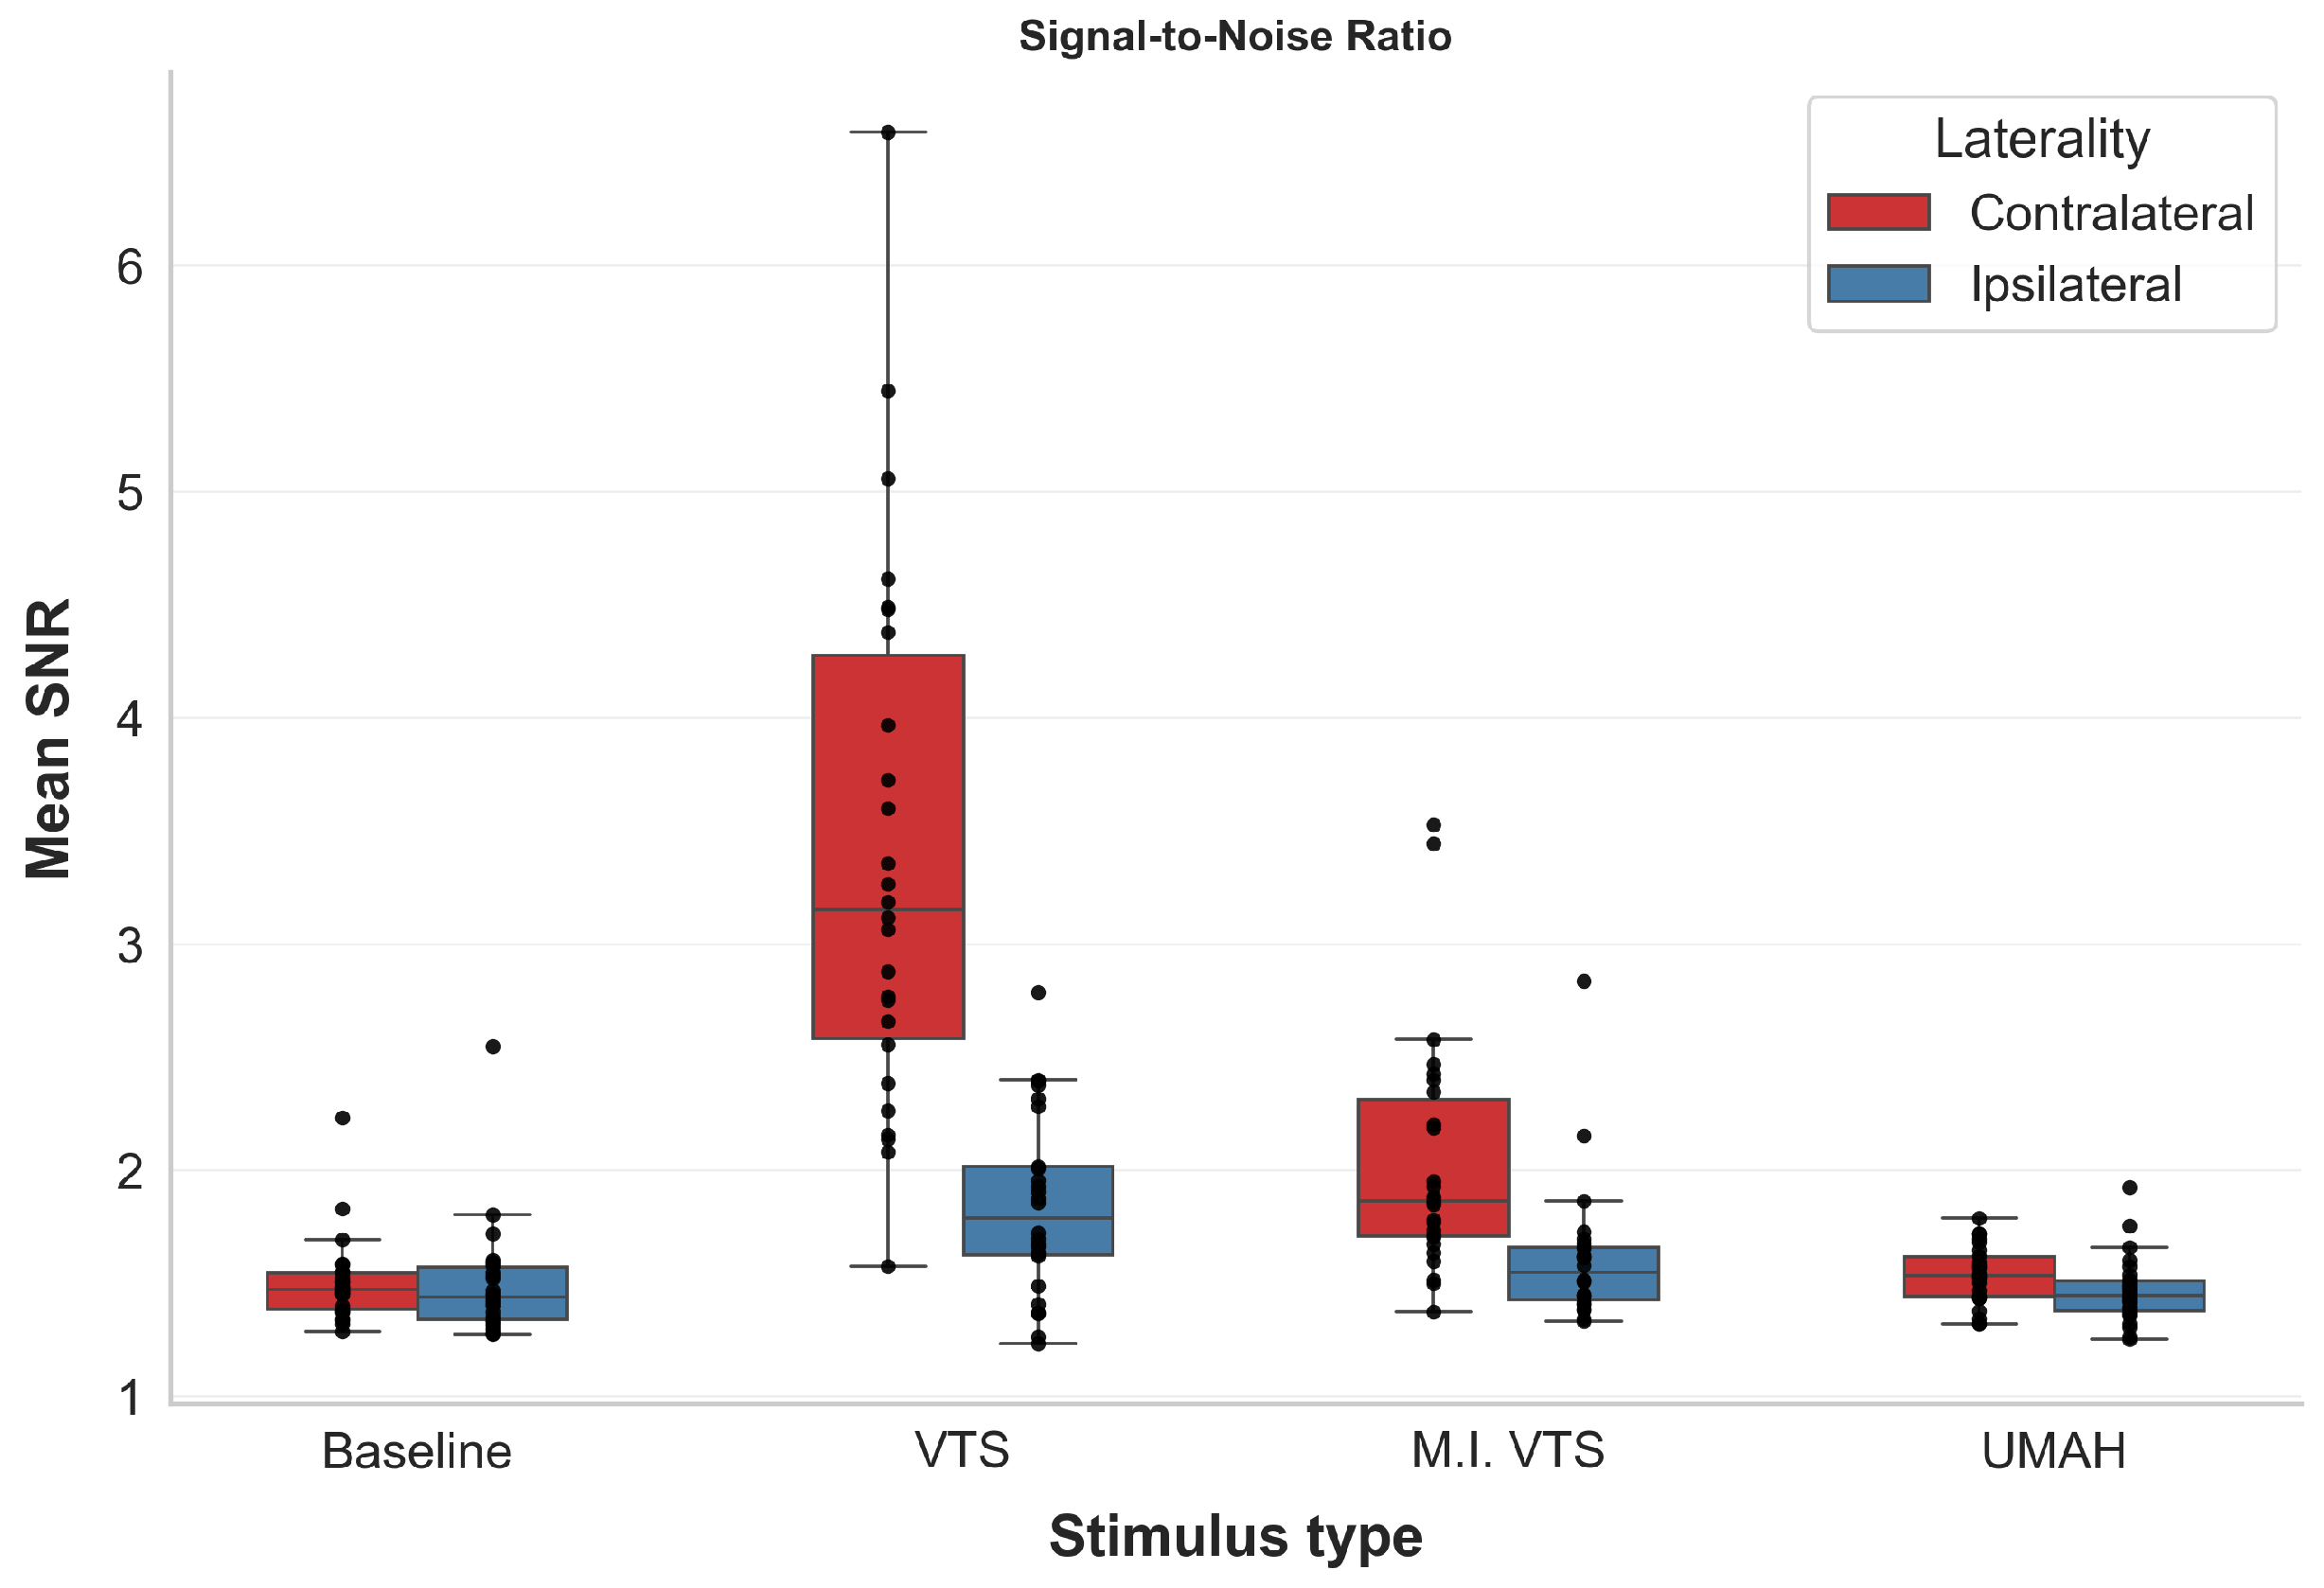
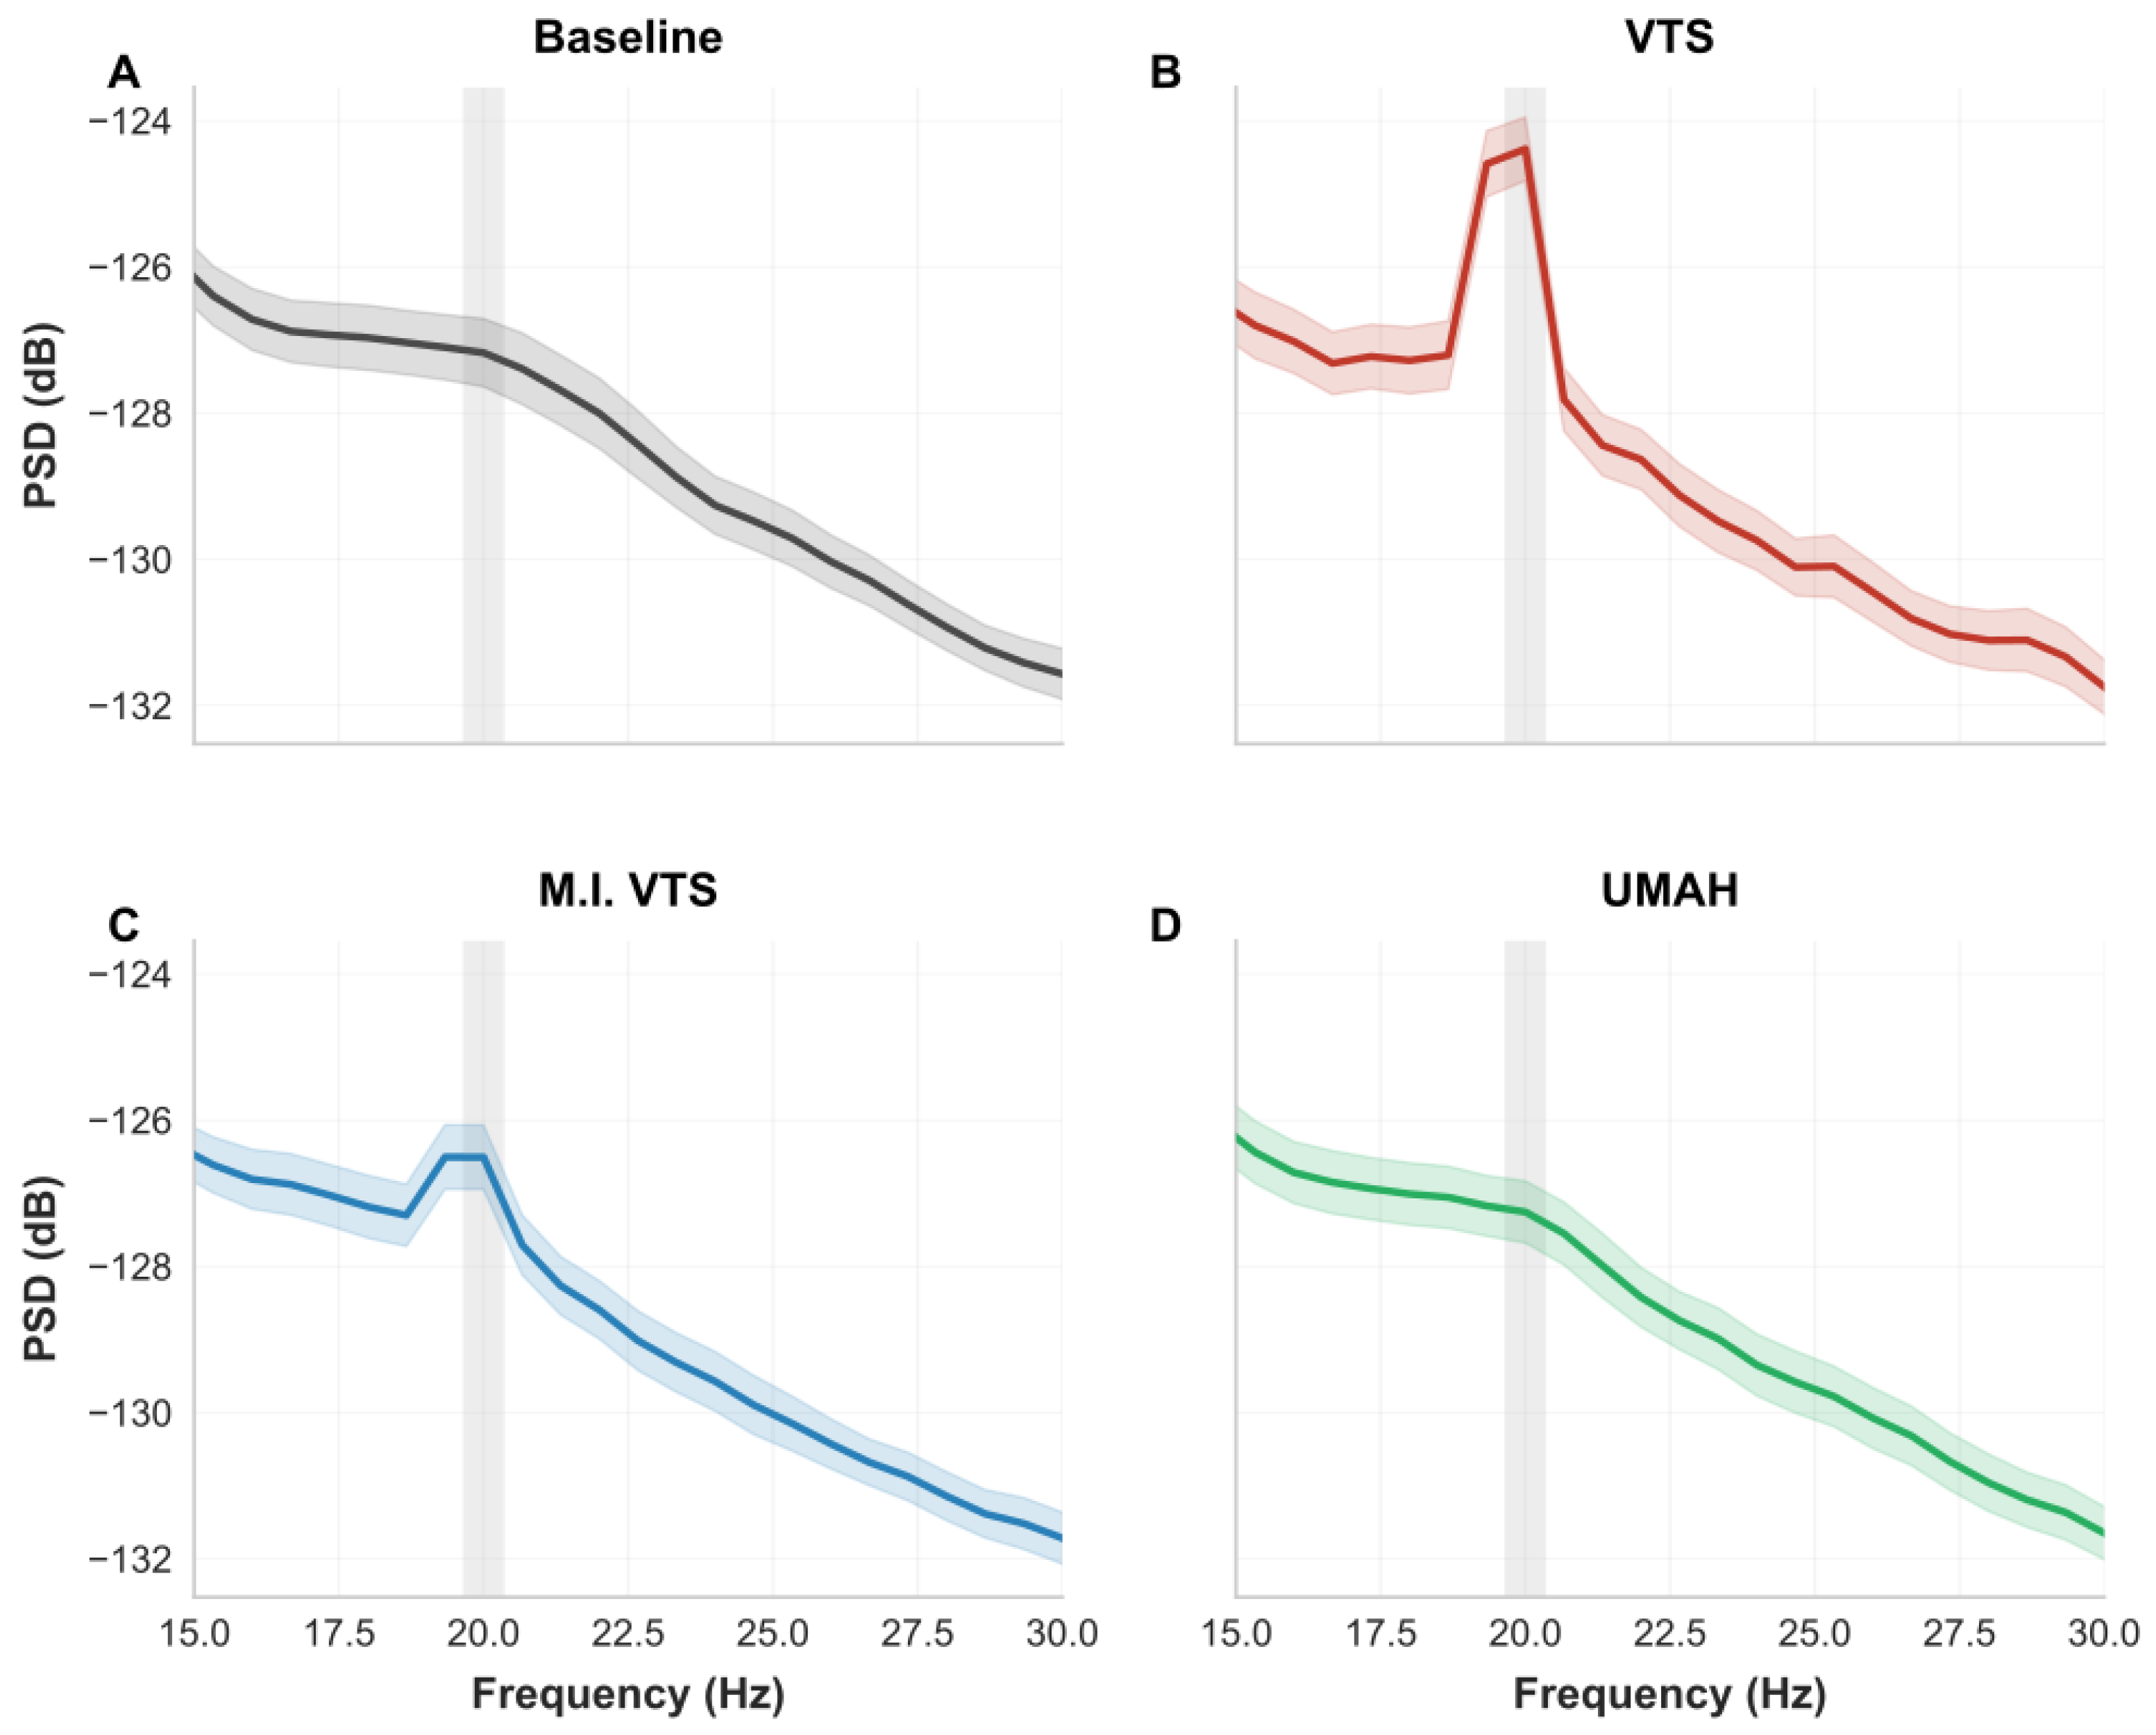
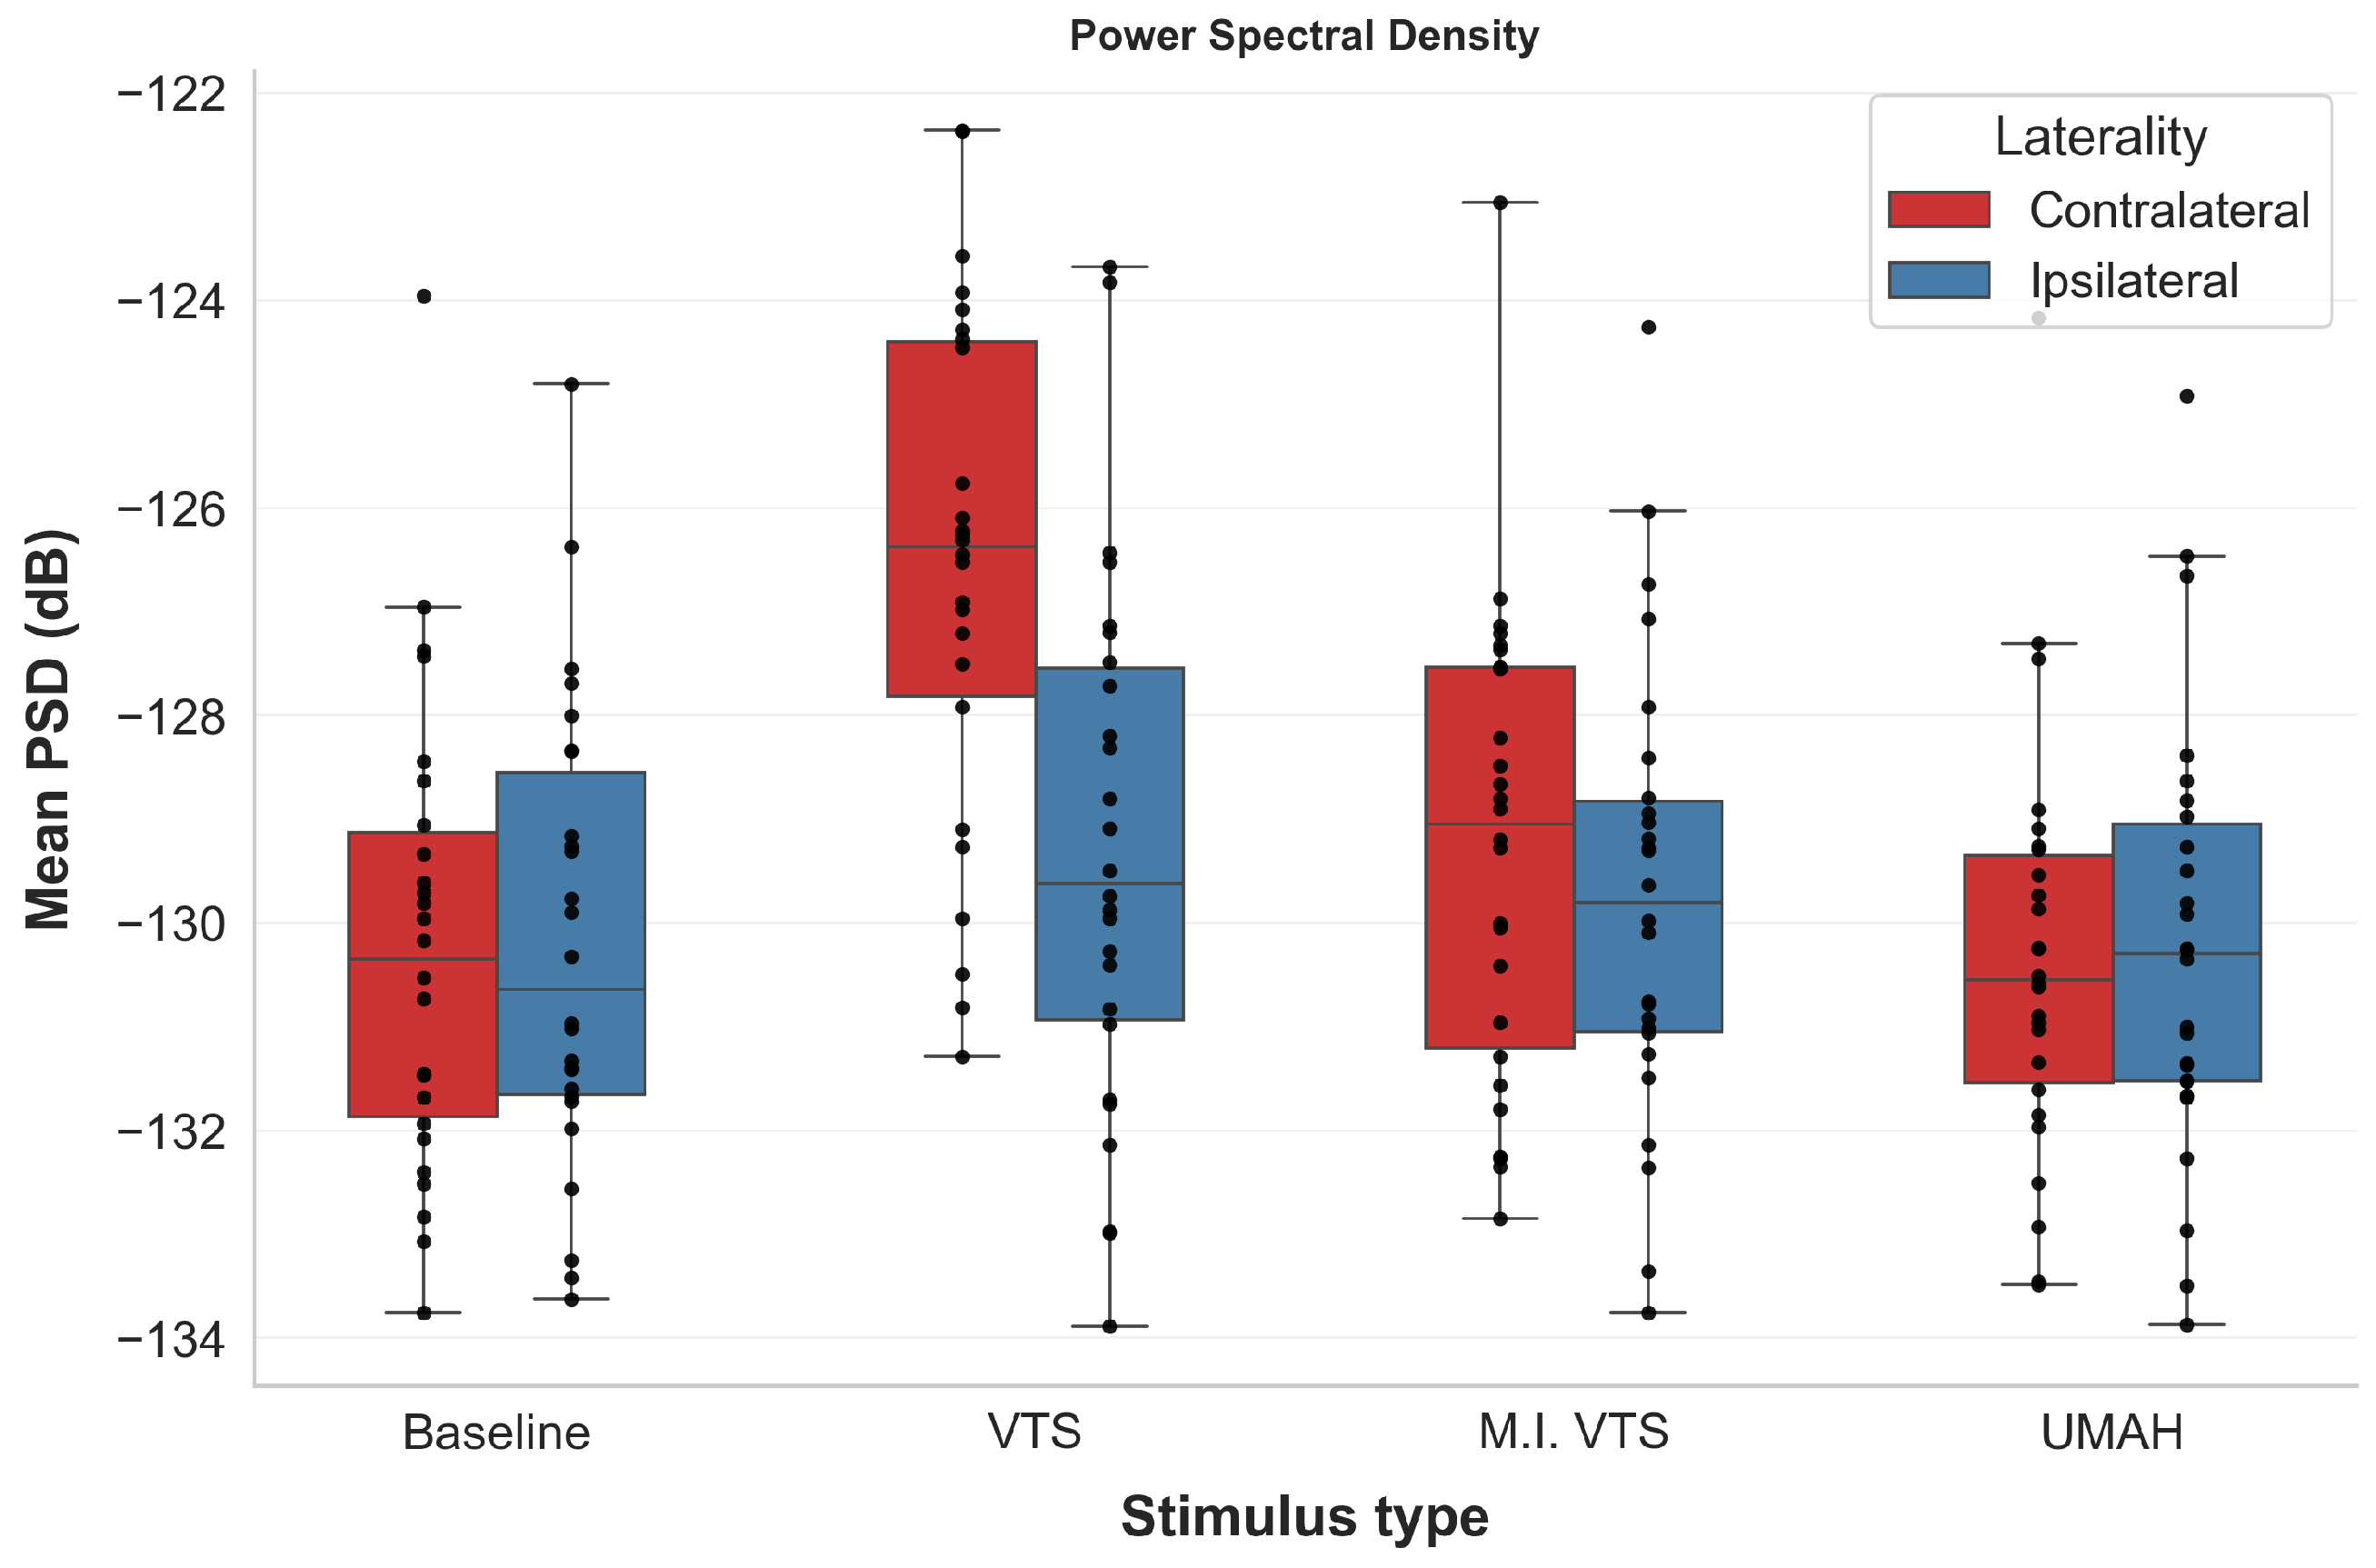
First, full-intensity VTS elicited a clear and robust SSSEP at 20 Hz, expressed as increased PSD and SNR over contralateral somatosensory regions. This replicates earlier findings using pneumatic and VTS [
18,
20] and confirms the suitability of our experimental setup and analysis pipeline for detecting SSSEPs. The spatial distribution of the effect, centered over contralateral central-parietal electrodes, is consistent with activation of primary somatosensory cortex (S1) as reported in the literature [
19,
23]. Importantly, this effect was present in both PSD and SNR, indicating that VTS produced not only increased absolute 20 Hz power, but also a response that clearly stood out from neighboring frequency activity.
Second, the positive correlation between stimulation intensity and SSSEP magnitude in the matched-intensity VTS condition aligns with previous evidence that SSSEPs scale with stimulus amplitude [
20]. Together, these findings support the validity of SSSEP measures as sensitive neural markers of tactile stimulus strength.
Lastly, full-intensity UMAH stimulation did not elicit statistically significant SSSEPs relative to baseline, despite being delivered at the maximum intensity allowed by the device. Both PSD- and SNR-based analyses showed similar results and led us to conclude that neural responses to UMAH were indistinguishable from no-stimulation periods.
One plausible explanation for the absence of detectable SSSEPs for UMAH is the limited mechanical input generated by the ultrasound stimulus. Previous work on airborne ultrasound tactile displays has reported relatively small output forces (16 mN) at the focal point [
8], and recent work has emphasized that mid-air ultrasound stimulation produces contactless skin displacement rather than direct mechanical indentation [
29]. In contrast, the VTS conditions used actuators in direct contact with the fingertips, producing a different form of mechanical coupling to the skin. However, the present study did not include a direct physical measurement of output force, acoustic pressure, or skin displacement for the UMAH and VTS stimuli. Therefore, the explanation that UMAH failed to elicit detectable SSSEPs because of lower physical output should be interpreted as a plausible account rather than a directly demonstrated mechanism.
Second, UMAH stimulation differs from VTS not only in amplitude but also in mechanical coupling. Vibrotactile actuators produce direct skin indentation and shear forces, whereas UMAH produces forces through acoustic radiation pressure acting on the skin surface [
6]. These different modes of stimulation likely engage mechanoreceptor populations differently, which may affect the ability to entrain oscillatory cortical responses even when perception is preserved [
29].
Third, differences in spatial and temporal characteristics of stimulation may reduce neural entrainment. In contrast to VTS, the focal point generated by UMAH can be spatially diffuse and sensitive to small hand movements, potentially reducing temporal precision and mechanoreceptor synchronization. Minor tracking jitter or movements of the hand could further degrade consistent phase-locking between stimulus and neural response, even if the stimulus remains perceptually detectable.
Importantly, our finding does not mean that UMAH is imperceptible or that it cannot elicit cortical responses. Other research has previously shown that UMAH pulses can evoke SEPs [
15,
16]. These findings are compatible with the present results when considering the type of neural response that was measured. Both studies focused on transient responses to discrete mid-air haptic events, whereas the present study examined whether a continuous 20 Hz stimulation pattern produced sustained frequency-specific entrainment. UMAH may therefore be sufficient to trigger discrete cortical responses related to stimulus detection, intensity, or salience, while still being insufficient to drive a robust SSSEP at 20 Hz under the present stimulation and analysis parameters. Because no a priori power analysis was conducted, the absence of a detectable UMAH SSSEP should be interpreted in relation to the sensitivity of the final sample. The sensitivity power analysis indicated that the smallest paired effect detectable with 80% power was approximately
. Thus, the study was primarily sensitive to moderate-to-large effects, and the null UMAH result should be interpreted as the absence of a detectable response of approximately this magnitude under the present design rather than as evidence that the true effect is zero. Smaller UMAH-related steady-state responses cannot be ruled out. Nevertheless, the UMAH estimates were close to baseline in both SNR and PSD, whereas the same analysis pipeline detected robust responses for full-intensity VTS and weaker but detectable responses for matched-intensity VTS.
From an applied perspective, the SNR and PSD findings clarify the current usefulness of SSSEP measures for evaluating haptic interfaces. SNR is particularly relevant because it indicates whether the neural response to a periodic tactile stimulus can be separated from ongoing background EEG activity. A high SNR response, as observed for full-intensity VTS, suggests a robust and repeatable neural signature that could be useful as an objective complement to subjective UX measures. PSD provides a related estimate of the absolute 20 Hz response strength. The convergence of both metrics therefore supports the validity of SSSEPs for contact vibrotactile stimulation and shows that the method was sensitive to reduced perceived stimulus intensity, as reflected by the weaker matched-intensity VTS response.
However, the absence of elevated SNR and PSD for UMAH has important implications for the usability evaluation of current mid-air haptic technology. This does not imply that UMAH is imperceptible or lacks experiential value, but it suggests that the neural response elicited by the present UMAH setup was too weak, too spatially or temporally variable, or too transient to be captured as a reliable 20 Hz steady-state response. Consequently, SSSEP-based SNR and PSD measures should not yet be treated as robust objective indicators of UMAH UX under the output constraints of commercially available devices. For practical UX evaluation, current UMAH systems may still require subjective ratings, behavioral measures, psychophysical thresholds, or alternative neural markers such as transient SEPs rather than relying on steady-state frequency-domain measures alone.
Several limitations should be considered. First, stimulation was restricted to a single frequency (20 Hz), chosen based on prior SSSEP literature. It remains possible that UMAH may more effectively entrain neural responses at other modulation frequencies [
29]. Second, although intensity matching was carefully implemented, subjective equivalence does not guarantee physiological or physical equivalence between stimulation modalities. The matched-intensity calibration values showed noticeable inter-individual variability, indicating that participants differed in the VTS intensity they perceived as equivalent to full-intensity UMAH. This variability is important because subjective matching captures perceived intensity rather than equivalence in force, acoustic pressure, skin displacement, or contact mechanics. Individual differences in tactile sensitivity, actuator contact, hand positioning, and the perceived strength of the UMAH focal point may therefore have contributed to differences in selected VTS intensity. Importantly, the positive correlations between matched VTS intensity and both SNR and PSD suggest that these subjective calibration values were meaningfully related to the resulting neural response. Nevertheless, matched-intensity VTS should be interpreted as a perceptual comparison condition, not as a physically equivalent stimulation condition. Future work could combine subjective intensity matching with direct physical characterization of the stimuli. For example, radiation force could be quantified using a sensitive force sensor [
30], and skin displacement under UMAH and VTS could be measured non-contact using laser Doppler vibrometry [
29]. These measurements would allow perceived intensity and SSSEP magnitude to be related more directly to the physical input delivered to the skin. Additionally, future research could explore alternative neural markers for UMAH, such as transient SEPs, time–frequency analyses, or multimodal integration paradigms, rather than relying exclusively on SSSEPs.
In conclusion, while VTS reliably elicited SSSEPs, UMAH did not produce detectable SSSEPs when delivered at the maximum intensity permitted by current commercial implementations. These findings suggest that, under existing constraints, UMAH may be insufficient to drive SSSEPs in the somatosensory cortex. This places important limits on the independent use of steady-state-based methodologies for evaluating UX of UMAH interfaces. Further research into alternative objective measures of UMAH experience is recommended.






 ,
,