1. Introduction
Yuxian paper cutting is a folk art form from Hebei Province in northern China with distinctive regional characteristics. It was included in the first batch of China’s national representative list of intangible cultural heritage in 2006 [
1] and was inscribed as an important component of Chinese paper cutting on the UNESCO Representative List of the Intangible Cultural Heritage of Humanity in 2009 [
2]. Unlike predominantly monochrome paper cutting traditions, Yuxian paper cutting mainly employs knife-cutting techniques based on negative carving, combined with multicolor hand dyeing. This process forms a brightly colored and clearly structured hand-colored paper-cut style, reflecting local folk beliefs, ethical values, and aesthetic traditions.
Among its motifs, opera figures are one of the most representative image types in Yuxian paper cutting. Costume structures, body postures, props, and color relationships typically encode the identities, traits, and narrative roles of these figures, reflecting the fusion of local opera, folk aesthetics, and hand-colored paper-cut craftsmanship. However, paper-based works are prone to fading, damage, and loss, while related image materials are scattered across museum collections, illustrated catalogues, and private folk collections. Existing organization methods rely primarily on manual classification and expert judgment, hindering large-scale preservation, retrieval, and systematic management. Therefore, establishing a computer-assisted method for visual-category detection and structured image organization has become an important task for digital preservation, database construction, and subsequent revitalization.
Existing research on Yuxian paper cutting has mainly addressed folk art, folklore, intangible cultural heritage protection, and craft history, with emphasis on historical development, craft characteristics, thematic genealogies, artisan inheritance, and cultural meanings [
3,
4,
5,
6,
7]. This work provides an important foundation for understanding its historical, artistic, and heritage value. However, standardized annotation and computational analysis of image structures, category boundaries, and visual features remain limited.
Research on paper-cutting digitization has expanded from image acquisition, three-dimensional display, and virtual communication to deep learning, style transfer, generative artificial intelligence, and interaction design [
8,
9,
10,
11,
12]. Computer vision has also been applied to image classification, recognition, retrieval, and digital management in cultural heritage contexts [
13,
14,
15]. However, existing work has focused mainly on digital display, image generation, and assisted design, with less attention to dataset construction, visual-category definition, feature extraction, and automatic recognition of region-specific paper-cut images. This gap limits the use of existing methods for structured organization and semantic retrieval.
To clarify the position of the present study, recent work on cultural heritage image analysis, fine-grained visual recognition, and attention-enhanced object detection is summarized in
Table 1. Existing studies have demonstrated the value of deep learning for artwork classification, heritage image retrieval, and object detection. However, most studies focus on public benchmark datasets, general artwork categories, or single-purpose recognition tasks. Comparatively limited attention has been paid to small, domain-specific collections in which category discrimination depends on localized costume, prop, posture, and boundary cues, as in Yuxian paper-cut opera figure images.
In recent years, deep learning has provided an important technical pathway for automatic recognition and classification of complex images. The YOLO (You Only Look Once) series integrates object localization and category prediction into a single network and completes object detection through a single forward pass, thereby achieving a favorable balance between detection efficiency and recognition accuracy [
20,
21]. YOLOv8 adopts an anchor-free detection mechanism with a decoupled head and an improved backbone featuring enhanced feature fusion, demonstrating strong adaptability across diverse visual tasks. For specific scenarios such as small objects, complex backgrounds, and multi-scale targets, YOLOv8 can be improved through feature fusion, detection layer optimization, or attention modules to enhance the model’s ability to capture key target regions and fine-grained features. This provides a practical baseline for the visual-type detection of Yuxian paper-cut opera figures, where both category prediction and figure localization are required.
Attention mechanisms are widely used to improve feature representation in object detection models. Traditional channel attention and spatial attention emphasize channel importance and spatial saliency, respectively, whereas their collaborative modeling remains relatively limited. The Spatial and Channel Synergistic Attention (SCSA) mechanism combines Shareable Multi-Semantic Spatial Attention (SMSA) and Progressive Channel-wise Self-Attention (PCSA) to jointly model local spatial cues, global semantic information, and channel dependencies [
22]. Existing studies have shown that spatial-channel attention can improve object perception in visually complex detection scenarios [
23]. In the present task, category discrimination depends primarily on localized costume, prop, and body-structure cues rather than on overall scene appearance. Therefore, SCSA is introduced to refine the representation of category-relevant regions before bounding-box regression and category prediction.
Despite the progress of digital technologies in paper-cutting preservation, three issues remain insufficiently addressed. First, region-specific paper-cut image collections often lack standardized visual categories and bounding-box annotations, which limits both reproducible model training and structured resource organization. Second, existing digitization work has focused mainly on display, dissemination, or image generation, while less attention has been paid to automatic detection of visually distinguishable figure categories for retrieval and database management. Third, the category-relevant evidence in Yuxian paper-cut opera figures is often localized in specific costume, prop, and body-structure features rather than distributed across the overall image appearance.
These characteristics create two related technical difficulties: dense decorative motifs and local visual similarity may interfere with the representation of category-relevant cues, while incomplete contours and ornamentally complex surroundings may reduce bounding-box localization stability. Accordingly, SCSA is used for feature refinement, whereas Inner-IoU is used to adjust bounding-box regression when figure boundaries are partially merged with surrounding decorative elements.
Based on this rationale, the study constructs a visual-type detection task for Yuxian paper-cut opera figures. The dataset is built through image collection, screening, annotation, and training-set augmentation. The figures are divided into armor-clad, robe-wearing, and female-role figures according to observable visual cues. The evaluated configuration is intended to support preliminary visual-category annotation, retrieval, and organization of heritage image resources.
Multimodal fusion can enrich cultural heritage image understanding by integrating visual, textual, material, and contextual information [
24,
25]. However, the available Yuxian paper-cut materials lack systematically associated textual descriptions and contextual metadata. The present study, therefore, establishes a vision-centric detection pipeline for preliminary image organization, retrieval, and metadata construction. Future multimodal extensions will require richer and more systematically annotated heritage records.
The contributions of this study are threefold. First, it formulates a task-specific visual-type detection scheme for Yuxian paper-cut opera figures and constructs a curated bounding-box-annotated dataset with three operational categories: armor-clad, robe-wearing, and female-role figures. These categories support computational detection, retrieval, and preliminary image organization rather than art-historical or opera-genealogical interpretation. Second, the study adapts mature object-detection techniques to the visual and documentation requirements of this heritage domain. The existing SCSA module and Inner-IoU strategy are integrated into YOLOv8n to address localized costume, prop, posture, and boundary cues. The contribution lies in task formulation, cultural-visual feature translation, dataset construction, and expert-assisted workflow design, rather than in proposing a new architecture, attention mechanism, or loss function. Third, comparative experiments, component ablations, activation-map visualization, and error analysis are used to evaluate the feasibility and limitations of the resulting configuration for preliminary annotation and heritage image organization.
The evaluated configuration is intended for heritage professionals and domain-informed users engaged in documenting and managing Yuxian paper-cut image resources. It supports preliminary visual-category annotation, retrieval, and metadata organization within a human-in-the-loop workflow, rather than unsupervised public-facing identification. Ambiguous figures, character identities, historical contexts, and cultural meanings still require expert review. In this study, visual-type detection refers to the detection of operational categories defined by observable costume, headwear, prop, posture, and female-role cues.
2. Materials and Methods
2.1. Dataset Construction and Preprocessing
2.1.1. Image Collection and Visual-Category Definition
To address the lack of a publicly available benchmark dataset for Yuxian paper-cut opera figure images, this study collected 926 original images through multi-source acquisition, manual screening, and quality assessment. The images were obtained from authoritative Yuxian paper-cut catalogues, museum materials, folk collections, and publicly accessible online resources. Key references included
Chinese Folk Paper-Cutting Collection: Yuxian Volume [
4],
Chinese Paper-Cutting King: A Historical Account of Yuxian Paper-Cutting Art [
5],
Yuxian Paper-Cutting [
6], and
Illustrated Catalogue of Chinese Yuxian Paper-Cut Opera Figures [
26]. During collection, the image source, thematic content, preservation condition, image quality, and category judgment were recorded.
Images were excluded when their source could not be verified, the target figure was severely incomplete, the visual quality was insufficient for reliable annotation, or the category could not be determined from observable visual cues. The resulting dataset was designed for object detection and visual resource organization rather than for art-historical, folkloric, or opera-genealogical classification.
The dataset scale reflects the material and archival conditions of this heritage domain. Yuxian paper-cut works may fade, tear, deteriorate, or become dispersed, and related images are distributed across catalogues, museum holdings, folk collections, and online records. Their research use is also constrained by provenance, image quality, copyright, and access permissions. The dataset was, therefore, constructed as a curated resource for preliminary digital documentation and image organization rather than as a large-scale public benchmark. To support transparency and comparative research, publicly shareable image samples, annotation files, and category labels were organized according to the definitions and procedures described in this study.
Traditional Chinese opera commonly uses the role-system categories of sheng, dan, jing, and chou to describe performative identity, vocal type, dramatic function, and stage convention. This traditional taxonomy provides important cultural background for interpreting opera figures, but it operates at a different conceptual level from the object-detection categories used in this study. A traditional role category may depend on character identity, narrative context, vocal practice, or performance convention, which cannot always be determined reliably from a single paper-cut image.
The present study therefore treats the traditional opera-role system and the three detection categories as conceptually distinct. The operational detection scheme is established independently from recurrent and directly observable image features. The three categories are defined according to configurations of costume, headwear, weapons or props, body posture, and role-related appearance that can be consistently perceived and annotated from image content. The traditional role system is used only as cultural background and is not treated as equivalent to, or interchangeable with, the detection categories. Armor-clad figures represent martial configurations characterized by armor, weapons, back flags, shoulder guards, martial garments, or combat-related postures. Robe-wearing figures represent civil, official, or ceremonial configurations characterized by official hats or crowns, long robes, ceremonial garments, long beards, ceremonial court tablets, and other civil-official visual features. Female-role figures represent visually explicit female-role configurations characterized by skirt structures, draped scarves, phoenix crowns, hair ornaments, and postures conventionally associated with female opera roles.
The category criteria were developed through consultation among researchers with relevant expertise in design studies, art studies, and opera-related visual culture. Category assignment was based on the combined presence of observable visual cues rather than on a single attribute or presumed character identity. When explicit female-role cues were visible, the female-role category was prioritized. For other ambiguous cases, the final decision was made through joint review. Images that remained difficult to assign after review were excluded from the final dataset.
This scheme provides an operational visual-category framework for expert-assisted documentation, retrieval, and organization of Yuxian paper-cut resources. Representative examples of the three operational visual categories are shown in
Table 2. It prioritizes visual observability, annotation consistency, and practical use in image organization. The three categories are not substitutes for, simplified versions of, or direct mappings of the traditional opera-role system, nor are they intended as an exhaustive or art-historically definitive taxonomy. Character identity, dramatic role, historical context, and cultural meaning continue to require expert review and contextual evidence.
2.1.2. Image Annotation, Preprocessing, and Data Augmentation Strategy
Rectangular bounding boxes were used to annotate opera figure subjects in the collected images. The visible extent of each figure was used as the bounding-box range. Costume structures, weapons, props, and body contours were included when they were visually identifiable, while excessive irrelevant background was avoided. When multiple opera figures appeared in one image, each figure was annotated separately.
The annotation procedure was conducted by researchers with relevant backgrounds in design studies, art studies, and opera-related visual culture. Before formal annotation, the annotators jointly reviewed the category definitions, representative examples, and boundary-labeling rules. Each image was then annotated according to the predefined visual-category criteria.
For samples involving disputed category labels, unclear figure boundaries, or inconsistent bounding-box ranges, a second review was conducted. The disputed samples were examined with reference to the category guidelines and visible costume, headwear, prop, and posture cues. Cases that remained ambiguous after review were excluded from the final dataset to reduce annotation uncertainty. Annotation was completed using LabelImg [
27], and all labels were converted into YOLO format.
The data-partitioning script stratified the 926 original images into training, validation, and test sets in a ratio of 7:2:1, yielding 648, 185, and 93 images, respectively. Augmentation was subsequently applied solely to the training set, generating 69 augmented variants from female-role samples to mitigate the class imbalance arising from the smaller number of female-role images relative to the other two categories. This increased the female-role training samples from 181 to 250, yielding a more balanced distribution across the three categories (armor-clad: 242; robe-wearing: 225; female-role: 250). The final training set thus comprised 717 images, while the validation and test sets remained unchanged and contained only original images, as summarized in
Table 3. Accordingly, the final dataset used in the experiments comprised 995 images across the training, validation, and test subsets. This post-split augmentation protocol ensured that no augmented image variants entered the validation or test sets, thereby preserving the independence of the evaluation subsets. Importantly, the augmentation procedure was fixed before all model training and comparison, ensuring that the reported performance differences mainly reflected differences among the evaluated model configurations rather than variations in training-data composition.
Because the images were collected from catalogues, museums, folk collections, and online resources, the original dataset already contained natural variation in orientation, cropping, scale, composition, and acquisition conditions. Additional geometric transformations were not used because aggressive cropping, rotation, flipping, or scaling could remove or distort category-relevant cues, including weapons, back flags, headwear, robes, skirts, and draped scarves. These elements also constitute culturally meaningful costume, posture, and prop configurations; excessive geometric manipulation could therefore compromise both the annotation validity and the visual-semantic integrity of the heritage images.
Accordingly, a restrained photometric augmentation strategy was applied to the training set [
28]. The selected operations included image darkening, image brightening, and salt-and-pepper noise. These operations were intended to simulate variation in illumination, scanning quality, image aging, local damage, and digital transmission while preserving the spatial structure and visual-category information of the annotated figures. Representative examples are shown in
Table 4.
The photometric augmentation was treated as a dataset-level balancing procedure rather than as a component of the evaluated YOLOv8n-SCSA configuration with Inner-IoU. It was applied only once to the training set before model comparison, and the same final augmented training set was used for all evaluated detector variants. Therefore, the ablation comparisons were conducted under an identical data condition to assess the relative effects of SCSA and Inner-IoU, rather than to estimate the independent contribution of augmentation.
Although loss re-weighting can also address category imbalance, this study used training-set balancing because the imbalance resulted from the limited availability of specific heritage samples. Additional photometric variants of the minority category were therefore generated while preserving the structural characteristics of the figures.
Image darkening was used to simulate low-illumination or underexposed acquisition conditions. Let
denote the original pixel value at spatial position
and color channel
. The darkened image
was generated by
where
is the brightness scaling factor,
is the brightness offset, and
constrains pixel values to the valid range for 8-bit images. For darkening,
, which reduces overall image intensity while preserving the original spatial structure and annotation coordinates.
- 2.
Image Brightening.
Image brightening was used to simulate overexposed scanning, reflective photography, or high-illumination acquisition conditions. The brightened image
was generated as
where
and
denote the brightness scaling factor and offset, respectively. For brightening,
, which increases image intensity without modifying the figure geometry or bounding-box coordinates.
- 3.
Salt-and-Pepper Noise.
Salt-and-pepper noise was used to simulate random pixel anomalies caused by scanning artifacts, image compression, paper aging, local damage, or transmission errors [
29]. The noise was applied independently to each color channel at each spatial position. The augmented pixel value
was defined as
where
and
denote the probabilities of salt noise and pepper noise, respectively. In this study,
per channel. This operation altered local pixel values without changing figure geometry or bounding-box annotations.
2.1.3. Dataset Statistics, Annotation Reliability, and Data Availability
The dataset contains 926 original images and 976 annotated figure instances. Because some images contain multiple opera figures, image- and instance-level counts were recorded separately. The category distribution of the original images and annotated instances across the training, validation, and test subsets is summarized in
Table 5.
To evaluate annotation reliability during dataset construction, two annotators—both researchers with backgrounds in design studies and visual culture—independently assigned initial visual-category labels according to the predefined operational criteria. Their judgments were based on observable cues, including costume, headwear, props, and posture, rather than on presumed art-historical character identity. Cohen’s kappa coefficient for category assignment was 0.98, calculated from the independent initial labels before adjudication, indicating a high level of inter-annotator agreement under the predefined criteria. This coefficient was used to assess annotation consistency within the specified task framework and does not establish that the three categories constitute an exhaustive or inherently objective taxonomy of opera figures. Disputed category labels and bounding-box discrepancies were subsequently reviewed by a third researcher with relevant expertise in Yuxian paper cutting, and samples that remained ambiguous after adjudication were excluded from the final dataset.
To further assess the consistency of the operational visual-category criteria, an additional expert-validation study was conducted. A stratified subset of 150 original images was selected from the 926-image collection, including 50 armor-clad, 50 robe-wearing, and 50 female-role figures. Five experts participated independently: two researchers in design and visual communication, one in art and folk-art studies, one in opera-related visual culture, and one in computer vision and digital heritage. Before the evaluation, the experts received the category definitions, observable visual criteria, and annotation instructions, but were blinded to the original dataset labels and to one another’s judgments. Each expert independently assigned every image to one of the three operational categories, and no missing or uncertain ratings occurred. Because the validation involved more than two raters and nominal category labels, multi-rater agreement was assessed using Fleiss’ kappa. The mean pairwise agreement rate was 96.8%, and Fleiss’ κ was 0.95, indicating a high level of agreement under the predefined operational criteria. These findings provide additional evidence that the category scheme can be applied consistently by experts with different disciplinary backgrounds. However, the agreement results demonstrate the reproducibility of the predefined operational criteria rather than the natural, universal, or art-historically definitive separability of the three categories.
The complete original image dataset constructed and analyzed in this study is not publicly available due to copyright and collection authorization restrictions related to catalogues, museum materials, folk collections, and online image sources. To support methodological transparency and academic verification, the manuscript provides detailed category definitions, annotation protocols, data-partition statistics, augmentation strategies, training hyperparameters, evaluation metrics, and ablation experimental details.
In addition, a curated dataset package containing publicly shareable resources, annotation files, category labels, and related metadata has been released through Kaggle (
https://www.kaggle.com/datasets/mawenzhe/chinese-opera-character-dataset, accessed on 17 July 2026). The released dataset package is intended to facilitate methodological verification, comparative experiments, and related research on heritage image analysis. It does not represent the complete original collection, and the use of copyrighted source materials remains subject to applicable permissions.
2.2. Key Techniques and Model Construction
2.2.1. YOLOv8n Baseline Detector
YOLOv8 is a one-stage object detection framework that performs object classification and bounding-box localization within a unified prediction process [
20,
30]. In this study, YOLOv8n, the nano-scale variant of the YOLOv8 family, was adopted as the baseline detector. Compared with larger YOLOv8 variants, YOLOv8n provides a relatively compact model structure and offers an appropriate starting point for evaluating the effect of task-specific feature enhancement on the present dataset.
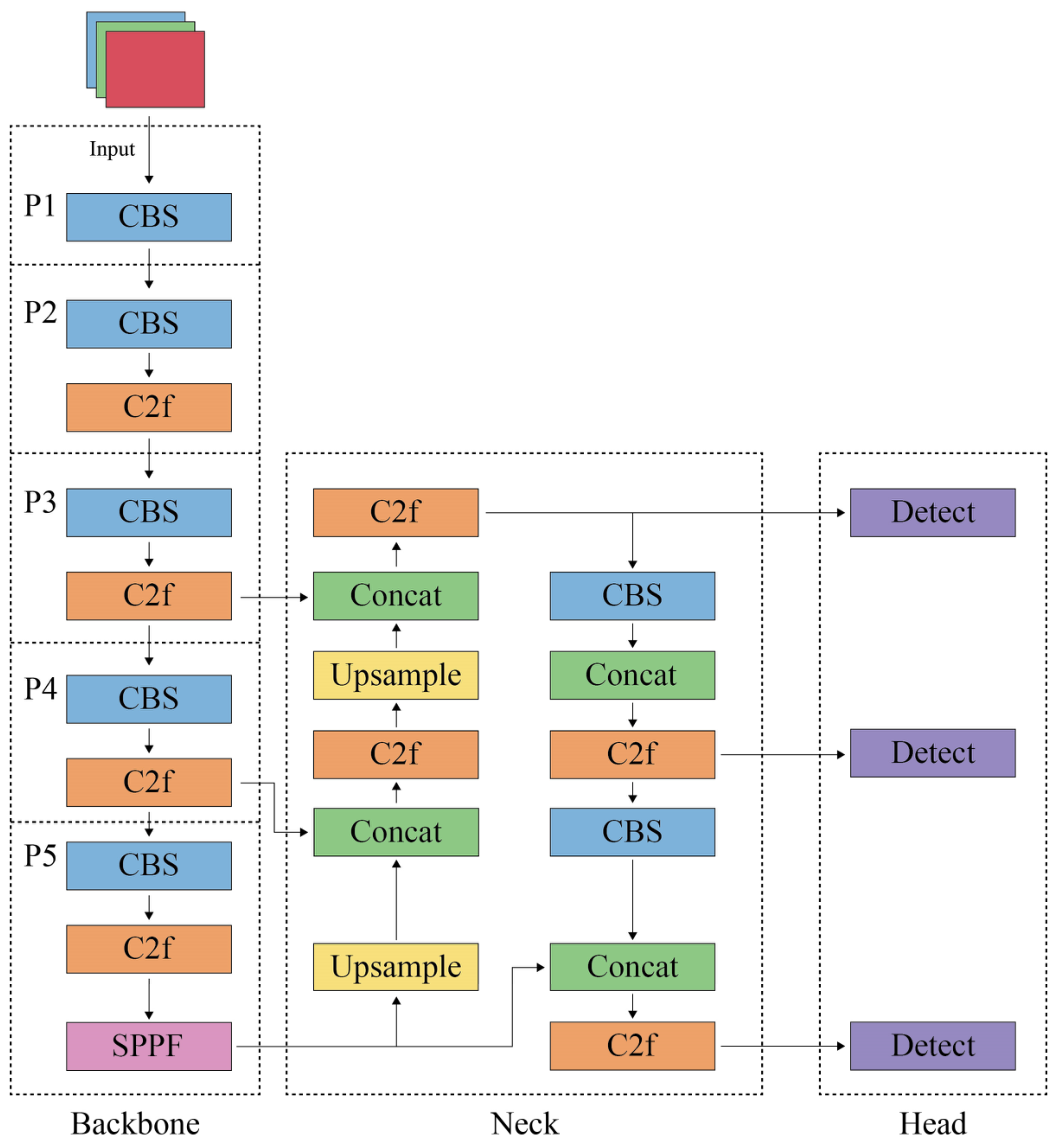
The baseline network consists of a backbone, a neck, and a detection head. The backbone extracts hierarchical features from the input image through convolutional layers and C2f modules. C2f refers to the Cross Stage Partial bottleneck module with two convolutional layers, which supports feature reuse and gradient propagation. At the end of the backbone, the Spatial Pyramid Pooling-Fast (SPPF) module aggregates contextual information at multiple receptive fields. The neck integrates features at different spatial scales through upsampling, concatenation, and feature fusion operations. The detection head adopts an anchor-free and decoupled design, in which category prediction and bounding-box regression are processed through separate branches [
30].
This architecture provides a suitable baseline for detecting Yuxian paper-cut opera figures because the task requires both category discrimination and figure localization. The three visual categories are distinguished mainly through localized cues, including armor, weapons, back flags, official hats, robes, skirts, draped scarves, props, and body posture. However, these cues may occupy only a limited portion of an image and can be affected by decorative motifs, overlapping elements, or incomplete figure contours. Under such conditions, the baseline detector may not consistently emphasize the most informative regional features or maintain stable localization around visually ambiguous boundaries.
Accordingly, YOLOv8n was retained as the basic detection framework. The SCSA module was introduced to refine spatial and channel responses associated with category-relevant regions, while Inner-IoU was used to adjust bounding-box regression during training. Together, these components were configured to address feature representation and bounding-box regression in Yuxian paper-cut opera figure images. In the original YOLOv8n baseline, bounding-box regression included a CIoU-based overlap term. This baseline configuration was retained as the reference for comparison with the Inner-IoU variants described below. The overall architecture of the YOLOv8n baseline detector is illustrated in
Figure 1.
2.2.2. Spatial and Channel Synergistic Attention Module
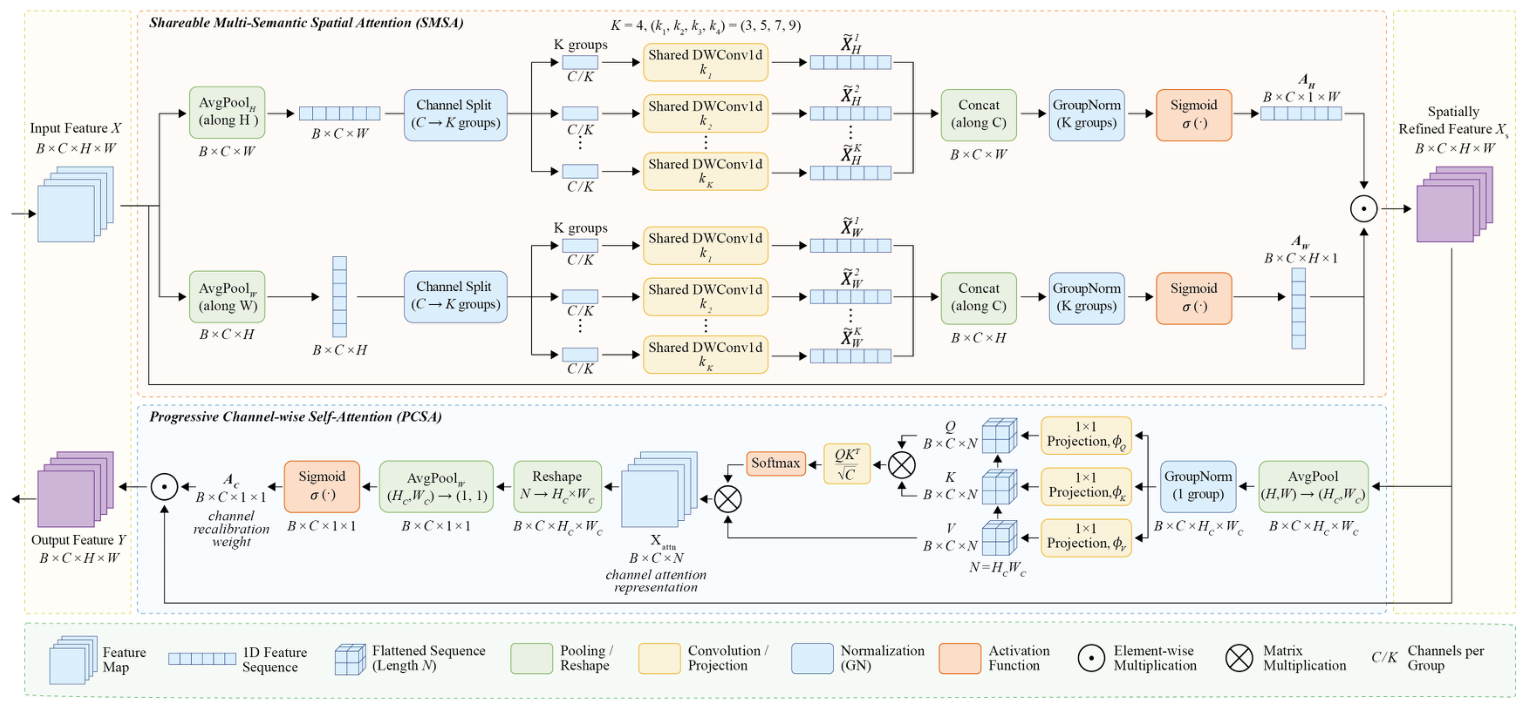
The Spatial and Channel Synergistic Attention (SCSA) module was introduced to refine feature representations before detection. SCSA consists of two sequential components: Shareable Multi-Semantic Spatial Attention (SMSA) and Progressive Channel-wise Self-Attention (PCSA) [
22]. SMSA first extracts multi-semantic spatial priors from feature maps at different receptive fields. PCSA then uses the spatially refined features to model inter-channel dependencies and recalibrate channel responses. The two components are connected sequentially as
Let the input feature map be denoted as
where
,
,
, and
denote the batch size, number of channels, height, and width of the input feature map, respectively.
- (1)
Shareable Multi-Semantic Spatial Attention
In SMSA, average pooling is first applied along the height and width dimensions to convert the two-dimensional feature map into two one-dimensional feature sequences:
where
denotes average pooling along the height dimension, whereas
denotes average pooling along the width dimension.
The channel dimension is then partitioned into
disjoint sub-features. Following the original SCSA configuration,
, and
is divisible by
. The
-th sub-feature is defined as
where
, and
and
denote the
-th channel-grouped sub-features derived from the width-wise and height-wise pooled representations, respectively.
Each sub-feature is processed using a shared depth-wise one-dimensional convolution with kernel size
:
where
denotes a depth-wise one-dimensional convolution with kernel size
. The convolutional operation for each sub-feature group is shared between the two directional branches. Following the original SCSA design, the kernel sizes are defined as
The processed sub-features are concatenated along the channel dimension. Group Normalization with
groups and Sigmoid activation are subsequently applied to generate directional multi-semantic spatial priors:
where
and
denote the spatial priors generated from the height- and width-wise pooled feature sequences, respectively.
denotes channel-wise concatenation,
denotes Group Normalization with
groups, and
denotes the Sigmoid activation function.
Before element-wise multiplication,
and
are broadcast along their singleton spatial dimensions. After reshaping, the spatial priors are broadcast to match the input feature map dimensions before element-wise multiplication. The spatially refined feature map is obtained as
where
denotes the output of SMSA, and
denotes element-wise multiplication.
- (2)
Progressive Channel-wise Self-Attention
The PCSA module takes
as input. Progressive spatial compression is first applied to reduce the computational cost of channel-wise self-attention while retaining the spatial priors generated by SMSA:
where
and
and
denote the compressed spatial height and width, respectively.
The compressed feature map is normalized and then mapped to the query, key, and value representations:
where
denotes Group Normalization with one group, and
,
, and
denote the projection functions used to generate the query, key, and value representations, respectively.
The spatial dimensions are reshaped into a token dimension:
Channel-wise single-head self-attention is then calculated as
where
denotes the channel-dependency matrix, and
denotes the channel-attention representation.
The attention output is reshaped to
. Global average pooling is then applied to aggregate the spatial responses, and a Sigmoid function produces the channel recalibration weights:
where
denotes the channel recalibration weight.
Finally, the output of the SCSA module is calculated as
where
denotes the final output feature map.
Through this sequential design, SMSA extracts directional multi-semantic spatial priors from feature structures with different receptive fields, whereas PCSA captures inter-channel dependencies using the spatially refined representation. Compared with attention mechanisms that emphasize only channel importance or a single spatial attention map, SCSA combines directional spatial modeling, multi-receptive-field feature extraction, and channel-wise dependency modeling in a unified sequential structure [
22]. This design is particularly relevant when category discrimination depends on both localized structural cues and their relationships across feature channels, rather than on global image appearance alone.
SCSA was therefore selected as a feature-refinement component for the present detection task. Yuxian paper-cut opera figures often feature dense decorative patterns, strong color contrasts, and visually overlapping ornaments, whereas the category distinctions are primarily expressed through localized form cues, including armor structures, weapons, back flags, official hats, robes, skirts, draped scarves, props, and body-posture features. SMSA is intended to retain spatial responses associated with these cues across different receptive fields, while PCSA recalibrates channel responses using the spatially refined representation. In the present task, this combination is expected to support feature representation for subsequent category prediction and bounding-box localization by adjusting responses associated with localized visual patterns. In the present study, SCSA is evaluated through comparative detection performance under a unified experimental protocol, together with qualitative activation-map visualization of representative test samples. The numerical and visual results are interpreted as complementary evidence of task-specific response differences rather than as direct proof of the module’s internal causal mechanism. Accordingly, SCSA was incorporated into YOLOv8n to support visual-category detection of armor-clad, robe-wearing, and female-role figures. The overall architecture of the SCSA module is illustrated in
Figure 2. It was not designed to infer the art-historical identity, dramatic narrative, or specific character name of an individual figure.
2.2.3. Inner-IoU Bounding-Box Regression Loss
Intersection over Union (IoU)-based losses are widely used in object detection to measure the overlap between a predicted bounding box and its corresponding ground-truth box. Let the predicted box and ground-truth box be denoted by
and
, respectively. Their standard IoU is defined as
where
denotes the intersection area between the predicted and ground-truth boxes, and
denotes their union area.
Inner-IoU introduces auxiliary bounding boxes derived from the predicted and ground-truth boxes through a scaling ratio
[
31]. The auxiliary boxes are denoted by
and
. Their center coordinates remain unchanged, while their width and height are scaled as follows:
where
and
denote the width and height of the original bounding box, respectively, and
denotes the auxiliary-box scaling ratio. When
, the auxiliary box is smaller than the original box and greater emphasis is placed on the internal overlap region. When
, the auxiliary box expands beyond the original box and provides a broader overlap constraint.
The Inner-IoU term is calculated using the overlap between the auxiliary predicted box and the auxiliary ground-truth box:
In the adopted implementation, the CIoU-based overlap term used in the original YOLOv8n bounding-box regression loss was replaced with the Inner-IoU term, while the remaining detection-head configuration was kept unchanged. The regression loss associated with the Inner-IoU overlap term is expressed as
where
denotes the Inner-IoU-based overlap loss. In this study, the auxiliary-box scaling ratio
was evaluated at 0.4, 0.5, 0.6, 0.7, and 0.8 under otherwise identical experimental conditions. Because all evaluated values were smaller than 1, the corresponding auxiliary boxes emphasized the internal overlap region of the predicted and ground-truth boxes to different degrees. The sensitivity analysis was conducted to determine an appropriate scaling ratio for the present dataset rather than assuming
a priori. Among the tested values,
provided the most favorable overall detection performance and was therefore used in the subsequent component-combination experiments. The detailed results are reported in
Section 3.2.
The use of Inner-IoU does not alter the feature-extraction or category-prediction branches of YOLOv8n. It is applied only during training as an alternative overlap term for bounding-box regression. In the present task, this configuration was intended to place additional emphasis on internal overlap when figure boundaries were incomplete or visually merged with surrounding decorative elements. Its effect and sensitivity to the auxiliary-box scaling ratio are evaluated through the detection metrics reported under the current dataset and training configuration.
2.2.4. Overall Network Configuration and Task-Specific Adaptation
Based on the above considerations, this study configures a YOLOv8n-based detector for the task-specific visual detection of Yuxian paper-cut opera figures. The configuration retains the original YOLOv8n architecture and incorporates two existing components: SCSA for feature refinement and Inner-IoU for bounding-box regression. This engineering adaptation is tailored to the localized visual cues and boundary characteristics of the present heritage image dataset. It is not intended to constitute a new detection architecture or to establish a universally optimal combination of attention and regression components.
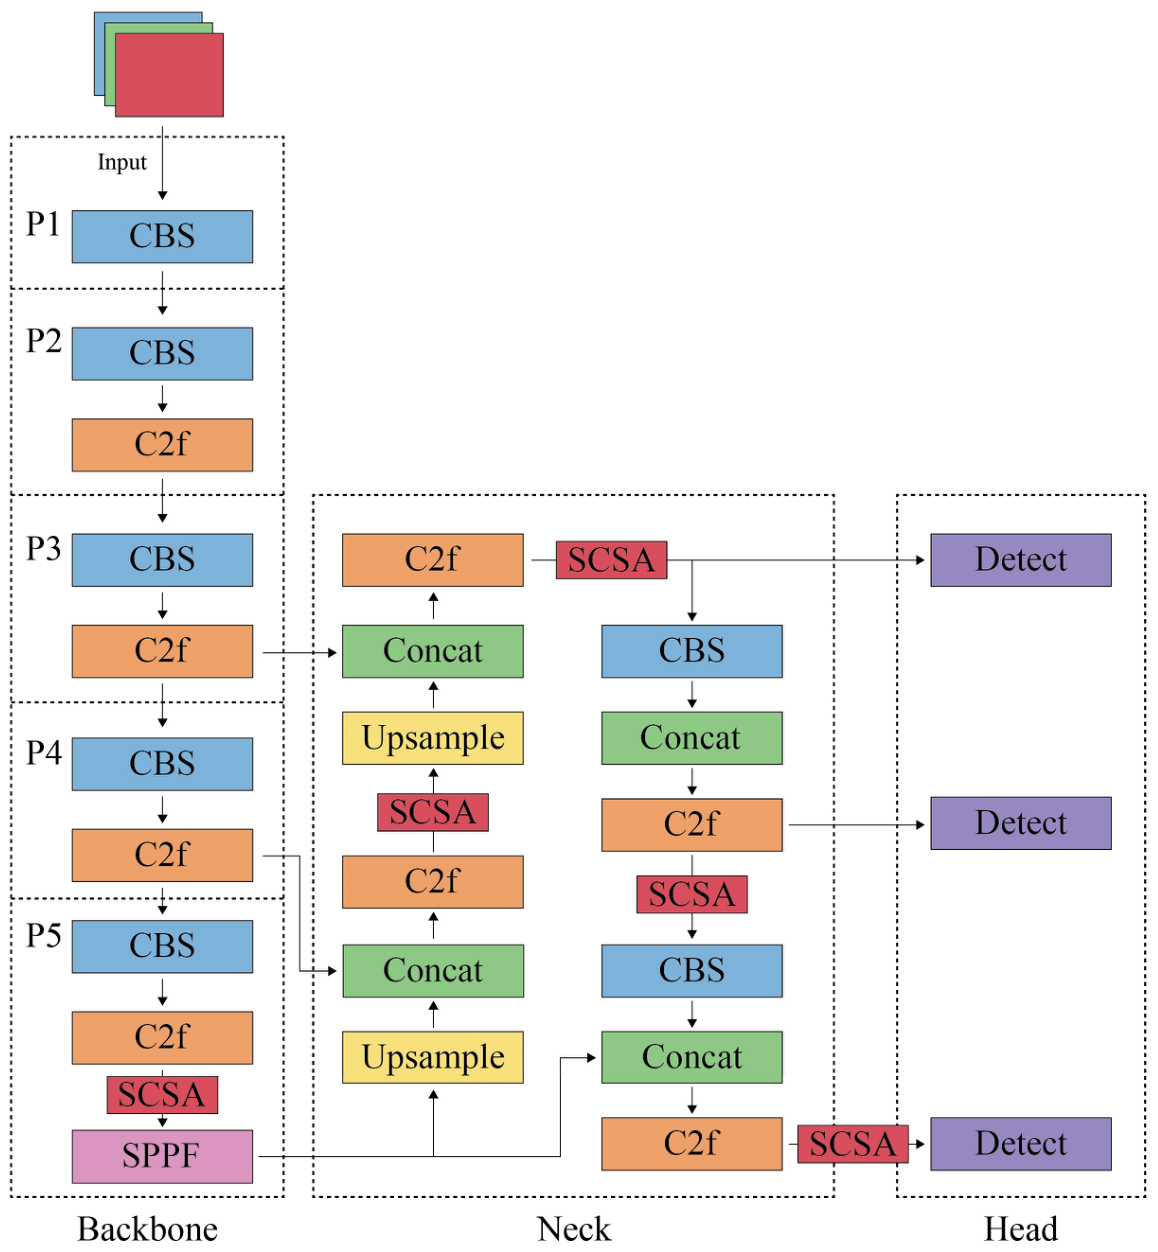
As illustrated in
Figure 3, the final evaluated configuration inserts the SCSA module at both high-level feature outputs and multi-scale feature fusion paths of YOLOv8. Specifically, SCSA is inserted after the P5 layer of the backbone and within selected neck upsampling and concatenation paths. This combined placement achieved the best overall detection performance among the evaluated SCSA placement strategies under the current dataset and experimental protocol. Embedding SCSA after the P5 output is intended to refine high-level semantic features before they enter the neck, with emphasis on regions associated with category discrimination, such as costume structures, weapons, props, and body postures. Introducing SCSA at selected neck feature fusion positions is intended to retain category-relevant information during upsampling, concatenation, and multi-scale fusion, while reducing the influence of complex decorative patterns, backgrounds, and locally similar structures. Meanwhile, Inner-IoU is applied at the bounding-box regression stage to place additional emphasis on internal overlap regions when figure boundaries are visually weak or partially merged with surrounding elements.
The evaluated configuration emphasizes task-specific adaptation rather than increased network depth or architectural complexity. SCSA is used to refine spatial and channel responses associated with localized visual cues, whereas Inner-IoU provides an additional regression constraint for figures with weak, incomplete, or visually merged boundaries. The resulting combination is evaluated as a domain-specific engineering configuration for expert-assisted heritage image organization under the present dataset and experimental setting. It is not intended to establish the universal optimality of the selected components, insertion strategy, regression loss, or deployment configuration.
2.3. Experimental Setup and Training Configuration
All YOLOv8n-based experiments were conducted on a Windows 10 workstation equipped with an NVIDIA RTX 4060 Ti GPU (NVIDIA Corporation, Santa Clara, CA, USA; 8 GB VRAM) and running Python version 3.8, PyTorch version 1.10, CUDA version 11.0, and Ultralytics YOLO version 8.0.141. YOLOv10n was implemented using its official codebase under the same hardware environment and evaluated using the same dataset split, input resolution, training epochs, batch size, and evaluation protocol.
YOLOv8n was used as the baseline detector and initialized with COCO-pretrained weights. To assess the stability of the evaluated YOLOv8n-SCSA configuration with Inner-IoU, five independent training runs were conducted using different random seeds under the same dataset split, input resolution, training epochs, batch size, optimizer settings, and evaluation protocol.
Table 6 reports the detector comparisons and component-ablation results.
Table 7 presents the Inner-IoU scaling-ratio sensitivity analysis. The results of the five independent runs are summarized in
Table 8. Mixed-precision training was enabled to reduce memory usage and accelerate training.
All input images were resized to 640 × 640 pixels. The model was trained for 200 epochs with a batch size of 8. Stochastic gradient descent (SGD) was adopted as the optimizer. The initial learning rate, final learning-rate factor, momentum, weight decay, warm-up settings, and all remaining training hyperparameters followed the default configuration of Ultralytics YOLO version 8.0.141. The hyperparameters were retained without task-specific tuning because the primary objective was to compare the performance differences between SCSA and Inner-IoU under a fixed training protocol.
The dataset was split into training, validation, and test sets (648, 185, and 93 images; 7:2:1). After augmentation, the training set contained 717 images. Training-set augmentation followed the photometric strategy in
Section 2.1.2 and used only female-role images to mitigate class imbalance.
For the Inner-IoU sensitivity analysis, the auxiliary-box scaling ratio was set to 0.4, 0.5, 0.6, 0.7, and 0.8. All five experiments used the same dataset split, training data, random seed, model structure, input resolution, epoch count, batch size, optimizer settings, hyperparameters, and evaluation protocol; only varied. Based on this comparison, was retained for the subsequent YOLOv8n-SCSA configuration with Inner-IoU. In all Inner-IoU experiments, the original CIoU-based overlap term was replaced with Inner-IoU, while the remaining detection-head configuration was kept unchanged. Comparison models were trained and evaluated under the same data split, input resolution, epoch count, batch size, and evaluation criteria to ensure fair comparison.
To provide a more recent lightweight detector reference, YOLOv10n was additionally evaluated under the same experimental protocol as the other comparison models. Its results were used as a comparative benchmark only; the SCSA and Inner-IoU ablation experiments remained based on YOLOv8n to maintain a controlled implementation framework.
Model forward-pass throughput was measured on the same GPU using images from the test set at an input size of 640 × 640. Before timing, 50 warm-up iterations were performed. The reported FPS represents forward-pass throughput, excluding preprocessing and post-processing. A confidence threshold of 0.25 was used for evaluation. For models requiring non-maximum suppression, the NMS IoU threshold was set to 0.45.
2.4. Evaluation Metrics
Model performance was evaluated using precision, recall, F1 score, average precision (AP), mean average precision (mAP), and frames per second (FPS). These metrics assess false-positive control, target coverage, the balance between precision and recall, overall detection and localization performance, and computational efficiency.
For a given visual category and an IoU threshold
, a predicted bounding box was counted as a true positive (TP) when it matched one ground-truth bounding box of the same category with an IoU value not lower than
. Each ground-truth box could be matched with at most one prediction, and each prediction could be matched with at most one ground-truth box. Unmatched predictions were counted as false positives, whereas unmatched ground-truth boxes were counted as false negatives. For the class-wise error statistics reported later, matching was performed at an IoU threshold of 0.50 with a confidence threshold of 0.25 and an NMS IoU threshold of 0.45, as specified in
Section 2.3. The normalized confusion matrix was used to visualize category-assignment patterns generated by the evaluation framework. The class-wise TP, FP, and FN statistics calculated at the fixed thresholds specified above are reported in the Results section. The two analyses provide complementary category-level information.
Precision represents the proportion of correct detections among all predicted detections and is defined as
A higher precision value indicates fewer false detections. In the present task, this reduces the risk of assigning an opera figure image to an incorrect visual category.
Recall represents the proportion of correctly detected targets among all ground-truth targets and is defined as
A higher recall value indicates that fewer annotated figures are missed by the detector.
The F1 score is the harmonic mean of precision and recall:
The F1 score provides a balanced measure of detection reliability and target coverage. A high F1 score requires both high precision and high recall.
Average precision (AP) measures the area under the interpolated precision–recall curve for a single category at a specified IoU threshold:
where
denotes the category,
denotes the IoU threshold,
denotes recall, and
denotes the interpolated precision at recall level
. AP reflects the detection performance of one category across different confidence thresholds.
Mean average precision at a specified IoU threshold
is calculated as the mean AP value across all
categories:
In this study, , corresponding to armor-clad, robe-wearing, and female-role figures. The metric refers to , which evaluates detection performance under an IoU threshold of 0.50.
To provide a stricter assessment of localization quality,
was calculated by averaging mAP values over ten IoU thresholds from 0.50 to 0.95 with an interval of 0.05:
Compared with , places greater emphasis on accurate bounding-box localization because it includes more stringent IoU thresholds.
Inference efficiency was measured using FPS. Let
denote the number of test images and
denote the total inference time in seconds. FPS was calculated as
The reported FPS was measured on an NVIDIA RTX 4060 Ti GPU with an input resolution of 640 × 640. The inference time T included only the model forward pass, excluding image preprocessing and non-maximum suppression. This timing protocol was adopted to isolate the computational cost of the complete model forward pass. All measurements were performed with a batch size of 1 under the PyTorch framework.
In addition to the overall metrics, per-class precision, recall, AP, and F1 score were reported to examine category-specific performance. A normalized confusion matrix, precision–recall curves, confidence curves, and representative detection examples were also used to analyze common category confusions and localization errors.
To qualitatively compare the spatial response distributions of the baseline and SCSA-enhanced models, class-activation heatmaps were generated for representative test images from the three operational visual categories. The same input image, predicted target category, feature layer, visualization parameters, and normalization procedure were used for each paired comparison. The activation maps were normalized to the range of 0–1 and overlaid on the corresponding input images, with warmer colors indicating relatively stronger responses within each visualization. The heatmaps were used to examine spatial response patterns qualitatively and were not treated as quantitative measures of attention strength or direct evidence of cultural-semantic understanding.
3. Results
3.1. Detection Performance and Training Convergence
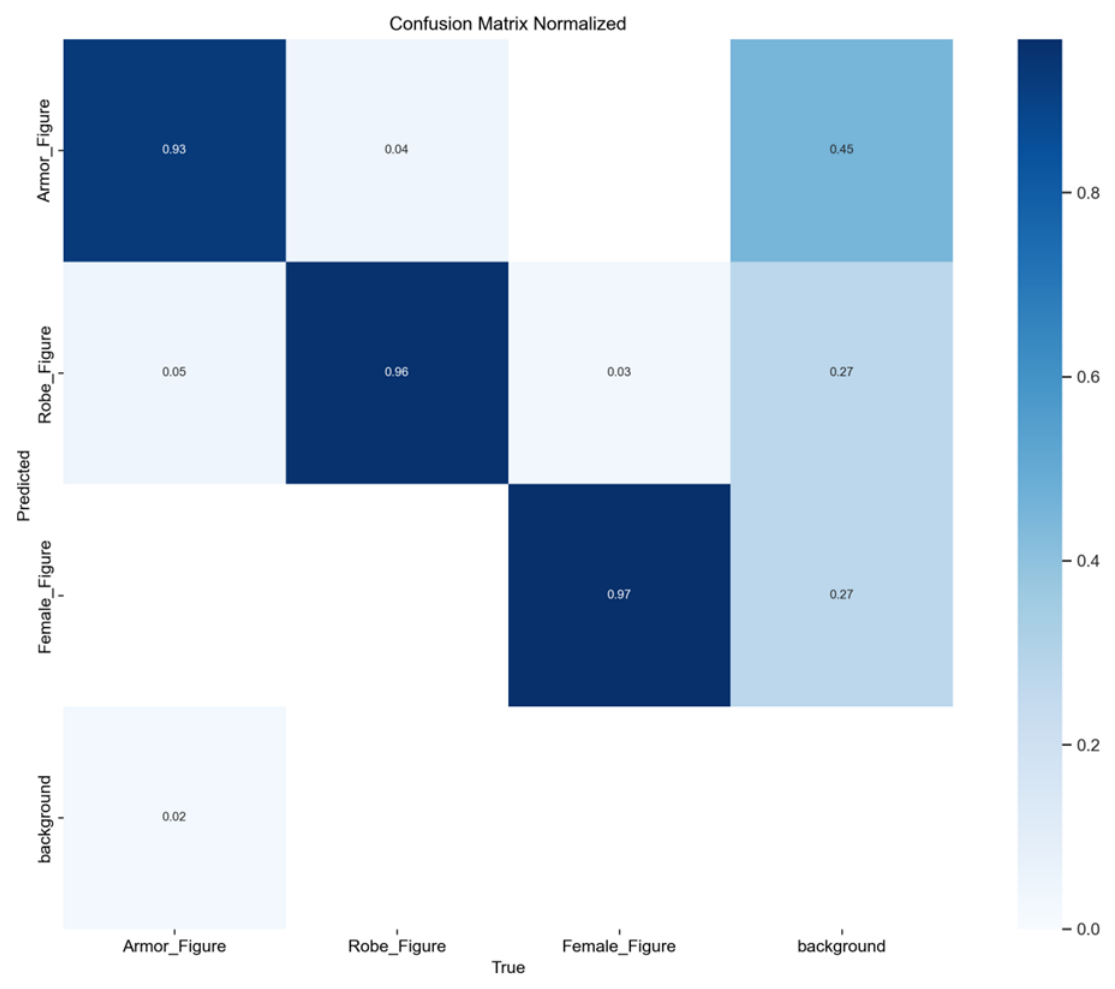
Figure 4 presents the normalized confusion matrix of the evaluated YOLOv8n-SCSA configuration with Inner-IoU on the test set. The diagonal values for armor-clad, robe-wearing, and female-role figures were 93%, 96%, and 97%, respectively. The matrix summarizes normalized category-assignment patterns within the evaluation framework and is used primarily to examine inter-category confusion. Robe-wearing and female-role figures showed relatively higher diagonal values, whereas armor-clad figures showed slightly more category confusion. This pattern may be associated with visual interference from weapons, back flags, decorative motifs, and surrounding background regions. Fixed-threshold class-wise TP, FP, and FN statistics were further analyzed to provide complementary category-level error information.
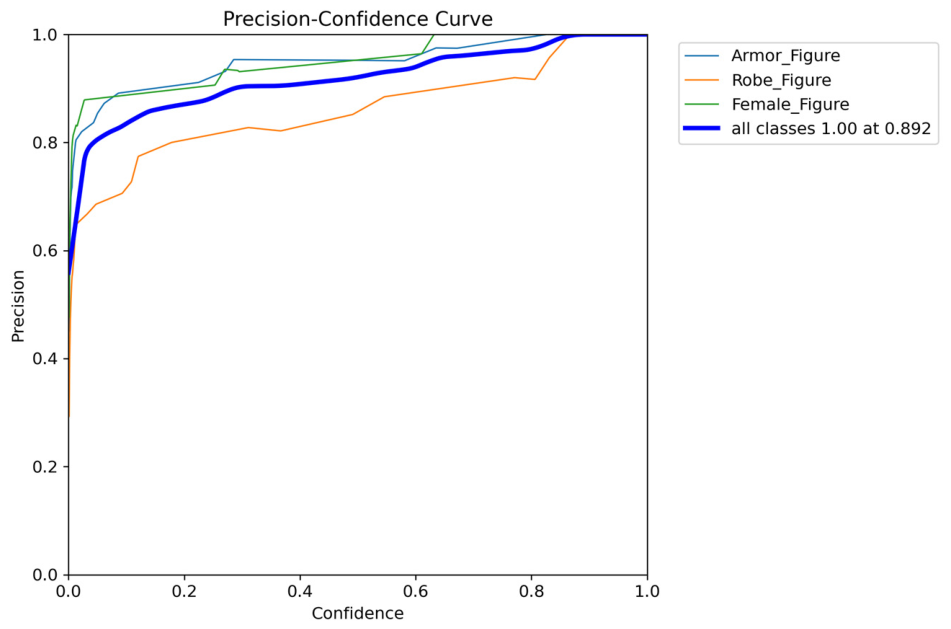
Figure 5 presents the precision-confidence curves for the three visual categories. Precision generally increased as the confidence threshold increased, indicating that higher confidence filtering reduced false detections. Armor-clad and female-role figures maintained relatively high precision across a broad confidence range, whereas the precision of robe-wearing figures increased more gradually. The precision values of all categories reached 1.00 at a confidence threshold of approximately 0.892. This result should be interpreted together with recall because a high confidence threshold may also remove valid detections.
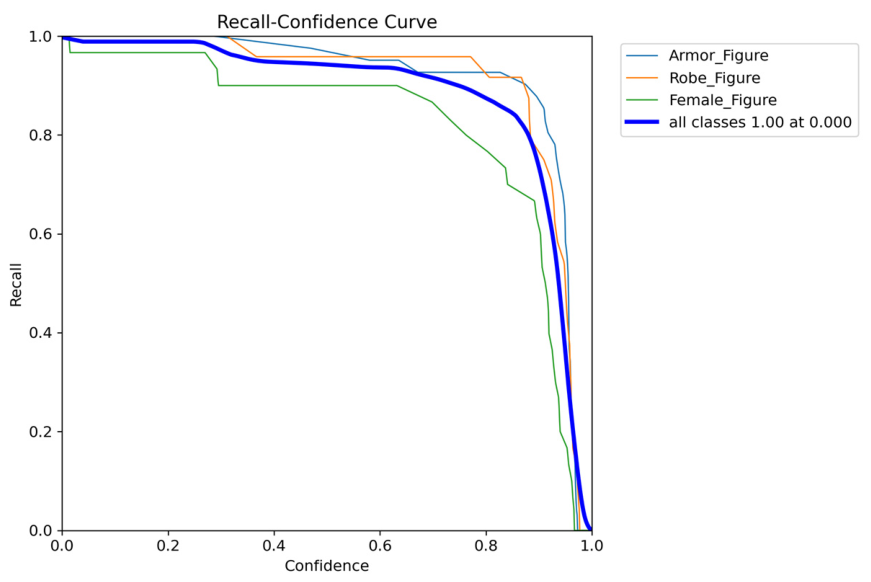
Figure 6 presents the recall confidence curves. Recall was highest at relatively low confidence thresholds and gradually declined as the threshold increased. Armor-clad figures and robe-wearing figures showed comparatively smooth decreases in recall. Female-role figures showed an earlier decline at high confidence thresholds, suggesting that some female-role samples were more likely to be missed under strict confidence filtering. This result is consistent with the visual overlap between some female-role and robe-wearing features, particularly when costume structures, posture, or local ornaments are incomplete.
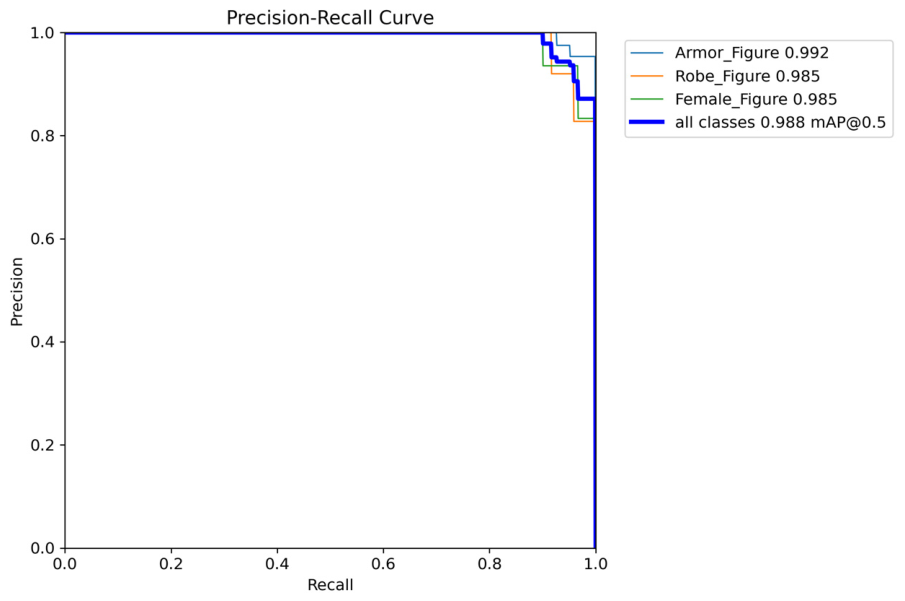
Figure 7 presents the precision–recall curves. The AP values of armor-clad, robe-wearing, and female-role figures were 0.992, 0.985, and 0.985, respectively. The overall mAP@0.5 was approximately 0.988. These results indicate that the evaluated model maintained a favorable balance between precision and recall across the three visual categories at an IoU threshold of 0.50.
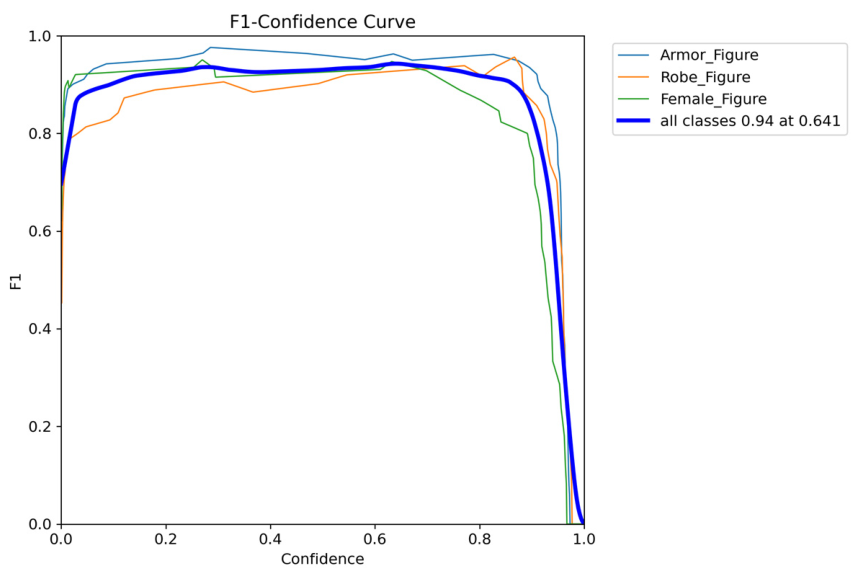
Figure 8 presents the F1–confidence curves. The overall F1 score reached 0.94 at a confidence threshold of approximately 0.641. This threshold represents the most balanced operating point between precision and recall under the current test setting. The F1 curve of armor-clad figures remained relatively stable, whereas female-role figures showed a more noticeable decline at high confidence thresholds. This result further suggests that female-role figures require more cautious threshold selection in practical retrieval or annotation scenarios.
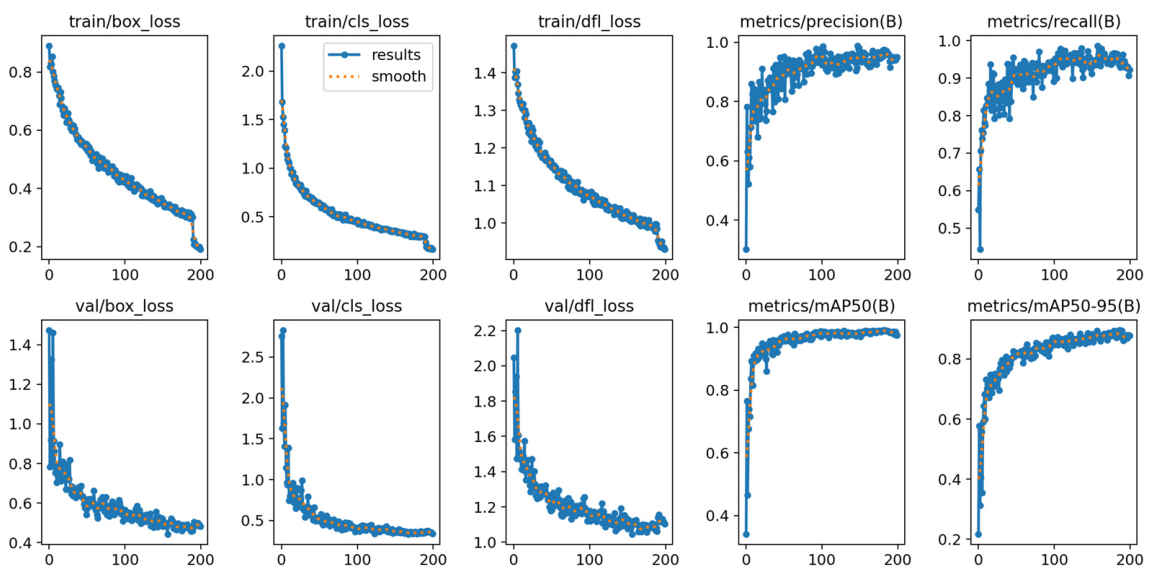
Figure 9 presents the changes in training loss, validation loss, precision, recall, mAP@0.5, and mAP@0.5:0.95 during one representative training run. The loss curves generally decreased as training progressed, while the main detection metrics gradually increased and approached a plateau. The final mAP@0.5 and mAP@0.5:0.95 reached approximately 98.8% and 89.6%, respectively. The curves did not show a pronounced validation-loss rebound under the current dataset split and training configuration. They characterize the convergence behavior of the representative run but do not quantify variability across alternative dataset partitions or external collections.
Overall, the reported run showed consistent detection performance on the constructed test set under the current split and fixed training configuration. The model achieved comparatively high metric values across the three visual categories, although category confusion and missed detections remained possible in samples with incomplete figures, overlapping costume features, dense ornaments, or weak figure boundaries. The test set contained 93 original images and covered only three visual categories. Therefore, the reported results provide task-specific evidence for the present heritage image collection. They do not establish general performance across all paper-cut images or cultural-heritage domains.
3.2. Ablation Study
To examine the relative contribution of SCSA and Inner-IoU, ablation experiments were conducted under the same data split, input size, training epochs, batch size, optimizer settings, and evaluation criteria. The photometric augmentation procedure described in
Section 2.1.2 was applied once at the dataset level before model training, and the same final augmented training set was used for all evaluated detector variants. Therefore, the ablation study evaluates the relative effect of the selected model-level modifications under a fixed training-data condition; it does not quantify the independent contribution of individual augmentation operations.
YOLOv5, YOLOv8n, and YOLOv10n were included as one-stage detector references, while Faster R-CNN was included as a representative two-stage detector. YOLOv8n-Inner-IoU was used to assess the performance differences associated with replacing the original CIoU-based overlap term with Inner-IoU, whereas YOLOv8n-SCSA was used to assess the differences associated with spatial-channel feature refinement. The YOLOv8n-SCSA configuration with Inner-IoU combines both components. These comparisons were conducted under the same dataset and evaluation protocol to examine the task-specific effects of the evaluated configurations rather than to establish universal superiority over other attention mechanisms, regression losses, or detector families. The comparative results are reported in
Table 6.
To further investigate the influence of the SCSA insertion location, additional ablation experiments were conducted by placing SCSA in the backbone only, neck only, and both backbone and neck under the same training and evaluation settings (
Table 6). Compared with the YOLOv8n baseline, the backbone-only configuration improved recall from 89.3% to 90.8% and increased mAP@0.5 from 95.9% to 96.2%, indicating that enhanced feature representation at deeper backbone stages can improve category-related feature extraction. The neck-only configuration achieved slightly higher overall performance, with 93.5% precision, 90.9% recall, and 96.6% mAP@0.5, suggesting that multi-scale feature fusion contributes to the integration of local structural cues. The combined backbone-and-neck configuration further improved performance to 94.5% precision, 91.8% recall, 97.6% mAP@0.5, and 88.3% mAP@0.5:0.95. Therefore, the final configuration adopts SCSA at both locations within the evaluated experimental setting.
Among the evaluated lightweight one-stage detectors, YOLOv8n outperformed YOLOv5 across precision, recall, mAP@0.5, and mAP@0.5:0.95 by 3.6, 3.6, 4.1, and 4.2 percentage points, respectively. YOLOv10n achieved 93.8% precision, 91.1% recall, 96.7% mAP@0.5, and 87.6% mAP@0.5:0.95, exceeding YOLOv8n by 1.0, 1.8, 0.8, and 0.9 percentage points, respectively. It also showed slightly higher forward-pass throughput and lower FLOPs. Faster R-CNN produced lower detection metrics and lower forward-pass throughput than the evaluated YOLO-based detectors. Under the present dataset and implementation settings, YOLOv8n was retained as the ablation baseline because both evaluated components were integrated into its architecture.
When Inner-IoU with was introduced into YOLOv8n, precision, recall, mAP@0.5, and mAP@0.5:0.95 increased to 93.2%, 90.3%, 96.5%, and 87.4%, respectively, corresponding to increases of 0.4, 1.0, 0.6, and 0.7 percentage points over the baseline. Forward-pass throughput decreased marginally from 95.2 to 94.6 FPS, while FLOPs remained unchanged at 8.9 G. These results indicate moderate performance differences under the present dataset and training configuration, with limited influence on forward-pass throughput and no change in the reported FLOPs. The selection of was further examined through the sensitivity analysis described below.
To examine the sensitivity of Inner-IoU to the auxiliary-box scaling ratio,
was evaluated at 0.4, 0.5, 0.6, 0.7, and 0.8 under otherwise identical experimental conditions. As shown in
Table 7, all four detection metrics increased gradually as
increased from 0.4 to 0.6 and declined when
was further increased to 0.7 and 0.8. Among the tested values,
achieved the most favorable overall performance, with a precision of 93.2%, a recall of 90.3%, an mAP@0.5 of 96.5%, and an mAP@0.5:0.95 of 87.4%. Accordingly,
was retained for the subsequent experiments involving the combined SCSA and Inner-IoU configuration.
When SCSA was introduced into YOLOv8n, precision, recall, mAP@0.5, and mAP@0.5:0.95 increased to 94.5%, 91.8%, 97.6%, and 88.3%, respectively. Compared with the baseline, these values correspond to increases of 1.7, 2.5, 1.7, and 1.6 percentage points. Forward-pass throughput decreased from 95.2 to 93.1 FPS, and FLOPs increased from 8.9 to 9.1 G, reflecting the additional operations associated with the SCSA module.
Among the configurations evaluated in this study, the YOLOv8n-SCSA configuration with Inner-IoU achieved the highest overall detection metrics, with 95.8% precision, 92.9% recall, 98.8% mAP@0.5, and 89.6% mAP@0.5:0.95. Relative to YOLOv8n, the corresponding increases were 3.0, 3.6, 2.9, and 2.9 percentage points. Compared with YOLOv10n, the evaluated configuration showed increases of 2.0, 1.8, 2.1, and 2.0 percentage points, respectively, while showing lower forward-pass throughput of 92.3 FPS compared with 96.5 FPS. These results indicate that the combined configuration produced the highest detection metrics among the directly evaluated settings, with a moderate reduction in forward-pass throughput.
Overall, the two components showed different patterns of metric change relative to YOLOv8n. The reported FPS values represent model forward-pass throughput and do not include preprocessing, post-processing, data transfer, or application-level latency.
To further evaluate performance stability across random initializations, the evaluated YOLOv8n-SCSA configuration with Inner-IoU was trained five times using different random seeds, while the dataset split, training data, hyperparameters, and evaluation protocol were held constant. As shown in
Table 8, the mean precision, recall, mAP@0.5, and mAP@0.5:0.95 were 95.6%, 92.8%, 98.7%, and 89.5%, respectively, with corresponding standard deviations of 0.3, 0.4, 0.2, and 0.3 percentage points. The limited variation across the five runs indicates stable performance across the evaluated random initializations under the fixed dataset split. However, these results do not characterize variability across alternative data partitions or independently acquired heritage collections.
Table 9 presents representative detection results produced by the YOLOv8n baseline and the evaluated YOLOv8n-SCSA configuration with Inner-IoU. The displayed examples illustrate qualitative differences in category prediction and bounding-box placement relative to the annotated figure extent. These examples are illustrative and do not constitute a quantitative evaluation of localization performance across different boundary conditions.
3.3. Attention-Response Visualization
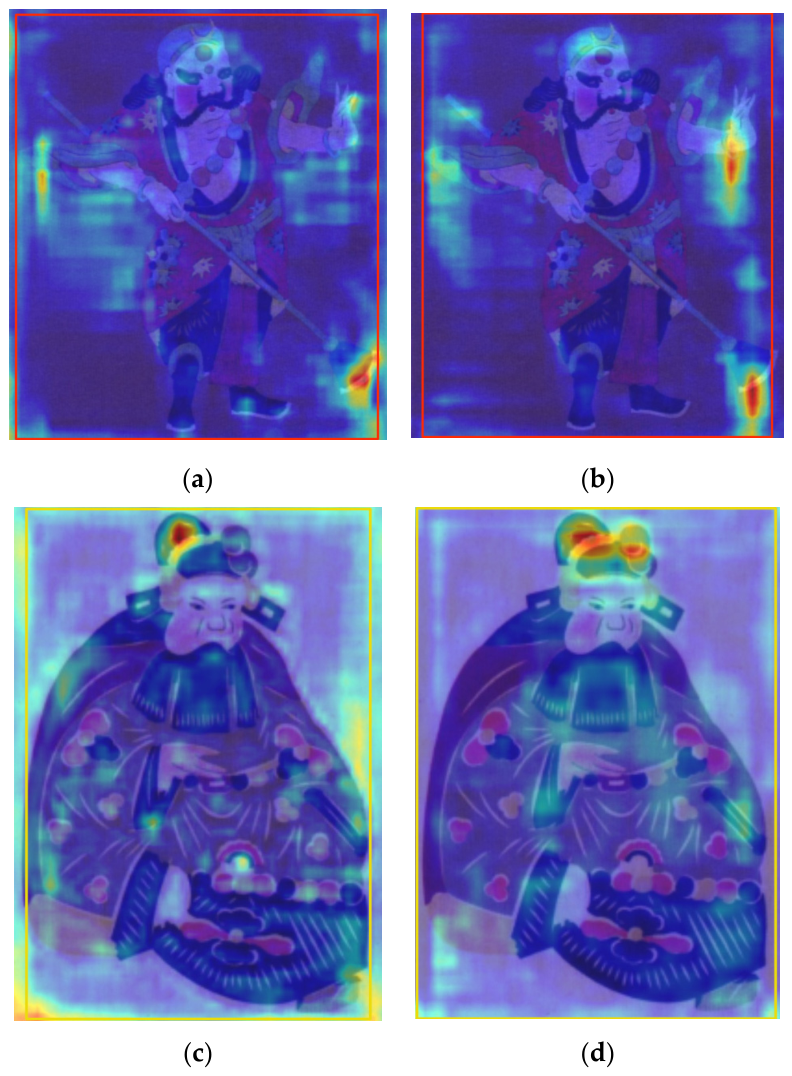
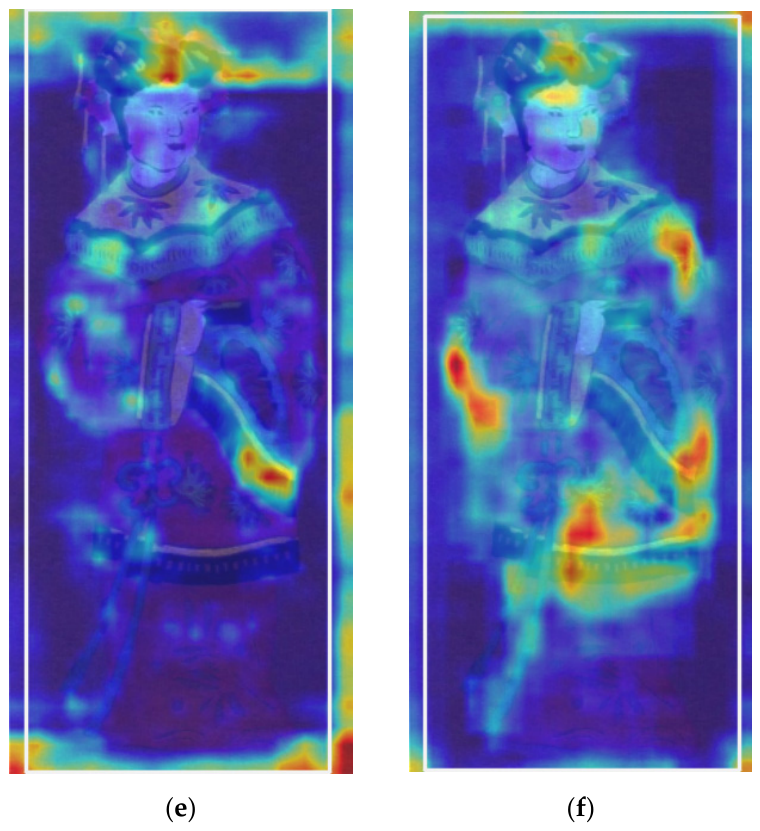
To provide qualitative evidence of the spatial response patterns associated with SCSA, paired activation heatmaps were generated for representative armor-clad, robe-wearing, and female-role figures. As shown in
Figure 10, the YOLOv8n baseline and the YOLOv8n-SCSA configuration were compared using the same input images and target categories.
For the armor-clad example, the YOLOv8n baseline showed relatively dispersed activation across the figure, image boundaries, and background regions. The SCSA-enhanced configuration produced more distinct responses around the raised arm, hand-held prop, headwear, and selected limb regions, although some peripheral activation remained visible.
For the robe-wearing example, the baseline responses were distributed across the figure body, lower garment region, and image boundaries. The SCSA-enhanced configuration showed relatively greater concentration around the headwear, facial region, shoulder area, and parts of the upper-body robe structure. These areas overlap with several observable visual cues used in the operational definition of robe-wearing figures.
For the female-role example, the baseline responses appeared in several separated regions around the head ornament, upper garment, hands, and image boundaries. The SCSA-enhanced configuration showed a broader and more continuous response distribution across the headwear, facial region, shoulder and sleeve structures, hands, and waist-to-skirt area. Several of these regions overlap with the costume and appearance cues used to define female-role figures in the present task.
Overall, the selected examples show qualitative differences in spatial response distribution between the baseline and SCSA-enhanced configurations. In these visualizations, the SCSA-enhanced model generally exhibited more distinct responses around selected figure structures, although peripheral and background activations were not completely eliminated. Because the analysis is based on representative samples and independently normalized heatmaps, the results should be interpreted as complementary qualitative evidence rather than as a quantitative or causal assessment of attention effectiveness.
4. Discussion
4.1. Interpretation of Detection Performance Differences
Among the configurations directly evaluated under the same dataset and experimental protocol, the YOLOv8n-SCSA configuration with Inner-IoU achieved the highest precision, recall, mAP@0.5, and mAP@0.5:0.95, although with a moderate reduction in forward-pass throughput. YOLOv10n performed better than the YOLOv8n baseline and served as a stronger recent lightweight reference, whereas Faster R-CNN showed lower detection performance and forward-pass throughput under the present configuration.
The ablation results showed different changes in the metrics for the two components. SCSA produced larger gains in precision and recall, whereas Inner-IoU produced gains in recall and mAP@0.5:0.95. These metric differences are consistent with the intended use of SCSA for feature refinement and Inner-IoU for bounding-box regression, but they do not independently establish the internal mechanism of either component. The scaling-ratio analysis further showed that the performance differences were moderate across –0.8, with providing the most favorable overall result among the tested values. Because produces an auxiliary box smaller than the original box, the observed trend is consistent with the intended emphasis on internal overlap regions. However, the experiment identifies a suitable value only within the tested range, dataset, and implementation settings; it does not establish as universally optimal for paper-cut or cultural-heritage images. The paired activation heatmaps provide complementary qualitative evidence that the SCSA-enhanced configuration is associated with more localized responses around selected costume, headwear, limb, and figure-structure regions in the visualized samples. However, the heatmaps do not constitute quantitative or causal evidence of attention effectiveness. Further controlled comparisons using finer-grained scaling ratios, alternative data partitions, and predefined boundary-complexity conditions would help clarify the broader sensitivity of the regression setting.
The combined configuration increased mAP@0.5 from 95.9% to 98.8% and mAP@0.5:0.95 from 86.7% to 89.6% relative to the YOLOv8n baseline. This increase was accompanied by a reduction in forward-pass throughput from 95.2 to 92.3 FPS and a slight increase in FLOPs from 8.9 to 9.1 G. The throughput difference is consistent with the additional computational operations introduced by SCSA. Because the present application focuses on offline or semi-automated annotation and retrieval rather than real-time inference, this accuracy–throughput trade-off may be practically acceptable, although deployment-specific evaluation remains necessary.
These findings should be interpreted as evidence of task-specific effectiveness under the present dataset and training configuration, rather than as evidence that SCSA or Inner-IoU universally outperforms alternative attention mechanisms or IoU-based regression strategies.
4.2. Task-Specific Visual Categories, Recognition Differences, and Error Sources
The three classes used in this study are task-specific operational visual categories for object detection and should not be interpreted as equivalents of the traditional Chinese opera-role system. The traditional role system describes performative identity, vocal type, dramatic function, and stage convention, whereas the present detection scheme is defined only by visually observable and consistently annotatable configurations in individual paper-cut images. Armor-clad figures are identified through martial visual attributes, including armor, weapons, back flags, shoulder guards, and combat-related postures. Robe-wearing figures are identified through civil-official or ceremonial attributes, including official hats or crowns, long robes, ceremonial garments, long beards, and ceremonial props. Female-role figures are identified through visually explicit costume and appearance cues, including skirt structures, draped scarves, phoenix crowns, hair ornaments, and associated postures. The two classification systems, therefore, serve different purposes; the traditional taxonomy supports cultural and performative interpretation, while the present visual categories support preliminary detection, retrieval, and image organization.
The normalized confusion matrix in
Figure 4 shows high diagonal values across the three operational categories, ranging from 93% to 97%. These normalized values describe category-assignment patterns within the confusion-matrix calculation and should not be interpreted as identical to the fixed-threshold class-wise recall values reported in
Table 10. Female-role figures showed the highest diagonal value in
Figure 4 but exhibited an earlier decline in the recall confidence curve as the confidence threshold increased. This pattern may be associated with visual overlap between female-role and robe-wearing figures, particularly when skirt structures, draped scarves, or headwear are incomplete or visually ambiguous. The lower diagonal value for armor-clad figures may reflect cases in which weapons, armor, back flags, or limb structures were occluded, fragmented, or visually merged with decorative patterns.
Table 10 complements these normalized observations by reporting fixed-threshold TP, FP, and FN counts over the complete test set.
To provide fixed-threshold statistics over the complete test set, class-wise true-positive, false-positive, and false-negative counts were calculated separately from the normalized confusion-matrix visualization. Predictions were matched to ground-truth instances at an IoU threshold of 0.50 using the confidence and NMS settings reported in
Section 2.3. As shown in
Table 10, the evaluated configuration produced 91 true positives, four false positives, and seven false negatives across 98 annotated test instances, corresponding to an overall precision of 95.8% and recall of 92.9%.
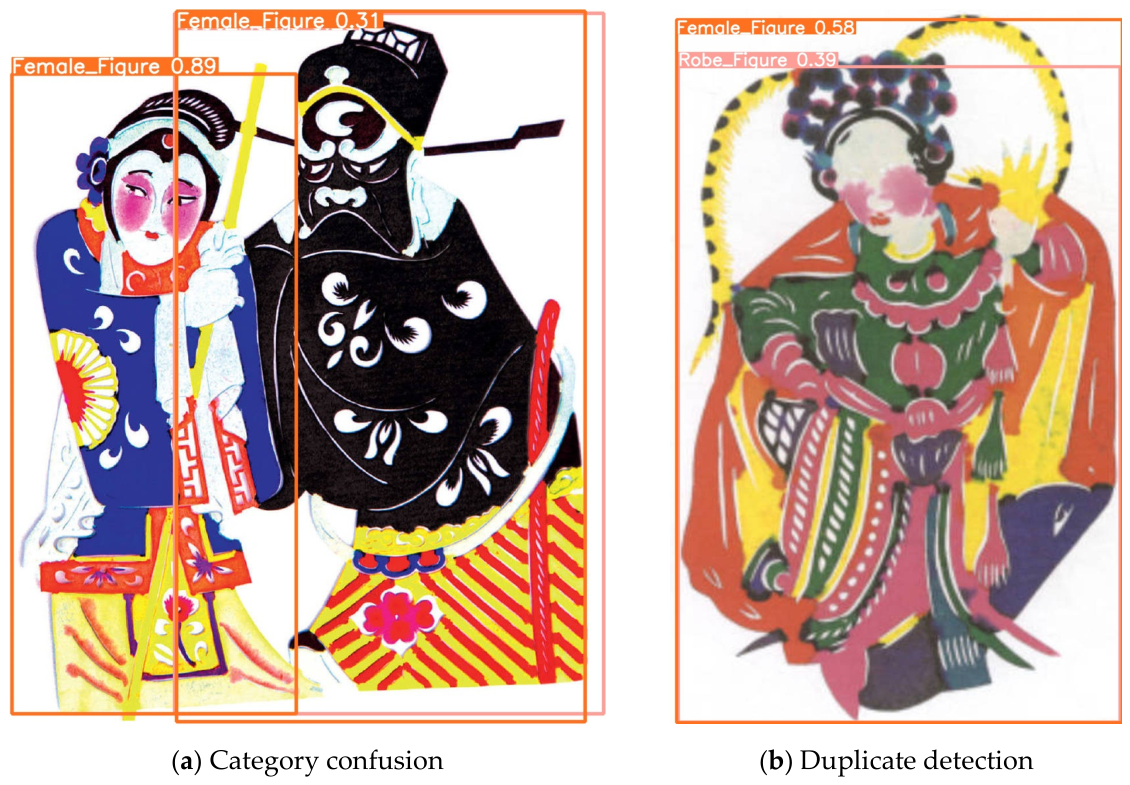
The category-level differences can be related to the visual characteristics of the three classes. Armor-clad figures were more difficult to detect when weapons, back flags, armor contours, or limb structures were occluded, fragmented, or visually merged with decorative elements. Confusion between robe-wearing and female-role figures occurred when skirt structures, draped scarves, hair ornaments, or other category-defining cues were incomplete or visually ambiguous. Low contrast, paper damage, background interference, and variation in costume structure or posture may further affect boundary localization and category prediction.
The TP, FP, and FN statistics quantify category-level detection outcomes but do not distinguish all underlying failure mechanisms. A finer-grained error-coding protocol separating category misclassification, duplicate detection, imprecise localization, boundary-related failure, and preservation-state-related degradation was not established. The representative cases shown in
Figure 11, therefore, complement the class-wise statistics by illustrating specific failure types.
These observations are based on naturally occurring visual difficulties and representative failure cases in the existing test set. They should not be interpreted as a dedicated robustness evaluation under controlled degradation conditions. Such an evaluation would require separately constructed test subsets and standardized degradation procedures.
4.3. Dataset Construction, Augmentation, and Generalization Boundaries
The dataset was compiled from catalogues, museum materials, folk collections, and publicly available online resources. While these sources provide valuable visual material representative of Yuxian paper-cut opera figures, they also introduce inherent variation in image quality, preservation condition, brightness, cropping, scale, and color reproduction. This variability reflects the practical reality of dispersed heritage image collections, but it also limits the extent to which the dataset can capture the full visual diversity of Yuxian paper-cut opera figures across different preservation states, acquisition conditions, and regional styles.
The augmentation strategy employed only photometric operations—darkening, brightening, and salt-and-pepper noise—while excluding geometric transformations. This choice was motivated by two considerations. First, the collected source images already contained naturally occurring variation in orientation, cropping, scale, composition, and acquisition conditions, reducing the need for additional synthetic geometric transformations. Second, aggressive geometric alterations—particularly random cropping and large rotations—could remove or distort category-relevant cues, including weapons, back flags, costume structures, skirts, and draped scarves. In addition, large synthetic transformations may generate image configurations that are insufficiently representative of the archival, catalogue, and collection materials used in this study. However, this restricted strategy also implies that the model was not explicitly trained to be invariant to geometric variations beyond those already present in the source data. The detector’s robustness to more extreme changes in figure orientation, scale, viewpoint, or compositional layout—which may occur when the model is applied to differently acquired or composed images—remains unexamined. In addition, the independent contribution of each augmentation operation was not separately evaluated, and the current results do not indicate whether the observed improvement was dominated by one specific operation or distributed across all three.
The augmentation procedure was applied exclusively to the training set after the data split, and the validation and test sets contained only original images. This protocol ensured that no augmented variants of the same source image appeared across subsets, supporting unbiased evaluation. However, external validation on independently collected museum or field-acquired images was not conducted. Consequently, the reported performance should be interpreted as task-specific evidence under the current dataset composition and split, rather than as a generalizable benchmark for all Yuxian paper-cut images or other paper-cutting traditions. Broader validation across additional image sources, preservation conditions, and acquisition settings is required before extending the findings to wider heritage image collections.
4.4. Implications for Digital Preservation and Resource Organization
This study adapts object detection to the visual organization of Yuxian paper-cut opera figure images. The evaluated configuration is not intended to replace specialist interpretation. Instead, it provides a technical basis for locating figure regions and assigning preliminary visual-category labels in large or dispersed image collections.
In practical heritage image documentation workflows, the model supported three related tasks. First, it can assist with localization and preliminary annotation of opera figure subjects in digitized collections. Second, the predicted visual categories can provide preliminary searchable labels, enabling users to retrieve images by armor-clad, robe-wearing, or female-role categories. Third, the detection outputs can serve as an initial layer for further expert-led annotation involving costume features, props, opera titles, character identities, and other semantic information.
To further examine the potential value of the evaluated configuration in human-in-the-loop annotation workflows, two annotators with backgrounds in design studies and visual culture conducted a preliminary annotation efficiency evaluation on a subset of 100 images covering the three visual categories. Two annotation procedures were compared: conventional manual annotation from scratch and AI-assisted annotation based on model-generated preliminary predictions, followed by manual verification and correction by the annotators. The average annotation time was reduced from 18.6 s/image with manual annotation to 6.4 s/image with AI assistance, corresponding to a reduction of 65.6%. This preliminary comparison suggests that the evaluated configuration may reduce repetitive localization and category-labeling efforts while maintaining expert supervision during heritage image documentation.
This potential application should be understood as semi-automated assistance rather than fully automatic archival decision making. Human review remains necessary for ambiguous cases, damaged images, culturally sensitive materials, and records requiring historical or folkloric interpretation. The model is, therefore, best positioned as part of a broader workflow that combines computational detection, expert verification, source documentation, and metadata organization.
4.5. Limitations and Future Work
The present experiments do not constitute an exhaustive optimization study of SCSA placement, alternative attention modules, or alternative IoU-based losses. Although five Inner-IoU scaling ratios from 0.4 to 0.8 were evaluated, the analysis was limited to a discrete parameter range under one dataset split and experimental configuration. Finer-grained parameter searches under repeated experimental settings are still required to assess the sensitivity of the selected ratio.
The class-wise TP, FP, and FN analysis provides a quantitative overview of category-level detection outcomes on the original test set. However, it does not constitute a complete taxonomy of category misclassification, duplicate detection, imprecise localization, boundary-related failure, or preservation-state-related degradation. Controlled robustness evaluation under simulated blurring, contour tearing, and element-overlap conditions was not included. The activation-map analysis was also limited to representative samples and did not provide a dataset-wide quantitative evaluation of attention localization.
Several limitations should be acknowledged. First, the dataset contains 926 original images across three visual categories. Its scale reflects the dispersed preservation, uneven documentation, material deterioration, and access restrictions of Yuxian paper-cut resources. Although the dataset provides a traceable resource for preliminary documentation and image organization, its size and category scope remain limited. The high mAP@0.5 may partly reflect the restricted number of categories and curated samples. Broader validation is therefore needed before extending the findings to other paper-cutting traditions or heritage image collections.
Second, as noted in
Section 4.3, the evaluation was conducted using a single dataset split without external validation or cross-validation. Although repeated training with different random seeds was used to assess stability under this fixed split, the results do not characterize variability across alternative data partitions or independent collections. Future work should therefore incorporate cross-validation and external test sets obtained under varied acquisition conditions.
Third, the comparison focused on the selected SCSA and Inner-IoU configuration relative to the YOLOv8n baseline under a fixed dataset and training protocol, with YOLOv10n included as a recent lightweight reference. Broader controlled comparisons using alternative components, larger datasets, and repeated validation are required to assess the general applicability of the configuration.
Fourth, the reported FPS was measured under a single experimental hardware configuration. Although the evaluated model achieved a forward-pass throughput of 92.3 FPS on the RTX 4060 Ti platform, additional evaluation under different deployment environments would provide a more comprehensive assessment of computational efficiency and practical applicability.
Finally, the current model addresses only visual-category detection. Future work may develop a multi-level annotation framework linking visual categories with costume elements, props, opera sources, character identities, and textual documentation. Multimodal methods could integrate visual features with historical and contextual records, but systematically annotated multimodal data remain limited in this domain. Such extensions should retain expert review for cultural and historical interpretation.
5. Conclusions
This study developed a task-specific visual detection workflow for Yuxian paper-cut opera figures using a YOLOv8n-based configuration with the existing SCSA module and Inner-IoU strategy. A dataset of 926 original images was constructed and annotated into three operational visual categories: armor-clad, robe-wearing, and female-role figures. The study contributes an application-oriented task formulation, annotation scheme, and expert-assisted workflow for organizing this domain-specific heritage image resource.
On the test set, the evaluated configuration achieved 95.8% precision, 92.9% recall, 98.8% mAP@0.5, and 89.6% mAP@0.5:0.95, exceeding the YOLOv8n baseline under the same evaluation protocol. Sensitivity analysis identified as the most favorable Inner-IoU scaling ratio among the tested values. Five repeated runs yielded mean precision, recall, mAP@0.5, and mAP@0.5:0.95 values of 95.6%, 92.8%, 98.7%, and 89.5%, with standard deviations of 0.2–0.4 percentage points.
The workflow can support preliminary annotation, category-based retrieval, and metadata organization of dispersed Yuxian paper-cut images. It is intended to assist, rather than replace, expert interpretation of ambiguous figures, character identities, historical contexts, and cultural meanings.
The main limitations are the small domain-specific dataset, the three-category scope, the 93-image test set, and the absence of external validation. Future work should expand the dataset across additional collections, evaluate robustness under controlled image degradation, and compare alternative attention modules, regression losses, and embedding strategies. A multi-level annotation framework could also link visual categories with costume elements, character identities, opera sources, and textual records.