Article

Multiscale Molecular Dynamics and Quantum–Electrostatic Modelling of Graphene Electric Double-Layer Transistors for β2-Microglobulin Biosensing

by
Ghassem Baridi
1,*,
Arslan Liaquat
2,
Leonardo Martini
2,
Federico Rapuzzi
2,
Herath Mudiyanselage Kasun Gayanga Anuradha Herath
2,
El Hadj Abidi
3,
Maria Celeste Maschio
2,4,
Vito Clericò
5,
Yahya Moubarak Meziani
3,
Mario Amado
5,
Enrique Diez
5,
Stefano Corni
4,
Giorgia Brancolini
4,
Luigi Rovati
1 and
Francesco Rossella
2
1
Department of Engineering “Enzo Ferrari”, University of Modena and Reggio Emilia, Via P. Vivarelli, 10, 41125 Modena, Italy
2
Department of Physics, Computer Science and Mathematics, University of Modena e Reggio Emilia, Via Campi 213/a, 41125 Modena, Italy
3
Department of Applied Physics, University of Salamanca, 37008 Salamanca, Spain
4
Istituto Nanoscienze—CNR, S3, Via G. Campi 213/A, 41125 Modena, Italy
5
Nanotechnology Group, USAL–Nanolab, University of Salamanca, 37008 Salamanca, Spain
*
Author to whom correspondence should be addressed.
Electronics 2026, 15(13), 2837; https://doi.org/10.3390/electronics15132837
Submission received: 17 May 2026 / Revised: 14 June 2026 / Accepted: 24 June 2026 / Published: 29 June 2026
(This article belongs to the Special Issue Smart Bioelectronics, Wearable Systems and E-Health)

Abstract

Biosensors are rapidly emerging as a pivotal technology with far-reaching implications in fields such as medical diagnostics, environmental analysis and pharmaceutical research. Among the various biosensing platforms, Graphene Field-Effect Transistor (GFET) biosensors have attracted considerable interest due to their exceptional sensitivity, potential for cost-efficient fabrication, and compatibility with scalable manufacturing processes. This work computationally addresses sensing mechanisms and design strategies associated with GFET-based biosensors, with a focus on the influence of electrolyte gating on device performance, tackling the role of graphene’s quantum capacitance and testing the electrical detection of β2-microglobulin as a case study. Molecular dynamics is used to rationalize the details of the physisorption of a single biomolecule onto the graphene surface, while finite element method simulations are employed to evaluate device sensitivity and figure of merit. Results reveal that incorporating quantum capacitance into the model leads to a Sensitivity-over-FWHM_min figure of merit exceeding 100 L/g being achievable for a β2-microglobulin concentration of 0.001 g/L. These computational outcomes highlight the relevance of quantum-electrostatic effects in GFET biosensor performance and suggest potential routes towards the optimization of graphene-based electronic biodetector engineering.

1. Introduction

Recently, advances in medical diagnostics and therapeutic strategies have considerably extended the average human lifespan. However, the prevalence of age-associated disorders, particularly those linked to protein misfolding and aggregation, continues to rise [1]. Diseases such as Alzheimer’s disease, Parkinson’s disease, Creutzfeldt–Jakob disease, type II diabetes, and dialysis-related amyloidosis (DRA) are characterized by the formation of amyloid fibrils, resulting from misfolded protein conformations, in which proteins adopt incorrect conformations or lose the stable structures required to function correctly. Despite extensive research, early detection of these protein aggregation processes remains limited, especially at the molecular and interfacial levels [2]. Among amyloidogenic proteins, β 2 -microglobulin (β2-m) has attracted considerable attention due to its direct involvement in DRA, a severe complication in patients undergoing long-term hemodialysis [3]. The protein comprises 99 amino acids and has a molecular mass of approximately 11.4 kDa. The secondary structure of β2-m is made up of seven β-strands arranged into two β-sheets, which are connected by a single disulfide bond. This forms a typical β-sandwich structure, characteristic of immunoglobulin (Ig) domains, and it is normally associated with the heavy chain of major histocompatibility complex class I (MHC-I), which exists on the surface of all nucleated cells. The binding of β2-m to MHC-I is crucial for efficient immune function [4].
Under normal physiological conditions, β2-m is efficiently cleared by the kidneys. However, impaired renal function leads to its accumulation in serum, promoting fibril formation and deposition in osteoarticular tissues [5]. Specifically, patients with reduced renal function, particularly those on long-term hemodialysis, may exhibit a 60-fold increase in serum β2-m levels [6]. Abnormal levels of β2-m in blood or urine are associated with a wide range of conditions, including inflammatory disorders, liver and kidney dysfunction, viral infections, and various malignancies [7]. Persistently elevated serum β2-m is also linked to hemodialysis-related amyloidosis [8], while cerebrospinal fluid levels may reflect central nervous system involvement in specific cases [9]. Serum and plasma β2-m are indicators of immune system activation and are used as tumor markers in certain hematologic cancers [10], as well as activity markers in inflammatory diseases such as inflammatory bowel disease [11]. Increased β2-m levels are also observed during viral infections, including cytomegalovirus and HIV [12]. Therefore, β2-m measurement provides valuable information for early disease detection, monitoring, and prognosis.
Carbon-based materials have been shown to influence protein adsorption depending on their physicochemical properties [13,14,15,16,17,18]. Graphene, a two-dimensional sheet of sp2-hybridized carbon atoms, offers a unique platform in the context of protein detection due to its exceptional electronic properties, large surface area, and sensitivity to local electrostatic perturbations. These characteristics make graphene especially suitable for probing protein–surface interactions and for developing label-free biosensing technologies [19,20,21,22,23,24,25]. When a protein approaches a surface, it commonly assumes a specific orientation, which determines which parts of the molecule interact with the surface and which remain exposed to the surrounding solution [26]. This orientation is affected by the biomolecule’s size and structural complexity. In environments with extreme molecular density, adsorption becomes more competitive, with both interactions between the protein and the surface and between neighbouring proteins shaping the final configuration. In this context, graphene field-effect transistors (GFETs) have emerged as powerful tools for detecting biomolecules through electrostatic transduction mechanisms [27]. In such devices, the adsorption of charged biomolecules onto the graphene surface induces changes in carrier density within the channel, leading to measurable variations in conductivity or threshold voltage. For β2-m, which carries a net negative charge under physiological conditions, these electrostatic effects are further influenced by its size, heterogeneous charge distribution, and adsorption-induced conformational changes, resulting in specific orientations on graphitic surfaces governed by a combination of hydrophobic and electrostatic interactions. Despite experimental progress, a comprehensive understanding of how β2-m couples with its electrostatic signature at graphene interfaces remains incomplete. In particular, the interplay between protein adsorption, conformational dynamics, and the resulting modulation of the electrical response in GFET devices requires systematic investigation.
In this study, a combined multiscale atomistic modelling and quantum-electrostatic modelling framework is presented using SDA version 7.2.2 software [28], GROMACS [29] and COMSOL version 6.2 Multiphysics (REF) to model the detection of β2-m via a GFET. The focus is on the wild-type conformation of the β2-m monomer in interaction with the graphene surface, and the primary objective is to investigate how the initial stages of adsorption-induced structural and charge redistribution effects influence the device response. By linking protein-level physico-chemical behavior to measurable electronic signals, this work aims to provide deeper insight into the design of sensitive GFET biosensors for β2M detection and to contribute to the broader understanding of the quantum-electrostatic effects for refining GFET biosensor performance, offering valuable insights for the advancement of high-precision biosensing technologies.

2. Methodology

2.1. Molecular Dynamics Simulations

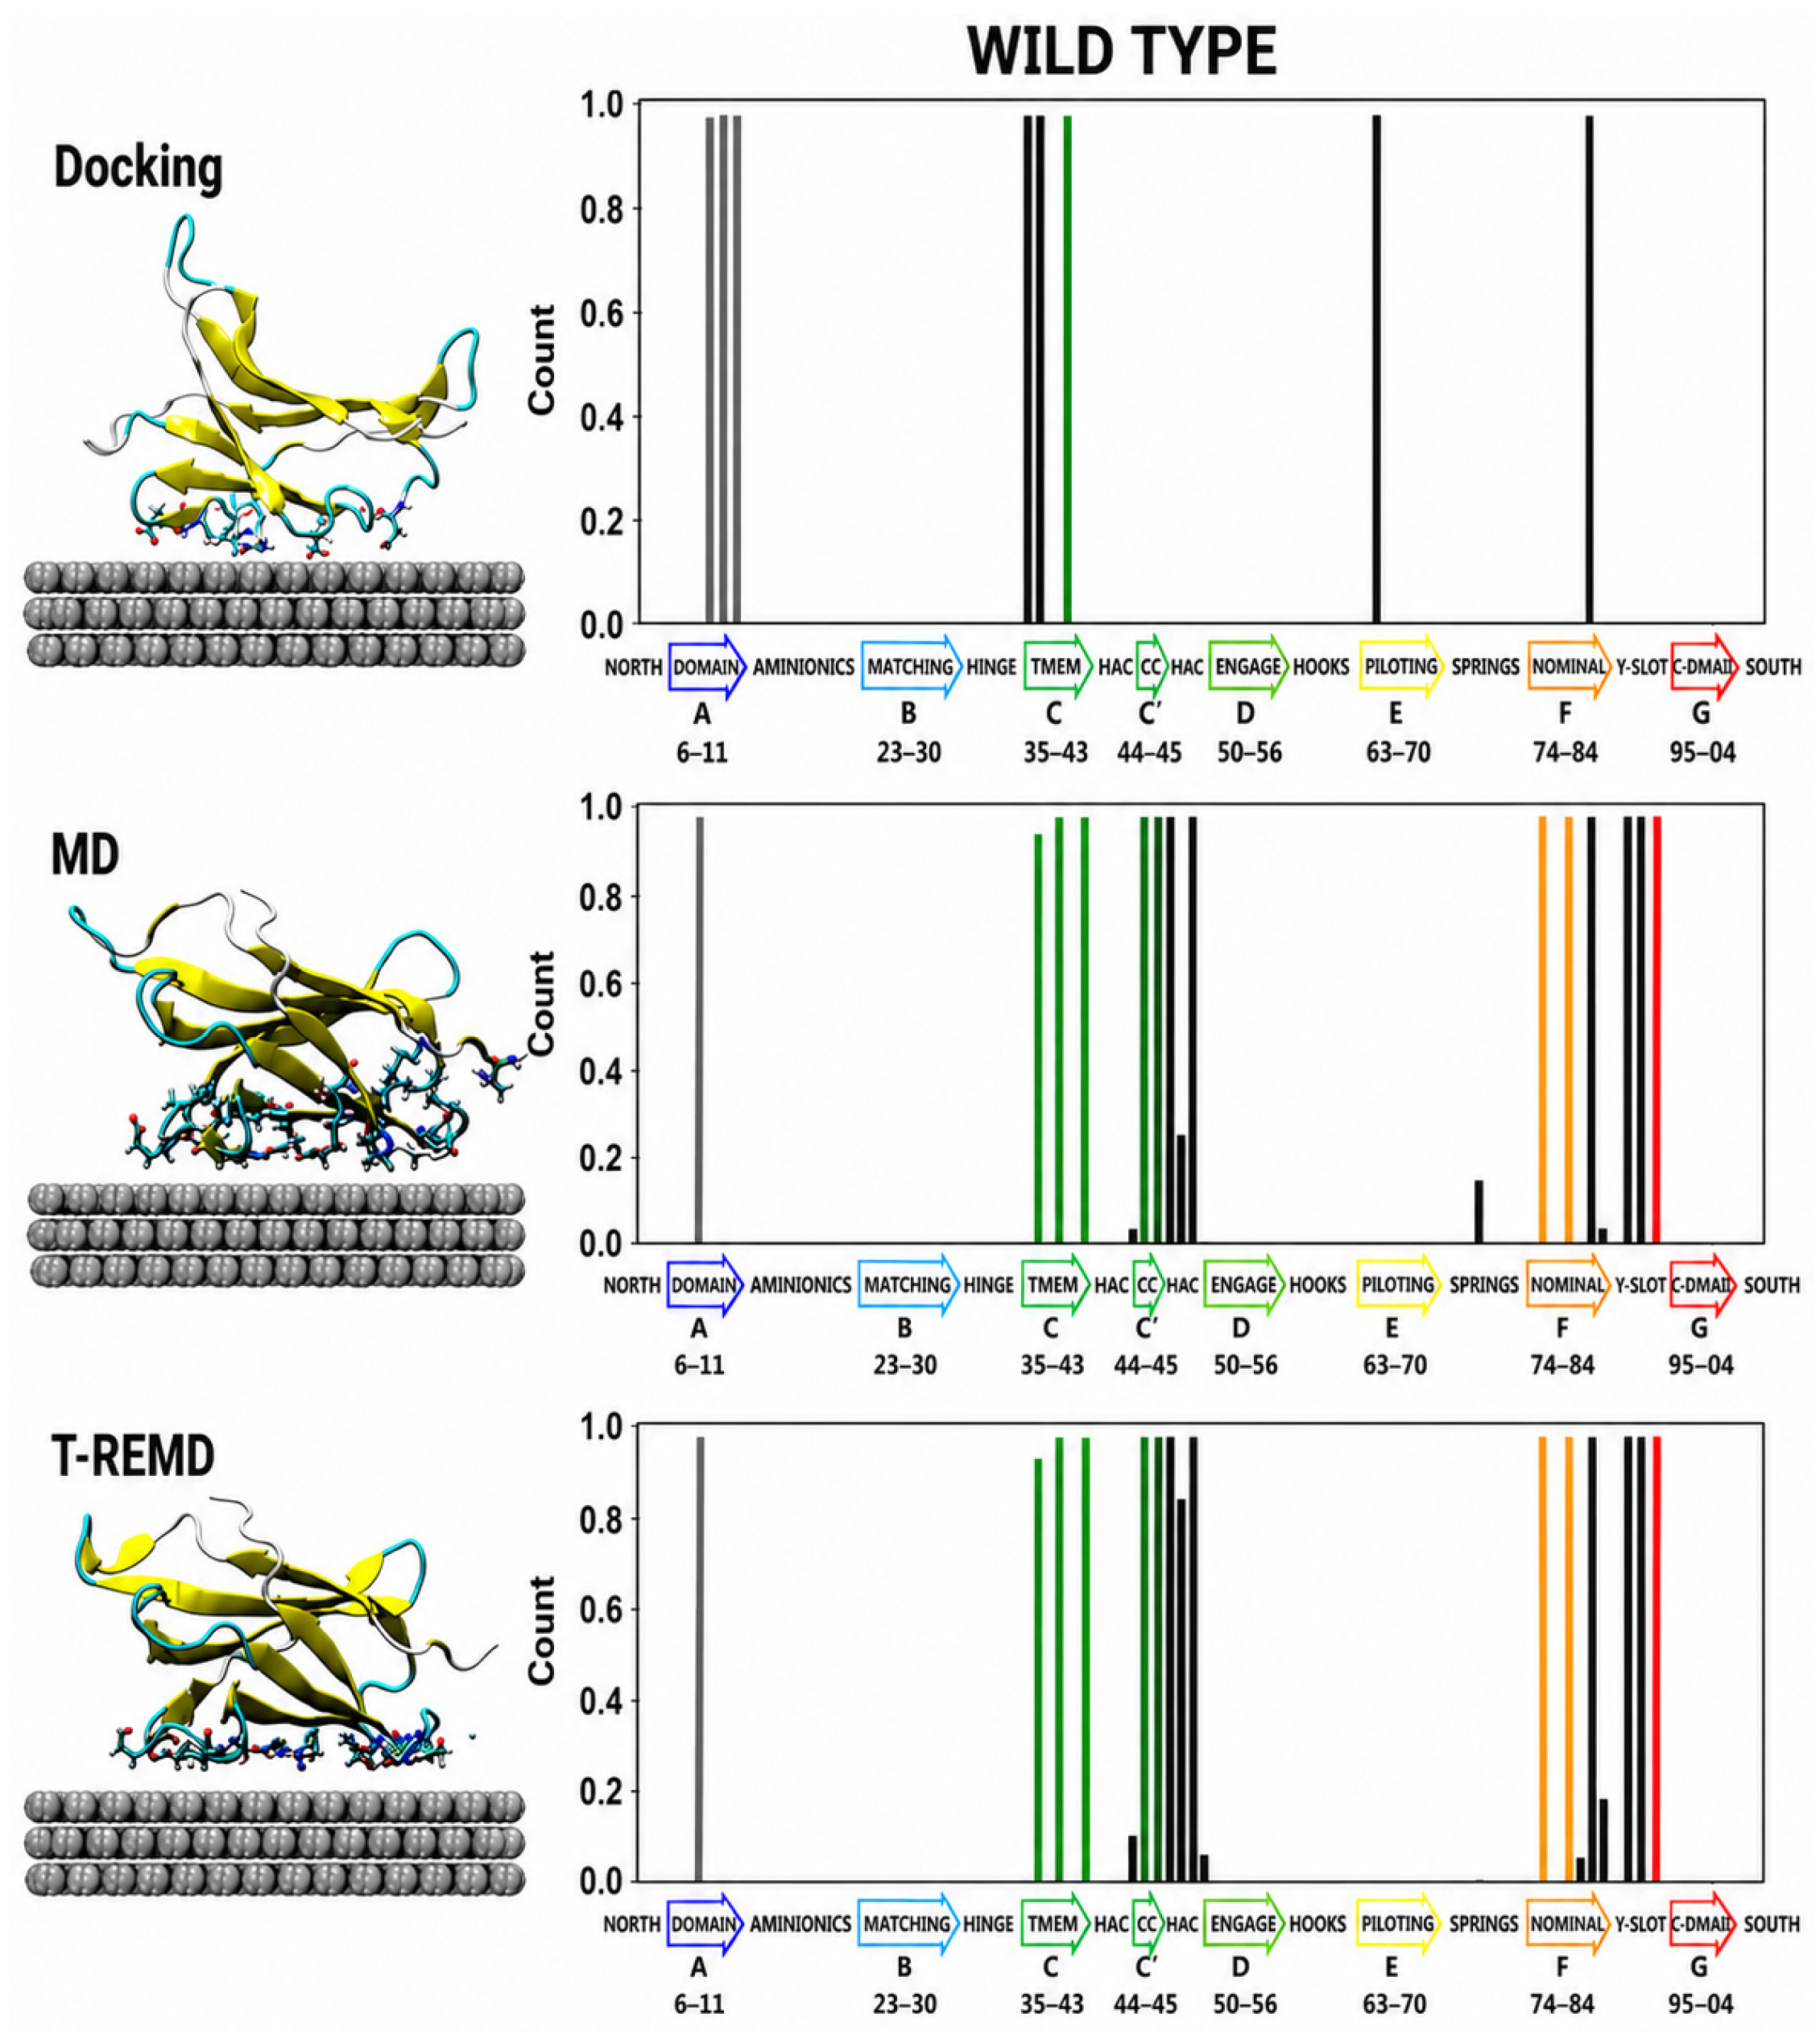
β2-m was modeled starting from the NMR structure (PDB: 1JNJ), and the graphene surface was composed of three layers of graphene with a surface area of about 71.22 Å × 72.32 Å, periodically replicated in space to obtain an infinite slab. The layers are placed at a distance such that the total height of 6.70 Å can screen the interactions with the water and the protein replicas that, during simulation, can be seen along the z axis due to the periodic boundary conditions (PBC). The force field parameters for the graphite surface are set to σ = 3.55 Å and ε = 0.07 kcal/mol according to the OPLS force field [30,31]. The interaction of the protein with the multilayer graphene surface was investigated using a combined docking with an SDA approach [30] and a molecular dynamics (MD) approach with GROMACS [30]. Initial adsorption configurations were obtained via Brownian dynamics docking, followed by clustering and selection of representative poses (Figure 1, top panel; see also Figure S1). These configurations were refined through classical MD simulations (500 ns) in explicit water using the OPLS-AA force field and periodic boundary conditions (Figure 1, middle panel). To enhance conformational sampling and overcome energy barriers, replica exchange MD (REMD) simulations were subsequently performed (52 replicas, 310–430 K), yielding an aggregate simulation time of ~3.1 μs (Figure 1, bottom panel). Molecular dynamics simulations exhibit a radius of β2-m of approximately 14.23 Å in water and 14.13 Å on a graphene surface. Experimentally, the folded monomer of β2-m has a radius in the range of 12–15 Å, depending on its conformation and the measurement method. The protein carries a net charge of −2, which perturbs the Helmholtz potential near the graphene surface. This supports its detectability using graphene field-effect transistor (GFET)-based sensing platforms [32]. In the continuum electrostatic model, the protein is treated as a charged macroion characterized by its overall charge state. This approximation is consistent with the electric double-layer (EDL) formalism, in which the electrostatic response is evaluated at length scales larger than individual atomic charges. Thus, the heterogeneous distribution of charged residues on the protein surface and local electrostatic effects are not explicitly considered here. Their incorporation is beyond the scope of the present study and will be included in a future manuscript.

2.2. Continuum Simulations

Initially, protein migration in the electrolyte leads to Electric Double-Layer (EDL) formation at the interface. This induces a compensating charge on graphene, altering the local electric field, potential, and charge density. Electrostatics in the Stern layer are described by the Poisson equation, coupled with the Nernst–Planck model for ion transport [33]:
( ) c i t = ( D i c i + z i F D i c i φ R T )
where Dᵢ, zᵢ, and cᵢ denote diffusivity, valence, and concentration [33,34].
The EDL governs interfacial charge transfer in graphene electrolyte-gated field-effect transistors (EGFETs) [35,36]. The model that best describes the EDL is the one proposed by Stern, known as the Stern model.
1 C E D L = 1 C H + 1 C G c
where C H and C G c correspond to compact and diffuse layers [37].
The carrier concentration is approximated as [38]:
n n 0 2 + ( c b a c k ( V b a c k g a t e V d i r a c   p o i n t 0 ) e ) 2
The drain current is:
I d = W L e μ V D S n
Here, W and L represent the width and length of the graphene channel, respectively; e denotes the elementary charge; and μ is the carrier mobility. The source–drain voltage V S D   is set to 1 mV in the calculations.
When both top and back gates are applied, the charge density of the graphene channel is as follows [38]:
n n 0 2 + ( c b a c k V b a c k g a t e V d i r a c   p o i n t 0 e ) 2 + ( c t o p V t o p g a t e V d i r a c   p o i n t   t o p 0 e ) 2
In addition to the sensing element, the practical implementation of biomedical biosensors requires reliable embedded electronics and signal acquisition systems. Recent work [39] proposed an AI-assisted framework for in situ monitoring of biomedical electronic circuits, emphasizing challenges related to miniaturization, low-power operation, and long-term device reliability. These considerations are important for the development of robust biosensor platforms.
Beyond sensing performance, the practical implementation of biosensors requires effective integration with miniaturized electronics for signal acquisition and low-power operation. Recent advances in biomedical nanoelectronics have demonstrated the potential of transistor-based and lab-on-chip platforms for compact diagnostic systems. Moreover, maintaining device integrity through appropriate operating conditions and in situ monitoring is essential for ensuring reliable and long-term performance, highlighting the need for a multidisciplinary approach to biosensor design [40].
In this formulation, C t o p equals C E D L in the Stern model. Graphene exhibits quantum capacitance ( C Q ) due to its low density of states near the Fermi level [41]. When interfaced with an electrolyte:
1 C t o t a l = 1 C Q + 1 C E D L
Unlike metals, C Q in graphene is comparable to C_EDL and must be included. Using a two-dimensional electron gas model [42]:
C Q = 2 e 2 ħ v f π n
where ħ is the Planck constant, e is the electron charge, v f is the Fermi velocity of the Dirac electron and n is the carrier concentration.
We determine the effective protein diameter from atomistic simulations and adopt a simplified model in which the protein is assigned a net charge of −2. This charge is based on the total protonation state at neutral pH, calculated using the H++ 1.0 software, and is used as an input parameter in the continuum model in COMSOL simulations. It should be noted that the electrostatic model adopted here is based on the classical Stern framework coupled with the Poisson–Boltzmann formalism, which neglects several effects that may become relevant at highly confined graphene–electrolyte interfaces, including non-linear ion–surface interactions, finite ion-size effects, ionic crowding, and ion–ion correlations. However, the present model is intended to provide a first-order description of the electrostatic perturbation induced by protein adsorption under moderate operating conditions. Future work will investigate more advanced electrostatic treatments, including modified Poisson–Boltzmann approaches and explicit-ion multiscale simulations, to capture these effects more accurately.
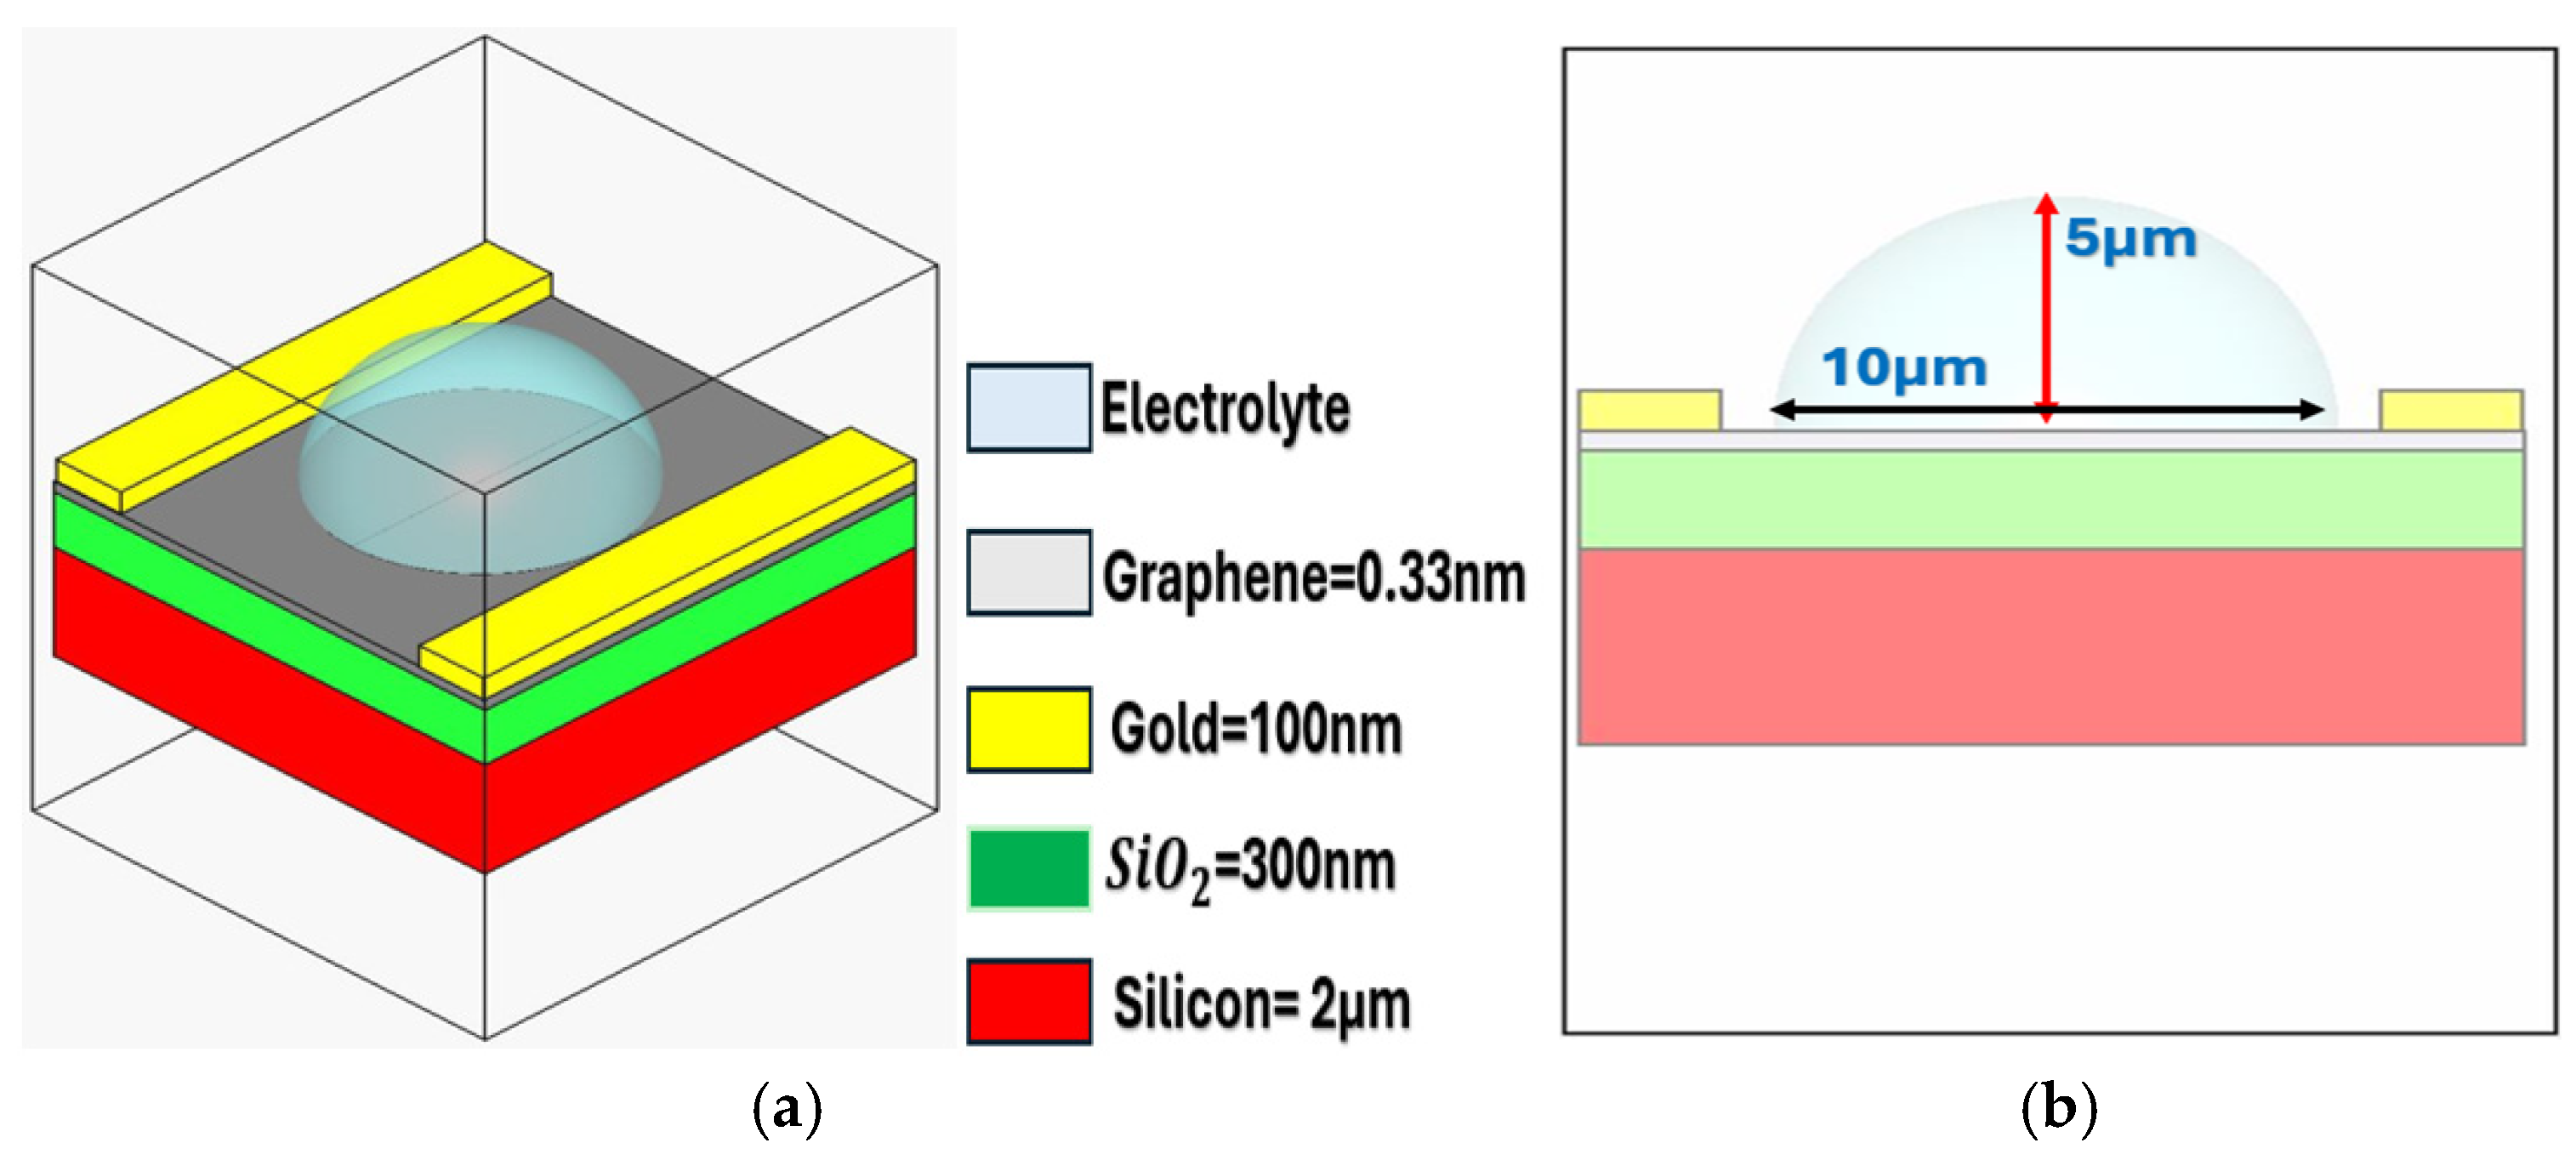
Figure 2 shows both 3D and 2D schematics of the GFET setup.
The present model assumes an idealized graphene channel and does not explicitly account for fabrication-induced variability. In practical GFET devices, factors such as graphene defects, transfer-related contaminations, contact resistance, channel geometry variations, and surface functionalization non-uniformity can influence carrier transport and Dirac point position. As a result, experimentally fabricated devices may exhibit device-to-device variations in sensitivity and electrical response. Although these effects are beyond the scope of the current study, they should be considered in future modelling and experimental validation efforts. Table 1 presents a summary of the experimental research conducted on electrolyte-gated GFETs for applications involving different physiological tissues [43,44,45].

3. Results and Discussion

3.1. Molecular Dynamics Results

The binding of WT β2-m to graphene was investigated using a multiscale modeling approach that combines rigid-body docking with enhanced molecular dynamics simulations. Brownian dynamics (BD) simulations were first used to generate protein–surface encounter complexes (Figure 1, top panel). Adsorption free energies were then calculated, and the resulting trajectories were clustered to identify distinct binding orientations (see Figure S1 in Supporting Information).
The most stable docking complexes (Figure 1, top panel) were subsequently selected for further refinement. Their stability was first assessed using MD simulations (Figure 1, middle panel) followed by REMD simulations (Figure 1, bottom panel) on graphene, according to a well-established protocol [32].
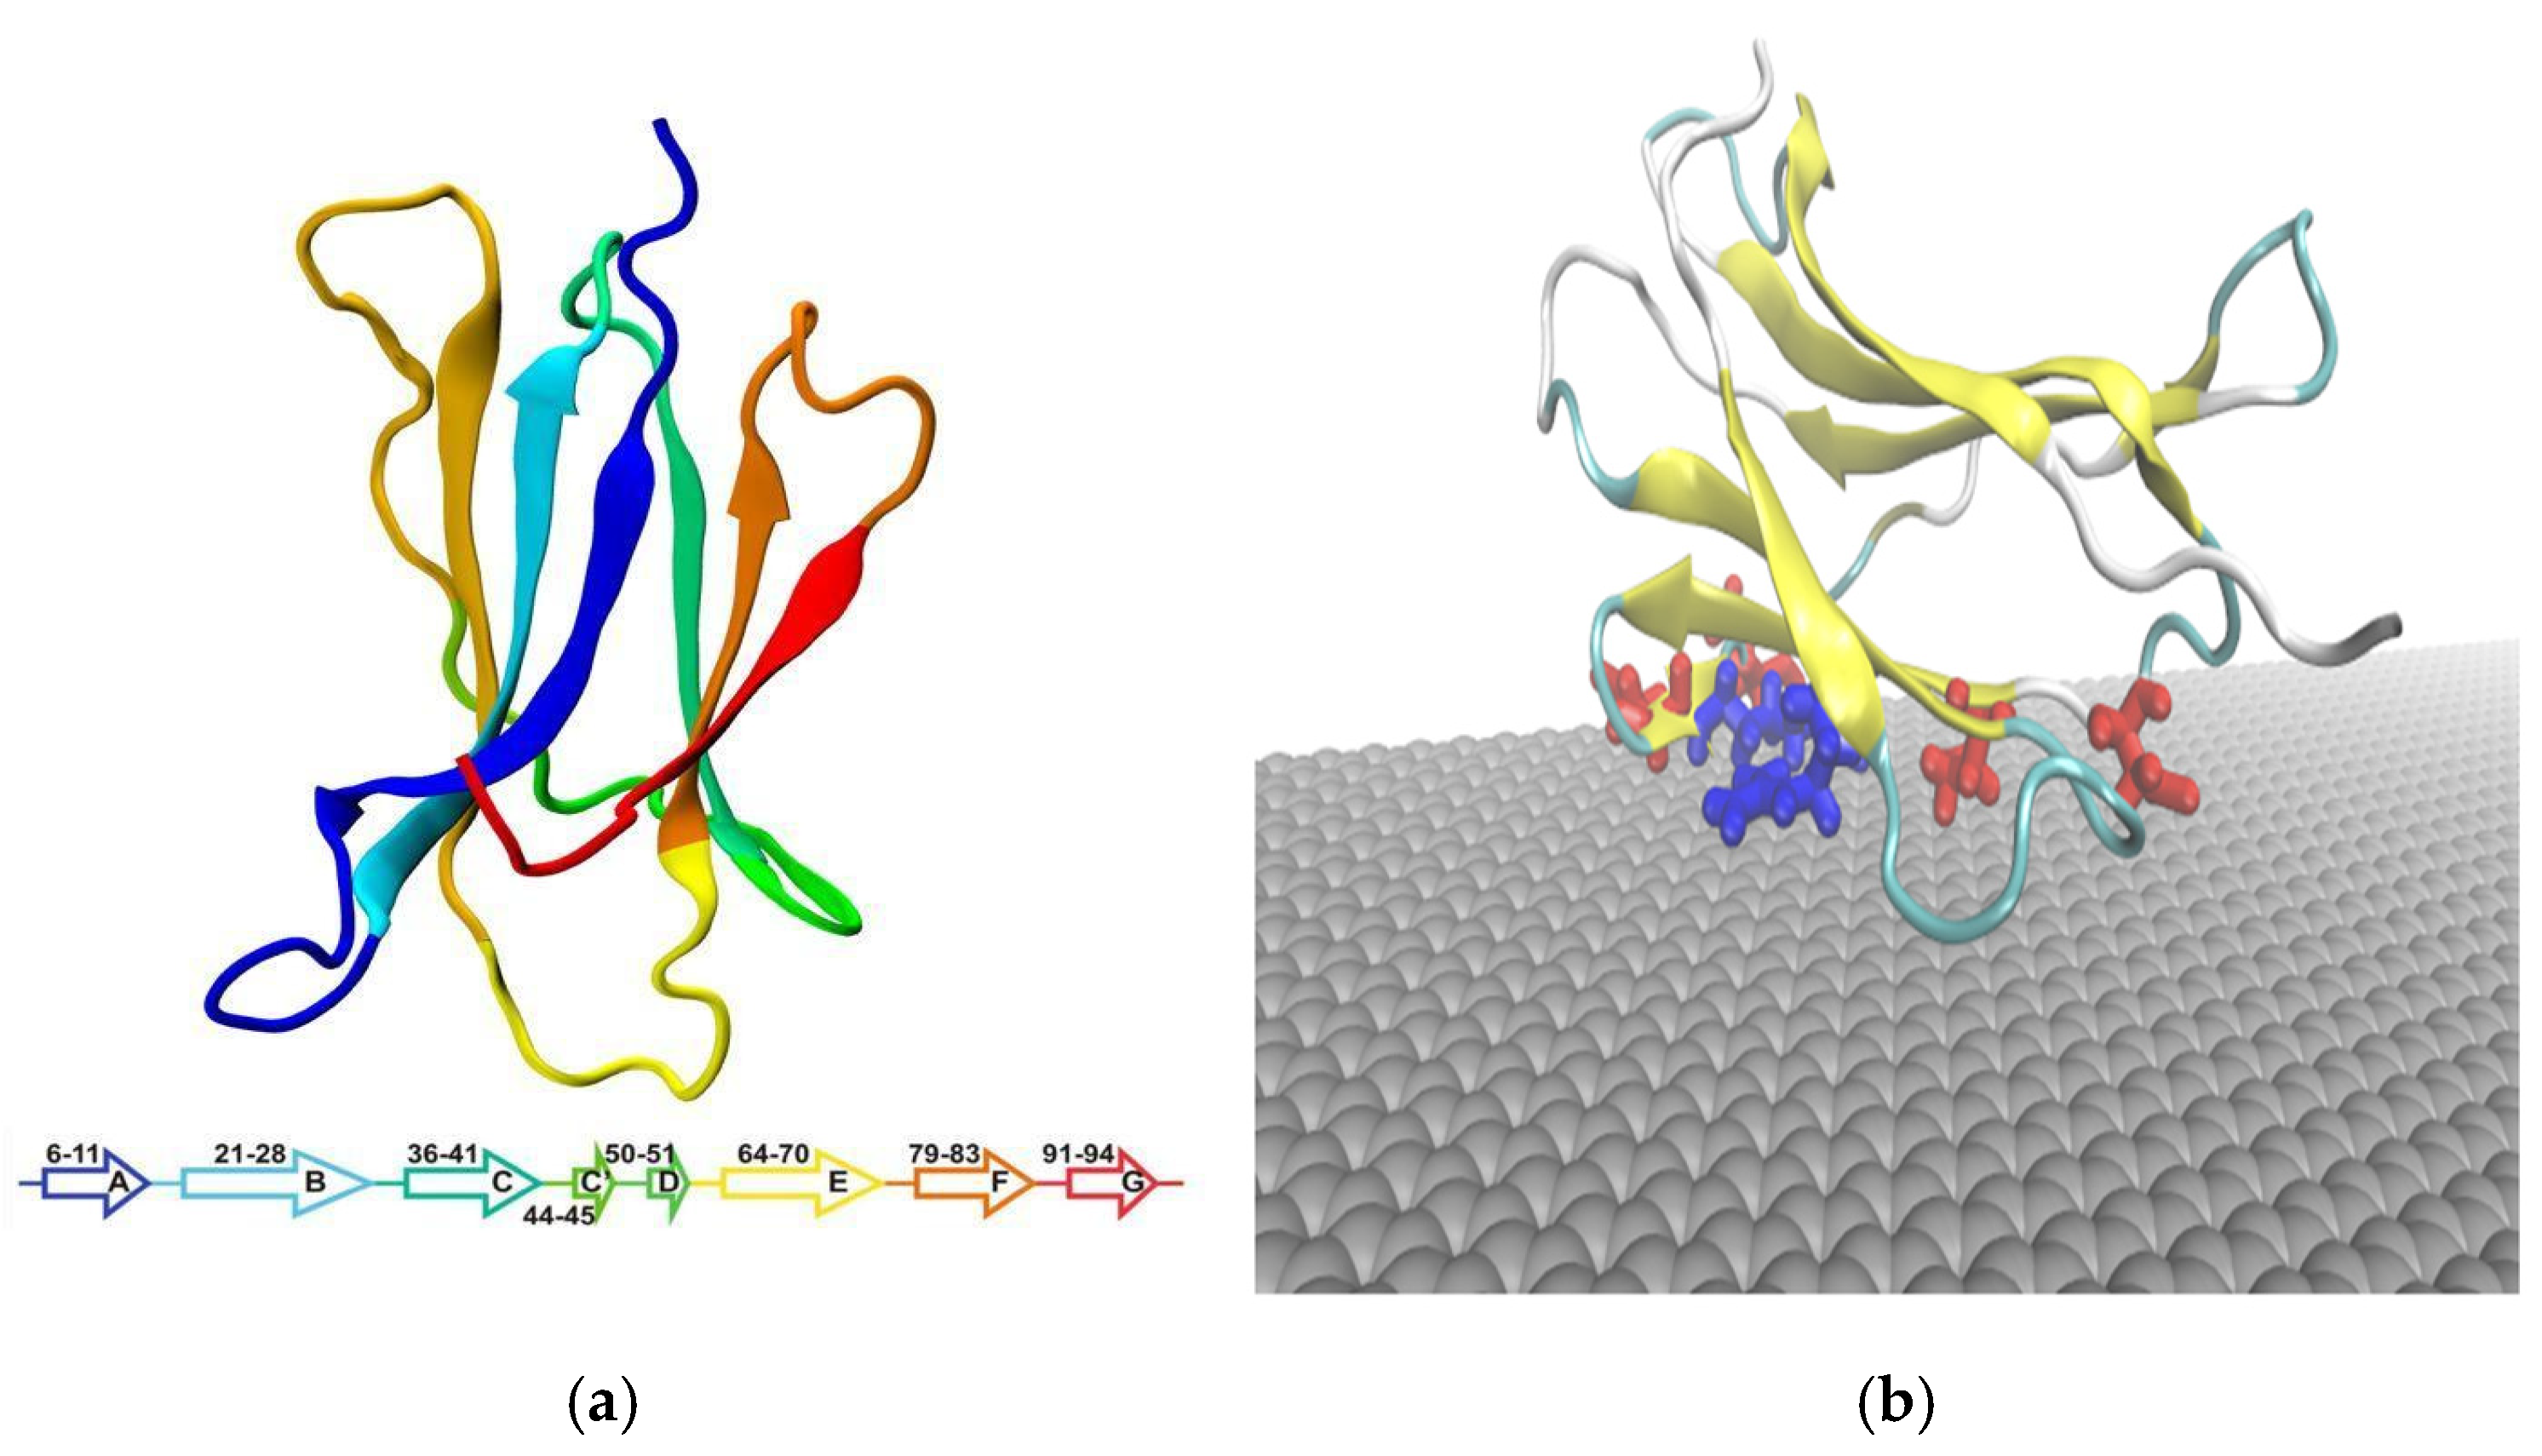
The final results indicate that β2-m adopts a horizontal orientation upon adsorption onto the graphene surface, involving specific elements of its secondary structure, which is represented in Figure 3a. The primary interaction interface consists of a patch that includes the C strand (Ile35, Glu36, Val37, Leu39), the C′ strand (Glu44, Arg45, Glu47), the CD loop (Ile46, Lys48) and the F strand (Arg81).
The final orientation of the protein relative to the surface is characterized by a number of charged residues in direct contact with the surface at very short distances, namely less than 3.5 Å, including Glu44, which is negatively charged, and Arg45 and Lys48, which are positively charged (Figure 3b).
The radius of gyration (Rg) was also analyzed from the atomistic simulations to monitor changes in protein size and shape upon adsorption. Rg and its individual components along the x, y, and z axes were evaluated at intervals of ~10 ps throughout the trajectories. The total Rg remained essentially constant at ~14 Å over time, indicating preservation of overall compactness. These results are reported in Figure S2 of the Supporting Information.
The combination of electrostatic and hydrophobic interactions facilitates stable and specific adsorption of β2-m onto the graphene surface. Upon adsorption, the protein induces a localized change in the graphene’s surface potential, producing a measurable and distinctive electrical signal. These alterations in the electrostatic environment can be detected as changes in the graphene field-effect transistor (GFET)’s conductivity or threshold voltage, highlighting β2M as a promising target for sensitive, label-free detection.
The present simulations consider a single-biomolecule adsorption scenario and therefore do not account for competitive adsorption or surface fouling effects that are encountered in complex biological media. Consequently, the present framework provides a mechanistic proof-of-concept aimed at elucidating the fundamental sensing mechanisms, while future developments will incorporate multi-protein adsorption and crowding effects to improve its applicability to realistic biosensing environments.

3.2. Continuum Simulation Results

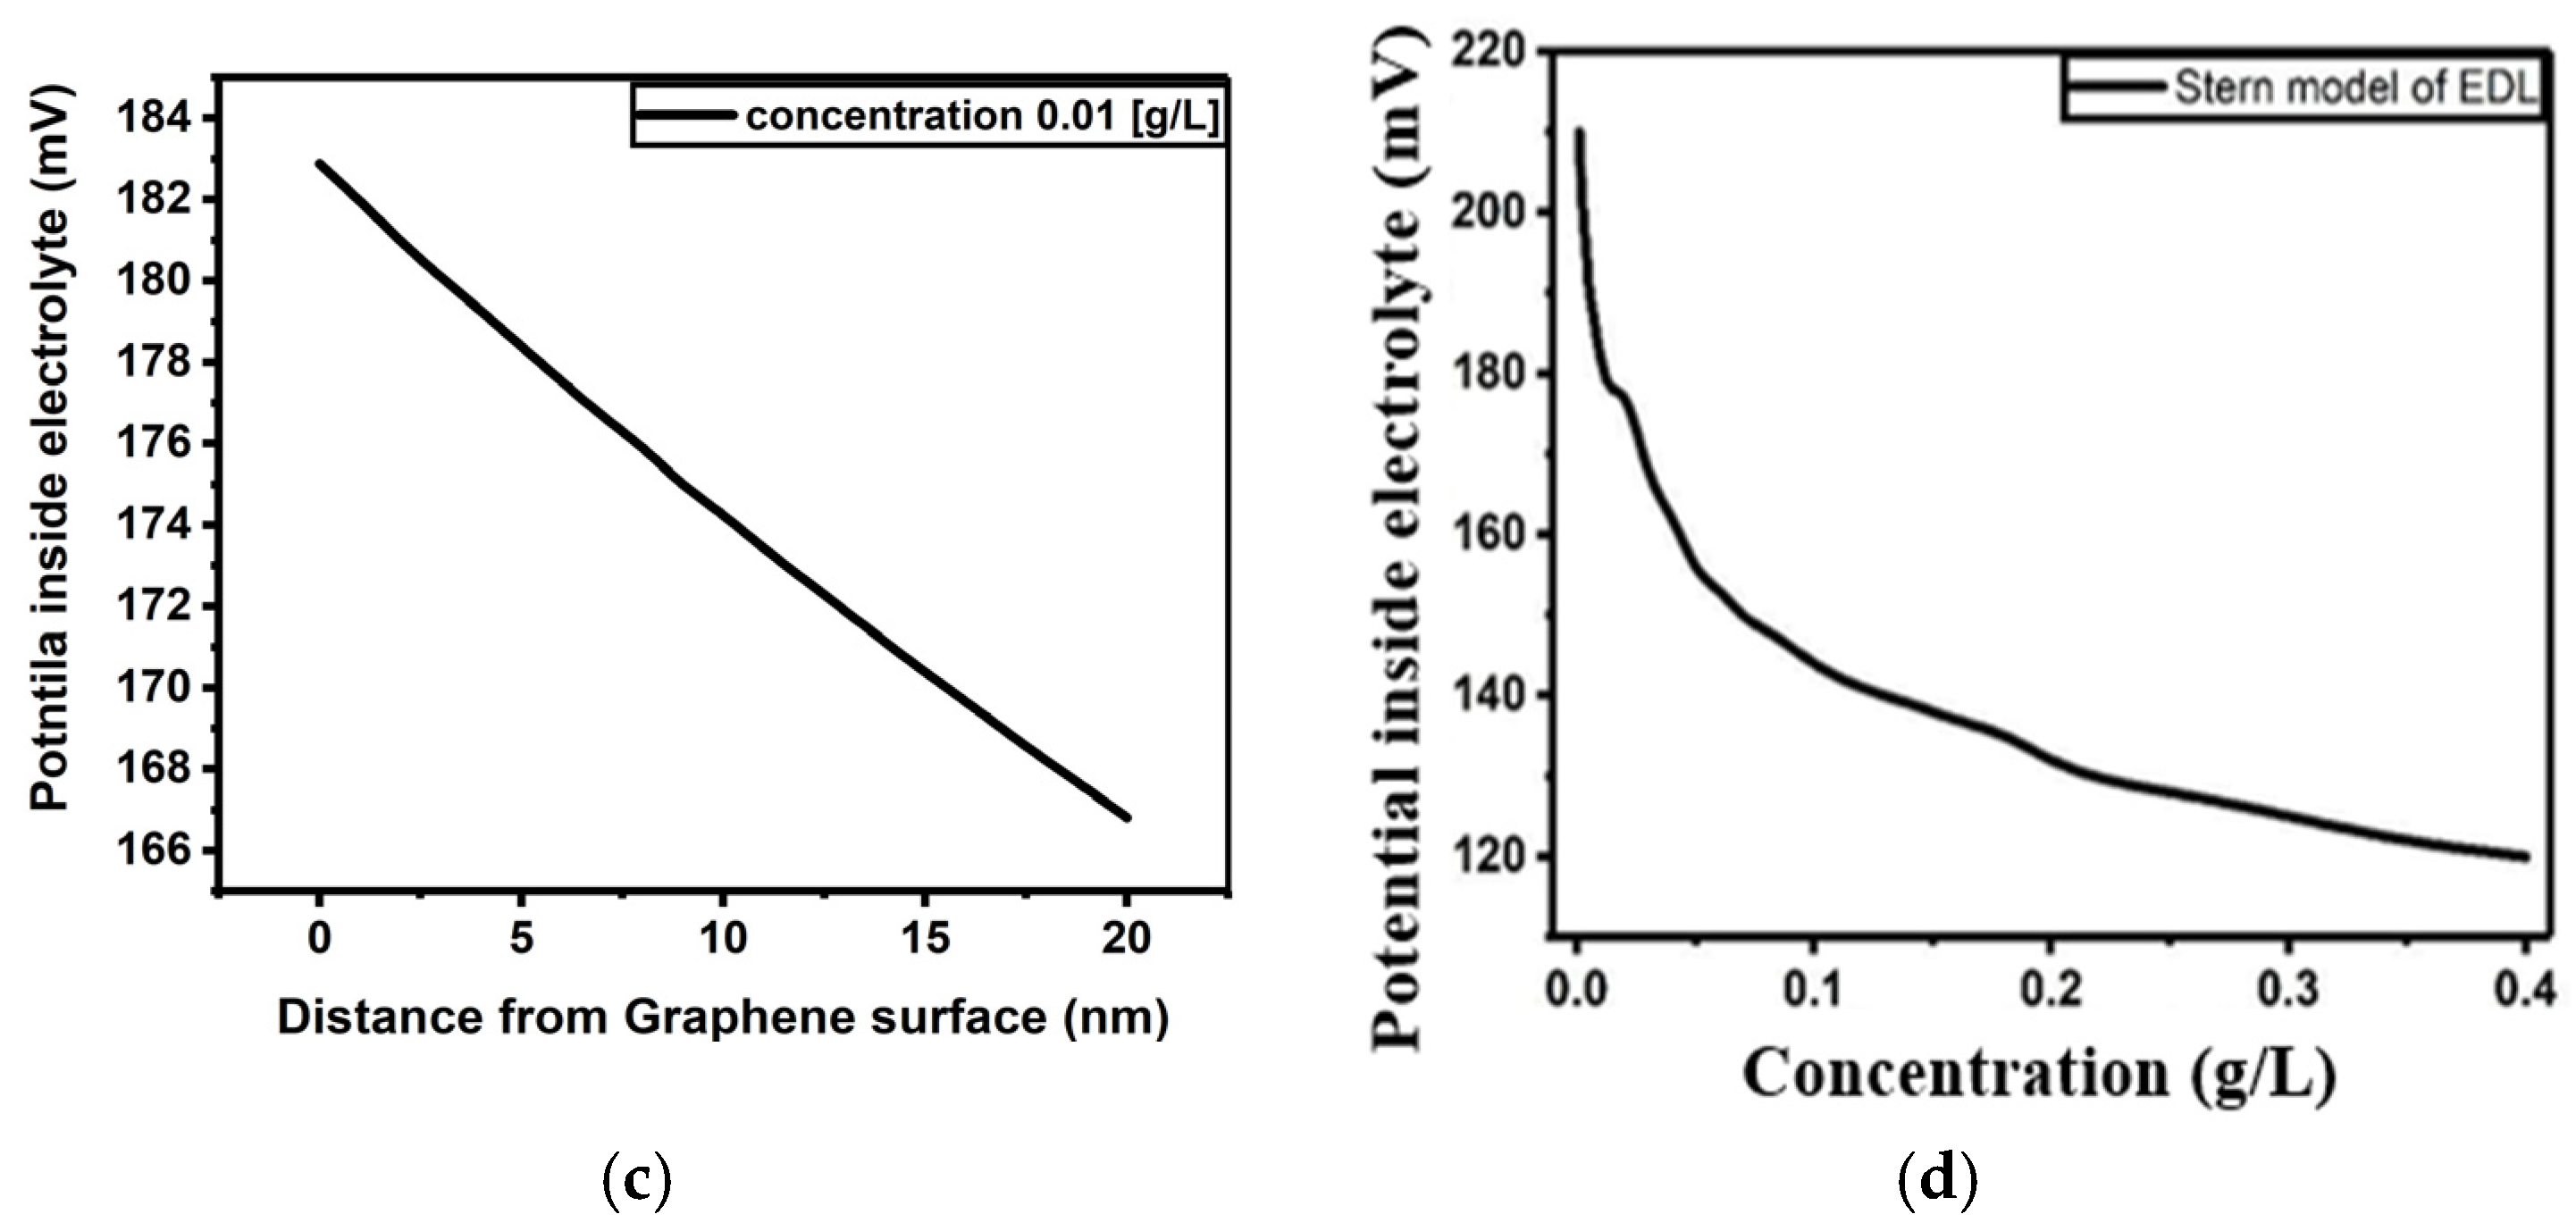
As a crucial step in our continuum numerical investigation, we examined the electric potential profile across the electrical double layer for various β 2 -m concentrations, starting from the graphene–electrolyte interface. Since the electric potential plays a significant role in the overall framework, we analyzed how it varies with both the distance from the electrode–electrolyte boundary and the electrolyte concentration. The corresponding simulation results, shown in Figure 4, follow the pattern predicted by Equation (8) [46]:
φ ( x ) = φ 0 ( x ) e x p ( x λ D )
According to Debye–Hückel theory, the Debye length λ D characterizes the typical extent of the ionic atmosphere around a central ion and can be expressed using the following relation [47]:
λ D = ε r ε 0 T K B e 2 Z ± 2 c ±
The expression introduced by Lewis and Randall, known as the bulk ionic strength, is used to quantify the impact of charge and interionic interactions on the behavior of electrolytes. The expression I = μ = 1 / 2 c i ± Z 2 quantifies the impact of charge and interionic interactions on the electrolyte property referred to as bulk ionic strength [48,49].
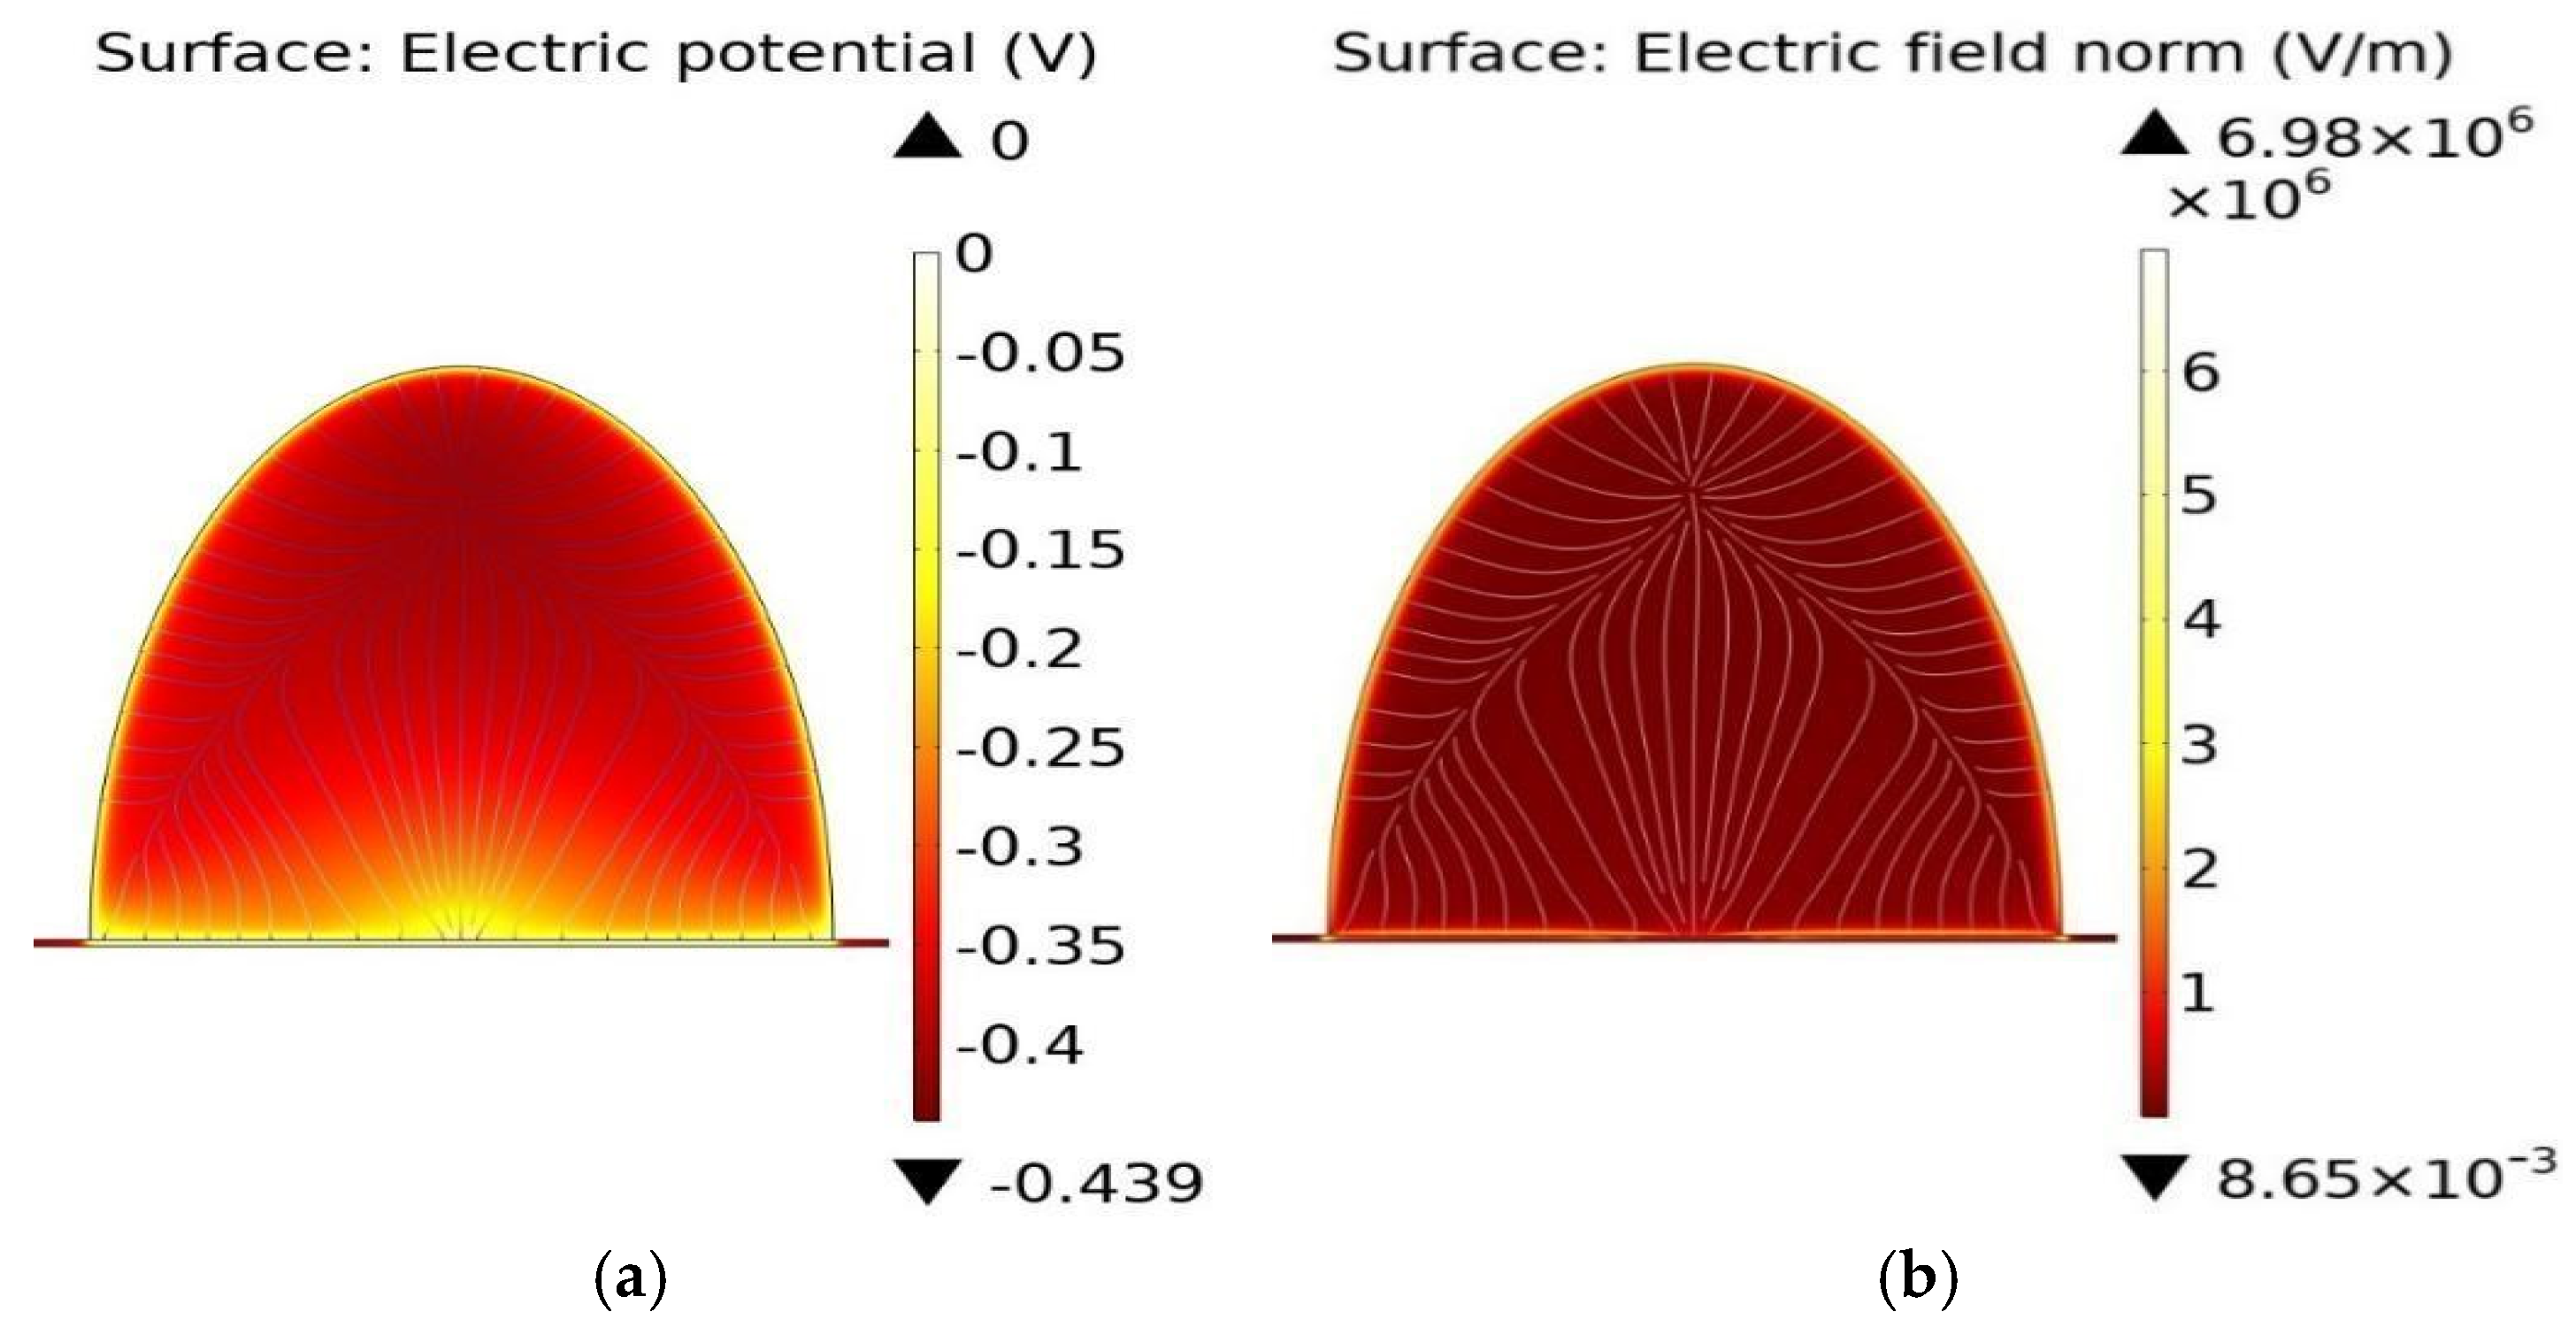
Figure 4a,b illustrate the spatial distribution of the electric potential and the corresponding electric field generated at the interface between graphene and the electrolyte in the presence of a β2-microglobulin concentration of 0.01 g/L. These profiles reflect the electrostatic interactions occurring within the electrical double layer that forms at the graphene–electrolyte boundary. As the concentration of β2-microglobulin increases, the ionic strength of the solution also rises, which leads to a reduction in the Debye length. This decrease in Debye length results in a stronger screening effect, thereby diminishing the magnitude of the electrostatic potential, as predicted by Equation (8).
Furthermore, as the distance from the graphene–electrolyte interface increases, both the electric potential and the electric field exhibit a gradual decay. This behavior aligns with the theoretical exponential attenuation described by Equation (8), which governs the potential distribution in an electrolyte medium. Consequently, the trends observed in Figure 4c,d are, in principle, expected to follow an exponential decay profile.
However, the numerical results reveal deviations from this ideal exponential behavior at certain distances, particularly in regions very close to the graphene surface. In these near-interface zones, the computed potential shows a more linear variation rather than a purely exponential decay.
In the next step, the electrical behavior of the graphene channel is analyzed by calculating the drain–source current under varying concentrations of β2-microglobulin (β2-m) adsorbed on its surface. The investigated concentration range, from 0.001 g/L to 0.4 g/L, is selected due to its clinical relevance in medical diagnostics. Figure 5a,b present the corresponding variations in current, Dirac point position, and full width at half minimum (FWHM_min) as functions of β2-m concentration, while Figure 5c illustrates a colour map of the current distribution along the graphene channel.
Because β2-m carries a net negative charge (approximately −2) under the experimental pH conditions, its adsorption onto graphene induces an electrostatic gating effect. This additional negative surface charge modifies the local carrier density in the channel, shifting the Dirac point toward more positive gate voltages. Such a positive shift indicates effective p-doping behavior, as a higher gate bias is required to restore charge neutrality. As the β2-m concentration increases, the surface coverage becomes more significant, leading to a higher interfacial charge density and a more pronounced Dirac point shift, demonstrating a clear concentration-dependent response.
These electrostatic interactions directly influence the measured current, as shown in Figure 5a, where changes in carrier density alter the conductivity of the graphene channel. At the same time, variations in FWHM_min reflect modifications in carrier scattering and disorder introduced by biomolecular adsorption. The current distribution map in Figure 5c further reveals that, while the current remains relatively uniform at low concentrations, higher β2-m levels can introduce spatial non-uniformities due to localized charge accumulation. Overall, these results confirm that the sensor response is governed by electrostatic coupling between the charged biomolecules and the graphene surface, highlighting the high sensitivity of graphene-based field-effect devices to variations in biomolecular charge density.
In conventional graphene field-effect transistors (GFETs) incorporating relatively thick gate dielectrics, for example, 300 nm thermally grown SiO2, the overall gate capacitance is dominated by the geometrical capacitance of the oxide layer, while the quantum capacitance of graphene can be reasonably neglected in a first-order approximation. In contrast, emerging device configurations employ substantially thinner high-κ dielectric materials, leading to enhanced gate capacitance and lower operating voltages. In such architectures, the quantum capacitance of graphene becomes comparable to the oxide capacitance and therefore significantly influences the electrostatic response of the device.
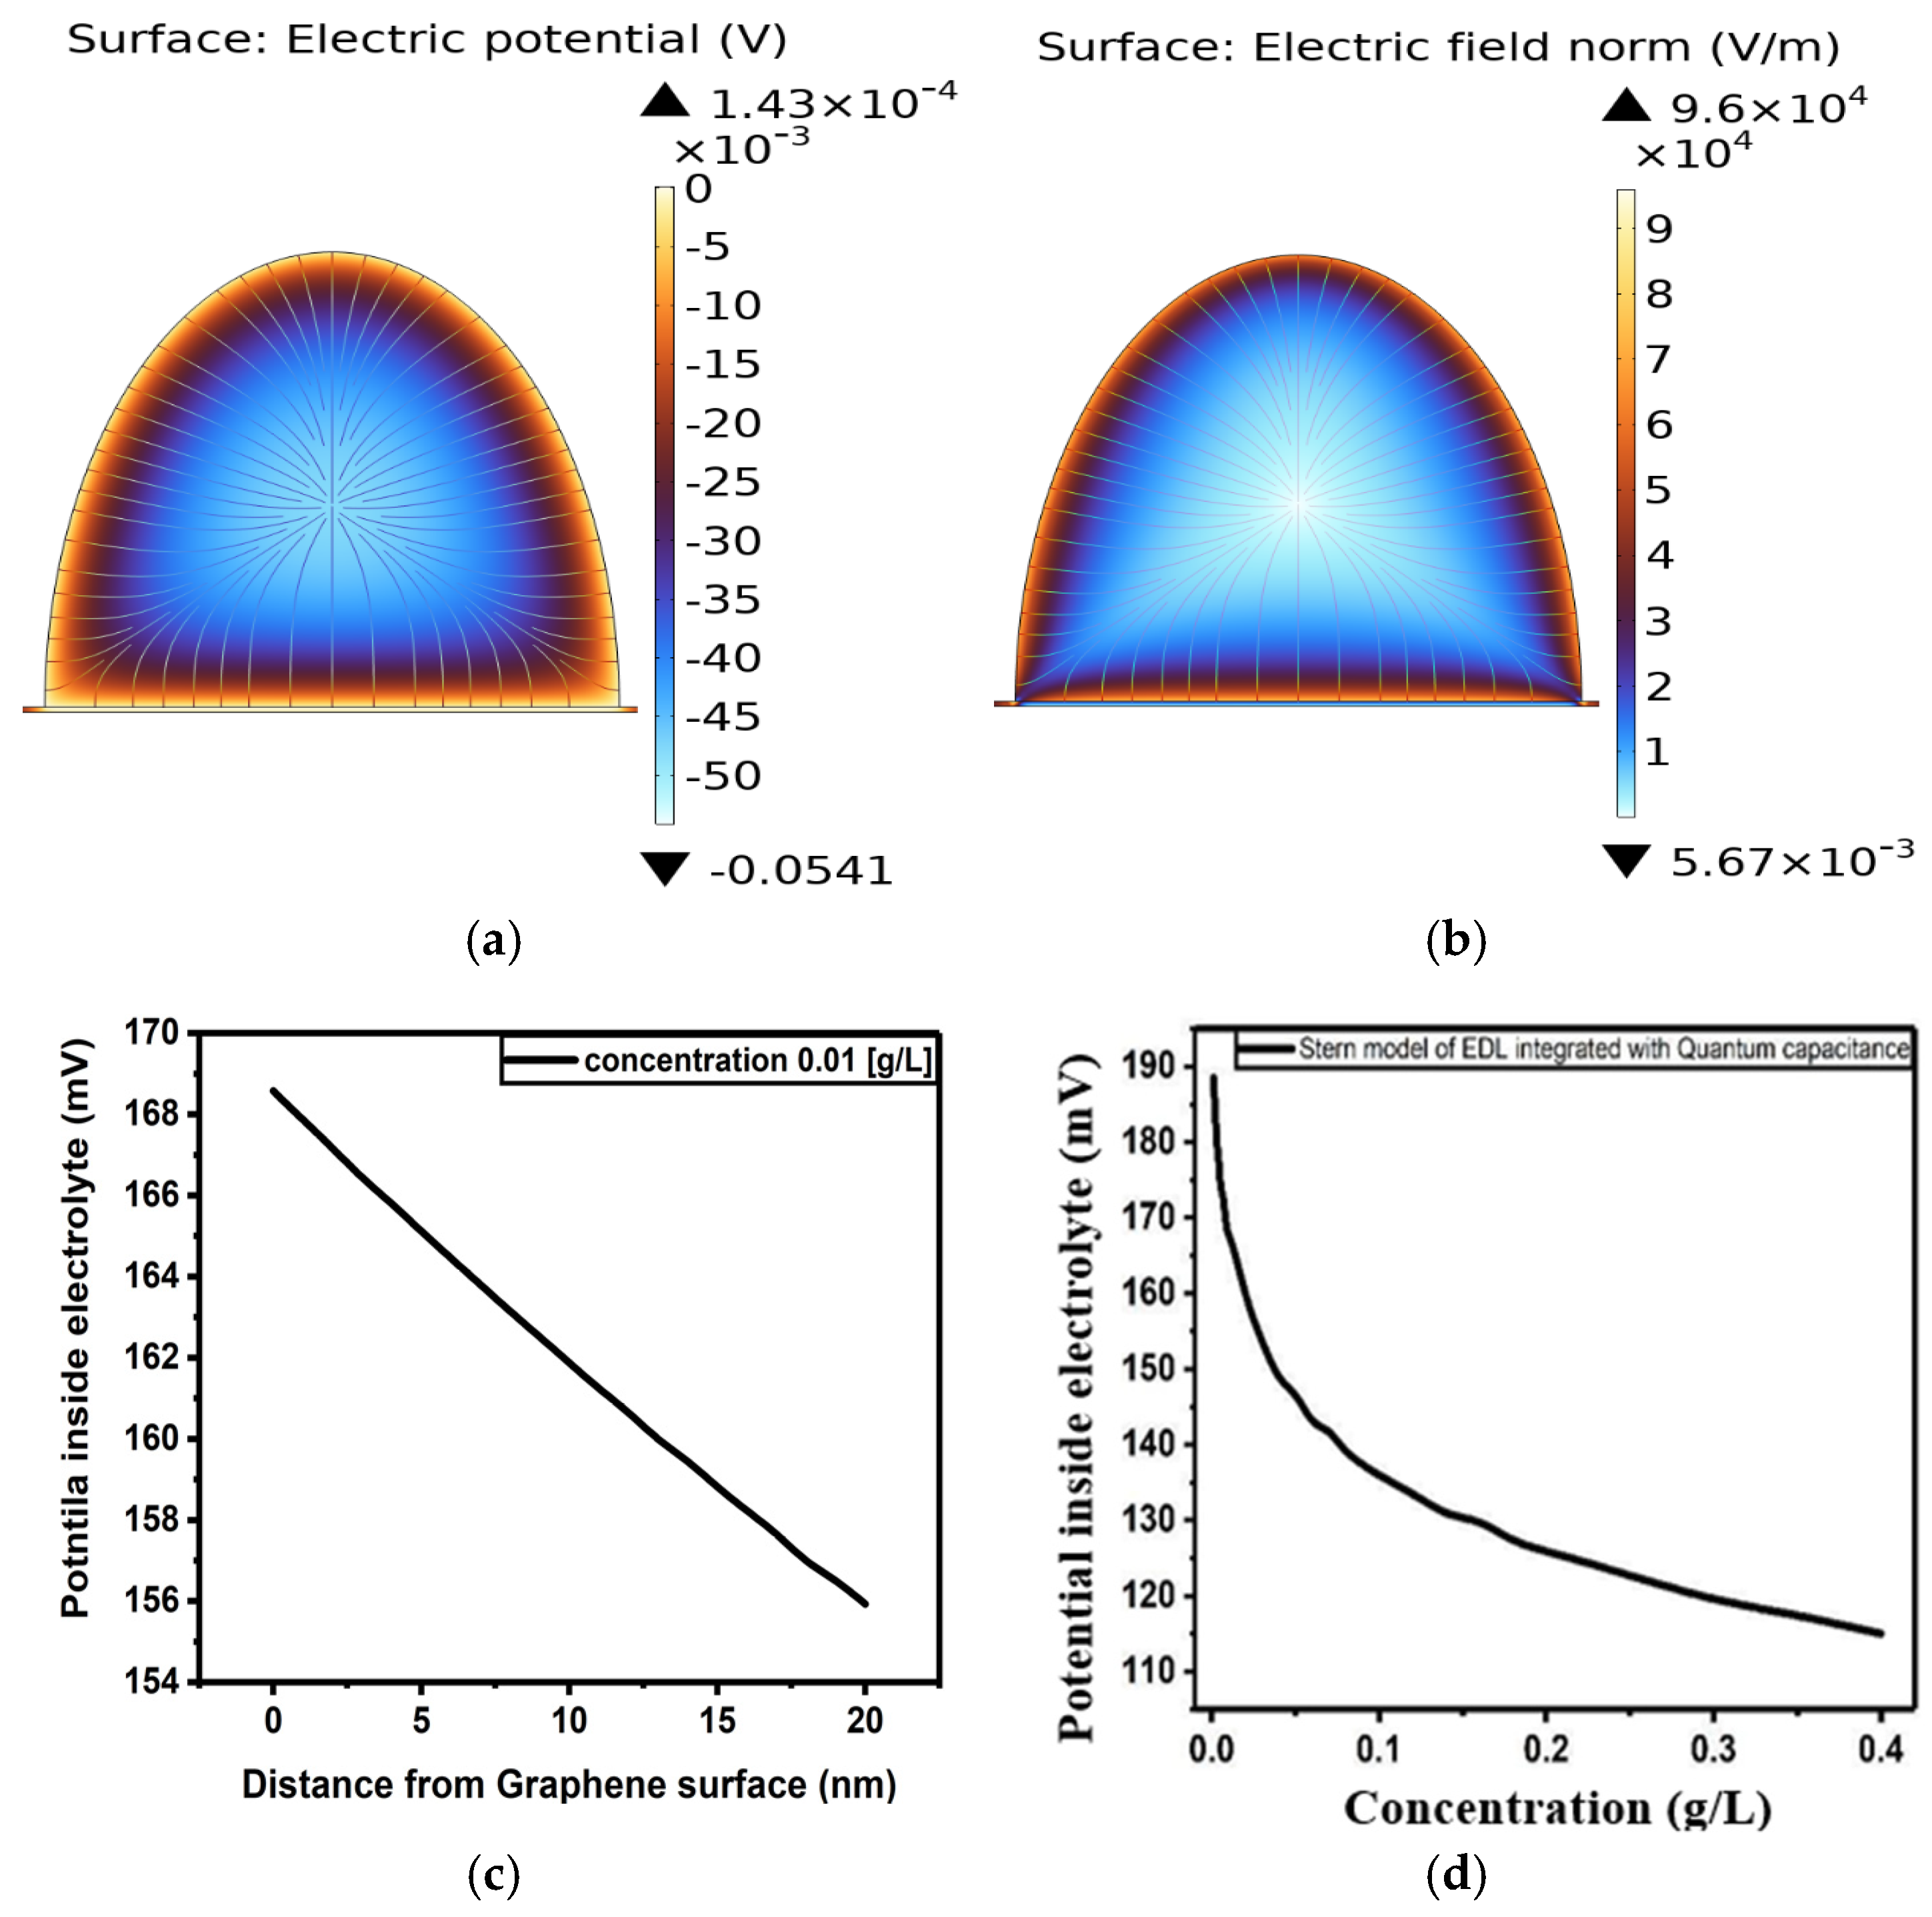
Accordingly, in our analysis, the graphene quantum capacitance is treated as a series capacitance in combination with the electric double-layer capacitance at the electrolyte interface. Based on this model, we calculate the electrostatic potential distribution within the electrolyte for different ionic concentrations and separation distances in order to understand how the graphene–electrolyte interface responds under realistic sensing conditions. Figure 6a,b present the electric potential and electric field distribution at the graphene–electrolyte interface when the effect of quantum capacitance is included in the formulation. In this case, the finite density of states of graphene plays a crucial role in limiting its charge storage capability, meaning that the total capacitance of the system is no longer purely governed by the classical electrostatic double layer but is also influenced by the quantum-mechanical properties of graphene. As a result, both the magnitude and spatial variation of the potential are significantly modified, particularly in the near-interface region where carrier accumulation is most pronounced.
Figure 6c,d further illustrate the spatial evolution of the electrostatic potential as a function of distance from the graphene surface for different concentrations of β2-microglobulin (β2-m). These results demonstrate a clear dependence of the potential decay behavior on biomolecular concentration. At higher concentrations, the increased adsorption of β2-m leads to a higher surface charge density, which enhances electrostatic screening within the electrolyte. This results in a more rapid decay of the potential away from the interface. In contrast, at lower concentrations, the screening effect is weaker, and the potential extends further into the electrolyte, showing a more gradual decay profile.
The computational results indicate that, upon incorporating quantum capacitance into the model, the electrostatic potential difference between the electrolyte and the graphene surface decreases. However, the Dirac point shift—being directly dependent on both the interfacial potential and the total capacitance—exhibits an overall increase. This behavior arises because the inclusion of quantum capacitance increases the effective total capacitance of the system. The enhancement in total capacitance has a more significant influence on the Dirac point shift than the reduction in interfacial potential. For example, at a concentration of 0.4 g/L, the Dirac point shift predicted by the Stern model is 5.2 V, whereas inclusion of quantum capacitance increases this value to 5.7 V. These results highlight the critical role of quantum capacitance in accurately describing the electrostatic response of graphene-based systems.
Building upon this, Figure 7a presents the variation of the drain–source current in the graphene channel for different concentrations of β2-microglobulin when quantum capacitance effects are included. The results show that the current response is strongly modulated by the adsorption of β2-m, as the induced surface charge alters the carrier density within the channel. With increasing concentration, the current exhibits a systematic variation, reflecting enhanced electrostatic gating and stronger interaction between the biomolecules and the graphene surface.
Figure 7b further illustrates the corresponding shifts in the Dirac point position along with changes in the FWHM_min. The shift in the Dirac point confirms the progressive doping effect caused by β2-m adsorption, while the variation in FWHM_min indicates changes in carrier scattering and transport broadening within the graphene channel. Together, these parameters provide a comprehensive description of how quantum capacitance and biomolecular concentration jointly influence the electronic characteristics of the device.
Overall, these results emphasize that incorporating quantum capacitance not only refines the electrostatic description but also significantly improves the predicted electrical response and sensing behavior of the graphene-based biosensor.
In this study, several key parameters are employed to evaluate the performance of the proposed Graphene Field-Effect Transistor (GFET) biosensor. Here, V d i r a c demonstrates the shift in the Dirac point associated with changes in protein concentration ( C ), V r represents the voltage at the resistance peak or Dirac point, c indicates the protein concentration, and S corresponds to the sensor’s sensitivity. The FWHM refers to the full width at half maximum of the response curve. Additionally, figure of merit (FOM), signal-to-noise ratio (SNR), and detection accuracy (DA) are considered critical metrics for assessing general sensor performance [27,50].
S = V d i r a c C
F O M = S F W H M
S N R = V d i r a c F W H M
D A = 1 F W H M
Device performance depends on several coupled parameters, including electrolyte ionic strength, dielectric properties, graphene mobility, gate capacitance, operating voltages, and biomolecular surface coverage. While the present study focuses on the impact of β2-microglobulin concentration and graphene quantum capacitance, future developments could exploit structured Design of Experiments (DoE) methodologies to investigate the combined influence of multiple factors. In particular, we will consider Taguchi-based optimization strategies that may provide an efficient framework for assessing the robustness of GFET biosensors against variations in electrochemical and electronic operating conditions. Table 2 demonstrate the performance of our sensor in two different concentrations.

4. Conclusions

We have computationally investigated the operation of a graphene-based field-effect transistor as a biosensor for the detection of β2-microglobulin at different concentrations. Atomistic simulations elucidate the adsorption mechanism, showing that the protein adopts a stable horizontal orientation on the graphene surface while preserving its overall compactness, in agreement with the radius of gyration analysis, and suggest that β2-m can be treated as a negatively charged ionic species with an effective size and electric charge, enabling a physics-based description of its electrostatic interaction with the graphene surface. Numerical simulations exploiting the finite element method indicate that small changes in the β2-m concentration in buffer solution induce a measurable shift in the Dirac point of the graphene device. Due to the effective negative charge of the protein, the Dirac voltage shifts toward higher gate voltages, showing an effective p-type doping pattern. Meanwhile, increasing protein concentration results in a progressively larger Dirac point shift, proving the concentration-dependent response of the proposed sensor. In this context, the impact of graphene quantum capacitance was systematically investigated, showing that the incorporation of quantum capacitance—beyond the conventional EDL–Stern model—modifies the overall interfacial electrostatics and significantly enhances the sensor’s Sensitivity-over-FWHM_min FOM. To quantify the effect of quantum capacitance, the relative enhancement in the figure of merit (FOM) was evaluated. At a concentration of 0.4 g/L, the FOM increased from 1.49 to 1.62, corresponding to an improvement of 8.7%. At 0.001 g/L, the FOM increased from 41.55 to 76.06, corresponding to an 83.1% enhancement. These results indicate that the contribution of quantum capacitance becomes increasingly significant at low concentrations. The graphene FET-based biosensor operation reported in this work demonstrates high potential for physiological and clinical applications, specifically for the sensitive detection of protein biomarkers. By combining electrochemical double-layer modelling with graphene quantum capacitance effects, the proposed approach provides a comprehensive framework for designing high-sensitivity, label-free biosensors with tunable electrical response and enhanced detection capability.
Although β2-microglobulin is used here as a representative case study, the proposed multiscale framework is generally applicable to other biomarkers, with the predicted sensing response being determined by the specific structural and electrostatic properties of the adsorbed biomolecule.
Several effects relevant to practical implementations, including electronic noise, signal drift, long-term temporal stability, charge trapping, and biomolecular desorption, were not explicitly considered. Future work will extend the model by incorporating time-dependent electrochemical processes and stochastic fluctuations arising from both the graphene/electrolyte interface and the electronic readout system.
Notably, a possible route to go beyond the present investigation would target the in-depth physical discussion of the observed phenomena, with the purpose of exploring in detail the competitive role between quantum capacitance and electrostatic screening in the different concentration regimes.

Supplementary Materials

The following supporting information can be downloaded at: https://www.mdpi.com/article/10.3390/electronics15132837/s1.

Author Contributions

Conceptualization, G.B. (Ghassem Baridi); Methodology, G.B. (Ghassem Baridi) and M.A.; Software, L.M., Y.M.M., E.D., S.C., G.B. (Giorgia Brancolini), L.R. and F.R. (Francesco Rossella); Validation, G.B. (Ghassem Baridi), A.L., M.C.M., V.C., E.H.A., Y.M.M., S.C., G.B. (Giorgia Brancolini) and F.R. (Francesco Rossella); Formal analysis, G.B. (Ghassem Baridi), A.L., L.M., F.R. (Federico Rapuzzi), M.C.M., V.C., M.A., S.C., G.B. (Giorgia Brancolini) and F.R. (Francesco Rossella); Investigation, G.B. (Ghassem Baridi), E.H.A., L.R. and F.R. (Francesco Rossella); Resources, Y.M.M., E.D., S.C., G.B. (Giorgia Brancolini), L.R. and F.R. (Francesco Rossella); Data curation, G.B. (Ghassem Baridi), A.L., F.R. (Federico Rapuzzi), H.M.K.G.A.H., M.A., G.B. (Giorgia Brancolini) and F.R. (Francesco Rossella); Writing—original draft, G.B. (Ghassem Baridi) and G.B. (Giorgia Brancolini); Writing—review & editing, G.B. (Ghassem Baridi), A.L., L.M., F.R. (Federico Rapuzzi), H.M.K.G.A.H., M.C.M., V.C., E.H.A., Y.M.M., M.A., E.D., S.C., G.B. (Giorgia Brancolini), L.R. and F.R. (Francesco Rossella); Visualization, G.B. (Ghassem Baridi), L.M., H.M.K.G.A.H., Y.M.M., G.B. (Giorgia Brancolini) and L.R.; Supervision, L.M., E.D., L.R. and F.R. (Francesco Rossella); Project administration, L.R. and F.R. (Francesco Rossella); Funding acquisition, L.R. and F.R. (Francesco Rossella). All authors have read and agreed to the published version of the manuscript.

Funding

F.R. acknowledges the support from FAR 2024 Progetti interdisciplinari—Linea UNIMORE “NT-ROBOT” (CUP E93C24001920005), from INFN project “MANIFOLD”, and from the National Recovery and Resilience Plan (PNRR), Mission 04, Component 2, Investment 1.5 Next Generation EU, Call for tender No. 3277, dated 30 December 2021 (Award Number: 0001052, dated 23 June 2022). This work was also supported by Japan Science and Technology Agency (JST) as part of Adopting Sustainable Partnerships for Innovative Research Ecosystem (ASPIRE), Grant Number JPMJAP2530. This research was partially funded by the Spanish Agencia Estatal de Investigación, under grant nos. PID 2021-1264830B-I00 and PDC2023-145856-I00, Agencia Estatal de Investigación of Spain (Grant No. PID2022-136285NB-C32), and FEDER/Junta de Castilla y León Research (Grant No. SA106P23).

Data Availability Statement

The original contributions presented in this study are included in the article/Supplementary Material. Further inquiries can be directed to the corresponding author.

Conflicts of Interest

The authors declare no conflict of interest.

References

  1. Prince, M.; Guerchet, M.; Prina, M. The Global Impact of Dementia 2013–2050; Alzheimer’s Disease International: London, UK, 2013. [Google Scholar]
  2. Tartaglia, G.G.; Pechmann, S.; Dobson, C.M.; Vendruscolo, M. Life on the edge: A link between gene expression levels and aggregation rates of human proteins. Trends Biochem. Sci. 2007, 32, 204–206. [Google Scholar] [CrossRef] [Scilit] [PubMed]
  3. Berggård, I.; Bearn, A.G. Isolation and properties of a low molecular weight β2-globulin occurring in human biological fluids. J. Biol. Chem. 1968, 243, 4095–4103. [Google Scholar] [PubMed]
  4. Cox, J.H.; Yewdell, J.W.; Eisenlohr, L.C.; Johnson, P.R.; Bennink, J.R. Antigen presentation requires transport of MHC class I molecules from the endoplasmic reticulum. Science 1990, 247, 715–718. [Google Scholar] [CrossRef] [Scilit] [PubMed]
  5. Verdone, G.; Corazza, A.; Viglino, P.; Pettirossi, F.; Giorgetti, S.; Mangione, P.; Esposito, G. The solution structure of human β2-microglobulin reveals the prodromes of its amyloid transition. Protein Sci. 2002, 11, 487–499. [Google Scholar] [CrossRef] [Scilit] [PubMed]
  6. Eichner, T.; Radford, S.E. Understanding the complex mechanisms of β2-microglobulin amyloid assembly. FEBS J. 2011, 278, 3868–3883. [Google Scholar] [PubMed]
  7. Shi, C.; Zhu, Y.; Su, Y.; Chung, L.W.; Cheng, T. β2-Microglobulin: Emerging as a promising cancer therapeutic target. Drug Discov. Today 2009, 14, 25–30. [Google Scholar] [CrossRef] [Scilit] [PubMed]
  8. Liabeuf, S.; Lenglet, A.; Desjardins, L.; Neirynck, N.; Glorieux, G.; Lemke, H.-D.; Vanholder, R.; Diouf, M.; Choukroun, G.; Massy, Z.A. Plasma beta-2 microglobulin is associated with cardiovascular disease in uremic patients. Kidney Int. 2012, 82, 1297–1303. [Google Scholar] [CrossRef] [Scilit] [PubMed]
  9. Svatoňová, J.; Bořecká, K.; Adam, P.; Lánská, V. Beta2-microglobulin as a diagnostic marker in cerebrospinal fluid: A follow-up study. Dis. Markers 2014, 2014, 495402. [Google Scholar] [PubMed]
  10. Yoo, C.; Yoon, D.H.; Kim, S.; Huh, J.; Park, C.S.; Park, C.J.; Suh, C. Serum beta-2 microglobulin as a prognostic biomarker in patients with mantle cell lymphoma. Hematol. Oncol. 2016, 34, 22–27. [Google Scholar] [PubMed]
  11. Yılmaz, B.; Köklü, S.; Yüksel, O.; Arslan, S. Serum beta 2-microglobulin as a biomarker in inflammatory bowel disease. World J. Gastroenterol. WJG 2014, 20, 10916. [Google Scholar] [CrossRef] [Scilit] [PubMed]
  12. Chitra, P.; Bakthavatsalam, B.; Palvannan, T. Beta-2 microglobulin as an immunological marker to assess the progression of human immunodeficiency virus infected patients on highly active antiretroviral therapy. Clin. Chim. Acta 2011, 412, 1151–1154. [Google Scholar] [CrossRef] [Scilit] [PubMed]
  13. Mangione, P.P.; Esposito, G.; Relini, A.; Raimondi, S.; Porcari, R.; Giorgetti, S.; Bellotti, V. Structure, folding dynamics, and amyloidogenesis of D76N β2-microglobulin: Roles of shear flow, hydrophobic surfaces, and α-crystallin. J. Biol. Chem. 2013, 288, 30917–30930. [Google Scholar] [CrossRef] [Scilit] [PubMed]
  14. Raffaini, G.; Ganazzoli, F. Simulation study of the interaction of some albumin subdomains with a flat graphite surface. Langmuir 2003, 19, 3403–3412. [Google Scholar] [CrossRef] [Scilit]
  15. Raffaini, G.; Ganazzoli, F. Adsorption of charged albumin subdomains on a graphite surface. J. Biomed. Mater. Res. Part A Off. J. Soc. Biomater. Jpn. Soc. Biomater. Aust. Soc. Biomater. Korean Soc. Biomater. 2006, 76, 638–645. [Google Scholar]
  16. Raffaini, G.; Ganazzoli, F. Molecular dynamics simulation of the adsorption of a fibronectin module on a graphite surface. Langmuir 2004, 20, 3371–3378. [Google Scholar] [CrossRef] [Scilit] [PubMed]
  17. Raffaini, G.; Ganazzoli, F. Protein adsorption on a hydrophobic surface: A molecular dynamics study of lysozyme on graphite. Langmuir 2010, 26, 5679–5689. [Google Scholar] [PubMed]
  18. Alexa, K.; Todorova, N.; Yarovsky, I. Exploring 2D graphene-based nanomaterials for biomedical applications: A theoretical modeling perspective. Small Sci. 2025, 5, 2400505. [Google Scholar]
  19. Lafleur, J.P.; Jönsson, A.; Senkbeil, S.; Kutter, J.P. Recent advances in lab-on-a-chip for biosensing applications. Biosens. Bioelectron. 2016, 76, 213–233. [Google Scholar] [PubMed]
  20. Baridi, G.; Liaquat, A.; Martini, L.; Rapuzzi, F.; Clericò, V.; Amado, M.; Diez, E.; Abidi, E.H.; Maschio, M.C.; Corni, S.; et al. Computational Simulation of Surface Plasmonic Resonance Biosensor for β2-Microglobulin based on Electrolyte-Gated Graphene. Sensors 2026, 26, 2815. [Google Scholar] [CrossRef] [Scilit] [PubMed]
  21. Bhakta, S.A.; Evans, E.; Benavidez, T.E.; Garcia, C.D. Protein adsorption onto nanomaterials for the development of biosensors and analytical devices: A review. Anal. Acta 2015, 872, 7–25. [Google Scholar] [CrossRef] [Scilit]
  22. Prete, D.; Dimaggio, E.; Demontis, V.; Zannier, V.; Rodriguez-Douton, M.J.; Guazzelli, L.; Rossella, F. Electrostatic control of the thermoelectric figure of merit in ion-gated nanotransistors. Adv. Funct. Mater. 2021, 31, 2104175. [Google Scholar]
  23. Amado, M.; Diez, E.; López-Romero, D.; Rossella, F.; Caridad, J.M.; Dionigi, F.; Bellani, V.; Maude, D.K. Plateau–insulator transition in graphene. New J. Phys. 2010, 12, 053004. [Google Scholar] [CrossRef] [Scilit]
  24. Hu, Z.; Hu, Y.; Huang, L.; Zhong, W.; Zhang, J.; Lei, D.; Chen, Y.; Ni, Y.; Liu, Y. Recent progress in organic electrochemical transistor-structured biosensors. Biosensors 2024, 14, 330. [Google Scholar] [CrossRef] [Scilit] [PubMed]
  25. Baridi, G.; Gharaaty, S.; Hajati, Y.; Sabaeian, M. Hybrid quantum dot-graphene layers with improved optical properties in the terahertz spectrum region. Phys. E Low-Dimens. Syst. Nanostructures 2023, 146, 115524. [Google Scholar] [CrossRef] [Scilit]
  26. Brancolini, G.; Bellucci, L.; Maschio, M.C.; Di Felice, R.; Corni, S. The interaction of peptides and proteins with nanostructures surfaces: A challenge for nanoscience. Curr. Opin. Colloid Interface Sci. 2019, 41, 86–94. [Google Scholar] [CrossRef] [Scilit]
  27. Baridi, G.; Liaquat, A.; Martini, L.; Nappi, L.; Rapuzzi, F.; Clericò, V.; Abidi, E.H.; Meziani, Y.M.; Amado, M.; Diez, E.; et al. Graphene-Based Chemical Field-Effect Transistors: Impact of Electric Double Layer Model and Quantum Capacitance on Na+ Detection Capabilities. Micromachines 2026, 17, 433. [Google Scholar] [PubMed]
  28. Martinez, M.; Bruce, N.J.; Romanowska, J.; Kokh, D.B.; Ozboyaci, M.; Yu, X.; Wade, R.C. SDA 7: A modular and parallel implementation of the simulation of diffusional association software. J. Comput. Chem. 2015, 36, 1631–1645. [Google Scholar] [CrossRef] [Scilit] [PubMed]
  29. Van Der Spoel, D.; Lindahl, E.; Hess, B.; Groenhof, G.; Mark, A.E.; Berendsen, H.J. GROMACS: Fast, flexible, and free. J. Comput. Chem. 2005, 26, 1701–1718. [Google Scholar] [CrossRef] [Scilit] [PubMed]
  30. Jorgensen, W.L.; Maxwell, D.S.; Tirado-Rives, J. Development and testing of the OPLS all-atom force field on conformational energetics and properties of organic liquids. J. Am. Chem. Soc. 1996, 118, 11225–11236. [Google Scholar] [CrossRef] [Scilit]
  31. Maschio, M.C. Modeling an Amyloidogenic Protein in Solution and on Surfaces. Ph.D. Thesis, University of Modena and Reggio Emilia, Modena, Italy, 2019. [Google Scholar]
  32. Ivanov Vladimir, D. The Helmholtz model. J. Solid State Electrochem. 2024, 28, 2487–2493. [Google Scholar] [CrossRef] [Scilit]
  33. Bard, A.J.; Larry, R.F.; White, H.S. Electrochemical Methods: Fundamentals and Applications; John Wiley & Sons: Hoboken, NJ, USA, 2022. [Google Scholar]
  34. Zhang, G. Simulating the electrical double layer capacitance. In Proceedings of the COMSOL Conference 2010 Boston, Boston, MA, USA, 7–9 October 2010. [Google Scholar]
  35. Wu, J. Understanding the electric double-layer structure, capacitance, and charging dynamics. Chem. Rev. 2022, 122, 10821–10859. [Google Scholar] [CrossRef] [Scilit] [PubMed]
  36. Burt, R.; Birkett, G.; Zhao, X.S. A review of molecular modelling of electric double layer capacitors. Phys. Chem. Chem. Phys. 2014, 16, 6519–6538. [Google Scholar] [CrossRef] [Scilit] [PubMed]
  37. Gongadze, E.; Petersen, S.; Beck, U.; Van Rienen, U. Classical Models of the Interface between an Electrode and an Electrolyte. In Proceedings of the COMSOL Conference 2009 Milan, Milan, Italy, 13–14 October 2009; COMSOL: Burlington, MA, USA, 2009; pp. 14–16. [Google Scholar]
  38. Wu, G.; Meyyappan, M.; Lai, K.W. Simulation of graphene field-effect transistor biosensors for bacterial detection. Sensors 2018, 18, 1715. [Google Scholar] [CrossRef] [Scilit] [PubMed]
  39. Laganà, F. Design and Simulation-Based Validation of an Embedded Acquisition Architecture for In Situ PCB Integrity Monitoring in Biomedical Devices. Electronics 2026, 15, 833. [Google Scholar] [CrossRef] [Scilit]
  40. Coluccio, M.L.; Pullano, S.A.; Vismara, M.F.M.; Coppedè, N.; Perozziello, G.; Candeloro, P.; Gentile, F.; Malara, N. Emerging Designs of Electronic Devices in Biomedicine. Micromachines 2020, 11, 123. [Google Scholar] [CrossRef] [Scilit] [PubMed]
  41. Zhan, C.; Neal, J.; Wu, J.; Jiang, D.E. Quantum effects on the capacitance of graphene-based electrodes. J. Phys. Chem. C 2015, 119, 22297–22303. [Google Scholar] [CrossRef] [Scilit]
  42. Xia, J.; Chen, F.; Li, J.; Tao, N. Measurement of the quantum capacitance of graphene. Nat. Nanotechnol. 2009, 4, 505–509. [Google Scholar] [CrossRef] [Scilit] [PubMed]
  43. Ohno, Y.; Maehashi, K.; Yamashiro, Y.; Matsumoto, K. Electrolyte-gated graphene field-effect transistors for detecting pH and protein adsorption. Nano Lett. 2009, 9, 3318–3322. [Google Scholar] [PubMed]
  44. Xu, L.; Ramadan, S.; Rosa, B.G.; Zhang, Y.; Yin, T.; Torres, E.; Shaforost, O.; Panagiotopoulos, A.; Li, B.; Kerherve, G.; et al. On-chip integrated graphene aptasensor with portable readout for fast and label-free COVID-19 detection in virus transport medium. Sens. Diagn. 2022, 1, 719–730. [Google Scholar] [PubMed]
  45. Jarić, S.; Kudriavtseva, A.; Nekrasov, N.; Orlov, A.V.; Komarov, I.A.; Barsukov, L.A.; Gadjanski, I.; Nikitin, P.I.; Bobrinetskiy, I. Femtomolar detection of the heart failure biomarker NT-proBNP in artificial saliva using an immersible liquid-gated aptasensor with reduced graphene oxide. Microchem. J. 2024, 196, 109611. [Google Scholar]
  46. Huang, J. Zooming into the inner helmholtz plane of Pt(111)–aqueous solution interfaces: Chemisorbed water and partially charged ions. JACS Au. 2023, 3, 550–564. [Google Scholar] [CrossRef] [Scilit] [PubMed]
  47. Zhao, J.; Wang, M.; Li, H.; Zhang, X.; You, L.; Qiao, S.; Jiang, M. Lithium-ion-based solid electrolyte tuning of the carrier density in graphene. Sci. Rep. 2016, 6, 34816. [Google Scholar] [PubMed]
  48. Solomon, T. The definition and unit of ionic strength. J. Chem. Educ. 2001, 78, 1691. [Google Scholar] [CrossRef] [Scilit]
  49. Kesler, V.; Murmann, B.; Soh, H.T. Going beyond the Debye length: Overcoming charge screening limitations in next-generation bioelectronic sensors. Acs Nano. 2020, 14, 16194–16201. [Google Scholar] [CrossRef] [Scilit] [PubMed]
  50. Wekalao, J.; U, A.K.; S, G.; Almawgani, A.H.; Abdelrahman Ali, Y.A.; Manvani, R.; Patel, S.K. Graphene-based THz surface plasmon resonance biosensor for hemoglobin detection applicable in forensic science. Plasmonics 2024, 19, 2141–2154. [Google Scholar]
Figure 1. Binding poses of wild-type β2M on a graphite surface obtained from docking (top), 500 ns classical MD (middle), and T-REMD simulations (60 ns, 52 replicas; bottom). Contact residues are shown in licorice representation. For each structure, residue–surface contact frequencies are reported on the right.
Electronics 15 02837 g001
Figure 2. (a) Schematic diagram of a graphene field-effect transistor (GFET) gated by an electrolyte. (b) Cross-sectional view of the device.
Electronics 15 02837 g002
Figure 3. (a) Secondary structure elements of β2M and its amino acid sequence (one-letter code). (b) Final orientation of β2M on graphene after T-REMD, with positively charged residues (Arg45, Arg81) highlighted in blue, and negatively charged residues (Glu36, Glu44, Glu47) in red.
Electronics 15 02837 g003
Figure 4. Simulation of (a) electric field and (b) electrical potential at the interface between graphene and an electrolyte containing 0.01 g/L β2-m. The EDL is modeled using the Stern model. Electrolyte potential profiles in the Stern model of the EDL for β2-m: (c) at varying distances from the graphene interface (concentration 0.01 g/L); and (d) at different β2-m concentrations (distance from graphene surface: 1 nm).
Electronics 15 02837 g004aElectronics 15 02837 g004b
Figure 5. (a) Drain–source current of the graphene channel as a function of back-gate voltage, calculated using the Stern model of the EDL. (b) Dirac point position and FWHM_min as functions of concentration. (c) Color map of the drain–source current as a function of gate voltage for different concentrations.
Electronics 15 02837 g005
Figure 6. Simulated electrostatic characteristics at the graphene/electrolyte interface in the presence of 0.01 g/L β2-m. (a) Electric field distribution and (b) electric potential profile, calculated using the Stern model of the EDL, incorporating graphene quantum capacitance in a series configuration. (c) Electrolyte potential profile at varying β2-m concentrations (evaluated at 1 nm from the graphene surface). (d) Electrolyte potential as a function of distance from the graphene interface at a fixed concentration of 0.01 g/L.
Electronics 15 02837 g006
Figure 7. (a) Drain–source current of the graphene channel as a function of back-gate voltage, calculated using the Stern model of the EDL while considering the impact of quantum capacitance. (b) Dirac point position and FWHM_min as functions of concentration.
Electronics 15 02837 g007
Table 1. Comparison with representative experimental GFET studies reporting Dirac point shift.
Device TypeTarget AnalyteReported Sensing MechanismRef.
Electrolyte-Gated GFETpH/Protein AbsorptionDirac Point Shift[43]
GFETSARS-CoV-2 BiomarkerConcentration Dependent Dirac Point Shift[44]
Liquid-gated rGO-FETNT-proBNPDirac Point Shift Sensitivity[45]
Present Work—Simulated Electrolyte-Gated GFETB2-microgluobulinConcentration-Dependent Dirac Point Shift—Multiscale Modelling
Table 2. The results demonstrate that incorporating quantum capacitance into the electrical double layer (EDL) framework of the Stern model significantly enhances sensor sensitivity, which is one of the most critical performance parameters. For example, at a concentration of 0.001 g/L, the sensitivity increases to 200 V·L·g−1 when quantum capacitance is taken into account. These findings further emphasize the importance of including quantum capacitance effects for accurate performance assessment of graphene-based sensors.
Sensor Parameter PerformanceC = 0.4 g/LC = 0.001 g/L
EDL in Stern ModelEDL + Quantum CapacitanceEDL in Stern ModelEDL + Quantum Capacitance
S (V*L/g)11.7513300540
FOM (L/g)1.491.6241.5576.07
SNR0.60.630.0420.076
DA (1/V)0.1270.1240.1380.136
Disclaimer/Publisher’s Note: The statements, opinions and data contained in all publications are solely those of the individual author(s) and contributor(s) and not of MDPI and/or the editor(s). MDPI and/or the editor(s) disclaim responsibility for any injury to people or property resulting from any ideas, methods, instructions or products referred to in the content.