1. Introduction
The rise of 5G service-based architectures and the ideas around next-generation telecommunications have pushed Information and Communication Technology (ICT) toward distributed systems and virtualization. In these rapidly changing environments, it is essential to conduct reliable performance testing at both the application and service levels. Isolation testing of network layers is well-established in this field, guided by authoritative industry standards such as ITU-T Y.1540/Y.1541 for IP performance metrics, 3GPP TR 38.901 for channel models, and ETSI TS 132 455 for 5G performance measurements [
1,
2,
3]. While these frameworks provide a robust foundation for evaluating fundamental network parameters, an approach that examines end-to-end service behavior under dynamic, realistic application-level traffic conditions can significantly enhance the performance testing conducted to date. Although dedicated hardware generators offer high precision, their exorbitant costs and architecture often limit distributed experimental research and development (R&D) in both academic and industrial fields. Therefore, an approach utilizing distributed software-based traffic generators can be developed. However, this approach requires an assessment of overall computational and communication resources. If a software-based generator lacks sufficient computational power during high-density tests, this results in internal bottlenecks. This makes it difficult to determine whether performance degradation originates from the tested network or the generator itself, highlighting a significant gap in the comprehensive understanding of hardware-software dependencies in distributed testing environments.
This study addresses these challenges within the context of the PL-5G National Laboratory for Advanced 5G Research (PL-5G), established at the initiative of key Polish technical universities. The Laboratory’s purpose was to enable research in 5G networks, wireless techniques, and protocols, as well as to study services and applications using this type of network or the environment in general [
4]. The environment is available to researchers and students; collaborative use with industry is also possible. The lab allows services to be run in a modern network-computing environment, enabling the modification of infrastructure parameters. Its functionality goes beyond the capabilities of commercial infrastructures, primarily due to its heterogeneous environment encompassing hardware and software solutions both in terms of LTE/5G mobile networks, virtualization techniques, computing resources including graphics processing units (GPUs), as well as solutions from the area of the Internet of Things and augmented and virtual reality.
The application-level distributed traffic generator described in this article was developed and implemented at the PL-5G National Laboratory for Advanced 5G Research to validate the assumptions. It enables testing the performance of networks provisioned for novel services, simulating realistic conditions dynamically, and verifying the scalability of network solutions by generating traffic from multiple distributed nodes in parallel.
The main aim of this work is to present the architecture of a custom, microservice-based distributed traffic generator and to analyze the correlation between its computing resource utilization and traffic generation efficiency. By dispersing the operation across general-purpose resources, we hypothesize that a highly efficient testing environment can be achieved at a significantly reduced cost. The architecture described in this article comprises a distributed traffic generator and a request-handling module. Unlike well-known solutions, the presented architecture provides efficient operation with limited resource utilization. The described generator operates at the application layer, enabling a network traffic generation approach that reflects real-world conditions. The behavior of devices on a network may depend on the type of network traffic and interference, and the approach described here better reflects real-world conditions.
The remainder of this paper is organized as follows.
Section 2 reviews related work in network traffic generation.
Section 3 details the proposed distributed architecture of the solution.
Section 4 describes the research environment and the test scenarios used to evaluate resource utilization.
Section 5 presents the results of the performance experiments. Finally,
Section 6 discusses the conclusions, plans for further tool development, and future applications.
2. Related Works
The evaluation of modern telecommunications networks, particularly in the context of 5G and emerging 6G technologies, requires sophisticated traffic generation tools capable of replicating complex, real-world behaviors compliant with the aforementioned 3GPP and ITU-T specifications. Currently, there are many solutions available for generating network traffic and verifying it on dedicated hardware generators. While these devices guarantee high precision, their prohibitive costs, lack of scalability, and rigid architectures render them unsuitable for dynamic, cloud-native environments and academic research infrastructures.
Traffic generators can be based on real-time traffic recordings, manual creation of packet streams, or on random data generated by a specially developed algorithm [
5]. In addition to general traffic generators, higher-fidelity traffic generators can also be specified. These simulate user behavior to generate genuine traffic from existing applications. Emulated users are useful in experiments to provide background noise for attackers and defenders [
6]. However, despite the promising features, most of the proposed tools exhibit some problems that may compromise the validity of the experiments. The accuracy of simulation results depends heavily on the performance and reliability of the tool used [
7].
Existing solutions can be divided into five categories [
8]:
Replay engines aim to replay previously captured traffic to reproduce it as accurately as possible. A key aspect of this category is that packets follow the same sequence and timing as they were initially captured.
Maximum-throughput generators are used to test end-to-end network performance by generating the highest possible traffic volume.
Model-based generators that rely on various stochastic models. They can define variables such as packet size and the time between transmitting two consecutive packets.
Self-configuring and high-level generators—based on higher-level network traffic models. An additional feature is their ability to configure parameters using real-time measurements automatically. This approach enables generating output that is statistically similar to real traffic. These generators are often regarded as the most suitable tools for traffic generation, as they compare synthetic and real traffic traces and use a wide range of metrics.
Scenario-based generators typically represent specific network conditions. These scenarios may reference specialized applications of a protocol. Metrics proposed by generators in this category are often unusable outside their assigned scenarios.
Existing Solutions
Traffic generators can also be divided into two structural categories [
9]: traffic generation systems and traffic generation tools. The core distinction lies in their operational complexity. While design requirements for such systems remain loosely defined, their architecture depends on the generator’s intended purpose, with scalability being a critical consideration. This review evaluates existing solutions to identify critical system attributes, focusing on core functionality, supported protocols, and architectural design. Tools, in contrast, often serve as modular components within larger traffic generation frameworks. Descriptions emphasize key features where applicable, detailing their adaptability, protocol compatibility, and integration capabilities.
To address the diverse requirements of modern network testing, several specialized software systems have been widely adopted. Industry standard open-source generators such as Cisco TRex [
10] and Ostinato [
11,
12] offer immense flexibility. TRex supports both stateful and stateless configurations, enabling dynamic payload modifications, stream-triggered actions, and advanced error injection to test network resilience. Ostinato, which utilizes a cross-platform controller-agent architecture, excels at network stress testing and functional validation across diverse protocols. However, despite their advanced traffic manipulation capabilities, these tools are primarily engineered to maximize throughput and stress-test external network hardware. Consequently, they frequently operate under the assumption of unconstrained host resources, lacking native mechanisms to monitor their internal computing footprint during high-load generation.
In contrast, to achieve more realistic distributed workloads, advanced platforms like the Distributed Internet Traffic Generator (D-ITG) [
13,
14] have been developed. D-ITG successfully replicates stochastic traffic processes such as variable inter-departure times and packet sizes across a highly modular architecture. The tool is highly regarded for its ability to evaluate network-centric performance indicators and emulate specific application-layer profiles. Nevertheless, while D-ITG provides comprehensive logs for external network metrics such as latency, jitter, and packet loss, its evaluation frameworks do not inherently focus on the correlation between traffic generation efficiency and the underlying host’s resource consumption, i.e., the central processing unit (CPU) or random-access memory (RAM).
Specialized tools have also been introduced to address specific domain constraints, such as IoT-Flock [
15], which navigates the protocol diversity and resource constraints of IoT ecosystems. Similarly, legacy solutions like Httperf [
16], Seagull [
17], and Scapy [
18] remain prevalent for targeted functional testing and custom packet manipulation. While these tools are highly effective in their respective niches, the substantial CPU resource consumption first identified as a critical limitation preventing multi-instance execution in early tools like Httperf remains an under-researched bottleneck. In modern, containerized microservice architectures, neglecting the operational cost of the generator itself can lead to internal latency, skewing the overall network assessment.
To bridge these multi-instance and cloud-native scaling challenges within modern 5G infrastructures, recent state-of-the-art frameworks have focused heavily on automated virtualization. For instance, Molina Zarca et al. [
19] introduced an automated testing infrastructure that dynamically scales 5G traffic generation within cloud-native topologies using virtualized user equipment. Similarly, contemporary software-based benchmarking frameworks, such as 5GC-Bench [
20], have been introduced to automate stress testing and conduct fine-grained resource profiling of 5G core virtual network functions under realistic signaling workloads. While these edge-cutting frameworks significantly advance automated 5G network orchestration, they primarily emphasize network-layer and control-plane scalability, leaving the granular execution-level hardware dependencies at the application layer as an open area of investigation.
It is crucial to emphasize the architectural distinction between the aforementioned tools and our proposed framework. Tools like TRex, Ostinato, and D-ITG, as well as virtualized frameworks, excel at generating high-speed traffic primarily at the network and transport layers. Conversely, our solution is specifically designed to operate at the application layer, emulating stateful HTTP interactions and managing complex JSON/image payloads mandated by 5G service-based architectures. Since generating complete, dynamic application-layer transactions inherently requires significantly more computational overhead than the stateless transmission of packets at lower layers, a direct, side-by-side quantitative comparison of CPU footprints between these paradigms would be methodologically unfeasible.
Furthermore, the evaluation of traffic generators inherently relies on specific metric frameworks. As outlined in the literature [
8], validation approaches traditionally employ network-centric categories, such as packet-level metrics (e.g., throughput, inter-packet time), flow-level metrics, scaling characteristics, and broad quality-of-service (QoS) indicators. While some studies [
9] expand these frameworks to track operational behaviors, reporting granular indicators such as latency, overall request rates, and occasionally host CPU usage, these host-centric metrics are rarely the primary focus of the evaluation. Most existing tools treat internal CPU and memory consumption merely as background logs rather than critical variables that dictate the generator’s reliability. This highlights the necessity for our proposed approach, which elevates computing resource utilization from a secondary operational metric to the core subject of the performance correlation analysis.
3. Distributed Traffic Generator
This section details the design of a custom, distributed network traffic generation framework tailored for next-generation service-based systems, specifically targeting Internet of Things (IoT) and 5G/6G edge computing environments. The design process incorporated a thorough analysis of existing traffic-generation methodologies, tools, and techniques, addressing the critical research gap in computing resource consumption identified in
Section 2.
The proposed solution advances the development of software-driven traffic generators by emphasizing architectural modifiability and precise resource monitoring. Its architecture adheres to the principles of distributed microservices, reflecting the industry-wide shift away from legacy monolithic systems. This containerized approach ensures scalability, deployment flexibility, and functional extensibility [
21]. The core design principles of the presented solution are:
Service-Level Abstraction—The traffic-generating components are designed as independent, containerized agents that emulate specific behaviors of modern network devices (e.g., high-frequency sensors or video clients). Each microservice executes a discrete task, allowing for the flexible definition of highly complex, concurrent traffic profiles without cross-component interference.
Application-Layer Focus (HTTP-Centric)—The system prioritizes HTTP at the application layer. While traditionally associated with basic web traffic, HTTP is now ubiquitous in modern telecommunications. Most notably, the 3GPP standardization body has established HTTP/2 as the foundational transport protocol for the 5G core service-based architecture (SBA), in which network functions (NFs) communicate entirely via RESTful APIs [
22]. Furthermore, HTTP is the underlying protocol for data payloads, including IoT telemetry aggregation at edge gateways and dominant video streaming standards such as MPEG-DASH (Dynamic Adaptive Streaming over HTTP) [
23]. Operating at this layer enables the framework to evaluate core 5G/6G services without specialized telecommunications hardware.
Scenario-Based Traffic Generation—Aligning with the scenario-based category of traffic generators, the patterns are derived directly from 5G use cases. The framework focuses on emulating practical network constraints and service demands rather than merely replicating raw physical layer transmission. This approach is crucial for identifying processing bottlenecks and hardware–software dependencies during network design.
By decoupling functionalities into independent, interoperable services, the framework supports the incremental testing and validation of diverse network configurations. This modularity enables targeted evaluations of network resilience and performance under varying traffic loads. Deployment in research environments provides researchers with practical insights into the trade-offs involved in network design, without requiring extensive, proprietary infrastructure investments.
3.1. Generator Architecture and Core Components
To ensure high scalability and strict isolation of monitored resources, the proposed framework employs a decentralized, microservice-based architecture. These loosely coupled elements enable service deployment across heterogeneous operating systems via Docker containers, which provide lightweight OS-level virtualization through user-space isolation while sharing the host kernel [
24]. Docker facilitates modular system expansion and input modification without code alterations. Virtual machines (VMs) complement containerization to enhance test reliability for traffic generation, with each VM restricted to a single traffic-generating service.
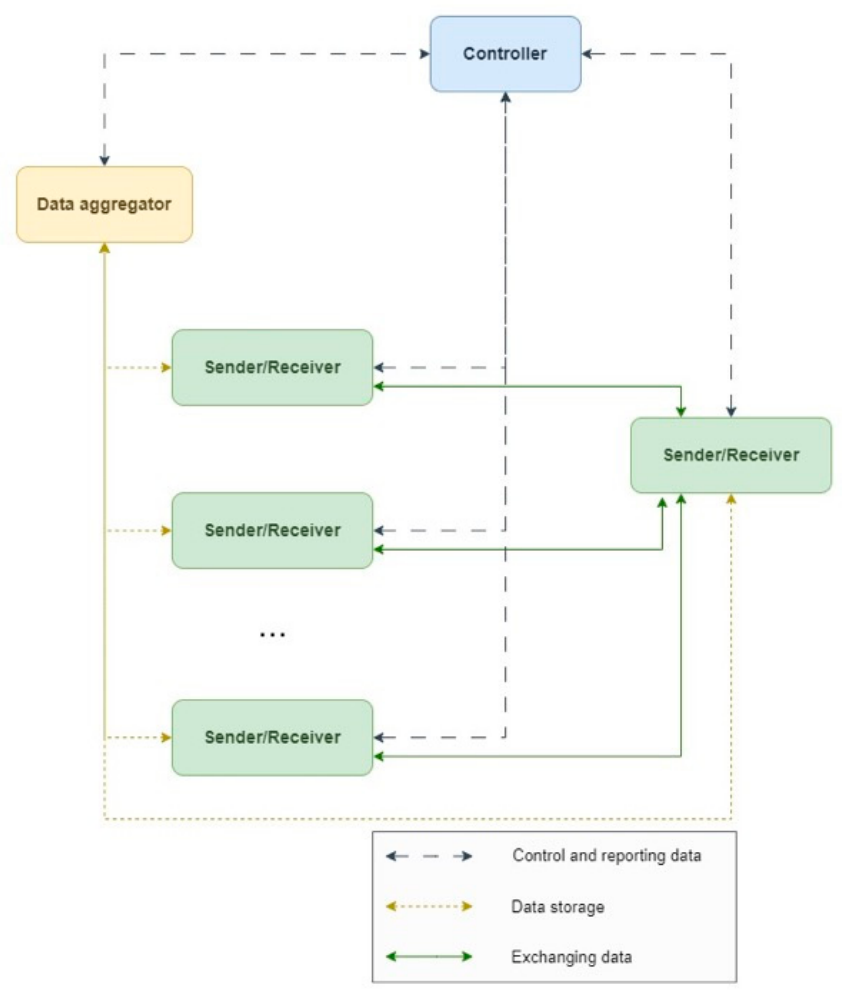
As shown in
Figure 1, the system topology comprises three primary functional entities, each responsible for a distinct phase of the traffic generation and evaluation lifecycle: the Controller, the Data Aggregator, and the Sender/Receiver Nodes. Bidirectional communication (indicated by dual arrows) ensures system coherence—for instance, the aggregator confirms successful data interpretation and storage. This configuration supports current research objectives while permitting future adaptations.
The term “experiment” will be used within the system to refer to the process that occurs during traffic generation. A complete experiment is defined as the entire lifecycle of traffic generation, from initiation to termination.
Controller Node
The Controller serves as the central orchestration unit for the entire distributed testing environment. It enables experiment visualization, execution control, and configuration of input parameters for connected elements. Broadcasting initialization and termination signals across the cluster ensures synchronized execution. Significantly, while the Controller dictates the experiment’s state, it does not actively participate in the data plane, ensuring that its own computational overhead does not interfere with the network traffic under test.
Data Aggregator Node
Operating asynchronously from the active traffic streams, the Data Aggregator acts as a centralized repository for system telemetry and operational metrics. Rather than forcing active nodes to perform resource-intensive database write operations while generating traffic, these nodes transmit the data to the Data Aggregator during the experiment. This node aggregates data such as CPU utilization, RAM consumption, clock speeds, timestamps, request counts, and processing times. As a non-monitored intermediary, it streamlines data collection and visualization through the controller interface.
Sender and Receiver Nodes
The sender and receiver nodes constitute the core traffic generation plane. To guarantee the scientific integrity of the resource consumption measurements, these components are designed to be deployed on isolated virtual machines or dedicated hardware nodes. A single instance can operate as a traffic source (e.g., emulating an IoT sensor or a video camera), a destination sink (receiver), or both concurrently. A sample configuration includes multiple virtual machines generating requests and a single virtual machine acting as the receiver of that traffic. The architecture supports horizontal scaling by adding units or enhancing inter-component communication. Docker-based containerization enables the integration of supplementary data collection and analysis modules within units.
The microservices-oriented system architecture shown in
Figure 1 enables both horizontal and vertical scaling of sender and receiver nodes, as well as of communication patterns. Containerization also facilitates the implementation of functional improvements without the necessity of a thorough architectural overhaul, maintaining modularity while supporting experimental needs.
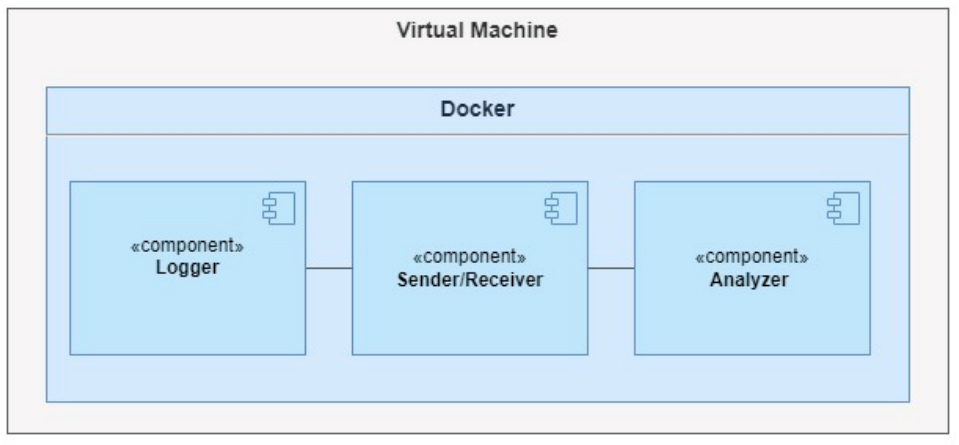
To achieve high-granularity monitoring without relying on external, invasive profiling tools, each sender and receiver node internally may incorporate two key subcomponents (
Figure 2):
Internal Logger—A dedicated module designed to sample the host’s computing resources at strictly defined intervals and transmit the data to a global data collection component as Data Aggregator. This ensures an exact temporal synchronization between the hardware load and the volume of generated HTTP requests.
Analyzer (on receiver side)—To simulate realistic service-based processing—such as computer vision tasks on incoming video frames—without arbitrarily overloading the destination node’s hardware, the Analyzer module introduces controlled, deterministic processing delays. This ensures that the network flow closely mimics the complex behavior of real-world applications while maintaining a predictable baseline for resource evaluation.
3.2. Performance Metrics
To evaluate the proposed distributed architecture and its impact on the underlying host infrastructure, a specific set of evaluation metrics must be defined. Unlike traditional network evaluations that focus solely on external quality of service, this study emphasizes the microservices’ internal operational footprint.
The evaluation framework relies on two categories of metrics:
Computing Resource Utilization—Specifically, CPU Utilization, expressed as a percentage of allocated core capacity, and Memory Utilization are tracked to identify processing bottlenecks during high-load traffic generation.
Traffic Generation Efficiency—Performance indicator is the requests per second metric, which measures the absolute number of completed HTTP connection cycles executed by the Sender nodes over a defined interval.
To validate the hypothesis that a dependency exists between the generated network throughput and the consumption of computing resources, the Pearson correlation coefficient is applied.
With the architectural foundation, microservice components, and evaluation methodology formally established, the study proceeds to the practical implementation.
4. Prototype and Test Scenarios
To validate the proposed distributed architecture and evaluate the correlation between generated network throughput and computing resource consumption, a comprehensive set of experiments was conducted. The testbed was designed to guarantee strict resource isolation, directly addressing the scalability limitations often encountered in single-host generator deployments.
The experiments were executed within the infrastructure of the PL-5G National Laboratory for Advanced 5G Research, node in Wroclaw, Poland. To guarantee strict resource isolation, avoid CPU context-switching bottlenecks, and accurately reflect a real-world edge deployment, the system was not deployed on a single physical machine. Instead, it was fully distributed across a cluster of six distinct virtual machines running Ubuntu Linux (22.04 LTS Server Edition). The software layer was implemented natively in Python (3.11), using the Flask web framework (v2.3) to handle asynchronous HTTP communication. To ensure environmental consistency, modularity, and precise resource limiting, all active components were deployed as Docker (v24.0) containers, configured dynamically via environment variables.
The node topology was organized as follows:
Sender Nodes—Four dedicated VMs acting as traffic generators. To ensure the highest measurement reliability, each Sender VM was restricted to running strictly one primary traffic-generating component (either a Sensor or a Camera emulator) alongside a standalone Logger container.
Receiver Node—Hosted on a separate VM, serving as the destination edge server. It incorporated a receiving endpoint, a local Logger, and an integrated Analyzer module that adds a deterministic processing delay per request to emulate real-world service computation.
Controller and Data Aggregator Node—Deployed on an isolated, sixth management node to orchestrate the experiment lifecycle. This physical isolation ensured that their database input/output operations (I/O) and orchestration signals did not interfere with the hardware measurements of the active traffic plane.
To ensure the reproducibility of the experimental results, all node environments were standardized. The hardware servers used in all experiments were a Hyper-V cluster running Windows Server 2022 (21H2) on HP BL460s (2 x Intel Xeon CPU E5-2650 v3, 128GB RAM each). The virtual machines ran Ubuntu 22.04 LTS Server Edition (Linux Kernel 5.15) in a headless configuration without GPU acceleration. The distributed components were containerized and orchestrated using Docker Engine v24.0. The core logic for both the traffic generator and the receiver was implemented in Python 3.11. The multithreaded HTTP transmission at the sender nodes was handled by the requests library (v2.31.0), while the receiver component was built utilizing the Flask web framework (v2.3). VM communication was routed through a virtualized local area network configured with a 1 Gbps bandwidth limit and a standard MTU of 1500 to accurately simulate edge network transport conditions. For the IoT telemetry, the JSON payload was structured as a lightweight dictionary containing a device identifier, an epoch timestamp, and a simulated data string.
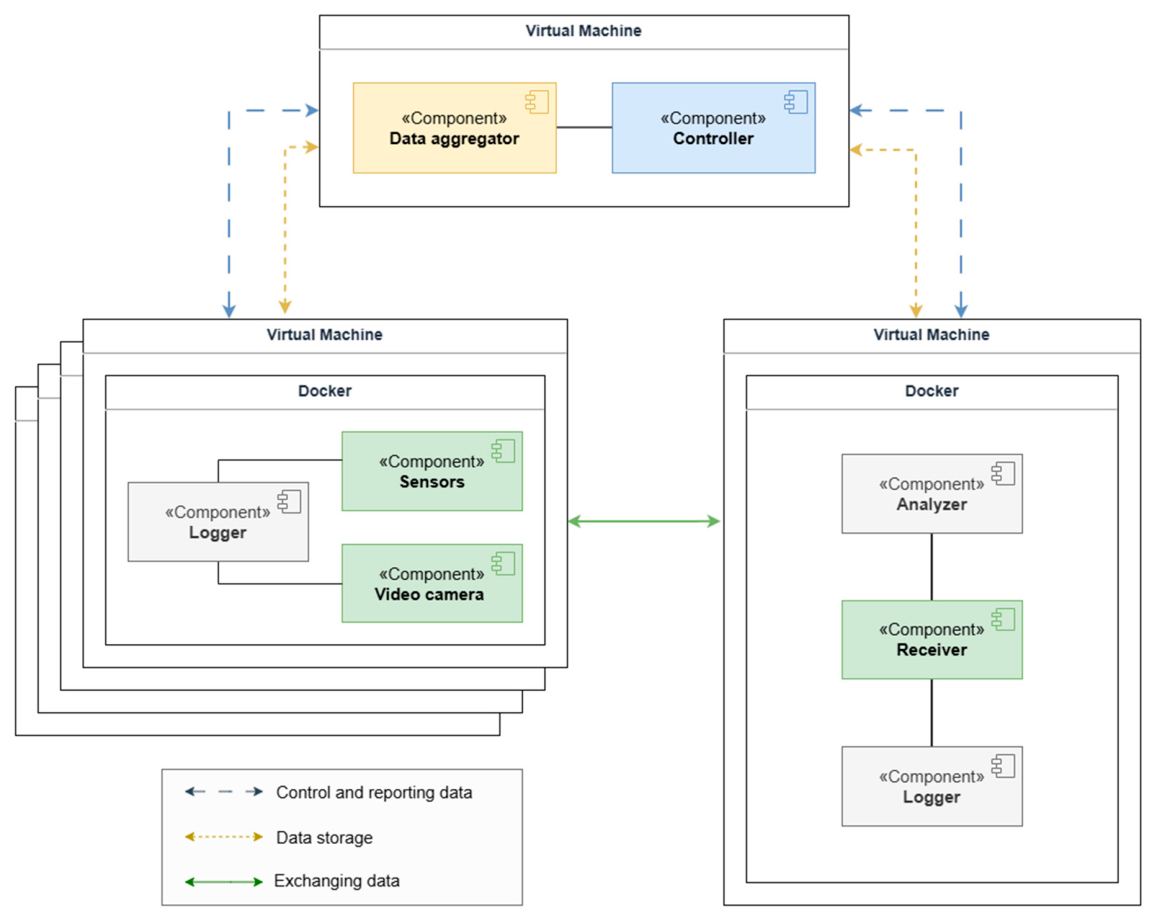
The test environment utilized for the research is presented in
Figure 3. A separate node was designated to manage the activation of nodes that actively generate traffic, resource allocation, and parameter configuration. The Data Aggregator was deployed on the same virtual machine, as discussed in
Section 3. This was intended to ensure the accuracy of resource usage measurements by the units responsible for traffic. It is worth noting that the traffic model for such an environment is based on scenarios designed to simulate 5G/6G use cases.
The resource allocation approach in a particular test scenario depended strictly on the nature of the scenario and the choice of simulated units. In accordance with the specific test scenario, the active sender and receiver nodes were provisioned with tightly constrained computational resources, ranging from 1 to 4 virtual CPU (vCPU) cores and 256 MB to 1 GB of RAM. These specific baseline values were carefully selected to represent the absolute minimum computational footprint required to boot the microservices and establish stable network connections. This intentional resource starvation was a fundamental aspect of the methodology. It provided a strict baseline to empirically measure how vertical scaling, progressively increasing hardware limits, impacts network throughput and system stability. Furthermore, for the nodes handling video streaming emulation, i.e., video camera component, the assigned hardware limits deliberately mirrored the processing and memory constraints of commercial single-board computers typically deployed in IoT and edge computing scenarios, such as the Raspberry Pi.
During the active phase of the experiment, the Logger component on each VM responsible for generating traffic collected hardware and network utilization metrics at a strict 1-s interval. To prevent measurement bias, the Logger processes operated asynchronously without blocking the main data transmission threads. The captured telemetry included the system timestamp, CPU utilization in percent, CPU clock frequency in GHz, absolute and percentage RAM utilization, unacknowledged/lost request counts (monitored by Sender nodes), successful request counts (monitored by the receiver node), and individual request handling times.
4.1. Workflow and System Execution
To ensure measurement reliability and strict synchronization across the distributed cluster, the experimental workflow is rigidly orchestrated. The execution lifecycle of a single experiment relies on an asynchronous, multi-threaded approach and is divided into two distinct operational phases: initialization and provisioning, and concurrent traffic generation.
The experiment begins with the controller-mediated selection of the traffic scenario. During this phase, mandatory input parameters and computational limits (vCPU core count and RAM limits in MB) are injected into the respective microservices via environment variables. After configuration validation, the experiment is initiated by deploying the associated Docker containers and broadcasting HTTP-based activation signals across the cluster to synchronize the onset of traffic generation.
Once activated, the system heavily leverages a multithreaded architecture to ensure continuous transmission and simulate concurrent data streams from multiple virtual sources within a single generator container. This is particularly critical for the Camera emulation components. Each virtual camera feed is assigned to an independent thread, enabling parallel payload generation and transmission. The request payloads are strictly defined by the component type: simulated IoT sensor data packets average 1 KB in JavaScript Object Notation (JSON) format, whereas computationally encoded camera frames range from 100 to 200 KB per request. To ensure realistic data characteristics, these video payloads were dynamically extracted frame-by-frame from a local reference MP4 video file with a native resolution of 1280 × 720 pixels, decoded into memory as 8-bit RGB arrays, and subsequently re-encoded using standard JPEG compression to meet the targeted kilobyte constraints systematically.
Synchronously with the onset of the traffic, the resource monitoring processes commence. Significantly, the Internal Logger operates asynchronously to the main transmission threads. To avoid adding computational overhead or blocking the primary data sockets, the logger uses non-blocking network I/O to stream hardware metrics directly to the dedicated Data Aggregator in real-time. By bypassing local storage entirely, this continuous telemetry feed enables live visualization of system performance and facilitates dynamic control over the ongoing experiment.
During this active phase, the request lifecycle executed by the Sender nodes is formalized in Algorithm A1. This algorithmic abstraction illustrates the sequence of payload generation, HTTP transmission, response evaluation, and latency logging. Conversely, the request handling and processing logic executed by the destination edge server is formalized in Algorithm A2.
4.2. Traffic Scenarios and Execution Parameters
To ensure statistical significance, three traffic profiles were developed to reflect key usage scenarios in next-generation networks. Each scenario had three sets of launch parameters tailored to it, referred to as experiments. Each experimental configuration was repeated 10 times. The resulting metric values were then averaged for each VM configuration actively participating in traffic generation.
4.2.1. Scenario A: UAV Control via Real-Time Video Streaming and Analysis
This scenario models the communication patterns required to control unmanned aerial vehicles (UAVs), such as drones, via continuous video streaming. The primary objective is to evaluate the system’s capacity to handle high-bandwidth, low-latency transmissions essential for real-time, camera-based navigation and environmental analysis. Such requirements are critical in industrial applications (e.g., medical supply transport or parcel delivery), automated agriculture (e.g., crop monitoring and irrigation), and personal drone operations, where minimal frame loss and rapid feedback loops are imperative.
To emulate this environment, the framework utilizes an HTTP-based traffic generator to simulate video streams. Each active traffic element acts as a single UAV instance, transmitting sequential HTTP POST requests, each with a payload corresponding to a computationally encoded camera frame. A single simulated camera generates traffic at approximately 30 frames per second (fps). In these scenarios, one video frame corresponds to exactly one HTTP POST request; thus, FPS and RPS are used interchangeably. The distributed architecture permits multiple concurrent streams per generator, rigorously testing the real-time processing and scalable video transmission capabilities of the target receiver.
The setup utilized 4 sender VMs and 1 receiver VM. Each camera emulator transmitted computationally encoded HTTP POST requests representing video frames (payloads ranging from 100 to 200 KB per frame) at a targeted rate of 30 frames per second (fps).
4.2.2. Scenario B: Athlete Monitoring via Multi-Sensor and Video Data Integration
This scenario focuses on heterogeneous edge environments by integrating high-frequency telemetry with video data to monitor athletes and their surroundings. It encompasses devices measuring physiological parameters (e.g., heart rate, blood oxygen levels, step count) and environmental conditions (e.g., temperature, humidity, air quality), complemented by motion-tracking cameras. This setup reflects both indoor (e.g., dedicated training facilities) and outdoor (e.g., stadiums) use cases, where collected data enable athletes to correlate performance metrics with dynamic environmental factors.
Unlike Scenario A, the traffic model here is highly asymmetrical. The configuration employs two sensor-emulating components and two camera-emulating components to represent the mix of data sources. The sensor elements represent wearable devices that transmit lightweight JSON payloads (approximately 1 KB) at periodic intervals. Conversely, the camera elements simulate stationary or mobile video tracking, streaming at roughly 25 fps. This scenario evaluates the system’s ability to manage massive IoT connections concurrently and sustain high-bandwidth video streams without prioritizing either.
The setup used 2 Sensor VMs and 2 Camera VMs, with data transmitted to 1 receiver VM. The sensor components transmitted lightweight JSON payloads (~1 KB) representing physiological data (e.g., heart rate, oxygen levels). In a single experimental run, a single sensor component generated 359,400 requests, while a single camera component generated 36,000 requests, resulting in a total data volume of approximately 10 GB.
4.2.3. Scenario C: Vehicle Monitoring During Driving via Multi-Camera and Sensors
The final scenario models the complex, real-time data flows required for modern vehicular monitoring and autonomous driving assistance. In this context, a vehicle is equipped with multiple cameras and various sensors (e.g., measuring distance, road quality, and driver vitals) that continuously stream data to a central edge node for immediate analysis. Use cases include autonomous vehicle control, which requires rapid, flawless data processing to generate immediate vehicle actions, and driver alerting systems based on predictive behavioral analysis.
To replicate this specific network load, the scenario employs three camera-emulating components and one sensor-emulating component. The heavy emphasis on video traffic (three concurrent sources streaming at approximately 25 fps) and background sensor telemetry creates a highly demanding environment for the receiving node. This configuration specifically tests the system’s robustness when heavy visual payloads compete with continuous telemetry for network bandwidth and processing resources, ensuring that the receiver can efficiently ingest and analyze the combined traffic to formulate timely responses.
The configuration utilized 3 Sender VMs operating as vehicle cameras (streaming at approximately 30 fps each) and 1 Sender VM simulating an array of vehicle sensors (e.g., distance, road quality, and driver vitals). A single receiver VM ingested this combined traffic to simulate real-time analysis for driver alerting and predictive actions. The total data volume processed during this scenario was approximately 18 GB, with a strict maximum allowable request-handling time of 100 ms.
5. Results
The proposed distributed traffic generation system was evaluated for resource utilization to demonstrate that the approach enables cost-effective experimentation, accounting for both implementation costs and computational resource constraints. The study encompassed three distinct traffic scenarios, each involving multiple experimental iterations (Experiments 1, 2, and 3) under predefined computational constraints. The selected virtual hardware limits are suitable for low-resource edge devices (analogous to IoT gateways or single-board computers), thereby reducing deployment costs. The specific hardware limits (vCPU cores and RAM in MB) allocated to the components across all scenarios are summarized in
Table 1.
For each experiment across all scenarios, the following metrics were continuously monitored at 1-s intervals: duration, CPU usage (%), CPU clock speed (GHz), RAM usage, requests per second, and individual request handling time. To demonstrate the statistical reliability and stability of the proposed testing framework, each experimental scenario was run 10 times independently.
Table 2 presents the descriptive statistics for the receiver component, including the mean requests per second (RPS), standard deviation (STD), and the 95% confidence interval (CI). The low standard deviation across all workloads indicates high reproducibility and minimal performance fluctuations. This can confirm that the generator behaves consistently under load.
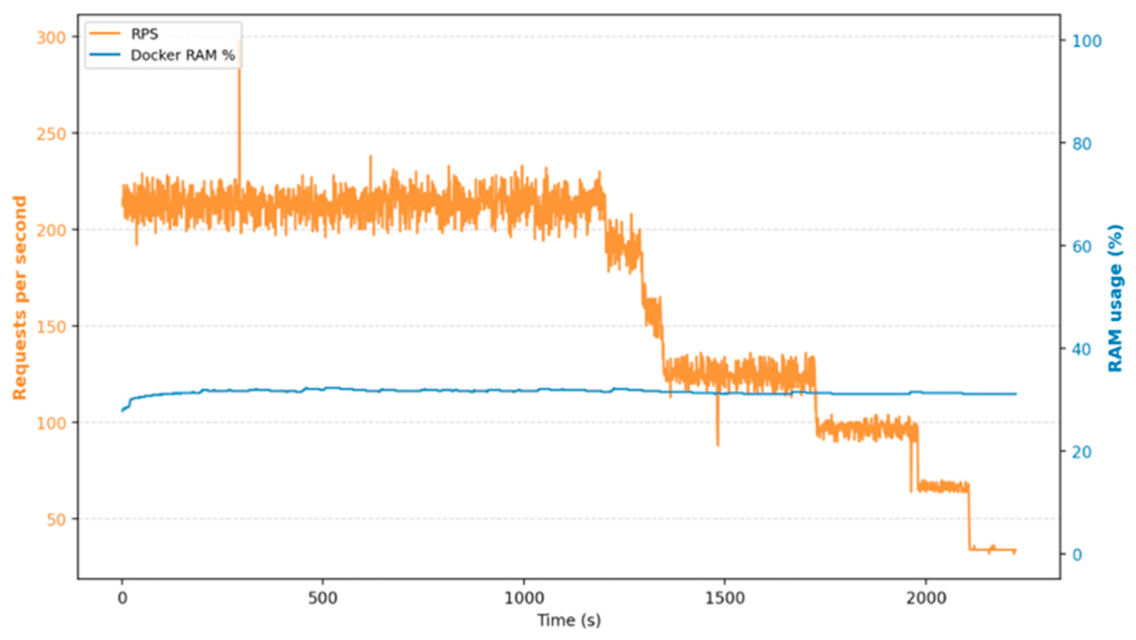
As demonstrated throughout the experiments, RAM usage remained constant from start to finish, regardless of the data type (JSON vs. camera frames) or traffic volume. Additional memory had no significant effect on system performance. A representative example of this stable memory footprint under high-load conditions is visually confirmed in
Figure 4. Because additional memory allocation had no observable effect on system throughput or stability, the detailed performance analysis focused exclusively on CPU utilization, which was identified as the primary operational bottleneck. The consistently flat memory profile confirms that the system’s throughput is CPU-bound rather than memory-bound.
While resource utilization was continuously monitored across all architectural nodes, the correlation analysis presented in this study focused specifically on the receiver component. Under video-heavy HTTP workloads, the receiving node incurs the highest computational overhead from kernel-level context switching, TCP segment reassembly, and application-layer payload parsing. Consequently, the receiver inherently acts as the primary architectural bottleneck, meaning that its CPU saturation directly dictates the overall network throughput limit.
To evaluate the linear relationship between CPU utilization and RPS, Pearson’s correlation coefficient (r) was utilized. A threshold of
was adopted to define a strong positive correlation, aligning with established statistical methodologies for identifying large effect sizes in empirical data analysis [
25].
Table 3 details the correlation analysis between the receiver’s CPU utilization and the generated traffic. Due to the large sample size (N) in each experiment iteration, all calculated coefficients were highly statistically significant (
p < 0.001). This confirms that the observed relationships are structurally robust.
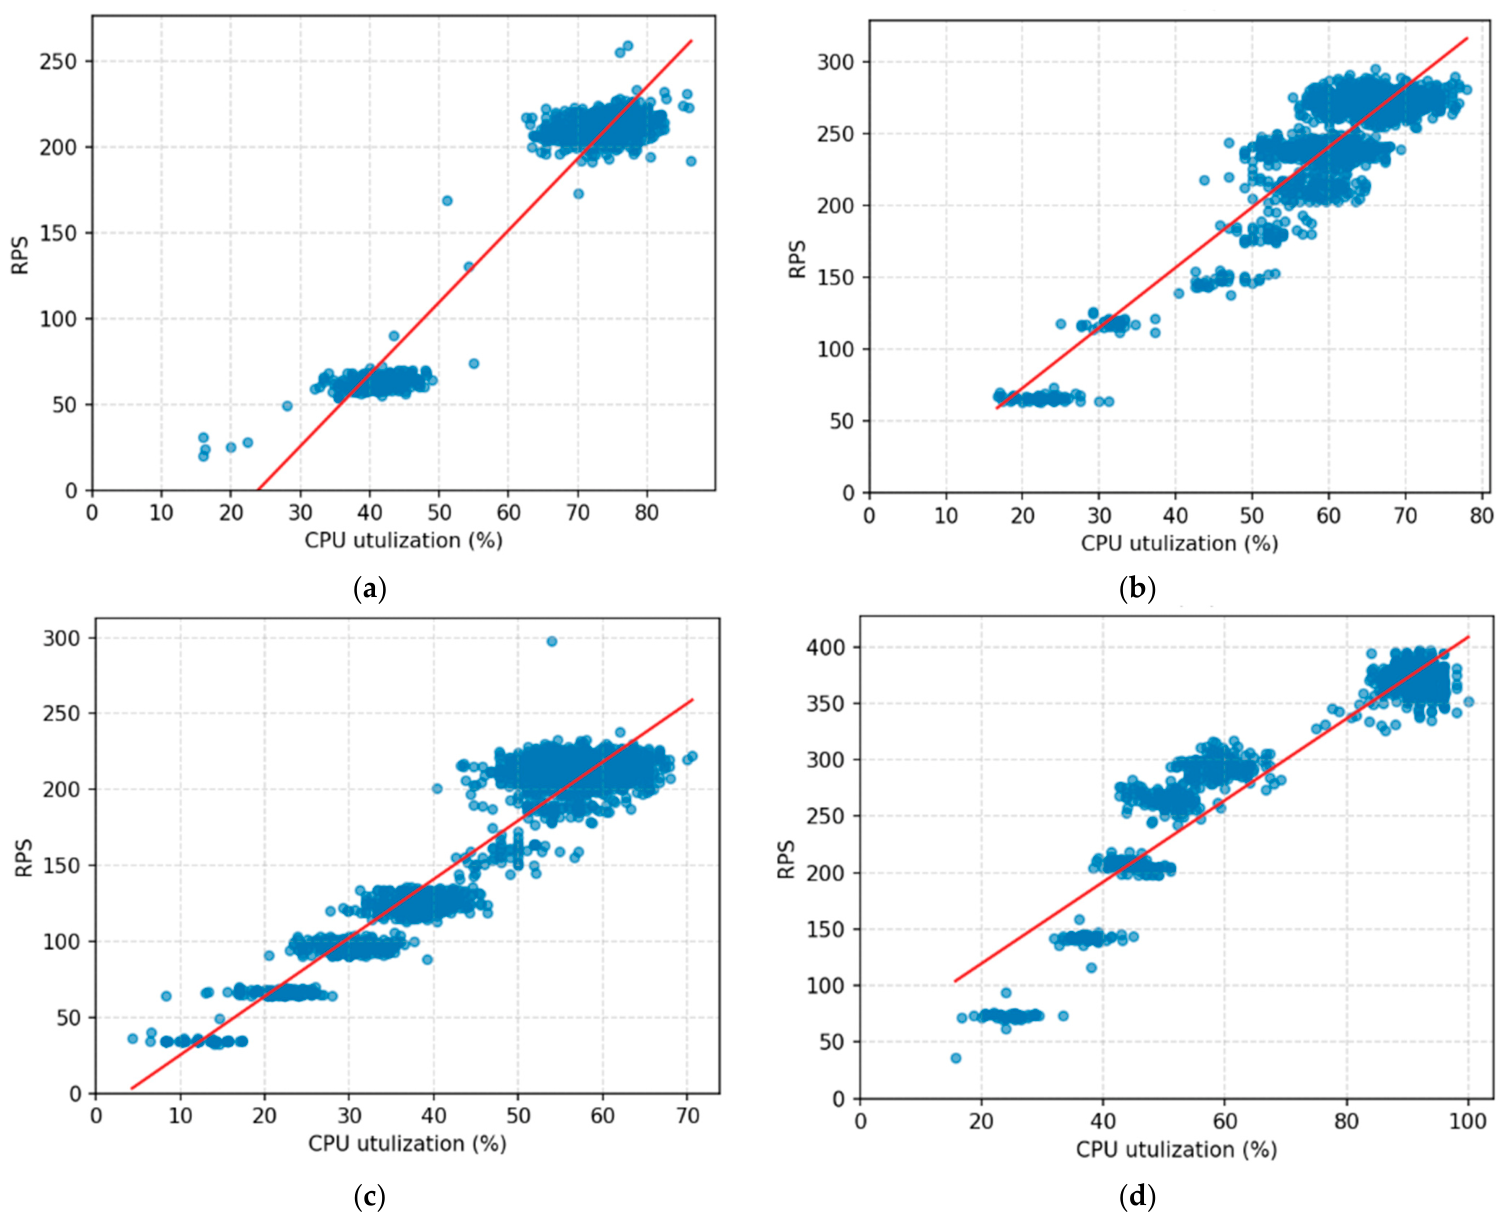
The inclusion of Spearman’s rank correlation provides robustness against non-linear variance observed near complete resource saturation. In Scenarios A and C, where a deterministic processing delay was simulated for video payload analysis, the Pearson correlation coefficients consistently exceeded 0.84. This establishes a strong linear relationship: as CPU resource allocation increases, network throughput scales proportionally (
Figure 5). To further validate a strong linear relationship under stable operational conditions, simple linear regression analyses were performed for the representative experiment in both video streaming environments. For Scenario A, experiment 2, the regression model evaluating CPU utilization as a function of RPS yielded a coefficient of determination equal to
, indicating that 92.4% of the CPU variance is explained by traffic throughput. Similarly, for Scenario C, experiment 2, where the monotonic correlation reached its highest value, the model yielded
confirming that 91.8% of the variance is directly attributable to throughput.
However, the Spearman rank correlation coefficients for these same iterations were lower. This divergence is an expected artifact of system saturation. When the receiver’s CPU reaches 100% utilization, the value plateaus, while the RPS continues to exhibit minor fluctuations due to packet queueing and network buffering. Spearman’s coefficient, which measures strict monotonicity, penalizes these minor RPS fluctuations at the CPU saturation limit, whereas Pearson effectively captures the overarching linear scaling trend.
5.1. Performance Analysis of Scenario A
In Scenario A, the system modeled a video-streaming environment requiring real-time processing. The components encompassed four entities responsible for transmitting high-bandwidth camera data to a single receiver. For each experimental iteration, the maximum allowable request handling time was set to 100 ms. To simulate the video processing load without introducing external resource-utilization noise from local AI frameworks, a deterministic, emulated real-time analysis delay of 20 ms was applied to every request on the recipient side via a fixed processing pause. This emulated baseline represents a realistic turnaround time for lightweight edge-side computer vision inference tasks. Given a standard camera feed operating at 30 frames per second, a 20-millisecond processing block ensures that the payload data are analyzed within that time window. The total data volume processed per experiment was approximately 22 GB.
As shown in
Table 3, most Pearson correlation coefficients approached 1.0, indicating a direct, linear relationship between processor utilization and generated video traffic. This dependency for the most efficient configuration is visually confirmed in
Figure 5a. Because the receiver performed consistent computational analysis on every frame, adding CPU cores directly increased the traffic reception rate. This confirms that edge nodes dedicated to real-time video ingestion are primarily CPU-bound.
5.2. Performance Analysis of Scenario B
Scenario B evaluated a heterogeneous edge environment where real-time computational analysis of received data was intentionally excluded. Traffic was generated by two transmitting sensors (359,400 JSON requests) and two cameras (36,000 requests), processing approximately 10 GB of data.
This scenario quantifies a structural shift in system bottlenecks. The Pearson coefficient dropped significantly (e.g., r = 0.31 for Experiment 2), falling well below the established 0.60 threshold. As indicated by the near-zero Spearman values, the monotonic relationship collapsed entirely. This disruption occurred because without the 20 ms processing block per request, the receiver’s CPU was burdened by the network I/O overhead required to handle nearly 400,000 asynchronous connections. Because direct thread-state profiling was not conducted, it is hypothesized that the CPU saturated due to frequent thread context switching rather than data processing. This finding suggests that when handling massive volumes of lightweight IoT telemetry without complex server-side analysis, network stack efficiency becomes the limiting factor, governing the throughput before raw CPU processing power correlates with the RPS rate.
5.3. Performance Analysis of Scenario C
The final scenario further expanded on the previous tests by exposing the infrastructure to a heavily video-intensive load (three concurrent cameras and one environmental sensor). Despite the asymmetrical influx of data, the correlation returned to strong levels (r > 0.90). The relationship between the dynamic CPU load and the corresponding RPS throughput for the receiver component during the scaled iterations is illustrated in
Figure 5b–d. While minor fluctuations in the RPS rate were observed, the overall trend remained linear. This return to a high correlation empirically validates the scalability of the proposed distributed architecture under heavily concurrent workloads. The generator can conduct high-fidelity vehicular traffic experiments on power-constrained devices, allowing dynamic adaptation purely by adjusting CPU limits without requiring proportional RAM upgrades.
As demonstrated across the evaluated scenarios, a measurable linear correlation exists between CPU load and the generated request rate, except in the mixed-traffic environment (Scenario B). The addition of vCPU cores directly enabled higher levels of traffic generation, reception, and real-time analysis, identifying the CPU as the primary computational resource for this class of edge systems. Conversely, the empirical results show that RAM is not a primary bottleneck, and additional memory allocation had no significant effect on system performance, as usage remained constant across data types and traffic volumes.
Ultimately, the successful execution of these tests utilizing minimal resource allocations demonstrates that the proposed distributed generator can conduct high-fidelity experiments on low-power devices, ensuring cost-efficiency in deployment. The distributed architecture provides inherent adaptability, allowing the dynamic adjustment of traffic-generating instances to meet specific experimental requirements without necessitating proportionally higher resources. This proves that the solution is both scalable and financially accessible for evaluating future telecommunication infrastructures.
6. Discussion
The empirical results from evaluating the distributed traffic-generation framework offer critical insights into the operational dynamics of SBA in 5G and edge-computing environments. While previous studies have extensively used standalone commercial traffic generators to measure raw network bandwidth, this research highlights the often-overlooked software–hardware dependencies in containerized microservices running on low-power devices. It must be acknowledged that Docker introduces inherent network-bridge and NAT processing overhead, which imposes an upper limit on throughput compared to bare-metal deployments.
6.1. Implications for Edge Infrastructure Provisioning
The findings discussed in
Section 5, specifically the consistent observation that pure video-streaming bottlenecks are CPU-bound rather than memory-bound, challenge conventional hardware provisioning strategies for edge nodes. In a broader context, telecommunication operators and IoT service providers can leverage these findings to optimize deployment costs. By prioritizing multi-core CPU architectures over high-capacity RAM modules, decentralized edge servers can be scaled more cost-effectively to support continuous video telemetry. Furthermore, the disruption of the CPU–RPS correlation observed in Scenario B underscores a critical architectural vulnerability: mixing sustained heavy payloads (video) with high-frequency, lightweight telemetry (Massive-IoT) on a single processing thread pool leads to premature system saturation due to context-switching overhead. This finding strongly supports the implementation of isolated processing pipelines or dedicated ingress gateways for different traffic classes in real-world 5G deployments.
6.2. Relevance to 5G Advanced and Future 6G Networks
The evolution from 5G to 5G Advanced and the foundational research into future 6G networks heavily emphasize the absolute convergence of communication and computing. In 5G, paradigms such as network slicing and multi-access edge computing require dynamic resource allocation to support enhanced mobile broadband and massive machine type communications simultaneously. The scenarios evaluated in this study, which combine dense video streams with massive sensor telemetry, directly reflect these diverse 5G use cases. Empirical evidence that unsegregated edge processing leads to context-switching bottlenecks supports the need for the strict isolation of network slices at the edge computing level, not solely at the transport layer.
Looking forward to 6G, network architectures are expected to become highly decentralized, relying on extreme edge intelligence, ubiquitous compute-as-a-service, and massive digital twins. In such hyper-localized environments, traditional, centralized traffic generators will be insufficient. The proposed distributed, containerized framework, which operates efficiently on low-power devices without overwhelming memory resources, perfectly aligns with 6G testing requirements. It enables the creation of dynamic, localized traffic patterns that accurately mimic the behavior of next-generation autonomous systems directly at the network’s extreme edge.
6.3. Heterogeneity, Operational Robustness, and Security Implications
While the controlled virtualized environment utilized in this study ensures baseline reproducibility, deploying the framework across real-world, heterogeneous cloud-edge infrastructures introduces distinct operational dynamics. On hardware platforms with diverse computational capacities, the application-layer processing footprint will vary. Resource-constrained edge platforms will experience heightened CPU bottlenecks during payload serialization, thereby affecting the peak request generation rate. This framework handles real-world network instabilities through a separate, asynchronous logging layer and clearly defined request retry loops. In the face of dynamic load changes or sudden traffic spikes, these architectural safeguards protect sending threads from network-induced deadlocks. At the same time, the receiving node uses automated error-handling procedures to reject loads that cannot be processed under extreme load conditions, prioritizing system stability over complete data acquisition.
Integrating secure communication protocols such as SSL/TLS or the future QUIC transport layers will inherently introduce multi-layered cryptographic overhead. This impact is divided into asymmetric cryptographic handshakes during connection establishment and symmetric packet-level encryption during transmission. In distributed edge environments, this cryptographic load will inevitably degrade application-layer throughput, requiring hardware acceleration or optimized cryptographic libraries to maintain high-density generation.
In the case of distributed attacks, the platform leverages microservice container isolation to prevent system-wide failures. While application-layer validation exception blocks effectively contain malformed payloads, the computational cost of handling high-frequency errors and of log context switching remains substantial. Consequently, deployment in non-cooperative production environments requires anchoring the framework behind edge-native security gateways or reverse proxies to filter malicious traffic before it reaches the generator core.
6.4. Future Research Directions
Building upon the structural analysis and operational considerations detailed above, future research and implementation efforts will focus on three primary domains:
Ecosystem Integration and Automation: Currently, the developed solution operates as a cluster of stand-alone applications. The immediate objective is to integrate these components into a cohesive, automated continuous Integration/continuous deployment ecosystem within the Wroclaw node of the PL-5G National Laboratory. This integration will minimize manual user intervention, enabling any newly deployed network service to be automatically stress-tested, and thereby significantly increasing the competitiveness of the laboratory’s infrastructure.
Protocol Expansion and Cryptographic Overhead: Guided by the theoretical security considerations, future empirical studies will specifically isolate and quantify the impact of SSL/TLS encryption on edge CPU performance. Additionally, expanding transport-layer support to include the QUIC (HTTP/3) protocol remains a high priority. Because QUIC operates over UDP and shifts congestion control and connection multiplexing into the user space, its implementation constitutes a major architectural shift. Future work will experimentally investigate how the host CPU manages this user-space packet-processing overhead, comparing it with the traditional TCP bottlenecks documented in this paper.
Heterogeneous Profiling and Commercial Validation: Due to the inherent heterogeneity of modern infrastructures, the analyzer’s operational footprint must be profiled across a broader spectrum of hardware, including embedded platforms and edge-oriented SoCs. Furthermore, elevating the framework to an industry-standard instrument requires benchmarking its measurement accuracy against dedicated, hardware-based traffic generators. Given that commercial hardware generators traditionally excel at stateless, lower-layer packet generation, benchmarking our application-layer stateful generator against them requires developing a novel cross-layer translation methodology. This substantial comparative evaluation constitutes a standalone research endeavor currently being planned as the next major phase of the project.